



Abstract
The years 2007 to March 2009 set in motion a severe economic global downturn. The pharmaceutical sector suffered less than other sectors. As global economies started to rise from the depths of the severe recession, some pharmaceutical firms outperformed their peers. This report analyzes the performance of the 22 top (by sales revenue) publicly traded drug firms over six metrics. The report concludes with an assessment of why certain pharmaceutical firms outperformed their peers over the time period: 2009–2014.
The wheels fell off the U.S. economy and the global economy at the end of 2007 depressing markets until the trough hit its low point in March 2009. 1 So, it is all the more appropriate and fitting that we assess pharmaceutical industry performance as it rises like a Phoenix from the ashes of 2009 through 2014. Three months into the bottoming out of the recession, the U.S. economy began lifting with the official end at March 2009. The pharmaceutical companies listed in this article grew slightly at a rate of less than 0.1%, with 7 of the 24 companies recorded in the year 2009 growing negatively, while 17 drug firms grew modestly (Annual Reports, 2009).
Any other year and 2014–2013 would have been considered a stellar performance. But coming after a spectacular 2013–2012 performance for the pharmaceutical industry, 2014–2013 takes a bit of a back seat. The pharmaceutical sector still stands out compared to other industry sectors as it continues to outpace the overall U.S. economy. 2 But one swallow does not a season make.
The pharmaceutical industry faces numerous challenges going forward. Regulation seems to be ever increasing with the recent Sunshine Law that zeroes in on promotional minutia. There is increasing concern on drug pricing where even genuine innovation (see Gilead’s Sovaldi for Hepatitis C) sparks controversy.
This research presents a perspective on pharmaceuticals sector performance: its focus is on shareholder value (Enterprise Value (EV)): you either create shareholder value or you destroy shareholder value. The goal is to rank the top 22 publicly traded pharmaceutical companies over six metrics: Sales Growth, Enterprise Value to Sales (EV/S), Gross Margin, Pre-tax Margin, Sales to Assets, and Return on Invested Capital (ROIC). AbbVie and Allergan in 2014–2013 were strong performers, but due to recent mergers, they do not have the five-year tenure for inclusion from 2009 to 2014.
Sales revenue is used as the starting point. Then, we look to EV/S which measures long-term prospects for a firm. Gross Margin measures pricing power. The Pre-tax Margin, or Margin Management, measures how well a firm manages its profit and loss statement. Sales to Assets, or Assets Management, measures how well a firm manages and uses its assets. A company is not in business to own assets, but to deploy assets to generate profitability. ROIC measures how well a company is managed, not just how its stock value can be driven by feeding frenzy due to activist stock trading that can send the price of stock soaring, yet have nothing to do with how a company is managed for profitability. 3
Methodology
This performance analysis relies on reported information for the 2014–2009 time period. The methodology is based on an approach that has appeared in a major pharmaceuticals trade journal for 14 years.4,5 The metrics are weighted reflecting their relative importance in assessing a firm’s performance. Shareholder Value and Return on Invested Capital are arguably the key metrics in evaluating a company's performance.6,9–12 Each of these metrics is weighted: 3.
The remaining metrics, each weighted 2, are Sales Growth, Gross Margin, Net Profit (Ebitda) to Sales, and Sales to Assets. The numbers in the tables are in billions of dollars.
The higher a company performs on each metric given where it places from the highest placing of 22 to the lowest placing, 1, determines the final rankings. For example, if a firm places 22 out of the 22 companies on a key metric like EV/S, it receives 66 points on that metric given its 22 ranking with a weight of 3 (22 rank × 3 = 66 points). If a firm comes in at a ranking of 6, toward the bottom, on the metric Sales Growth with a weight of 2, its total points would be 12 (6 ranking × 2 = 12 points). Then, each firm’s points per metric per placement are totaled to arrive at which firm receives the highest points to determine the top.
Finally, sources used in preparing this research include: Forbes, Fortune, Businessweek, The New York Times, The Wall Street Journal, FinanceYahoo.com, EvaluatePharma, FactSet, and Pharmaceutical Annual Reports.
Sales Growth
Sales Growth CAGR five-year average growth

CAGR: Compound Annual Growth Rate.
Gilead had phenomenal growth, particularly over the last two years triggered by its very high priced drug for Hepatitis C, Sovaldi. Valeant experienced growth far above average but its growth was due to mergers and acquisitions.
Five companies, AstraZeneca, Bristol-Myers Squibb, GlaxoSmithKline, Lilly, and Pfizer experienced negative growth. The reasons for these companies’ negative growth rates can be found in their respective Annual Reports. AstraZeneca continues to be pressed by loss of patent exclusivity on Crestor with little in the way of new drugs to offset the patent cliff. Bristol-Myers Squibb has a somewhat more positive spin: it is divesting from depression and diabetes moving toward more of a pure play biologic. So while its sales are slipping, higher prices for new immunology cancer drugs lift profits. GSK and Lilly also are experiencing downturns in sales due to patent expirations of major branded drugs with little to offset their respective patent cliffs. Pfizer is experiencing a downturn in overall sales but its new branded segment is growing but not at a rate yet to offset the downturn in its larger established generic drugs franchise.
Enterprise Value to Sales
Enterprise Value/Sales weight = 3
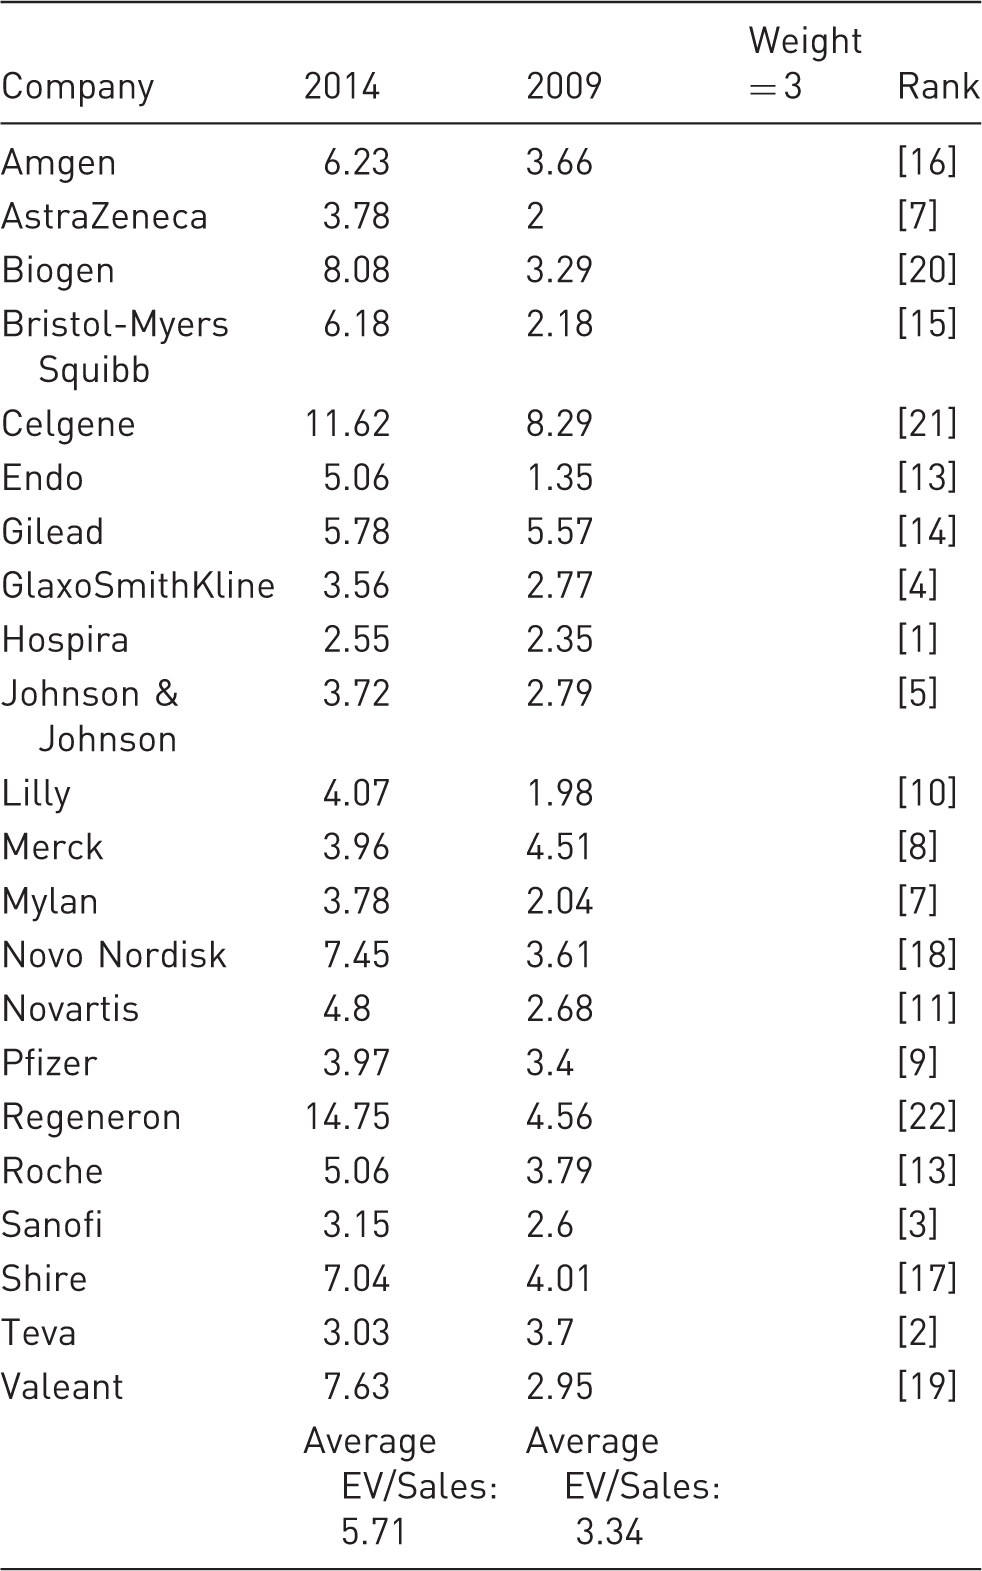
EV is directly related to shareholder value. Again, you either create shareholder value or you destroy shareholder value. EV is stock market value (Market Cap), plus total debt, net of cash, and liquid investments such as accounts receivable, cash on hand, prepaid short-term investments, and inventory. 6 As noted, EV allows for fairer comparisons among companies with very different capital structures. 6 One firm might have more common stock in its capital structure with relatively little debt while another firm might have the reverse. The higher this value is the more valuable the firm is. And the higher the EV/S ratio, the more attractive is that company’s future in terms of Sales Growth and profit growth.
The feeding frenzy stemming from mergers and acquisitions is a significant basis for shareholder value increases for Valeant, Mylan, Endo, Shire, Hospira, and AstraZeneca. Some of the acquisitions seem a bit overpriced with market capitalization to sales ratios of Valeant’s 10 times ratio for its recent Salix purchase. 16 The siren song of reducing costs is often stated as a goal of consolidation but Doug Sherlock, a healthcare analyst, estimates that only 15% to 20% of Sales, General, and Administrative (SGA) expenses is subject to economies of scale in mergers. 17
Again, the EV/S ratio reflects a market assessment of future growth and profitability. The higher the ratio suggests that a firm’s best days are ahead; the lower the ratio, the firm has hit a mature phase where growth and/or profitability may have peaked.
Gross Margin
Gross Margin weight = 2

CAGR: Compound Annual Growth Rate.
Warren Buffet characterizes pricing power as “the moat surrounding and protecting your castle.” The ability to raise price and keep prices high is seen among the “Horsemen of the Apothecary”: Celgene (91.57%); Gilead (84.35%); Biogen (83.40%); Novo Nordisk (83.00%).18–20 A less lofty example of pricing power is Valeant’s recent purchase of two generic drugs used by hospitals and its ability to raise prices higher than costs by a substantial margin.
Price was the dominant trend driver for 2014–2013 with double digit average wholesale price trend for traditional brand and specialty drug manufacturers; average wholesale price for generics was negative as recently as 2010, but has been rising over the last five years with significant price hikes for some generics. 21 There appear to be two possible reasons for these price increases. One is industry consolidation: where fewer manufacturers compete, prices tend to go up. 22 The second has to do with fewer blockbuster drugs going off patent resulting in that much less of an impact from lower-priced generic drugs. 21
The Profit Margin: Pre-tax Profit (Ebitda) to Sales revenue
Pre-tax Margin (profit/sales) weight = 2

CAGR: Compound Annual Growth Rate.
Margin Management: Profit Margin measures how well the company deals with sales, price, cost of goods sold for ingredients used in manufacturing its products, operating expenses, and discounts, rebates, and royalties, if any. If you cannot grow revenues, you need to improve your ability to control operating expenses. 23
Even for a high flyer like Google, becoming more disciplined in operating the business is affecting its valuation. Google is the second most valuable stock behind Apple. Like our Big 5 biotechs, Google has never done a stock buyback nor paid dividends, according to the Wall Street Journal’s Alistair Barr. 24 But that is changing as even Gilead does a stock buyback for the first time over the period 2014–2015. 24 Recall the days prior to the 2007–2009 recession when pure biologics like Amgen, Biogen, and pre-Roche-acquired Genentech when biologics never needed to pay dividends or buy back shares; investors simply anticipated outsized increases in the value of a biologic’s stock.
Sales to Assets (asset management)
Sales to Assets weight = 2

CAGR: Compound Annual Growth Rate.
Return on Invested Capital
ROIC weight = 3
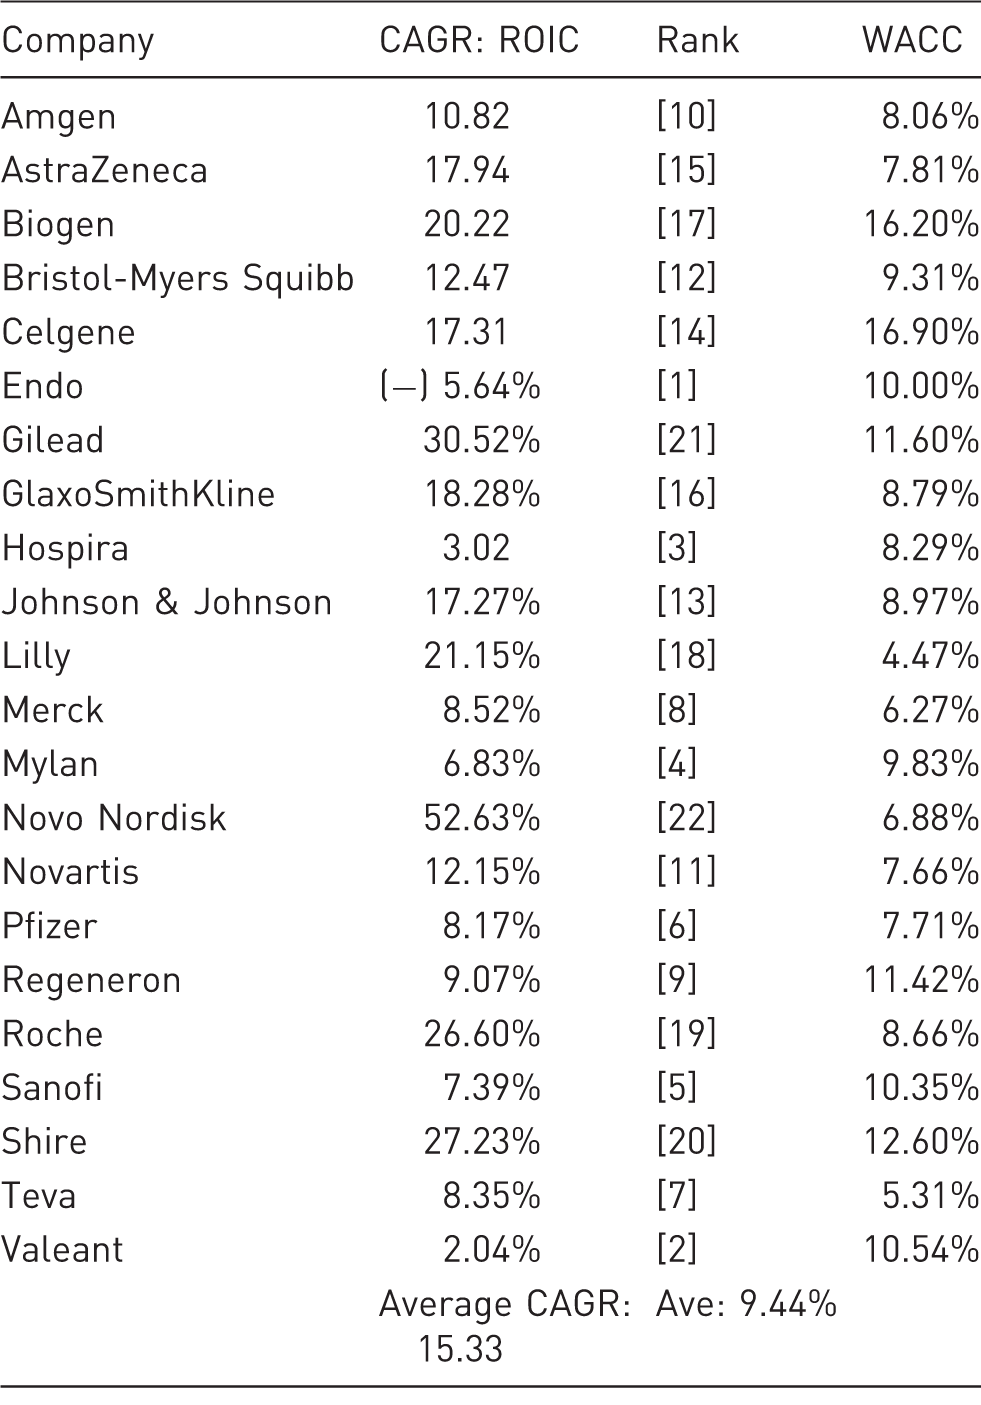
WACC: weighted average cost of capita; CAGR: Compound Annual Growth Rate; ROIC: Return on Invested Capital.
Compare ROIC which measures performance with financial machinations such as stock buybacks and dividend gifts. Such maneuvers lift earnings per share, which is then impacted by higher price to earnings multiples, rewarding shareholders without necessarily investing in the business. 25
A provocative question: When you look at the fair to average grouping of “big” pharmas, performance on key metrics is lackluster. A recent Businessweek column raises the prospect that a company may have become too big to compete effectively, such as Procter & Gamble. Analogously, you look at Pfizer, Merck, JnJ, GSK, and Novartis with huge sales revenues but struggling to achieve improved profitability and shareholder value growth; the point is that many of their product lines are just average in performance, yet they require lots of management and marketing investment. For example, Johnson & Johnson had annual sales of $77.3 billion in 2014. Its Profit Margin was 27.66%, almost twice as high as the average Profit Margin for that year of our 22 firms. But that begs the question that a sizable chunk of Johnson & Johnson’s business is coming in at lower than 27.66%. What if, say, half of the underperforming strategic business units of Johnson & Johnson could raise profitability by just 1% to 28.6%? That would result in almost $1 billion of Pre-tax Profit for Johnson & Johnson. And we do see glimpses of talk of breaking up some of the big pharmas like Johnson & Johnson, Pfizer, and others, or shifting to pursue focus instead of scale. 26
Sales, General and Administrative spend to sales revenue
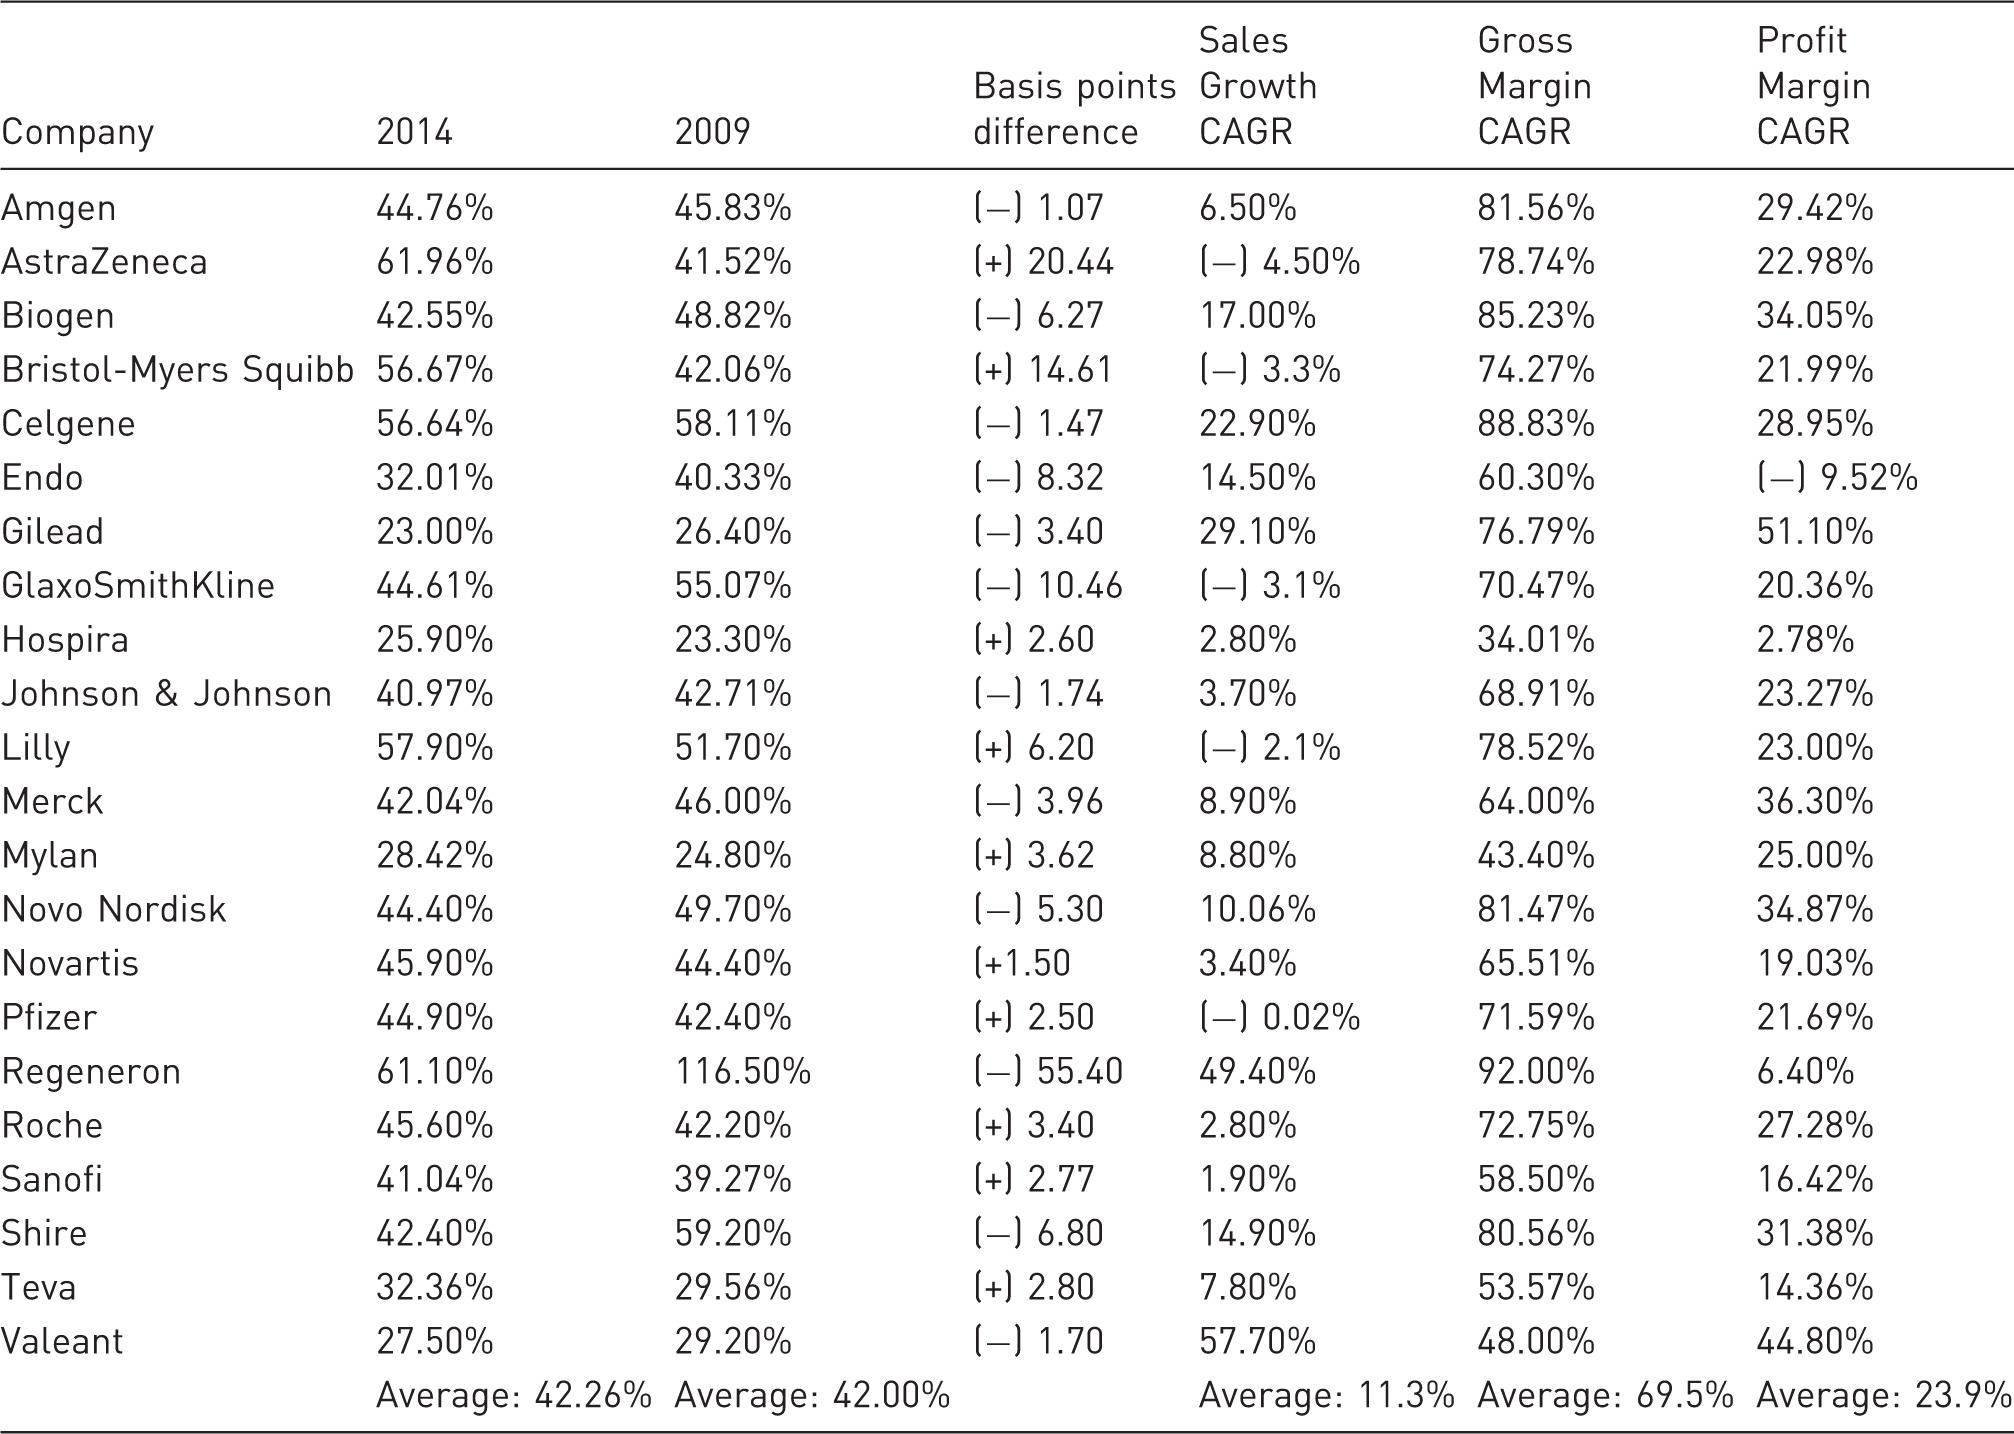
CAGR: Compound Annual Growth Rate.
Table 6 displays data on ROIC and Weighted Average Cost of Capital (WACC). A company truly creates shareholder value only when the true cost of capital to all the capital (common stock and debt) is employed. 27 The cost of debt is the interest cost. The true cost of common stock is what your shareholders could be getting in stock price appreciation and dividends if they had invested in a portfolio of companies about as risky as the company, or opportunity cost. In Table 6, the average ROIC is 15.33% compared to average WACC of 9.44%. Hence, the pharmaceutical industry is exhibiting impressive rates of return on its capital.
The key to creating shareholder value is to consistently invest in projects that earn more than their cost of capital. As former Coca Cola CEO, Robert Goizueta put it: “You only get richer if you invest money at higher returns than the cost of that money to you.” 27 In Table 6, Valeant is an example of a company that had Returns on Invested Capital that were below its cost of capital: ROIC of 2.04% vs. WACC of 10.54%. Yet, its stock price rose. Valeant’s business model has been in the news lately. Along with Endo and Mylan, they have expanded rapidly through acquisitions funded by cheap debt along with lower tax rates by relocating outside the United States. In Valeant’s case, it has been able to substantially raise prices on generic drugs further enhancing stock price gains. Future performance for this model may be less positive due to less ability to find high-quality assets at a reasonable price and future interest rate increases.
Table 6 shows that Novo Nordisk has created the most shareholder value over the five-year period. Additional shareholder value wealth creators are AstraZeneca, Gilead, GlaxoSmithKline, Johnson & Johnson, Eli Lilly, Novartis, Roche, and Shire.
Table 7 brings in a metric that is not weighted in this analysis: SGA Spend to Sales. SGA/Sales is an important metric because it measures overhead. In a given year or two, SGA can grow faster than sales because the company may be investing in a new product requiring promotional investment or training a sales force. But over time, three to five years, SGA should not be growing faster than sales volume. The negative sign in this table is a positive. AstraZeneca had the highest jump in SGA spend, measured in basis points, coupled with negative Compound Annual Growth. Bristol-Myers Squibb was close behind in high SGA growth but low Compound Annual Growth Rate (CAGR) Sales Growth.
Biogen, Novo Nordisk, and Shire set the pace for positive direction by reducing SGA spend while increasing CAGR Sales Growth over the five-year period.
The 22 firms in this analysis are not skimping on investment. But the majority of them grow sales revenue faster than adding employees and spending on promotion; they simply get more profit from the dollars they invest than their competitors. 19 Table 7 shows that half the companies are struggling to contain SGA. AstraZeneca’s SGA jumped much faster than sales increased due to new products; Sanofi has created special teams to coordinate key launches. That may help those new drugs get the attention they need but risks duplicating sales forces and operating costs. 28
Another problem for the pharmaceutical industry related to increasing SGA is decreasing productivity. The pharmaceutical research firm, IMS, estimates that the world’s largest drug companies will need to reduce their operating costs each year through 2017 to maintain current Profit Margins and levels of research and development by $36 billion. 29 According to the consulting firm, McKinsey, cost and productivity pressures have continued to mount. The average growth in employment for the pharmaceutical industry over the time period, 1990–2007, was 3%; productivity improvement rates for the pharmaceutical industry over that period was minus 0.8%. 30
And the winner is …
And the Winner is …
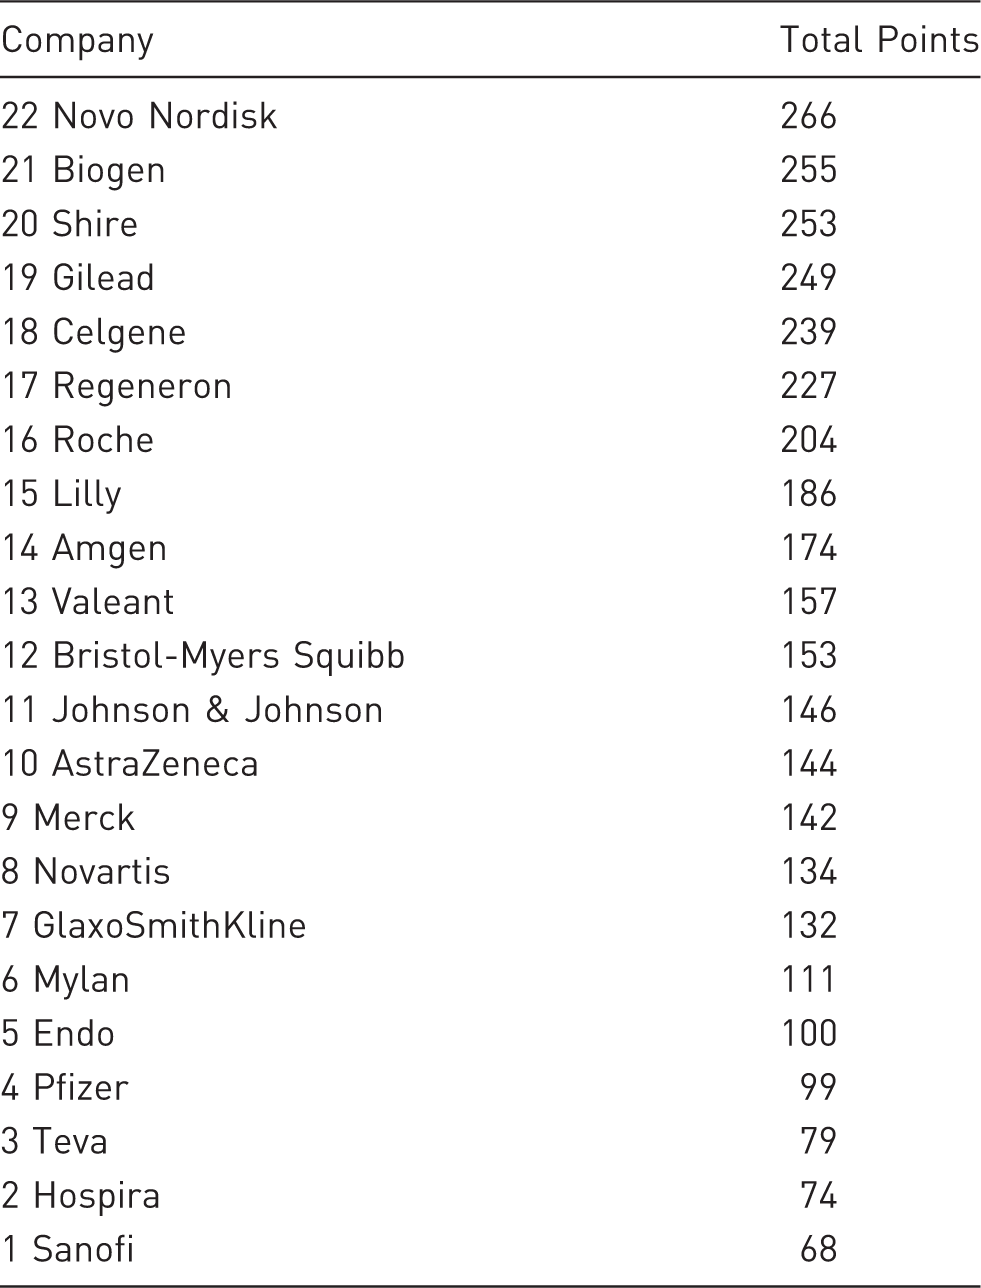
“The 5 Horsemen of the Apothecary”: Novo Nordisk, Biogen, Shire, Gilead, and Celgene.
For Gilead, the past five years are going to be a tough act to follow. Sales Growth of over 100% due to Sovaldi did not result in a corresponding growth in shareholder value. Gilead substantially increased its Gross Margin due to the high pricing of Sovaldi.
The 5 Horsemen are Masters of Their Pricing Domain. Warren Buffet has said that the ability to price high is the single most important factor in evaluating a business 18.
Biogen, Celgene, and Gilead placed in the top 5 of the Fortune 500 companies in percentage annual growth in earnings per share over the last 10 years. Ditto for Return to Shareholders over the last 10 years.
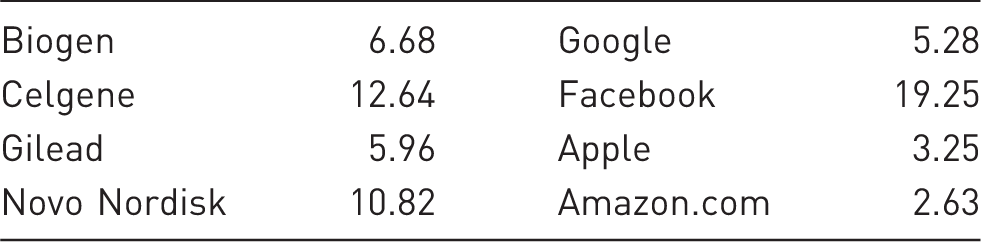
Source: Barr. 24 Fast company, indeed.
Significance of findings
Scale vs. Focus per the provocative issue raised in BusinessWeek, regarding Procter & Gamble:
The top achieving biotechs, along with Shire, AstraZeneca, BMS, and Regeneron are focused on new ground-breaking pathways and narrow markets such as orphan diseases and specialty pharmaceuticals. Other companies, especially those in the generic and branded generic drug space, are pursuing scale buildup. With the recent merger frenzy among the top five health insurers/managed care organizations dwindling down to three, Teva and Mylan are bulking up to maintain bargaining parity. The consolidation continues apace as the mainstream pharmaceutical companies continue to expand via acquiring smaller biotech and orphan disease companies.
Mergers and acquisitions
With interest rates extremely low and shareholder activism driving the strong returns, Valeant, and Endo with its recent purchase of Par Pharmaceuticals, lead the Tyco Roll-Up practitioners. These companies have expanded rapidly through acquisitions funded by cheap debt; and in the case of Valeant, that company has been able to substantially increase prices on generic drugs.
Cutting back
The major pharmaceutical firms are pruning their assets. Novartis and GSK swapped franchises in the past year. Pfizer is getting smaller while picking up an interesting acquisition in Hospira, a contender in the coming biosimilar arena.
Operational excellence
Merck appears to be working toward more discipline in controlling its SGA expenses. If sales are stagnant, it makes sense to work backwards on the profit and loss statement and the balance sheet to improve profit. Johnson & Johnson has also improved significantly on key metrics of Return on Assets and ROIC. Although Valeant’s SGA expenses increased this year, SGA spend still increased at a slower pace than Valeant’s sales having a substantial impact on higher Gross Margin.
Masters of their pricing domain
The ability to price high, maintain that level of pricing and increase price substantially higher than costs cannot be gainsaid. Novo Nordisk, Celgene, Gilead, and Biogen continue to set the pace.
There are many ways to pursue the goal of increased shareholder value. Prudent use of owners’ investment measured by EV/S and ROIC stand out in our assessment of the performance of the top 22 publicly traded pharmaceutical firms for the time period 2009 to 2014.
How the pharmaceutical sector has changed in those five years: Watson, Forest Labs, and Hospira have been absorbed in acquisitions.
This article looks beyond narrow metrics such as price to earnings and earnings per share multiples to incorporate metrics such as ROIC and EV/S. 31 Recent negative press around Turing, Valeant Pharmaceuticals, and Mylan (EpiPen) notwithstanding, the better managed pharmaceutical companies and biotechs are increasing dividend payouts and stock buybacks to enhance their value propositions to shareholders. 31
If there is one discouraging word at the end of this period, it is the dark side of pharmaceutical pricing. The important metric, Gross Margin, tells the discordant story: declining prices; and when you add rebates and discounts, the numbers drop even lower. 31 This suggests that drug pricing going forward needs to transition from “pricing for value” to some other model.
Footnotes
Declaration of conflicting interests
The author(s) declared no potential conflicts of interest with respect to the research, authorship, and/or publication of this article.
Funding
The author(s) received no financial support for the research, authorship, and/or publication of this article.