
Abstract
The purpose of this study is to investigate current attitudes and opinions about chiropractors’ advertising and to compare them to the attitudes expressed eight years ago. This study was designed to determine (a) consumers’ attitudes toward advertising by chiropractors, (b) which media consumers feel are appropriate for chiropractors’ advertising, (c) whether consumers are seeing chiropractors’ advertising, and (d) if so, through which media. It replicates a survey conducted in 2008 and uses a very similar questionnaire and the same general population to compare responses longitudinally. Both the 2008 and 2016 respondents agreed that the public would be provided useful information through advertising by chiropractors, and both groups also believed it is proper for chiropractors to advertise. The study seems to confirm the belief of many marketing professionals that advertising and marketing clearly have a place in the future of health-care services.
Keywords
Introduction
“To advertise or not to advertise?” That is the question facing most professionals today. The notion of using advertising to promote a professional practice is still new. Furthermore, most professional associations (American Bar Association [ABA], American Medical Association [AMA], etc.) traditionally explicitly prohibited licensed members from engaging in advertising their services to the public.1–3 Professionals who offer services today face many of the traditional problems encountered by business firms: a changing economic environment, social and cultural forces, political and legal factors, and increased competition. 4 Many professionals find themselves ill-equipped to handle the dynamics of a changing environment, especially without some form of marketing plan. Many health-care and legal professionals now use marketing consulting firms or have their own internal marketing/advertising committees.5,6
Professional advertising could trigger the development of comprehensive marketing programs by many professionals and also provide numerous consulting and employment opportunities for people with marketing expertise, including academicians as well as advertising and public relations firms.7,8
Purpose of the study
During the past several years, chiropractors have become highly competitive in marketing services to the public, and it has become common to see chiropractors advertising their services via a number of media. The purpose of this study is to investigate the current attitudes and opinions about chiropractic advertising and to compare them to the attitudes expressed eight years ago. In this study, the researchers used a survey instrument previously developed by Miller and Waller 9 and Hite 10 to determine (a) consumers’ attitudes toward advertising by chiropractors, (b) which media consumers feel are appropriate for chiropractors’ advertising, (c) whether consumers are aware of chiropractors’ advertising, and (d) if so, through which media. The study investigates possible changes in attitudes of consumers toward chiropractors’ advertising over an eight-year period. It replicates a survey conducted in 2008 and uses a very similar questionnaire and the same general population to compare responses longitudinally. The intent of this study was to discover information that would be useful to chiropractors in planning marketing strategies and improving the quality of their advertising. The results of this study may be useful to chiropractors and other professional service providers who want to create more effective promotional strategies and could also provide insights for those with promotional expertise who advise clients in these fields including academicians as well as advertising and public relations firms.
Background and general research questions
There is widespread belief in this country that the hyperinflation that has characterized the field of healthcare in recent years can be attributed largely to a lack of competition among medical practitioners.11–13 During the past 30 years, the practices of health-care professionals have undergone many changes. Consumers are becoming more involved in their own healthcare, seeking the type of drugs or pharmaceutical products that best meet their needs, and are willing to take more responsibility for obtaining adequate information about treatment than in the past.14–16 Another change is the frequent use of advertising, which can be attributed in part to sweeping changes in judicial interpretation of (1) commercial-free speech17,18 and (2) restraint of trade by professional organizations. 19
A Gallup Panel web and mail study completed by 7645 national adults—7023 from web and 622 from mail—aged 18 and older, conducted on 8 February–11 March 2016 reported that over half of adults in the US (55%) say they are likely to see a chiropractor if they had significant neck or back pain. In this study, the main reasons given by adults who say they are unlikely to see a chiropractor if they had neck or back pain are that they have another health-care provider they go to (33%), they do not trust chiropractors (29%), and they do not think chiropractic care is safe (23%). The study provided an estimate of 35.5 million US adults having seen a chiropractor over the most recent 12 months. 20 An industry profile of chiropractors, dated 22 May 2017 and compiled by First Research, lists several marketing techniques used by chiropractors, including doctor and patient referrals, ads in local newspapers, the Yellow Pages, direct mailing, local telemarketing, web sites, YouTube, Facebook, and other social media channels. The profile also states that one of the business challenges for the chiropractic industry is shedding perceptions of “quackery” and high rates of fraud, and that the Internet plays an important role in patient education, particularly in combating dismissive articles and research on chiropractors produced by some mainstream medical professionals. 21 An article about using Facebook Ads to attract members of the millennial generation suggests that chiropractors use highly targeted posts to gain interest and then provide information about their qualifications and services offered. 22
While the attitude of health-care professionals toward advertising is mixed and the attitude of most state regulators has generally been negative, the attitude of consumers has historically been fairly positive.23–25 Research has shown attitudes toward advertising by chiropractors and health-care professionals have become significantly more positive in recent years. Such advertising is therefore expected to increase as many chiropractors and health-care providers attempt to prevent erosion of market share and seek new markets for growth within their practices. 26 A study conducted by Leventhal concluded that opposition to health-care professional advertising appears to center on ethical issues, whereas arguments favoring advertising focus on information needs, economic and competitive issues, and the right to advertise. 27
Several academic studies have focused on the main concern of practicing chiropractors and health-care professionals: whether advertising attracts patients.15,28,29 The answer has been a definite “yes.” These studies show that most chiropractors and health-care professionals who advertise will likely see an increase in the number of middle- to lower-income patients. Chiropractors and other health-care providers who advertise discover quickly that advertising is usually very expensive, but works if done properly and ethically. One study found the return on dollars invested by professionals in advertising was four to six times the cost.30,31
The previous discussion shows that professional advertising usually works, produces an increase in patient flow, yields a good return on chiropractor advertising dollars, and is found to be protected by the First Amendment. It indicates that historically consumers have not always had a positive image of chiropractors who advertise but believe chiropractic advertisements provide useful information.32,33 It suggests after almost two decades of changing practices in the field of professional advertising, it is time to make a new assessment of consumer attitudes toward chiropractors who advertise. This assessment can best be accomplished by taking a multi-year longitudinal view. The differences in consumers’ attitudes among several independent studies conducted in the past could be based in part on the type of questions asked and the characteristics of different samples. A longitudinal study can provide increased evidence that observed differences between groups are due to actual changes of attitudes within the general population measured.
Procedure
Data collection
Much of the initial planning of this study was based on Hite’s study at the University of Arkansas. 10 The Hite study indicated that advertising and marketing can be advantageous to health-care professionals and their practices. Most health-care professionals will find that consumers are aware of their advertising and appreciate the information communicated to them through advertisements. Hite suggested that health-care professionals who research the significant attitudes of their target markets are likely to enjoy a competitive advantage over the competition. Acknowledgement is given to the research instruments of Hite 10 and Miller and Waller, 9 which served as bases for the questionnaire in the current study. Also, acknowledgment is given to the organization and writing style of Hite’s study which served as a model for this paper.
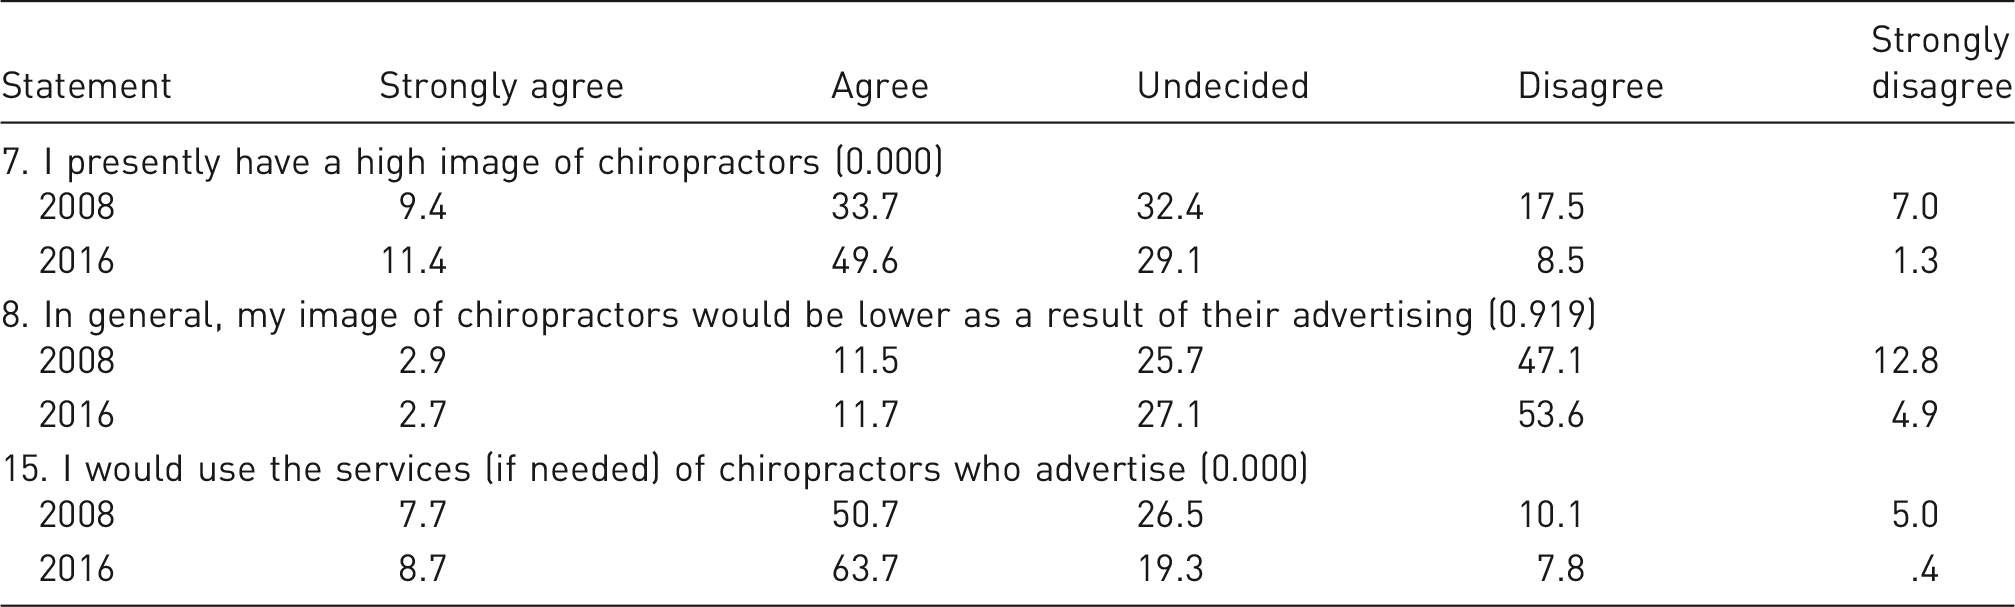
Frequency percentages of consumer responses to attitude statements (in percent) about the image of chiropractic advertising
In 2008, the researchers asked the Marketing System Group (a research company in Fort Washington, Pennsylvania) to draw a random sample of 4000 consumers from the 10 metropolitan statistical areas (MSAs) in Tennessee: Chattanooga, Clarksville, Cleveland, Jackson, Johnson City, Kingsport-Bristol, Knoxville, Memphis, Morristown, and Nashville. Appropriate numbers from each MSA were drawn according to the ratio of each MSA’s population to the total population of all 10 urban areas. The research instrument was mailed to these consumers, and 387 usable questionnaires were received and used in this study, representing a 9.675% response rate. This sample of 387 respondents represents a subset of the United States, specifically a subset of the residents of the state of Tennessee. The questionnaire data for the 2016 sample included 446 usable questionnaires and was gathered as a project for an advertising class at a private university in Middle Tennessee. This sample of 446 respondents also represents a subset of the United States, specifically a subset of the residents of the state of Tennessee.
Statistical tests and findings
The data obtained from the 387 respondents in 2008 and the 446 respondents in 2016 via the research instrument were analyzed by tabulating the frequency percentages for each item on the questionnaire. Cross-tabulations were performed between the two sets of respondents and the 15 attitudinal statements. Chi-square tests were performed to detect any significant differences between the cross-tabulations. In general, the chi-square analysis is employed when researchers want to determine whether there is an association between two or more populations or variables on some characteristics being studied. The significance level is the point at which a relationship is significant. This value lies between 0.0 and 1.0. Values closer to zero have greater significance. A 0.05 level of significance is commonly used by social scientists doing business research. 34 The level of significance for all statistical tests was set at 0.05.
In the initial analysis, for each of the 15 attitudinal statements, the null hypothesis assumed that the proportion of 2008 population matched the proportion of the 2016 population at all five levels of the Likert-type scale. These initial results showed only one statement, “11. When chiropractors advertise, prices are lowered due to more competition,” where the null hypothesis was accepted with a p-value of 0.081. Expecting equality at all five levels of the Likert-type scale may have been expecting too much.
The fundamental problem is to determine if the sentiment regarding the 15 attitudinal statements changed between 2008 and 2016 or remained essentially the same. Testing fewer groups might lead to more agreement. The strongly agree and agree levels were combined to create a general agreement level. Likewise, the strongly disagree and disagree levels were combined to create a general disagreement level. Two sets of chi-square tests were subsequently conducted with the new general levels, one that used the undecided level (a test comparing three levels) and another that excluded the undecided level (a test comparing two levels). Before claiming that the sentiment had changed between 2008 and 2016, all three chi-square tests had to yield p-values of 0.05 or less. If any of the three chi-square tests yielded a p-value of more than 0.05, there was insufficient evidence that the attitudes regarding that statement had changed over the eight-year period.
Tables 1 through 5 illustrate the distribution of consumer responses to the 15 statements in the questionnaire about chiropractors with respect to advertising for the 2008 and 2016 samples for all five levels of the Likert-type scale. At the end of each statement, the largest p-value among the three sets of chi-square tests is given.
Findings
The data obtained from the 2008 and 2016 respondents were initially analyzed by tabulating the frequency percentage for each item on the questionnaire.
Consumer attitudes toward advertising of chiropractors’ services
The percentages given in Table 1 illustrate the distribution of consumer responses to the 15 statements in the questionnaire about chiropractors with respect to advertising. Regarding consumers’ image of chiropractors (statement 7), there were significant attitude differences between the consumers in 2008 and 2016. Between 2008 and 2016 the percentage of respondents indicating a somewhat favorable image of chiropractors grew from 43.1% to 61.0%. However, attitude differences were not found between the 2008 and 2016 consumers with respect to statement 8 that their opinion of chiropractors would be lowered as a result of advertising. Almost 60% of the 2008 consumers and almost 59% of the 2016 consumers generally disagreed that their image of chiropractors would be lower as a result of advertising. Finally, when asked in statement 15 whether they would use the services of chiropractors who advertise, 58.4% of the 2008 respondents expressed general agreement, while only 15.1% said they would not use these services. The percentage of respondents who were undecided was 26.5. The 2016 respondents expressed a higher level of general agreement (72.4%), while only 8.3% said they would not use these services. The percentage of the 2016 respondents who were undecided decreased to 19.3. These results indicate that consumers’ image of chiropractors generally does not suffer as a result of advertising. The marketing implication of these results is that it is important to use a well-conceived, professionally designed advertising program to help gain approval of a majority of clients.
Information function of advertising chiropractors’ services
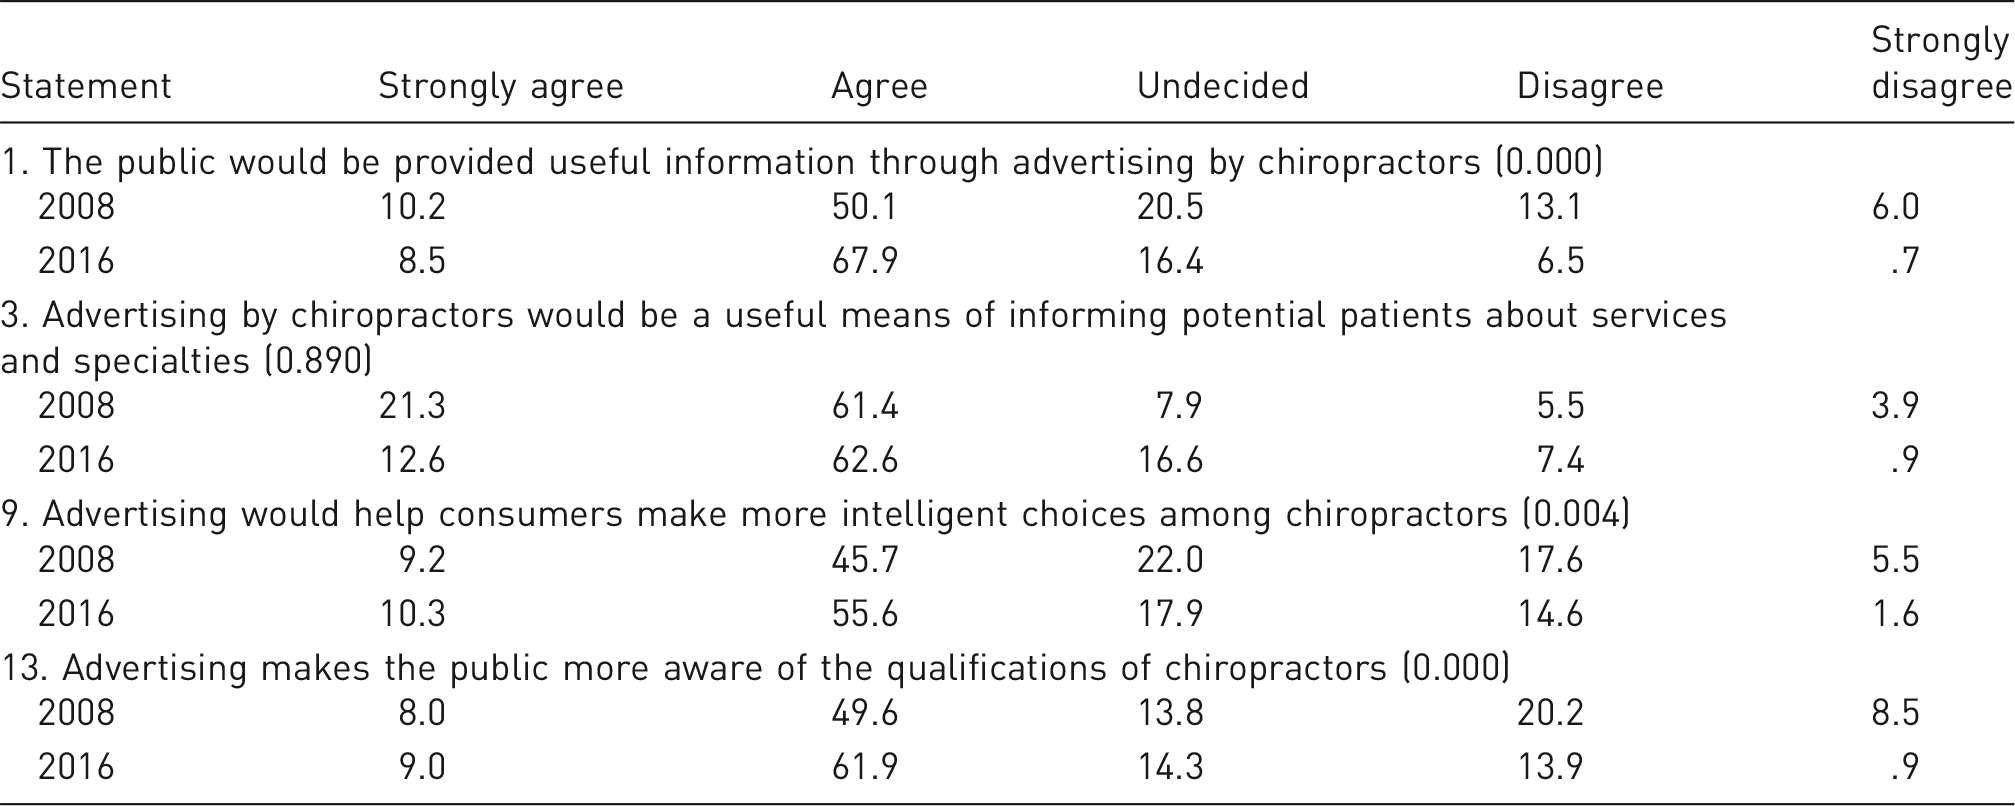
Frequency percentages of consumer responses to attitude statements (in percent) about the information aspect of chiropractic advertising
Importance of price in advertising chiropractors’ services
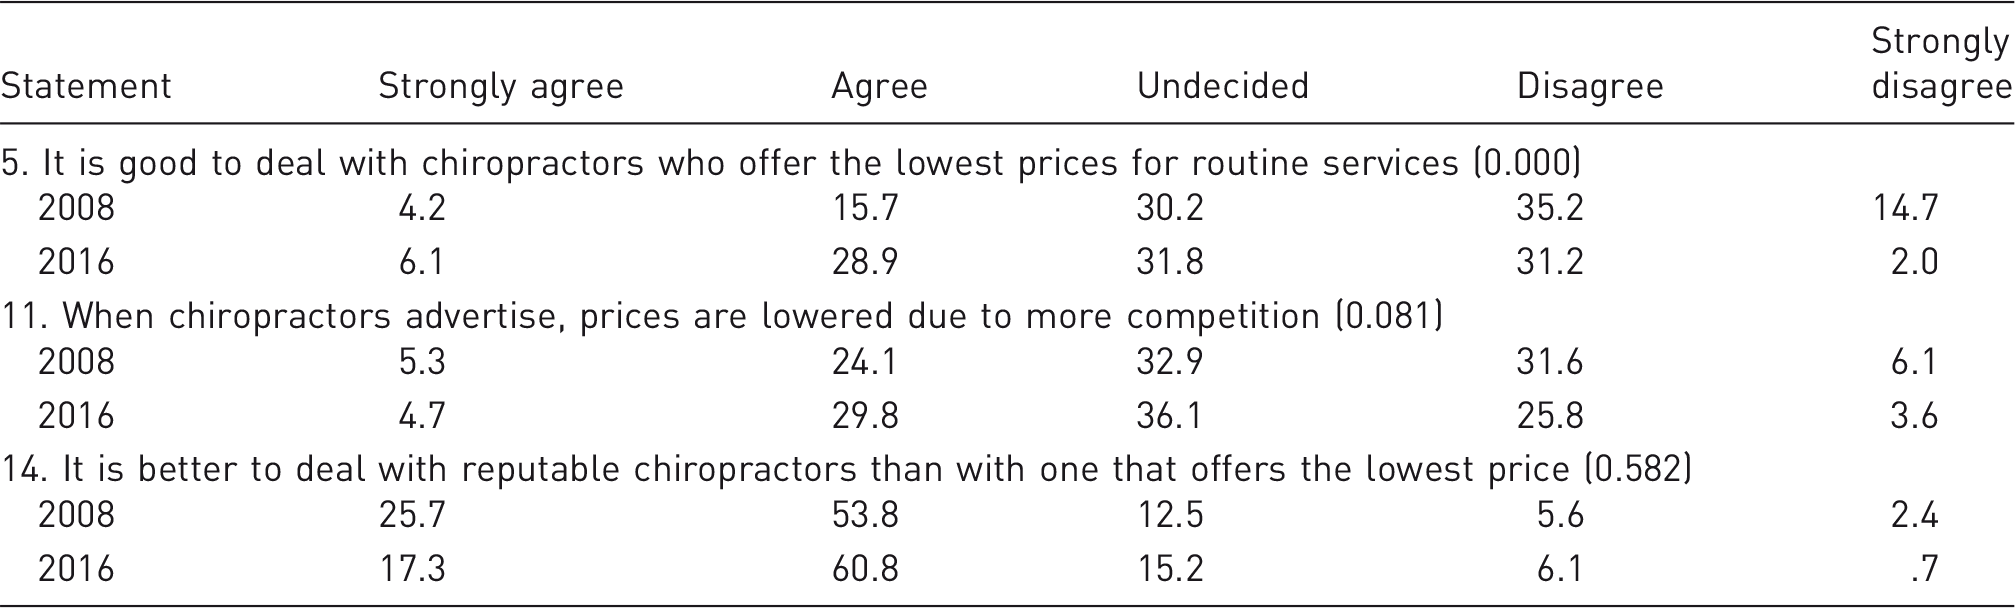
Frequency percentages of consumer responses to attitude statements (in percent) about the importance of price in advertising chiropractic services
Deception in advertising chiropractors’ services
Frequency percentages of consumer responses to attitude statements (in percent) about deception in chiropractic advertising

The future of chiropractors’ advertising
Frequency percentages of consumer responses to attitude statements (in percent) about future aspects of chiropractic advertising

Appropriateness of advertising media for chiropractors who advertise
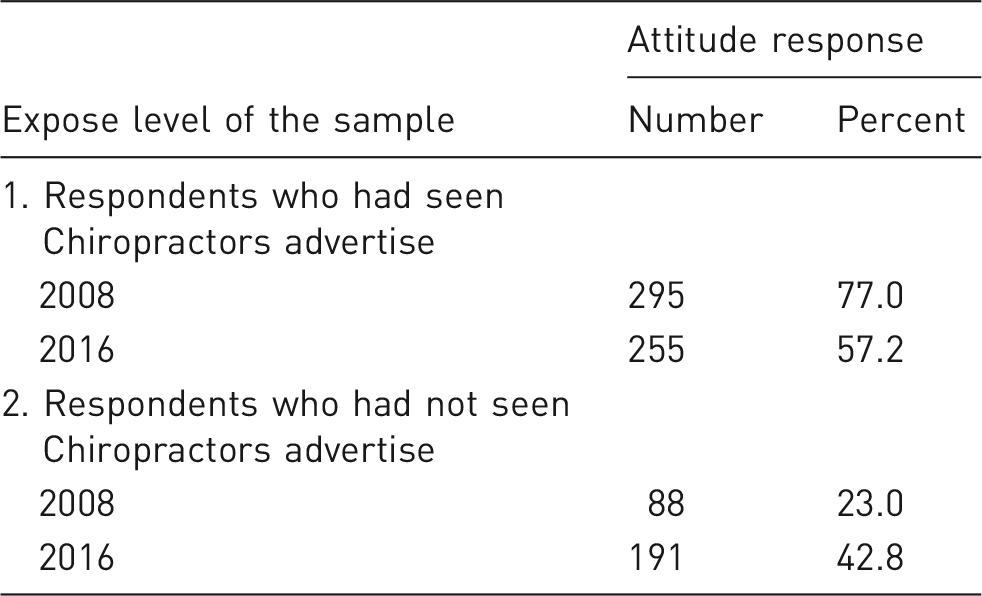
Consumer exposure to advertising by chiropractors
Advertising media used by chiropractors (as reported by consumers who had seen chiropractors advertise)
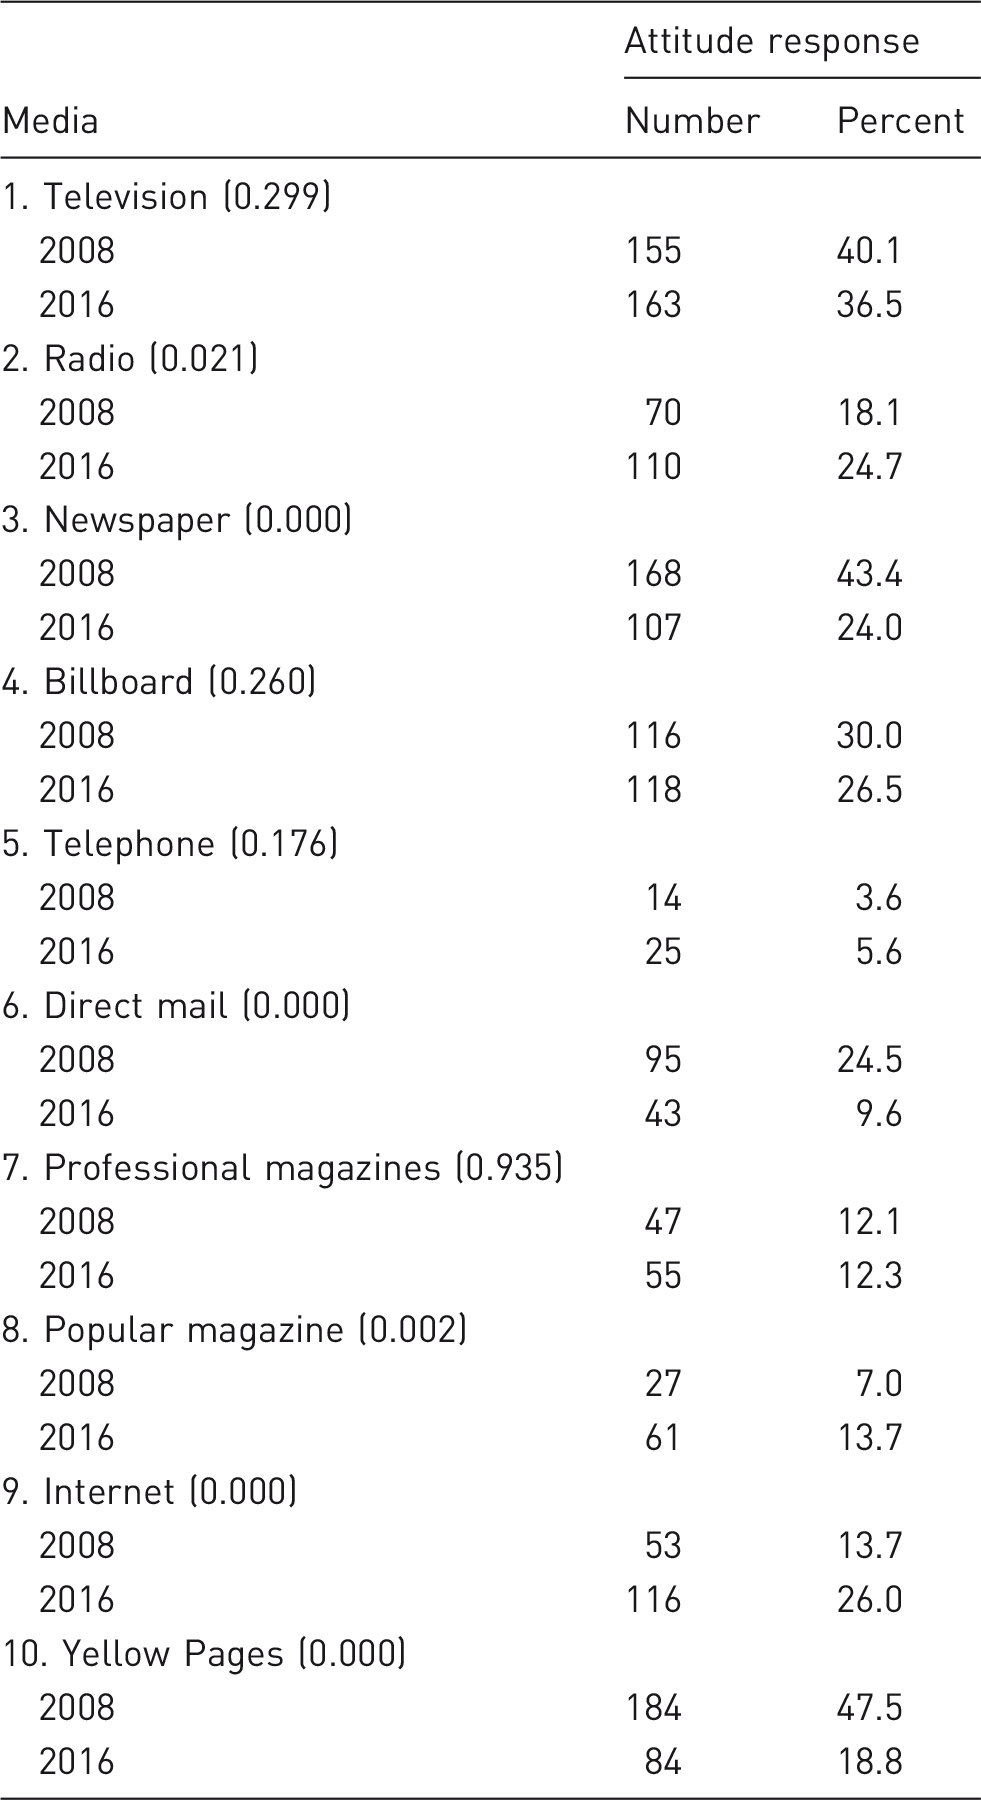
Note: The percentages above do not total to 100% since the respondents could indicate exposure through more than one media vehicle.
Appropriateness of advertising media for chiropractors
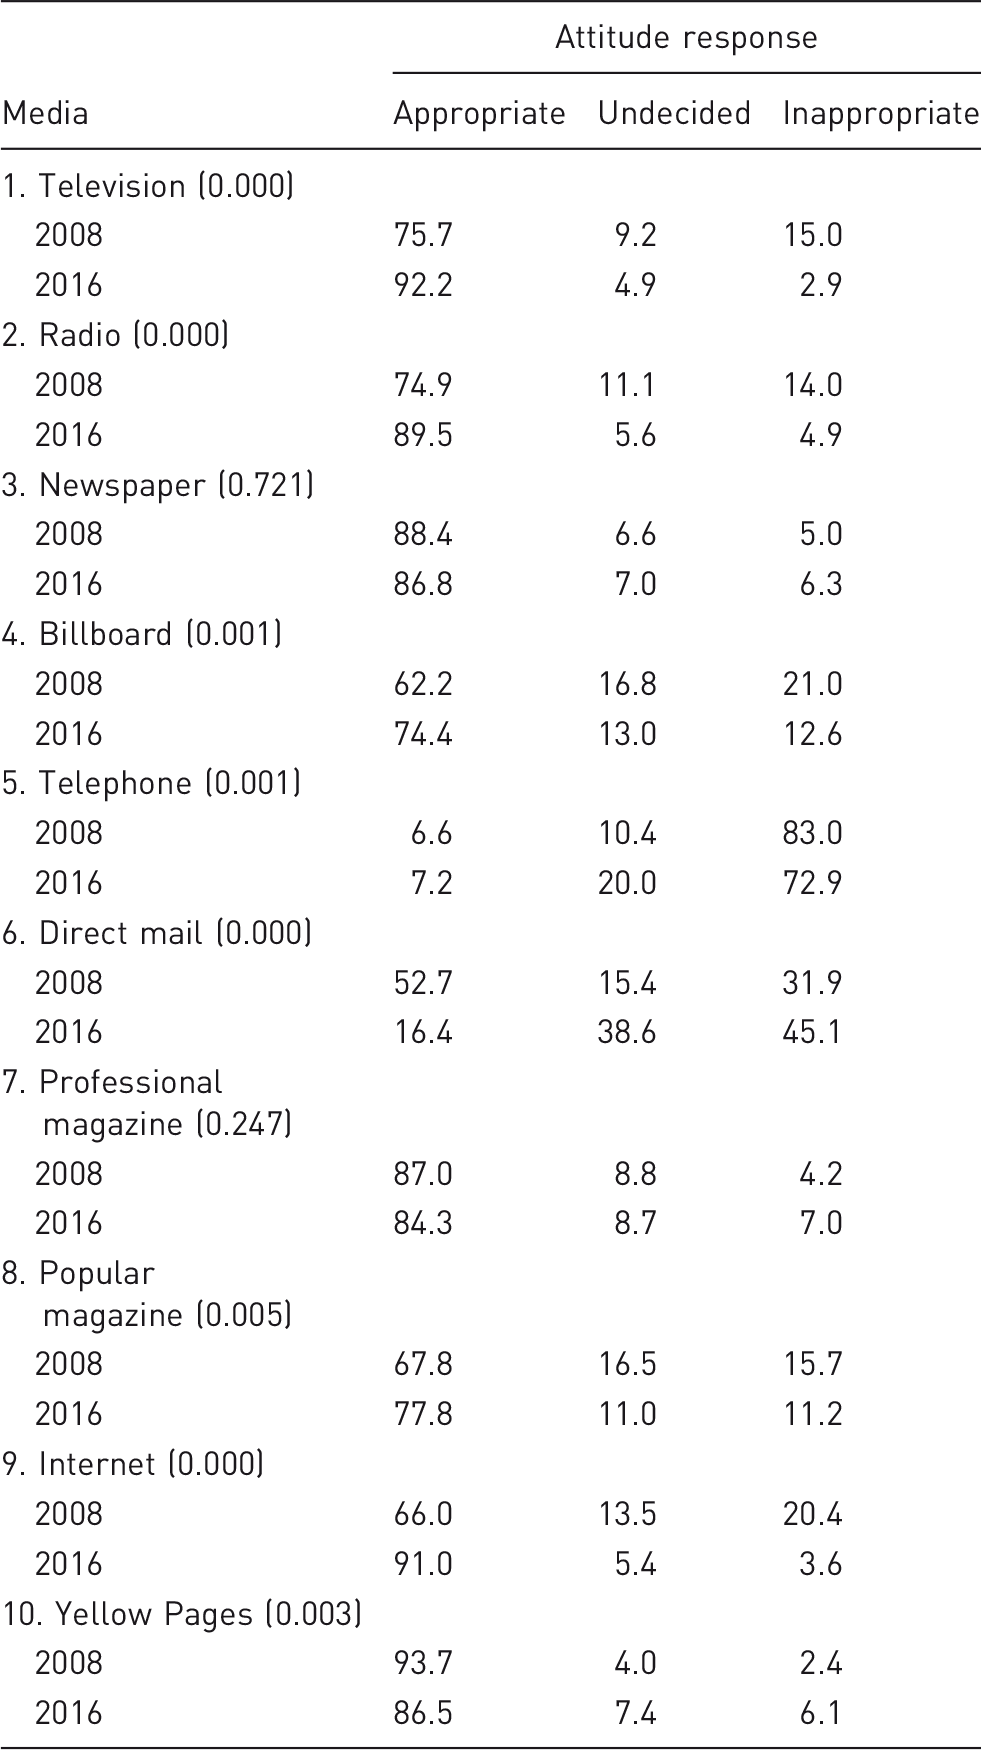
In Table 6, the number in parentheses following the listed medium is the p-value for a chi-square test on the cross-tabulation between the two survey years and the three levels of the Likert-type scale. The null hypothesis assumes that the 2008 proportion and 2016 proportion are equal for each of the three levels. If the p-value for a particular medium exceeds 0.05, the null hypothesis is accepted. Such is the case for newspaper and professional magazine. There is insufficient evidence to conclude that the proportions of the three levels have changed between 2008 and 2016 for those two media. Stated another way, the proportion who felt newspaper was an appropriate medium in 2016 is the same as it was in 2008 (likewise for undecided and inappropriate). Similarly, the proportion who felt professional magazine was an appropriate medium in 2016 is the same as it was in 2008 (likewise for undecided and inappropriate). Because about 85% of the respondents view them as appropriate for advertising, chiropractors should consider the use of newspaper and professional magazine as advertising media.
The numbers in Table 6 suggest that the media of internet, television, radio, billboard, and popular magazine are deemed as appropriate advertising media by a larger proportion of the 2016 group as compared to the 2008 group. With appropriate percentages of the 2016 respondents ranging from 77.8% to 91.0%, this group of five types of media outlets provides good choices for chiropractors to consider.
Telephone and direct mail cannot be recommended based on this data. Historically, telephone has occupied the low end of appropriateness in many lists. More than 70% of the 2016 respondents consider the telephone as an inappropriate medium. The percentage of respondents who see direct mail as an appropriate medium dropped from 52.7% in the 2008 group to 16.4% in the 2016 group. The appropriate percentage also dropped for the Yellow Pages from 2008 to 2016, but it remains above 86%.
The results in Table 6 indicate 92.2% of the 2016 respondents found the television an appropriate medium for chiropractors who advertise. Internet (91.0%) and radio (89.5%) placed second and third. Fourth was the newspaper, as 86.8% found this medium appropriate. Fifth were Yellow Pages with 86.5% finding this medium appropriate. The 2016 respondents found the telephone (72.9%) and direct mail (45.1%) inappropriate. Also, 93.7% of the 2008 respondents considered the Yellow Pages an appropriate advertising medium for chiropractors. More than 88% of the 2008 respondents considered newspaper appropriate. Professional magazine ranked third: 87.0% found this medium appropriate for chiropractors. Television ranked fourth, as 75.7% considered it appropriate. Radio ranked fifth: 74.9% of respondents found it appropriate. The results of studies by Moncrief and Bush found mixed results regarding whether chiropractors should advertise and whether they should use television to do so. 35
Exposure to advertising by chiropractors
One factor that should be considered is the degree to which the respondents have been exposed to chiropractors’ advertising. In Section IV of the questionnaire, respondents were asked whether they had ever seen chiropractors advertise and through which media. Respondents were allowed to indicate more than one media vehicle. As Table 7 indicates, 295 (77.0%) of the 2008 respondents had seen at least one chiropractor’s advertisement. In 2016, 57.2% of respondents had done so, and 42.8% had not. The p-value for the chi-square analysis comparing the 2008 respondents to those in 2016 was 0.000. Thus, a significantly lower proportion of the 2016 respondents had seen chiropractors advertise.
Table 8 indicates significant differences between the 2008 and 2016 sample groups with regard to which medium they had seen chiropractors use for advertising. In Table 8, the number in parentheses following the listed medium is the p-value for a chi-square test on the cross-tabulation between the two survey years and whether or not the respondent had seen advertising by chiropractors using that medium. No significant differences (p-value greater than 0.05) were found between the 2008 and 2016 sample groups with respect to the proportion of those seeing advertising by chiropractors on television, billboards, and professional magazines.
Of those in 2016 who had seen chiropractors advertise, 36.5% had viewed an advertisement on television. This group rated billboard second (26.5%) followed by the Internet (26.0%) and radio (24.7%). Newspaper was fifth at 24.0%. Sixth were Yellow Pages at 18.8%. Seventh and eighth were popular magazines (13.7%) and professional magazines (12.3%). Ninth and tenth were direct mail (9.6%) and telephone (5.6%).
Of those who had seen chiropractors advertise, the 2008 sample indicated the highest percentage of those respondents, 47.5%, had seen an advertisement in the Yellow Pages. Second was newspaper: 43.4% of respondents had seen chiropractors’ ads and recalled at least one advertisement in a newspaper. In third place was television (40.1%), and in fourth place was billboard (30.0%). Direct mail was fifth at 24.5%. Less than 15% had seen chiropractors’ advertising on the Internet, in a professional magazine, or in a popular magazine.
Conclusions
In the eight years between the two studies, there has been a significant change in consumer attitudes toward chiropractors’ advertising, and the results of this study have a number of implications. First, both 2008 and 2016 opinions about advertising by chiropractors are mixed; both sample groups look for and generally favor advertising as a means of obtaining some kinds of information about health-care services. The results in Table 2 indicate both the 2008 and 2016 respondents had a favorable attitude toward some aspects of chiropractors’ advertising. Both 2008 and the 2016 respondents agreed advertising helps consumers make more intelligent choices among chiropractors and makes the public more aware of the qualifications of chiropractors (Table 2).
Significant differences were indicated by the 2008 and 2016 sample groups with respect to attitudes toward chiropractors who advertise. The sample results generally indicate the 2008 consumers had a favorable attitude toward chiropractors’ advertising. Both the 2008 and 2016 groups indicated their image of chiropractors would not be lowered as a result of advertising. Also, both the 2008 and 2016 groups agreed advertising helps consumers make more intelligent choices among chiropractors and is a useful means of informing clients about services and specialties. Both the 2008 and 2016 groups agreed it is better to deal with reputable chiropractors rather than one who offers the lowest price. Both groups had similar sentiments regarding the statement that prices are lowered due to more competition when chiropractors advertise, but the level of support was somewhat stronger in 2016 than in 2008.
Table 4 shows that well over 50% of the both the 2008 and 2016 groups disagreed that advertising by chiropractors had a greater potential for deception than other forms of advertising and that they were not suspicious of chiropractors who advertised. Also, as indicated in Table 4, 79.8% of the 2008 respondents felt information received from friends about chiropractors’ services was more reliable than information received from chiropractors’ advertising and 70.4% of the 2016 respondents also felt this was the case. In examining Table 5, the future of advertising by chiropractors looks somewhat positive. As indicated in Table 5, 45.5% of the 2016 respondents agreed while 40.1% of the 2008 respondents were undecided that they would like to see more advertising by chiropractors. Also, 45.3% of the 2008 respondents disagreed but 53.1% of the 2016 respondents agreed that they believe advertising would increase the quality of services of chiropractors in the future. Since most chiropractors have little or no professional training in advertising, it will become increasingly important to involve them in educational programs that focus on health-care services in order to help them identify the most appropriate media for advertising.
As indicated in Table 6, the researchers tried to determine which media consumers believed were appropriate. Not surprisingly, the 2008 survey respondents named the Yellow Pages as the most appropriate medium: an overwhelming majority (93.7%) responded favorably toward the use of Yellow Pages. The 2016 respondents felt that television, Internet, and radio were the most appropriate media for reaching prospective patients but that telephone and direct mail were inappropriate. The results shown in Tables 7 and 8 indicated 255, or 57.2%, of the 2016 consumers had seen chiropractors advertise and over 25% had noticed chiropractors’ advertisements on television, billboards, and the Internet. More than 45% of the 2008 consumers but less than 20% of the 2016 consumers had seen chiropractors’ advertisements in the Yellow Pages.
This study seems to confirm the belief of many marketing professionals that advertising and marketing clearly have a place in the management and operation of chiropractic offices. Although the present image of chiropractors is positive, opinions were rather mixed as to whether it is proper for chiropractors to advertise. The study also confirmed that quality of service and the reputation of chiropractors were more important to consumers than price. Chiropractors will now find that consumers are generally receptive to their use of advertising as a means of communicating information about their services. 36 Television, Internet, billboard, and radio remain good choices of media for advertising the services provided by chiropractors. Chiropractors who carefully research the market and investigate attitudes and preferences of specific socioeconomic groups are likely to enjoy a competitive advantage.
Limitations and future research
Both surveys used in this study were administered to residents in Tennessee, a state in the southeastern portion of the United States of America. This fact limits the generalizability of these results. Future research could be applied to a larger geographical region and result in more generalizable results. Public perception of advertising may also differ in different countries. A 2016 article reports on initiatives being taken regarding advertising by chiropractors in Australia and New Zealand. 37
In order to gain insights into how public perception in this region has changed over the eight years between the two surveys, a very similar questionnaire was utilized. This fact limited what could be determined from the 2016 survey. Future research could benefit from an improved questionnaire. As an example, data could have been gathered on why respondents chose their answers to certain statements. Knowing why the responses were chosen could help make the conclusions more prescriptive than descriptive in nature.
Footnotes
Declaration of conflicting interests
The author(s) declared no potential conflicts of interest with respect to the research, authorship, and/or publication of this article.
Funding
The author(s) received no financial support for the research, authorship, and/or publication of this article.