
Abstract
This article examines the inclusion of disabled students in the UK and Swedish higher education systems. In the United Kingdom, performance indicators focus on the participation rate of disabled students in comparison with those of non-disabled students, while in Sweden there are no specific performance indicators relating to disabled students. The article notes that in both countries there is a dearth of intersectional data, recognising the heterogeneity of the disabled student population. It is argued that students from lower socioeconomic backgrounds who are also disabled may suffer a double disadvantage in accessing university and progressing through their studies. UK data show that disabled students are more likely to come from higher socioeconomic backgrounds, although this is due to the preponderance of dyslexic students who are disproportionately drawn from middle class backgrounds. The data also show that disabled students have lower progression rates than non-disabled students and that labour market outcomes differ in relation to type of impairment. The article advocates a greater focus on intersectional analysis in relation to ensuring effective support for all irrespective of impairment and social background.
Introduction
Inclusion of students from a range of under-represented groups has emerged as a policy issue in many European countries, it features in the social dimension of the Bologna Process, which promotes access for all irrespective of social background and characteristics. However, there is wide variation across European countries, with the United Kingdom and Sweden at the forefront in introducing strategies to promote access for under-represented groups, underpinned by equalities legislation. Sweden has a long tradition of promoting alternative routes of access to higher education which have benefited socially disadvantaged adults, though there is some evidence of changing educational and political priorities which might have a negative impact on access for non-traditional students (Weedon and Riddell, 2016). Initiatives in the United Kingdom emerged somewhat later but gained momentum in the 1990s after the publication of the review of higher education chaired by Dearing (National Committee of Inquiry into Higher Education (NCIHE), 1997). While data are now published relating to participation by disabled students and those from lower socioeconomic backgrounds, there are no attempts to examine such data in relation to each other. In addition, when examining access and/or outcomes for disabled students, a binary comparison tends to be made with non-disabled students, which fails to recognise the heterogeneity of the disabled student population. This raises questions concerning the impact of type of impairment.
This article examines the similarities and differences between Sweden and the United Kingdom in relation to the type of data gathered and the patterns which emerge. The differences are most apparent in relation to data collection, as Sweden does not use national performance indicators, although data are gathered on the number of disabled students by type of impairment. A UK dataset is therefore used to examine the links between type of impairment and socioeconomic background for UK-domiciled students only. The article suggests that both countries would benefit from further fine-grained analysis linking type of impairment with socioeconomic background in order to inform policy and ensure adequate support for all disabled students.
To set the context, the article starts with an overview of legislative frameworks, support provided to disabled students and measures taken to widen access in both countries. It then presents publicly available data on disabled students and contrasts the nature of data gathering in each of the two countries. UK statistical data are used to explore the relationship between disability and social class in access and progression, while qualitative data illustrate the heterogeneity of the disabled student population and the benefits of a mixed methods approach. The conclusion examines differences and similarities between the United Kingdom and Sweden, arguing for the development of more rigorous intersectional analysis in order to highlight particular areas of under-representation.
Legislation and policy
In Sweden, the most recent legislation, Diskrimineringslagen (2008: 567) (Discrimination Act, 2008) came into force in January 2009. Duties were placed on higher education institutions to promote the rights of all students and to prevent discrimination against a number of specific groups including those with a disability (funktionsnedsättning) (http://www.studeramedfunktionshinder.nu/studentinfo.htm). Further legislation in 2014, covering the workplace and education, identified ‘limited access’ (bristande tillgänglighet) as a form of discrimination.
The Great Britain (GB) legislation bears many similarities to its Swedish counterpart, with the GB-wide Equality Act of 2010 harmonising and superseding previous equalities legislation which was organised by protected characteristic. Separate disability discrimination legislation dates back to 1995, although the original measures did not cover education. Part lV of the Disability Discrimination Act was passed in 2001, covering all educational providers including colleges and higher education institutions. As in Sweden, institutions are expected to actively promote policies and practices that will support disabled students and make ‘reasonable adjustments’ to teaching, learning and assessment to ensure a level playing field. Reasonable adjustments include measures such as additional time in examinations; the provision of scribes, note-takers and proof readers; the availability of teaching and assessment materials in different formats; and physical accessibility. Students may request alternative forms of assessment, but the learning outcomes of courses are non-negotiable (for further discussion, see Fuller et al., 2009).
While there are similarities between the equalities frameworks in the two countries, there are differences in their conceptualisation of widening access. In the United Kingdom, the publication of the Dearing report in 1997 (NCIHE, 1997) led to the development of performance indicators to increase accountability of higher education institutions. These performance indicators, published annually by the Higher Education Statistics Agency (HESA), cover the following areas: widening participation, student retention, learning and teaching outcomes, research output and employment of graduates (https://www.hesa.ac.uk/pis/). Widening participation interestingly distinguishes between two groups: under-represented groups and disabled students, suggesting a division between the two. A student is counted as disabled if they receive the Disabled Students’ Allowance (DSA). Social background is measured by parent’s occupation and type of school – state or independent – attended by the student. These indicators are only recorded for ‘young’ students (those under the age of 21 years) resident in the United Kingdom. In addition, area-based measures are used as social background indicators. In Scotland, the Scottish Index of Multiple Deprivation (SIMD) measures levels of deprivation in specific geographical areas and is usually split into quintiles. In England and Wales, the Participation of Local Areas (POLAR) index measures the level of higher education participation in neighbourhoods and is also split into quintiles. There have been considerable debates surrounding the use of various social background measures (see, for example, Weedon, 2014), all of which have advantages and disadvantages. In brief, parental occupation is based on student self-report on university application forms, and can therefore be inaccurate and incomplete. Neighbourhood measures of deprivation may not reflect the socioeconomic status of specific individuals living in these areas, do not capture pockets of poverty in rural areas and fail to flag up the circumstances of those experiencing poverty in more affluent areas.
Widening access and student funding in different parts of the United Kingdom
Approaches to student funding and widening access differ across the four jurisdictions of the United Kingdom. Scotland has always had separate educational legislation and differences have widened following devolution and the setting up of the Scottish Parliament in the late 1990s (Gallacher and Raffe, 2012). The main area of difference has been in relation to tuition fees, which were introduced across the United Kingdom in 1998. In Scotland, they were replaced in 1999 by a one-off graduate endowment fee of £2000 which was payable by students after graduation, with exemptions for disabled students and those from poorer backgrounds. Following the election of an SNP (Scottish National Party) administration in 2007, the graduate endowment was abolished. In the rest of the United Kingdom, tuition fees were increased to £3000 per year; students were eligible to apply for a loan to cover the cost of tuition, which was repayable as a proportion of earnings after graduation. To ‘sugar the pill’ of higher tuition fees, English institutions were required to spend some of their tuition fee income on support for students from under-represented groups. In order to monitor university spending in this area, the Office for Fair Access (OFFA) was set up in 2004 and universities charging full fees were required to submit annual access agreements to demonstrate the measures in place to recruit and retain students from under-represented groups. Scotland lagged behind in monitoring widening access as there was a belief, which proved unfounded, that the absence of tuition fees in Scotland would lead to an increase in participation by students from disadvantaged backgrounds. This has not been the case and legislation was put in place in 2013 when the Post-16 Education Act placed duties on Scottish universities to increase access for disadvantaged Scottish-domiciled students. This legislation requires universities (and colleges) to produce outcome agreements on a yearly basis to demonstrate measures and progress in relation to widening access for students from less advantaged neighbourhoods and other under-represented groups. To date, progress has been limited especially in relation to the most prestigious institutions. Despite these UK-wide differences in relation to widening access, support for disabled students is very similar.
In contrast, Sweden does not seem to have the same emphasis on measuring widening participation and the publication of annual data at a national and institutional level. As mentioned above, a number of alternative access routes have been in place since the 1970s as part of the broader aim of creating a more socially just education system (Nylund, 2012). However, data published on an annual basis, with a trend analysis of the entire higher education system, only include a limited mention of widening access and disabled students (Universitets Kanslers Ämbetet (UKÄ), 2015). It is clear that these earlier measures have not been successful in creating a student body that is representative of the population at large. The latest report notes, with concern, the considerable variation in the participation rate between students from lower and higher social backgrounds. An examination of all those born in 1988 showed that only 22% of those whose parents had completed at most lower secondary education were studying in higher education compared to 84% of those who had at least one parent with a post-graduate qualification. The need to broaden participation (breddad rekrytering) which came to the fore at the turn of the century has now led to the Universitets och Högskolerådet (UHR) (Swedish Council for Higher Education) being expected actively to promote widening access. A report was commissioned by the Swedish Parliament in 2015 to identify and analyse the work undertaken by higher education institutions in relation to widening access. The main focus of this report was on two categories: social and ethnic background. Social background is measured by the level of parental education which is also the indicator used in the Eurostudent survey. The report, published in April 2016, noted that while there had been commitment to widening access since the beginning of the 21st century, progress had been slow (UHR, 2016). Although the main focus in the United Kingdom has been on socioeconomic background, there is also a focus on Black and minority ethnic (BME) groups in England, but to a lesser extent in Scotland.
It is clear that in the United Kingdom, its devolved jurisdictions and Sweden, widening access to higher education for under-represented groups is a policy priority, with a focus on students from lower socioeconomic backgrounds. In the United Kingdom, disabled students are recognised as a discrete group, although they are not accorded priority status. In England, a review of the DSA may reduce the level of support for some groups, specifically those with a diagnosis of dyslexia. In Sweden, policies on widening access (breddad rekrytering) do not include disabled students as a discrete group. As discussed in the following sections, an important difference between the two countries is the way in which support for disabled students is organised and the data which are gathered and published.
The organisation of support for disabled students in Sweden and the United Kingdom
The two countries offer broadly similar support for disabled students, but it is administered in different ways. In the United Kingdom, each institution is legally responsible for making reasonable adjustments. Additional support to the individual student is also available via the DSA which is funded centrally by the national Funding Councils. Each institution has to report to HESA on the number of students in receipt of DSA and, as mentioned above, disabled students feature in the performance indicators published annually by institution. HESA also publishes data on the total number of first year students who identify themselves as disabled but who are not necessarily in receipt of DSA.
In Sweden, the University of Stockholm acts as a hub for disabled student coordinators (samordnare) (http://www.studeramedfunktionshinder.nu/index.htm). The university has been in receipt of a government grant since 1993 and is responsible for allocating funding from this grant to all university and higher education institutions (högskolor). These grants are used at the discretion of particular institutions to support individual students and to make institutional adjustments to improve accessibility for all. The University of Stockholm gathers data on all disabled students known to the disability coordinators (http://www.studeramedfunktionshinder.nu/statistik.htm).
Data on disabled students in Europe
Before examining Swedish and UK data on disabled students, we discuss the findings from the fifth Eurostudent survey, which includes a question on whether an individual student experiences disability as an obstacle to participation, and whether this obstacle is regarded as ‘big’ or ‘minor/no obstacle’ (see Figure 1). This allows us to set Sweden and the United Kingdom into the European context.
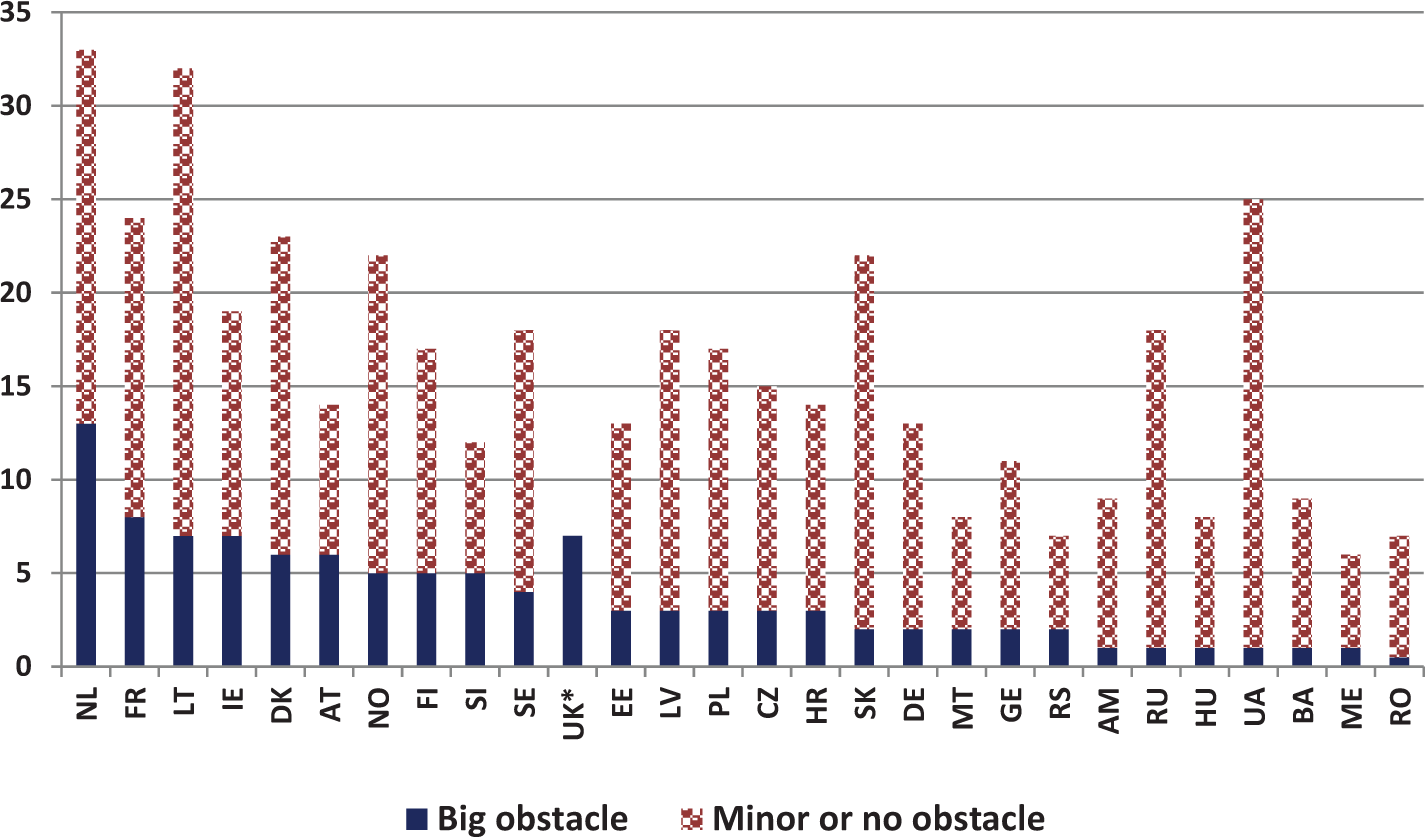
Percentage of students reporting a disability in different European countries.
The fifth Eurostudent survey, published in 2015 (Hauschildt et al., 2015), uses data gathered in the period 2012–2015 on students’ self-reported social and living conditions. A selection of countries across the European Higher Education Area participated in the survey, including countries such as Russia. The United Kingdom did not participate in the survey, but data on the proportion of full-time undergraduates in receipt of the DSA are included in Figure 1 as a point of comparison. To qualify for this allowance, medical or psychological evidence of a significant illness or disability must be presented, and about 7% of all undergraduates are in receipt of this allowance. A further 11% are in contact with university disability offices, but do not receive the DSA.
By way of comparison, 18% of Swedish students reported some type of impairment on the Eurostudent survey and 3% believed that this represented a major obstacle to participation. Health issues were most widely reported on the Eurostudent survey, although Sweden was one of six countries where dyslexia/specific learning difficulties were the most common obstacle reported. Overall, there appear to be broad similarities between Sweden and the United Kingdom in terms of the proportion of students reporting some type of disability, and also in relation to the type of impairment reported (see Figure 2).
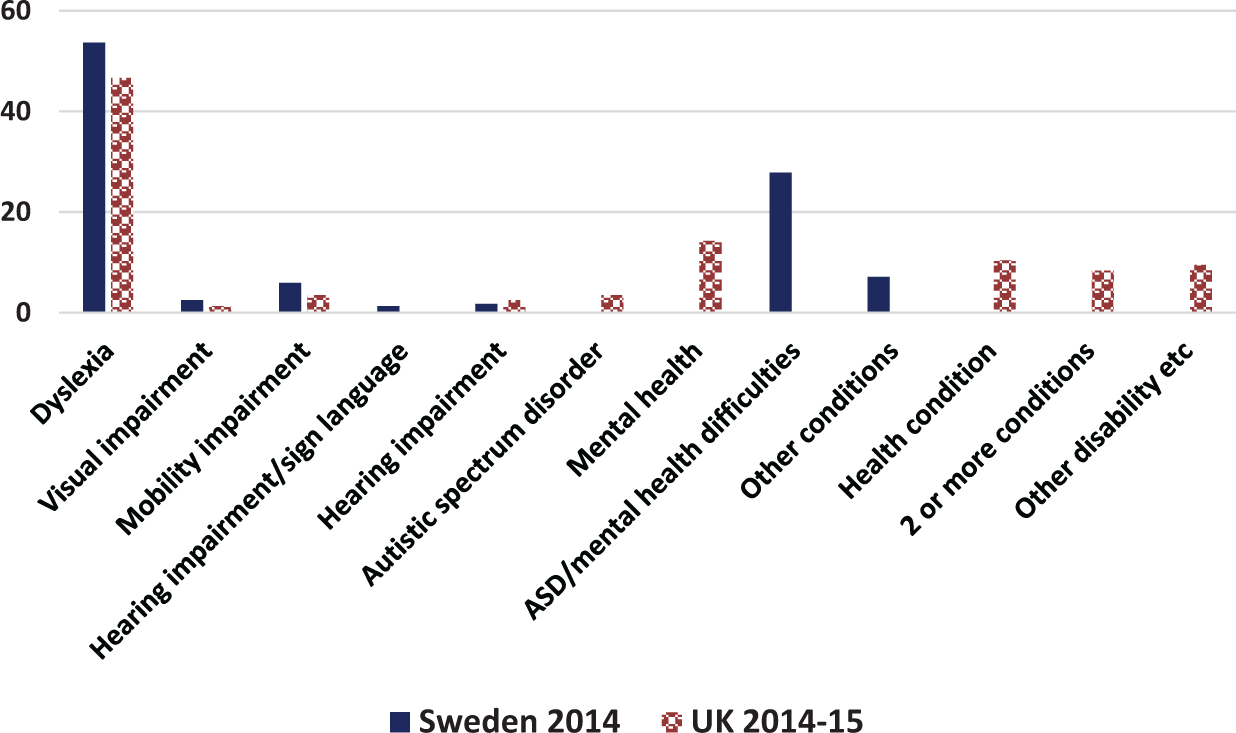
Percentage of the disabled student population with a particular type of impairment in Sweden and the United Kingdom.
Figure 2 shows the proportion of the disabled student population in each country by type of impairment. Sweden uses seven categories including two for hearing impaired students (with/without sign language requirement), while the United Kingdom uses nine and does not differentiate between hearing impaired student who require sign language and those that do not. In both countries, dyslexia/specific learning difficulties (SpLD) appears to be by far the most common type of impairment, followed by autistic spectrum disorder/mental health difficulties in Sweden and mental health difficulties in the United Kingdom. The number of students reporting mental health difficulties has increased considerably in both countries over recent years, while the number of students reporting dyslexia has stabilised (Weedon, 2016).
With regard to the high proportion of disabled students with a diagnosis of dyslexia, Sweden and the United Kingdom differ from many other European countries, where the condition is rarely identified. In the United Kingdom, the difficulties faced by students with a diagnosis of dyslexia came to the fore in the late 1990s, following an influential report by the British Psychological Society (BPS, 1999). As a result of the promotion of dyslexia by voluntary organisations such as the British Dyslexia Association, the number of full-time first degree students with a diagnosis of dyslexia increased considerably from around 570 (17% of the disabled student population) in 1994 to 23,345 (53% of the disabled student population) in 2014. In Sweden, the collection and publication of data by type of impairment is a relatively recent phenomenon. However, over the past decade, there has clearly been an increase in the number of students reporting dyslexia. In 2009, 3634 students reported dyslexia, and in 2014, this number had increased to 5945.
The relationship between disability and socioeconomic status
Intersectional analysis emerged out of Black feminist writing exploring the relationship between gender and race and has been extended to other areas including disability and social class (Meekosha and Shuttleworth, 2009). Anthias (2012) points out that the concept of intersectionality acts as an antidote to treating particular social categories as homogeneous groups. Socioeconomic background and disability are both categories that can impact on university access and outcomes and are therefore the focus of the analysis presented below. This is not to imply that other categories such as gender and race are less important and it may be that future analysis should include these categories. It is also important to recognise the dangers of reifying categorical data, while also acknowledging the value of the data in exploring the relationship between variables.
Sweden does not publish national data on socioeconomic status and disability, so the analysis below focuses on UK first year undergraduate students using data gathered by the HESA. These data allow us to explore the relationship between disability and parental occupation, using the National Statistics Socioeconomic Classification (NS-SEC). These data refer to the occupational status of the highest earning parent as reported by the student on their university and college admission (UCAS) form. In the analysis presented below, the socioeconomic characteristics of disabled students are compared with those of non-disabled students.
As shown in Figure 3, the majority (just over 50%) of all first year undergraduate students come from professional and managerial backgrounds, and disabled students are slightly more socially advantaged than non-disabled students. Just over 20% of students come from intermediate backgrounds (NS-SEC 3–4) and a further 28% come from skilled manual/manual backgrounds (NS-SEC 5–7). Disabled students are slightly less likely to come from the latter category than their non-disabled peers.
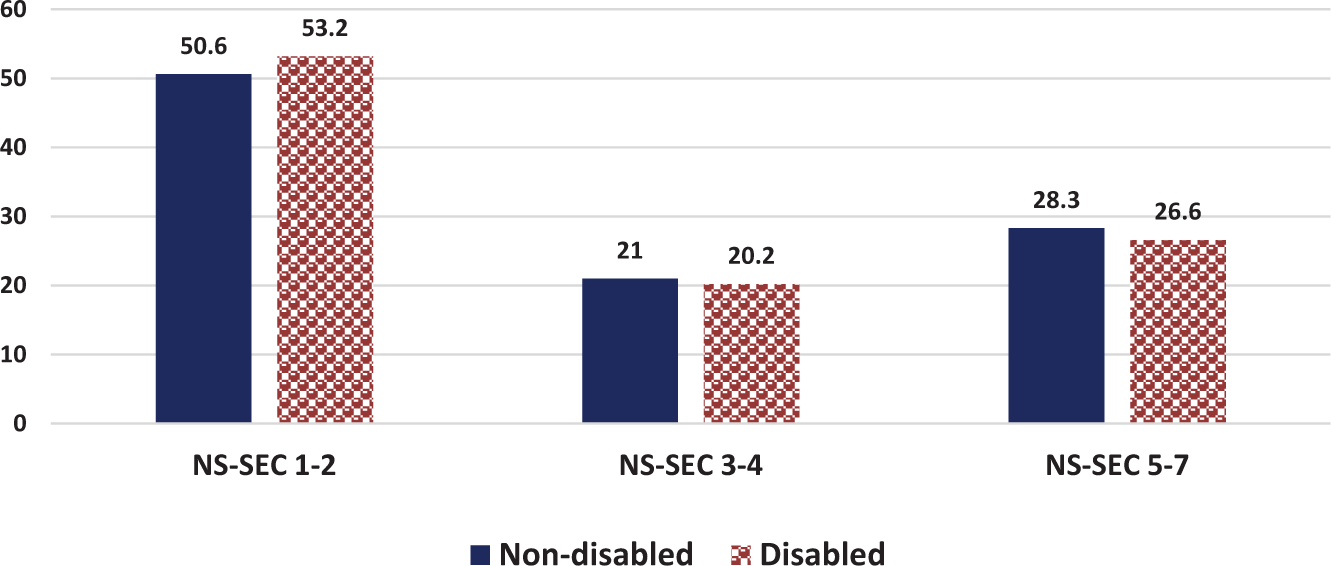
Parental occupational status (NS-SEC) of disabled and non-disabled first year undergraduate students, percentage.
A closer examination of the data by type of impairment and socioeconomic background shows major variation for different groups (see Figure 4). Nearly 60% of those with a diagnosis of specific learning difficulties/dyslexia come from the most socially advantaged group (NS-SEC 1–2). By way of contrast, about 48% of students with mental health difficulties come from professional/managerial backgrounds. This suggests that although the latter group are relatively socially advantaged compared with the general population, they are less advantaged than those with dyslexia. The following section examines data on higher education outcomes for disabled and non-disabled students in the United Kingdom.
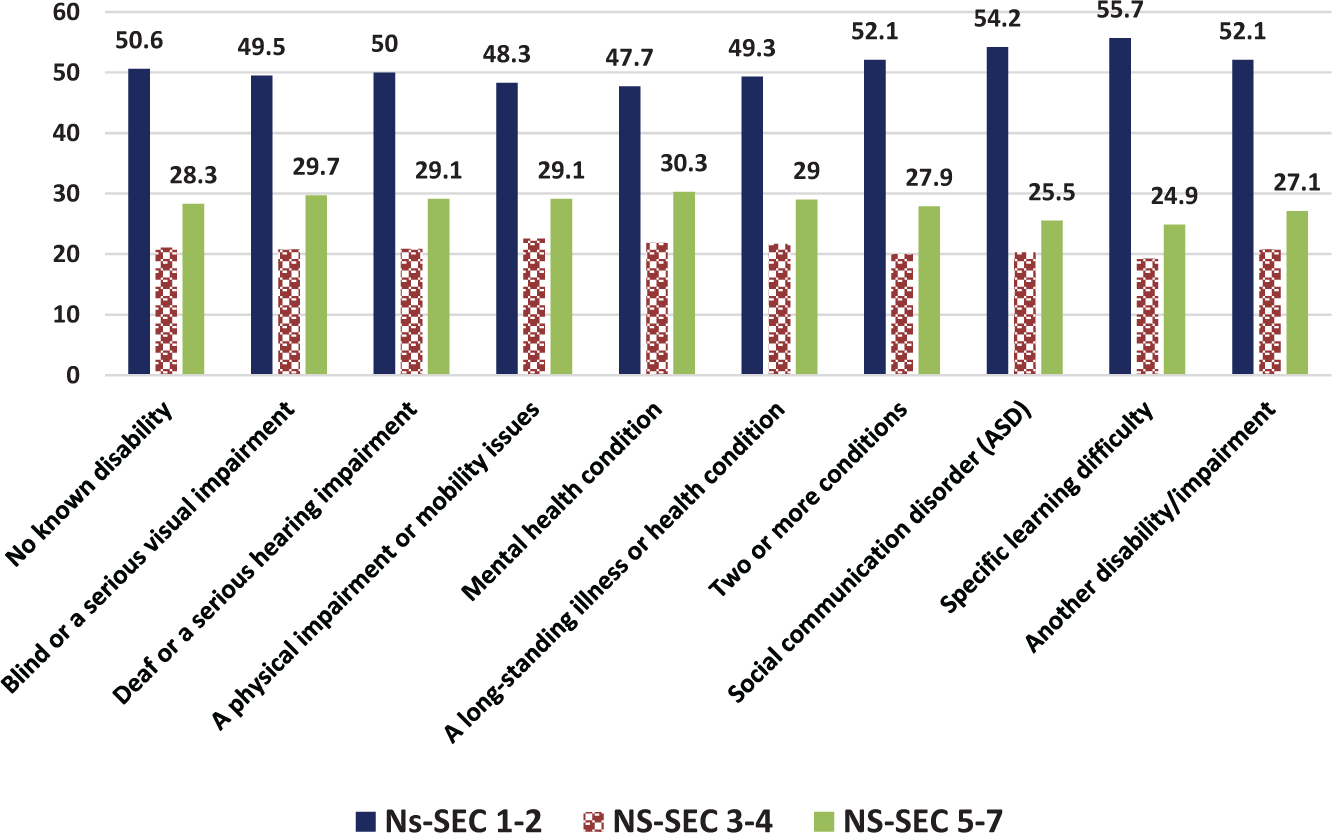
First year undergraduate students by type of impairment and parental occupation (NS-SEC), percentage.
Higher education outcomes of disabled students
There are no GB-wide data on progression by different protected characteristics 1 and socioeconomic background. However, the Scottish Funding Council (SFC) recently published an overview of students returning to study in year 2 by the different protected characteristics as well as social deprivation, measured by the SIMD (SFC, n.d.). This is a neighbourhood measure of derivation used by the Scottish Government to assess differences in access and outcomes by more and less socially advantaged students. Overall, Scotland has a low drop-out rate from higher education institutions, with 91% of first year students returning to study in year 2 in 2013–2014. However, those from deprived backgrounds, mature and disabled students are more likely to drop out than other groups.
Research by Riddell et al. (2005) and Richardson (2009) has indicated that disabled students have slightly poorer degree outcomes compared with non-disabled students. Richardson’s research used logistic regression analysis to demonstrate that most of the differences in degree outcomes were due to factors such as entry qualifications, subject of study, type of institution attended, age and gender rather than type of impairment, except in relation to epilepsy. Richardson did not include socioeconomic background as a factor, although we know that this is strongly associated with entry qualifications and type of university attended.
Data on outcomes for disabled students which are published by Association of Graduate Careers Advisory Services underline the need for analysis by type of impairment. Their most recent report (Association of Graduate Career Advisory Service (AGCAS), 2015) shows considerable differences in destinations of disabled graduates. Overall, 50% of disabled graduates are in full-time work compared to 58% of their non-disabled counterparts, underlining the fact that all graduates have relatively high rates of employment compared with those with lower qualifications. However, employment rates vary greatly by type of impairment. Only 30% of graduates with autistic spectrum disorder and 42% of graduates with mental health difficulties are in full-time employment, compared with 50.5% of graduates with hearing impairment and 55.8% of graduates with dyslexia (see Table 1). Research on graduate earnings is at a relatively early stage of development, but a recently completed study suggests that post-university income is associated with family background, although there is not a breakdown by disability (Britton et al., 2016).
Destinations of non-disabled and disabled first degree graduates by type of impairment, 2012–2013.

Source: Association of Graduate Career Advisory Service (AGCAS, 2015).
FT: full time; PT: part time; VI: visually impaired; HI: hearing impaired.
In summary, disabled students have poorer progression rates and are less likely to gain a good degree than their non-disabled peers. Their labour market outcomes are also generally poorer compared with non-disabled students. There are big differences in the labour market outcomes of graduates with different types of impairment, and there is a need for further analysis by socioeconomic background.
Case studies of disabled students
The two case studies presented below are drawn from an Economic and Social Research Council (ESRC)-funded project (RES-139-25-0135) entitled Examining the quality and outcomes of disabled students’ learning in higher education. This longitudinal study followed 32 students in England and Scotland through the course of their university career (Fuller et al., 2009). The two case studies are selected to highlight the heterogeneity of the disabled student population, their use of disability services and the impact of social capital. Both studied for an honours degree, one in Biological Sciences and the other in Education in the same institution.
Case study 1: Andrew
Andrew had cerebral palsy and described himself as having ‘dodgy legs’, which presented him with some mobility problems especially when climbing stairs. He was studying primary education on an honours degree programme and had attended a local comprehensive before going to college to gain the required qualifications to enter university. In addition to studying, he had a part-time job to contribute to the family finances. He had support for his disability when at college and ticked the disability box on his application, assuming this would automatically trigger support. It did not and his first encounter with the disability office was not positive. However, in the second year, he contacted them again and found them helpful in setting up support and accessing funding through the DSA.
Andrew lived at home and had to travel a considerable distance to the university. His mother, who was not in good health, provided him with considerable support and encouragement in coping with his disability. According to Andrew, as she told him, … fair enough your legs aren’t as great as everyone else’s but you have got all this other stuff you can do, so don’t let that hold you back from doing the things you want to do.
She also supported him with his studies: My mum is not college or uni educated. But she can pick up a lot of stuff that I might not pick up on. She is very, very good at pointing out grammatical errors that I haven’t spotted in the first read through … it’s just the two of us … [my mother is] my biggest critic … she can say ‘Change that, change this’, she is very good like that.
In addition to support from his mother, he was also part of a close knit group while at university which was very important to him: The one thing actually that worried me when I first started was, am I going to meet any new people, new friends and things like that? And actually at my interview I met one of my closest friends and when I came on the course I spotted her name and we started talking away and then we have gradually kind of widened the group and I have got a very close knit group of six friends. It’s really good …
Andrew struggled with some of his assessments and ran into problems during his practical placement in third year when his mother was in hospital and he had to support her. University staff were supportive and rearranged it for him to ensure he could continue. He completed the course with a lower second class honours degree and managed to find part-time employment.
Case study 2: Teresa
Teresa suffered from severe migraines as a result of having epilepsy. This had not been diagnosed until she was 18 and at school she had been considered as ‘skiving’ when she complained of headaches. The headmaster of her school had described her as ‘unemployable’.
After leaving school, she travelled abroad before returning to study biological sciences as a mature student. She disclosed her disability on the application form and assumed that this would automatically alert the institution to her condition and that she did not need to contact the disability office: I assumed that […] when I first came to the university, they give you all of these papers to sign and […] so I did tick a bright red box that said ‘you are disabled’ and I assumed that because I had done that […] they had me down as unseen disability, I assumed that that was on my file for my Director of Studies and all of the course organisers to know. But it wasn’t so I got myself into trouble for not saying at the beginning that I had these problems.
At that point, she contacted the disability office and they helped her apply for the DSA. They also ensured that she was provided with the support required. She found staff very helpful and supportive but in spite of this fell behind with her work due to her migraines. She took a year out and returned before finally withdrawing. At that point, she was offered a Diploma in Higher Education which she declined. She had little contact with her family who lived in another part of the United Kingdom and did not want to bother them with her problems.
It is evident from these case studies that a student’s impairment affects their university experience and outcome; however, additional factors such as socioeconomic background and social capital also play an important role. Middle-class students are often advantaged by access to particular types of social, cultural and economic capital while at university and later on as they enter the labour market, but it is also important to recognise the salience of disability (Fordyce et al., 2014; Fordyce and Riddell, 2015). Lack of a close family support network, as well as the unpredictable nature of her epilepsy, impacted on Teresa’s ability to continue her studies. In contrast, Andrew, from a working-class background but with a strong social network, managed to overcome the difficulties he encountered in his lengthy journey to completion of his degree. However, it is likely that his background and lack of economic resources impacted on the final classification of his degree. These case studies highlight the need for greater understanding of diversity among disabled students, particularly in relation to the impact of socioeconomic background which plays out differently depending on type of impairment. Despite their social advantages, middle class students with significant impairments are not always protected from the risks associated with disability.
Discussion and conclusion
This article set out to examine the experiences and outcomes of disabled students in Sweden and the United Kingdom in the context of approaches to widening access. The article used publicly available data to compare policy on disabled students in these two countries within the wider European context. Although data are limited, it is evident that both countries are at the forefront of monitoring access and progress of disabled students in comparison to many other European countries.
Currently, much of the focus in relation to under-representation is on increasing participation of students from lower socioeconomic backgrounds. For that reason, policy and legislation relating to inclusion of both disabled students and those from lower socioeconomic backgrounds were examined. It was noted that equalities legislation in both countries is similar, but there are significant differences in relation to widening access policy for students from poorer backgrounds. In the United Kingdom, duties are placed on institutions which require them to demonstrate that they are taking steps to widen access in relation to socioeconomic status, and financial penalties may apply if institutions are seen to be failing in this area, although these have not been used. While institutions are encouraged to recruit more disabled students, no targets are set and there are no penalties for non-compliance.
In Sweden, the mapping of institutional activity on widening access for those from poorer backgrounds and disabled students is not tightly regulated and, while institutions are expected to demonstrate progress, the emphasis seems to be on developing good practice. While the United Kingdom publishes performance indicators and outcomes at a national level, in Sweden there are no performance indicators, but data are published in the annual report providing a broad overview of the whole higher education system.
Despite these differences, available data on disabled students in Sweden and the United Kingdom show broadly similar trends. In both countries, there has been an overall increase in the number and proportion of disabled students, particularly in the field of dyslexia/specific learning difficulties. This group now makes up more than 50% of the entire disabled student population in both countries. It is evident that in both countries disabled students tend to be treated as a homogeneous group, with a lack of intersectional analysis focusing on the relationship between socioeconomic background and type of impairment.
The need for further intersectional research is highlighted by analysis of HESA data on the socioeconomic background of students with different types of impairments. This shows that disabled university students, like the general student population in the United Kingdom (Raffe and Croxford, 2015) and Sweden (Beach and Puaca, 2014), tend to come from socially advantaged backgrounds. Some impairment groups, for example, those with dyslexia, are markedly more socially advantaged than others and have better labour market outcomes. The mechanisms by which such advantages are achieved are illustrated in the brief case studies. While this type of analysis is developing in Scotland, there are few similar studies in Sweden, possibly partly due to lack of publicly available administrative data taking account of both type of disability and socioeconomic background. Further research in both Sweden and the United Kingdom is needed to examine the interrelationship between social background and disability. This is vital to ensure that the barriers and difficulties experienced by students with different types of impairments and from different social backgrounds are recognised, with a view to promoting wider access and better support.
Footnotes
Appendix
European country abbreviations.

| Abbreviation | Country | Abbreviation | Country |
|---|---|---|---|
| NL | The Netherlands | CZ | Czech Republic |
| FR | France | HR | Croatia |
| LT | Lithuania | SK | Slovakia |
| IE | Ireland | DE | Germany |
| DK | Denmark | MT | Malta |
| AT | Austria | GE | Georgia |
| NO | Norway | RS | Serbia |
| FI | Finland | AM | Armenia |
| SI | Slovenia | RU | Russia |
| SE | Sweden | HU | Hungary |
| UK | United Kingdom | UA | Ukraine |
| EE | Estonia | BA | Bosnia and Herzegovina |
| LV | Latvia | ME | Montenegro |
| PL | Poland | RO | Romania |
Declaration of Conflicting Interests
The author(s) declared no potential conflicts of interest with respect to the research, authorship, and/or publication of this article.
Funding
The author(s) disclosed receipt of the following financial support for the research, authorship, and/or publication of this article: The funding for the case studies reported in this article was provided by the ESRC (Examining the quality and outcomes of disabled students’ learning in higher education RES-139-25-0135).