



Abstract
Motion graphics (MGs) are utilized in various venues for the purposes of informing and entertaining audiences. Most graphics have intricate finishes and use complex animation to present visual explanations of subject matter (i.e. exposition) or to convey narratives. Within an MG complex animation is demonstrated by the use of dynamic virtual cameras and depth cues, the motion exhibited by the phenomenon being visually explained, and photorealistic rendering. Presently, very little empirical research exists on MGs in general or the effects of complex animation on the viewing experience associated with MGs. The goals of the quasi-experimental study presented in this article were to explore how viewers interact with expository graphics that provide visual explanations and to characterize this interaction according to a synthesis of two theories that address different aspects of the viewing experience. The results suggest that the MG viewing experience is dynamic and that complex animation can be beneficial to viewers.
Keywords
Introduction
A motion graphic (MG) is a continuous sequence of animated typography, animated 2D and 3D computer generated imagery (CGI), and live action footage that have been composited together, output to a digital file format, and displayed in a mediated environment (Brinkmann, 2008; Bruckner, 2015; Krasner, 2013; Skjulstad, 2007). 1 As visual communication devices, MGs are capable of informing or entertaining an audience, or doing a combination of both. For example, The New York Times routinely produces MGs that accompany the digital versions of their feature stories in order to offer visual explanations of the phenomena or subject matter described within the articles (Franchi, 2013). The graphics associated with entertainment depict standalone and serial narratives, and can be observed within the contexts of film and television title sequences, commercials, and digital advertisements (Bednarek, 2014). Mariano Rivera: The King of Closers (SND-E, 2013) informed audiences as well as entertained them by presenting the athletic performance of former New York Yankees baseball player Mariano Rivera and providing an analysis of his pitching mechanism. The commonality shared by all MGs is their reliance on animation to: (1) realize the goal of conveying messages to an audience, and (2) produce an optimal viewing experience for the audience. The sophistication of an MG’s animation may also play a role in how well the graphic’s exposition is understood but the research literature has given very little attention to the effects that variations in the quality of animation have on the viewing experience. The purpose of this article was to present a quasi-experimental study that explored how participants chose to watch expository MGs (or MGs that provide visual explanations of phenomena; Ploetzner and Lowe, 2012) and what effects complex animation had on their viewing experience. The first part of the article discusses how viewers learn from animation and introduces two theories that describe how viewers interact with MGs.
1 Is animation effective or not?
According to Martinez (2015: 42), animation is a mechanism that ‘generate[s] illusory movement by producing and displaying an artificial arrangement of graphic positions without reproducing the positions of real-time movement’ and it allows an audience to directly and explicitly observe the spatial and temporal changes of the content housed within an MG by producing motion (Jones, 2007; Krasner, 2013; Lowe and Schnotz, 2014). When someone views an MG his or her attention is directed toward the elements of the graphic that are animated. Spectators comprehend animation by forming a mental model of the events, narrative, or subject matter being depicted by a graphic. A mental model is essentially one’s conceptualization of external phenomena and it permits an individual to mentally represent, replay, or simulate an animation (Johnson-Laird, 1980, 1996, 2005; O’ Malley and Draper, 1992). The creation of a mental model involves multiple steps and begins with viewers attempting to mentally parse the animation that they have just seen by decomposing it based on the hero item, 2 ambient objects, and background environment displayed by the MG. Next, viewers attempt to attribute meaning to those components and integrate them into separate causal chains. Lastly, the causal chains are assembled into an internal analogical narrative that describes what the MG’s animation depicted (Kriz and Hegarty, 2007; Lowe and Schnotz, 2008, 2014; Torre, 2014). This narrative serves as the basis for the mental model and it allows viewers to derive inferences, to engage in inductive reasoning, and to retrieve and apply knowledge. It is reasonable to expect that viewers’ mental model can be affected by the type of animation to which they are exposed. For example, if an MG utilizes an animated camera and contains other animated elements (e.g. typography, CGI, etc.) it is likely that a viewer’s mental model may include a detailed narrative of the topic presented by the MG. Conversely, exposure to MGs that contain a minimal amount of animation may result in the development of a less complete mental model.
Typically, within an expository MG a significant amount of motion is exhibited by the phenomenon or subject matter that is being visually explained, while the typography and background imagery are rarely animated, and the virtual camera remains stationary. However, Woolman (2004) suggested several ways in which the use of multiple virtual cameras and coordinated motion between shots could enhance and increase the overall complexity of the animation contained within a motion graphic. Complex animation may impact a viewer’s mental model by allowing the individual to mentally infer and replay motion (Hegarty et al., 2003) or complex animation could confuse a viewer and lead to the development of an erroneous mental model due to attention being directed to irrelevant action and information. Two theories – the theory of naïve realism and cognitive load theory – have the potential to shed light on the nature of the effects of complex animation.
2 Two theories
2.1 Naïve realism
The theory of naïve realism originated from cognitive psychology research on visual displays and it focuses on people’s interaction with visual media stimuli (VMS) such as MGs prior to, during, and after task performance. The theory suggests that individuals have expectancies about the viewing experience associated with the VMS to which they are exposed, that these expectancies are influenced by certain characteristics of the VMS, and that task performance is indirectly impacted as a result (Smallman and St John, 2005a). People erroneously assume that the appearance and design of VMS actually reflect how well it affords task performance and they tend to hold a counterintuitive belief that more detail makes VMS more effective. They fail to realize that there is a threshold at which performance deteriorates due to excessive detail (Smallman and St John, 2005b). In the case of MGs, excessive detail comes in the forms of photorealistically rendered objects, depth cues, complex animation, or any other superfluous aspect of a graphic that misdirects viewers’ attention. Excessive detail is immersive and produces visual clutter that causes distraction and misdirection, and makes it difficult for viewers to recognize and isolate objects and action that are relevant to understanding an MG’s content (Bracken, 2005; Rooney and Hennessy, 2013; Rosenholtz et al., 2007; Tran, 2012). Therefore, the theory asserts that the utilization of VMS containing excessive detail will lead to a substantial decrement in the accuracy and response time associated with task performance whereas the usage of VMS with a low amount of detail will lead to superior performance (Hegarty et al., 2010). Naïve realism is exhibited as a behavior when a person prefers to use VMS with excessive detail to complete comprehension and problem-solving tasks when VMS without excessive detail will suffice and provide better task performance.
Variables associated with the theory of naïve realism
Three variables are used to evaluate naïve realism as a behavior: presentation quality preferences, intuition, and accuracy. Presentation quality represents the amount of excessive detail that VMS possess; if an MG has more detail (i.e. excessive detail) it is considered to have a higher amount of presentation quality than a graphic that has less detail. In this article, presentation quality will also be referred to as fidelity. The constituent features of presentation quality are animation, realism, intricacy, and 3D. Animation pertains to the quality of the temporal motion incorporated into VMS in order to simulate action, realism concerns the degree of iconicity or visual similarity (i.e. representativeness) that VMS have to their depicted phenomena, intricacy describes the amount of visual clutter included in VMS, and 3D refers to the dimensionality possessed by the VMS. The presentation quality preference scale developed by Hegarty et al. (2009) is used to assess how desirable as well as how effective people find those features to be during the MG viewing experience. Throughout the course of several studies, the scale was found to have a reliability coefficient (α) of .72 which means that it consistently produces exact measurements of presentation quality preferences. An α less than .7 indicates that a scale lacks precision and produces inconsistent measurements (Field, 2009).
An intuition is a viewer’s expectancy about VMS, a prospective intuition is an expectancy recorded prior to exposure to VMS, and a retrospective intuition is an expectancy recorded after exposure. Prospective intuitions are based on viewers’ ‘assumptions and expectations about the task demands and relative utility of the different display formats, while retrospective intuitions reflect participants’ experiences with the task’ and VMS (Smallman and Cook, 2011: 597–598). Prospective intuitions indicate one’s preference for specific VMS and their prediction about its effectiveness, and retrospective intuitions measure how effective VMS was during task performance according to the viewer. Prospective intuitions serve as a baseline for retrospective intuitions and their comparison permits one to observe whether naïve realism is being exhibited. Intuition rating trials record intuition by presenting alternative yet compatible VMS to viewers and requiring them to predict which VMS will best support task performance.
Accuracy relates to how well viewers comprehend information from VMS and apply this knowledge during task performance. Accuracy is measured in the form of viewers’ correct responses to a series of comprehension questions pertaining to recently seen VMS. Additional insight about the exhibition of naïve realism can be gained by combining assessments of the amount of comprehension achieved from VMS with the measurement of intuition (Hegarty et al., 2012).
2.2 Cognitive load theory
This theory covers the acquisition and processing of information originating from the exposition offered by VMS (Sweller, 1988, 2010). For the purpose of this article, exposition will be defined as any instruction, information, or knowledge implicitly or explicitly conveyed by VMS that results in comprehension and learning. Human cognitive architecture consists of sensory memory, working memory, and long-term memory, and according to cognitive load theory these components operate in unison to process information and achieve comprehension (Gredler, 2005; Kalyuga, 2009, 2010; Strayer and Drews, 2007). Learning occurs when new information elaborates and alters knowledge held in long-term memory, and the application of learning can be observed when the information is retrieved during task performance (Paas and Sweller, 2014). Working memory is the most critical component of human cognitive architecture during information processing for three reasons: (1) it acts as an intermediary between the initial acquisition (sensory memory) and ultimate storage of information (long-term memory); (2) it is where the majority of information processing activities takes place (i.e. encoding and retrieval); and (3) it is resource-based (Wickens and Holland, 2000). Working memory is limited to maintaining between five to nine pieces of novel information at any given time and once its capacity is exceeded one experiences cognitive load (CL) (Baddeley, 2012; Miller, 1956). It takes mental effort to hold information in working memory no matter if the information is being encoded and is headed toward long-term memory, or if the information has just been retrieved from long-term memory. More mental effort gets exerted as the capacity of working memory reaches exhaustion, which produces more CL (Moreno, 2010; Moreno and Park, 2010). Behaviorally, CL is indicated by the difficulty that one has learning new information and by the difficulty that they have completing tasks that require an understanding of that information (Schnotz and Kürschner, 2007).
Variables associated with the theory of cognitive load
The most succinct and unobtrusive way to measure CL is offered by Paas’ 9-point CL scale (Paas, 1992; Paas and Van Merriëboer, 1993). The underlying premise of the instrument is that people are capable of indicating the amount of CL that they are experiencing (Paas et al., 2003). The 9-point CL scale is symmetrical with the response of ‘neither low nor high mental effort’ lying at its center and poles labeled ‘very, very low mental effort’ and ‘very, very high mental effort’, respectively (see Van Gog and Paas, 2008, for a review of studies using the scale). The 9-point CL scale has an α of .90 which means that it is capable of providing very precise and consistent measurements of CL. It can be administered during learning or task performance (i.e. online) or immediately following those activities (i.e. offline), and the 9-point CL scale is capable of producing comparable measurements of CL within and between various learning situations and tasks. Van Gog et al. (2012) cautioned researchers that participants have a tendency to overestimate as well as underestimate the amount of CL imposed by learning or task execution when they are only required to provide a CL measurement after the completion of a series of activities. The researchers therefore recommended that iteratively taking CL measurements throughout learning and task performance and subsequently averaging them would be one way to assure that the CL data would be unbiased and avoid inflation. In the case of MGs, it is advisable to have CL measured immediately after the completion of any comprehension task (e.g. after responding to each question).
2.3 Summary of the two theories
A synthesis of the aforementioned theories makes a more robust consideration of the MG viewing experience possible. The theory of naïve realism addresses the interaction(s) individuals have with a graphic during the viewing experience and cognitive load theory demonstrates how individuals engage in information processing once they begin interacting with the MG. Both theories suggest that including large amounts of excessive detail in a graphic (e.g. complex animation) is counterproductive for task performance. The visual clutter produced by excessive detail is often the most salient aspect of an MG which makes it alluring to viewers although visual clutter is usually irrelevant to the actual exposition of the graphic (this is within purview of the theory of naïve realism). When viewers become engaged with visual clutter their cognitive architecture is directed towards processing irrelevant information. This exhausts people’s working memory capacity, which imposes CL and leads to the formation of either an incomplete or flawed mental model because irrelevant information was used as a knowledge source (this is within the purview of cognitive load theory). The utilization of this mental model results in inaccurate and latent task performance. Each theory recommends that a reduction in excessive detail will result in the optimization of the viewing experience.
3 Previous research
Previous research by the author explored how 82 participants exhibited naïve realism after viewing prescribed sequences of expository MGs. Each of the graphics had a duration of 45 seconds, included narration, and was produced using Adobe After Effects, Adobe Photoshop, and Autodesk Maya. At the beginning of the study the participants were surveyed about their presentation quality preferences using the presentation quality preference scale (Hegarty et al., 2009) and then they were randomly assigned to view one of two expository MG sequences. One of the sequences presented a graphic that contained complex animation and a high level of fidelity followed by a graphic that contained 2D toon shading and employed a static virtual camera (i.e. a low level of fidelity). All the graphics used one stationary virtual camera regardless of their level of presentation quality. The other sequence presented the same MGs in the reverse order. Each participant saw one MG about a dust storm and one MG about Atlantic blue marlin, and the presentation quality (also referred to as fidelity) of the graphics was alternated within each sequence in order to preempt confounds. Prior to and immediately after viewing their assigned MG sequence, the participants reported their intuitions by completing an intuition rating trial. Also, the participants completed two series of comprehension questions after viewing each of the MGs within their assigned sequence. The findings of the study indicated that most participants maintained a propensity to view graphics that possessed a high level of fidelity even when it adversely affected their task performance. Graphics with a low level of presentation quality actually enabled more accurate task performance. The author also observed that the most recently viewed MG seemed to inform the participants’ final intuition. Although this study was informative it was limited by the fact that participants were not able to choose what type of MG they wished to view and even Hegarty et al. (2012: 15) acknowledged that such a limitation needed to be addressed and noted that ‘an interesting direction for future research would be to allow users to choose from various displays as they perform a task, and vary the costs of accessing different displays and their relative effectiveness.’ Neither did the study fully examine the effects of complex animation because each MG only used one static virtual camera and also 3D photorealistic rendering.
4 The effect of complex animation
Research questions
The purpose of the current study was to address those limitations by presenting participants with alternate versions of expository MGs and allowing them to choose which graphics they would like to view. This approach also attempted to adhere to people’s interactions with expository graphics in the real world. The research questions driving this investigation were:
4.1 Method
Participants
The sample consisted of 135 undergraduate students (59.3% female) enrolled in a southeastern university in the US. The mean age of the participants was 20.4 years (SD = 0.88). On a preliminary demographic survey administered at the beginning of the study 57 percent of the participants indicated that they viewed MGs frequently, 40 percent indicated that they viewed MGs infrequently, and 3 percent of the participants reported not viewing MGs at all. Of the individuals that did view MGs with some sort of frequency, 65.9 percent of the participants said that their main source of MGs was entertainment websites, 21.5 percent reported that news websites were their primary source of MGs, and the remaining participants said that they acquired exposure to MGs from educational websites and content repositories such as Pinterest. Pinterest provides a web-based venue for people to visually bookmark and display graphic media.
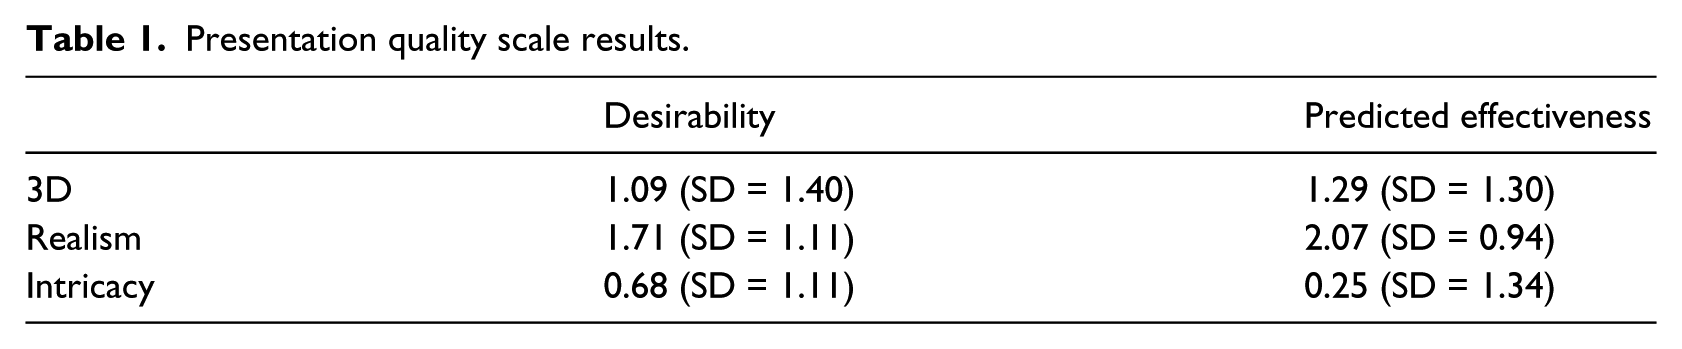
The preliminary demographic survey also included an adapted version of Hegarty’s (Hegarty et al., 2009) presentation quality scale (further described in the Materials subsection). Animation was not assessed as a presentation quality preference since the current study focused on manipulating the presence of complex animation within expository MGs. Table 1 displays the participants’ mean ratings of the attributes (–3 = very undesirable to 3 = very desirable; –3 = very ineffective to 3 = very effective). All of the attributes were found to be desirable and to have some degree of predicted effectiveness.
Presentation quality scale results.
4.2 Materials
Stimuli
Four expository MGs that were 1280 by 720 pixels in size were used. Each graphic had a duration of 45 seconds. The animated CGI for the graphics was generated using Autodesk Maya, the graphic elements and animated typography using Adobe Illustrator, and all the items were composited and output to digital movie files by Adobe After Effects. Audio narration supplemented the visual explanations offered by each of the MGs. Two of the graphics were high fidelity, which means that they contained multiple shots using several virtual cameras and realistic rendering, and two of the graphics low fidelity, which means that they only contained one shot using a stationary camera and two-dimensional toon shading. The occurrence of a Middle Eastern dust storm was depicted in a high fidelity graphic as well as a low fidelity graphic and so was the behavior of blue marlin (see Figure 1).

Frames from the expository MGs, high fidelity MGs (bottom row) and low fidelity MGs (top row).
Apparatus
The study was conducted in a computer lab equipped with 27-inch Apple iMac desktop computers.
Instruments
The preliminary demographic survey requested information from participants about their age, gender, and where they routinely viewed MGs. The survey also included the presentation quality scale developed by Hegarty et al. (2009). The questionnaire’s six items asked participants to rate how desirable and effective they would find the attributes of three-dimensionality, realism, and intricacy to be during their MG viewing experience.
Each expository MG was followed by three multiple-choice questions and each question featured four response options which were designed to assess the participants’ learning or task performance. The 9-point CL scale was used to document the amount of CL that the participants experienced at various times throughout the study (–4 = very, very low difficulty to 4 = very, very high difficulty).
Intuition rating trials were administered three times during the study and each trial contained two static images depicting the same subject matter: one image was high fidelity and the other low fidelity. The CGI for the static images was generated using Autodesk Maya and the images were output via Adobe Photoshop. Each intuition rating trial required participants to choose what image they thought would be the most helpful in answering questions about the subject matter and then to predict how helpful their choice would be using a symmetrical 7-point scale (–3 = very unhelpful to 3 = very helpful).
MG selection trials were comprised of two parts. The first part recorded what type of expository MG each participant chose to watch at each opportunity to view a graphic and how helpful they predicted the graphic to be on a symmetrical 7-point scale (–3 = very unhelpful to 3 = very helpful). The second part, which was filled out after the participant actually viewed their chosen graphic and asked the person to indicate how helpful the graphic was.
4.3 Design and measures
This section explains the design of the article’s research study and presents the independent and dependent variables that were measured and evaluated. The design of this study was chosen for the purpose of maintaining fidelity to the viewing experience faced by viewers of expository MGs on a daily basis. The study was a quasi-experiment that employed a repeated-treatment design (Shadish et al., 2002) where participants were exposed to expository MGs on two consecutive occasions within the study. There were two within-subjects factors: exposure and MG viewing opportunity. Exposure consisted of the three time points when the participants’ intuitions were recorded and MG viewing opportunity represented each of the times when participants were able to choose an expository graphic to watch. The first MG viewing opportunity was labeled MG1 and the second MG viewing opportunity was labeled MG2.
Intuition trend
The general pattern of intuitions exhibited by the participants was the between-subjects factor and it served as a clustering variable for facilitating data analysis. Participants who chose a high fidelity image on their final intuition rating trial were considered to be naïve whereas individuals who chose a low fidelity image were considered not to be naïve (non-naïve). Meyers et al. (2013) demonstrated the rigor and applicability of clustering or grouping participants based on information acquired during the course of a study and then using the groupings during data analysis. The use of the participants’ final intuition trial choice as a means of clustering is consistent with the research of Smallman and Cook (2011: 597) because the groupings reflect observed patterns of intuitions and allow the researcher to establish the participants’ intuition trend(s). Table 2 displays all the dependent variables and their associated instruments.
Dependent variables and their associated instruments.

Ad-hoc variables calculated after the completion of the study.
IRT stands for intuition rating trial.
Variables related to intuition
Intuition was measured on three occasions: at the beginning of the study before the participants viewed any expository MGs, after the participants viewed their first expository MG, and after the participants viewed their second expository MG. The recurrence of participants’ intuitions was established when participants made the same choice over two consecutive intuition rating trials. The variables measuring recurrence were the initial recurrence rate, which was determined when participants made the same choice for the first and second intuition rating trials, and the secondary recurrence rate, which was determined when participants made the same choice for the second and third intuition rating trials. CL and response times (in seconds) were documented after participants completed each intuition rating trial, which allowed the variables of intuition CL and intuition time to be constructed.
Variables related to exposition
These variables pertained to the efficacy of choices made by the participants regarding which expository MGs they decided to view and these variables addressed how participants subsequently learned from the graphics. MG choice indicated which expository MGs participants chose to view. Predicted helpfulness was participants’ prediction about how helpful they thought that their chosen expository graphic would be during the task of answering comprehension questions. Actual helpfulness documented how helpful the information presented by the chosen expository graphic actually was to the participants when they had to answer the comprehension questions. Help gain was calculated as actual helpfulness minus predicted helpfulness and this variable addressed the congruence (or lack thereof) that existed between participants’ predictions about the how helpful their chosen expository MG would be and how helpful it actually was.
Accuracy, accuracy CL, and accuracy time were the variables that assessed learning. Accuracy was the proportion of correct responses that the participants were able to provide to each expository MG’s trio of multiple-choice comprehension questions. CL was recorded after participants answered each comprehension question. The CL measurements associated with a given MG’s trio of comprehension questions were averaged in accordance with the advice of Van Gog et al. (2012) and this produced accuracy CL. Accuracy time indicated the total amount of time participants spent answering an MG’s set of comprehension questions.
4.4 Procedure
Participants were instructed to proceed through the study at their own pace. At the beginning of the study, the participants completed the preliminary demographic survey. Next, the participants completed the first intuition rating trial, then they completed the first part of an MG selection trial where they were able to choose what expository MG they wanted to watch. After viewing their chosen graphic, the participants answered three comprehension questions associated with the graphic and then they completed the second part of the MG selection trial. They finished a second intuition rating trial followed by a second MG selection trial. The participants viewed their second chosen expository MG, responded to its set of comprehension questions, and completed the final part of the second MG selection trial. Lastly, they finished the final intuition rating trial. Note that the topic at each MG viewing opportunity was randomly alternated for each participant (i.e. some participants viewed dust storm graphics at MG1 and blue marlin graphics at MG2 and vice versa for other participants). Response time and CL were recorded after every activity involved in the study (see Figure 2 for a diagram of the study’s procedure). On average, the participants finished the study within 749.56 seconds (or approximately 12 minutes).

Diagram of the study’s procedure. Each general intuition rating trial is represented by IRT.
4.5 Results
Statistical analysis
Prior to presenting the results of the study’s quasi-experiment, I would like to explain several of the assumptions guiding the data analysis. Power indicates the sensitivity of a study’s design to detect the impact of a treatment and if any differences exists between groups or clusters of participants. Any amount of power at or above .80 indicates that a study was sufficiently powerful, and the study presented in this article had a power of .997 (as calculated by SPSS). The determinants of power are: (1) the sample size employed by the study; (2) the utilization of the correct statistical tests to analyze the data generated from the study and adherence to the assumptions of those tests; and (3) the probability that the design of the study influences the outcomes of the study as reported by the p-value associated with the test statistics produced by the study’s data analysis (p-values below .05 indicate the presence of an effect of the study’s design and p-values above .05 do not). This study utilized a sufficiently large sample size (N = 135). With respect to the second point, the current study used two statistical tests during data analysis: generalized linear mixed modeling and mixed analysis of variance (ANOVA). The data generated by the variable of intuition was categorical (dichotomous) and repeatedly recorded from the same participants, which meant that there were interdependencies (i.e. covariance) within the intuition data that needed to be respected. Standard analytical tests such as chi-square maintain an assumption that the categorical data being analyzed have to be independent. Generalized linear mixed modeling respects the relationships within repeatedly measured (or dependent) categorical data and allows the data to be linked to an appropriate statistical distribution during analysis: see Heck et al. (2012) for a review of generalized mixed modeling with categorical data. The binomial distribution was the statistical distribution for intuition. A mixed ANOVA is based on numerical (continuous) data and the test indicates differences between multiple groups of participants over different periods of time. It is followed by post-hoc comparisons that specify where the differences lie. Both generalized linear mixed modeling and mixed ANOVA tests are reported with an F-value (with degrees of freedom [df1, df2]) and a p-value. Larger F-values (F > 1) indicate that the analysis was precise (Field, 2009). An interaction suggests that the impact that the participants’ intuition trend grouping had on a dependent variable (e.g. intuition or accuracy) may vary as a result of exposure; or that the effect of exposure on a dependent variable may be somehow influenced by intuition trend.
Intuition trend
A total of 104 participants (77%) were categorized as naïve and 31 participants (23%) as non-naïve (see Figure 3).
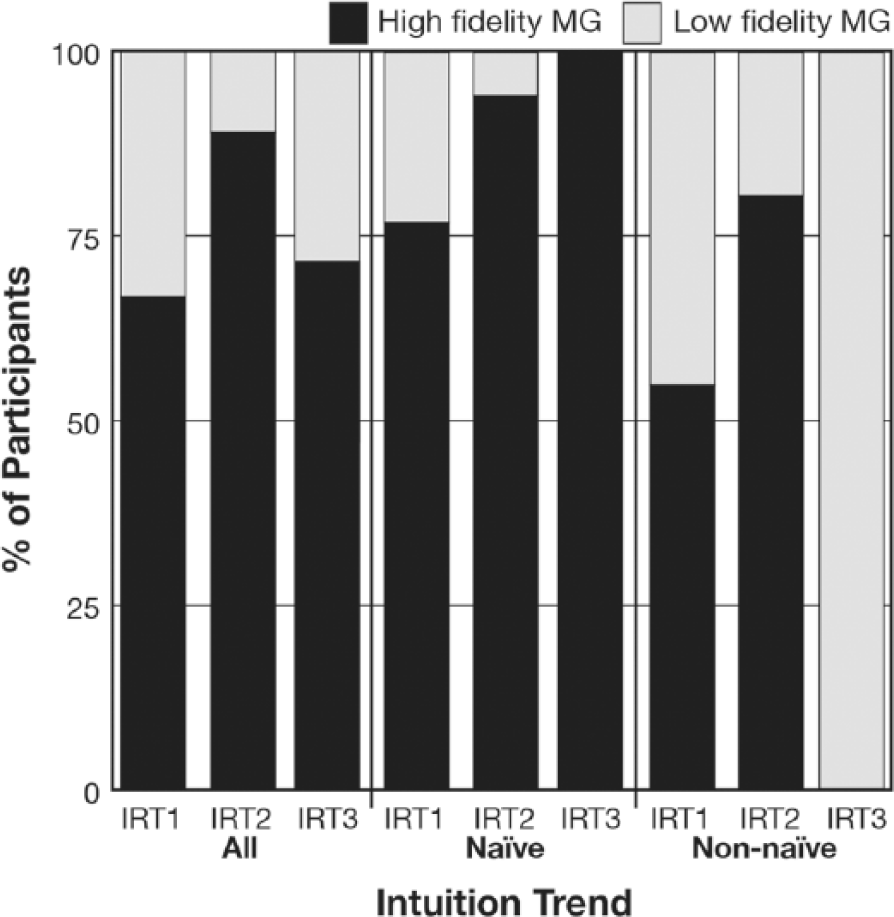
Participants’ intuition choices at each intuition rating trial (IRT) broken down by intuition trend.
Intuition
Generalized linear mixed modeling was applied to intuition and the analysis indicated that intuition trend did interact with exposure to produce an effect on intuition, F(2, 399) = 10.90, p < .001. In general, the majority of participants had a tendency to prefer high fidelity images until they made their final intuition which was after they had viewed the last expository MG and answered its comprehension questions, F(2, 399) = 8.61, p < .001. Between the first and second intuition rating trials there was a 22.3 percent increase in the number of participants preferring high fidelity MGs, but between the second and final intuition rating trials there was a 39.1 percent decrease. Also, the participants differed due to their intuition trends, F(1, 399) = 42.76, p < .001. Overall, a greater number of the naïve group’s participants preferred high fidelity images than participants from the non-naïve group. The aforementioned interaction provides further insight into how the participants’ intuitions fluctuated based on their intuition trends over time. Both groups observed a significant increase in intuitions for high fidelity images after the participants had viewed their first expository graphic but after the participants had viewed their second expository graphic the naïve group’s intuitions for high fidelity images plateau-ed while the non-naïve group’s intuitions for the same type of images dropped markedly. The non-naïve group experienced the greatest fluctuation in intuitions: a 25.8 percent increase in intuitions favoring high fidelity images between the first and second intuition rating trials and an 80.6 percent decrease between the second and final intuition rating trials. The naïve group only experienced 17.3 percent and 5.9 percent increases, respectively.
The remaining variables associated with intuition (intuition helpfulness, intuition CL, intuition time) were examined using 2 (intuition trend) X 3 (exposure) mixed ANOVAs and Table 3 displays these results. As far as intuition helpfulness was concerned, the participants anticipated that their final intuition would be significantly more helpful than their second intuition (see Figure 4). The interaction between intuition trend and exposure only influenced intuition CL to the extent that the non-naïve group experienced a somewhat pronounced increase in the amount of mental effort that they exerted when making their second and third intuitions although their intuition CL was still considered to be in the ‘low’ range (see Figure 5). Intuition time substantially decreased at each successive intuition rating trial (see Figure 6).
Overview of results from mixed ANOVAs on the efficacy of participants’ intuitions.

p < .05; **p < .01; ***p < .001.
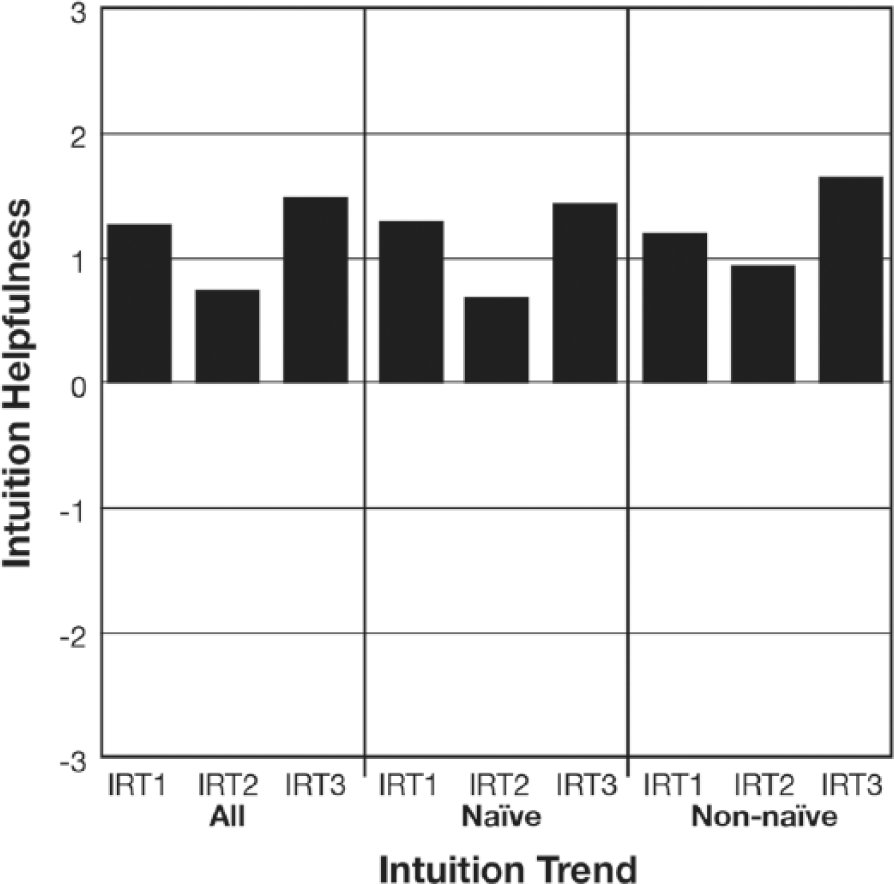
Participants’ intuition helpfulness at each intuition rating trial (IRT) broken down by intuition trend.
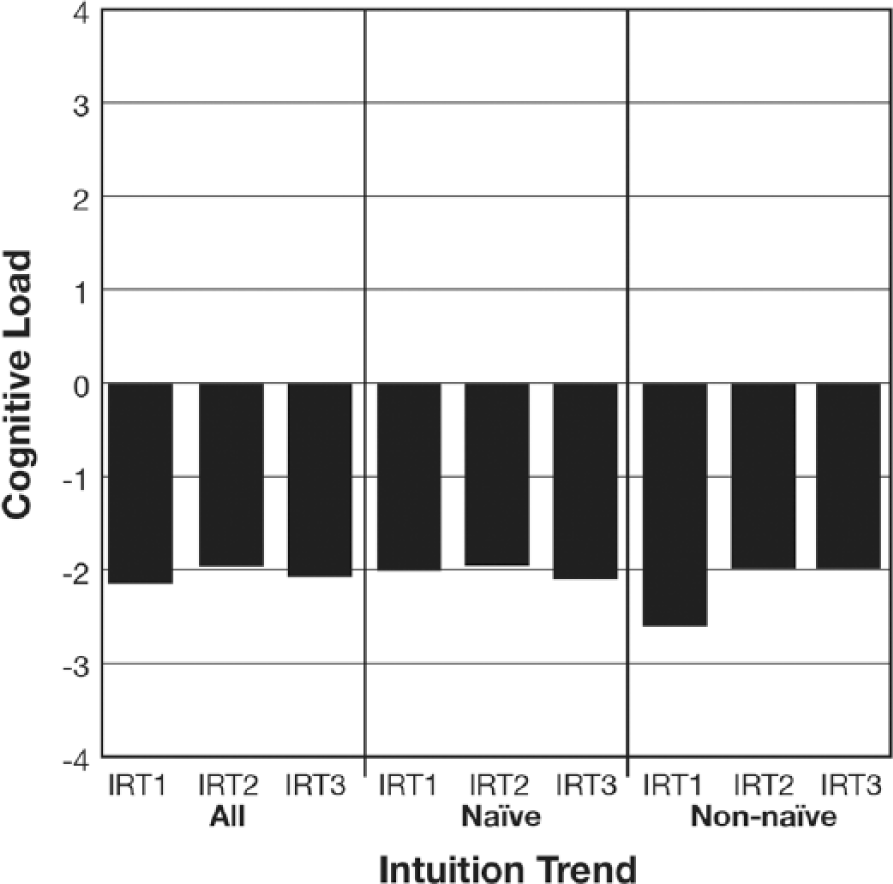
Participants’ intuition CL at each intuition rating trial (IRT) broken down by intuition trend.

Participants’ intuition time at each intuition rating trial (IRT) broken down by intuition trend.
Exposition
Regardless of their intuition trend, most participants overwhelmingly chose to watch high fidelity graphics at both opportunities to view expository graphics (see Figure 7). For each viewing opportunity the means of actual helpfulness were lower than the means for predicted helpfulness. This indicated that the participants anticipated that the expository MGs that they chose would be moderately helpful but then they realized that the graphics were not as helpful as expected (see Figure 8). Predicted helpfulness and actual helpfulness did differ based on the expository MGs that were chosen and subsequently viewed. The analysis utilized two 2 (intuition trend) X 2 (MG viewing opportunity) ANOVAs to evaluate predicted helpfulness and actual helpfulness. Participants found the second graphic that they had chosen to view to actually be significantly more helpful than the first one, F(1, 129) = 9.78, p = .002. The difference in predicted helpfulness between the first chosen expository MG and the second one was marginal, F(1, 129) = 3.81, p = .053. An analysis on help gain revealed that the participants had more divergence between reality and their predictions about their first chosen expository graphic (M = 1.03, SD = 1.39) than their second one (M = 0.35, SD = 1.39), F(1,129) = 14.68, p < .001. This meant that as participants progressed through the study their predictions became more consistent with the exposition the graphics afforded.
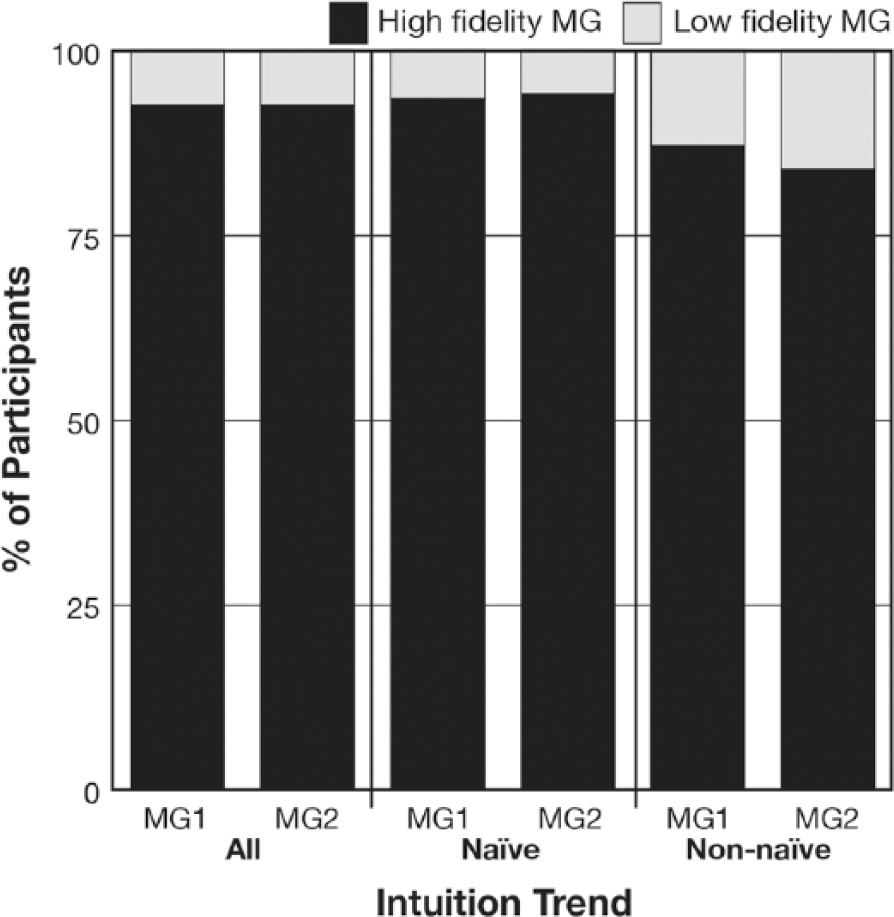
Participants’ MG intuition choices broken down by intuition trend.

The predicted helpfulness and actual helpfulness of the participants’ MG choices broken down by intuition trend.
Accuracy, accuracy CL, and accuracy time were the exposition variables that reflected the efficiency of the participants’ information processing relative to the graphics they viewed. Since almost everyone chose high fidelity expository graphics each time, regardless of their intuition trend, the analysis of accuracy, accuracy CL, and accuracy time will be partitioned by MG viewing opportunity (see Figures 9, 10, and 11). ANOVAs evaluating each of the exposition variables against the opportunities to view the expository graphics indicated that: (1) more accuracy was achieved with the second expository graphic especially when a high fidelity expository MG was chosen, F(1, 133) = 8.46, p < .01; (2) the participants experienced less CL with second expository graphic that they chose, F(1, 133) = 13.69, p < .001; and (3) it took the participants less time to answer its trio of comprehension questions, F(1, 133) = 7.62, p < .01.
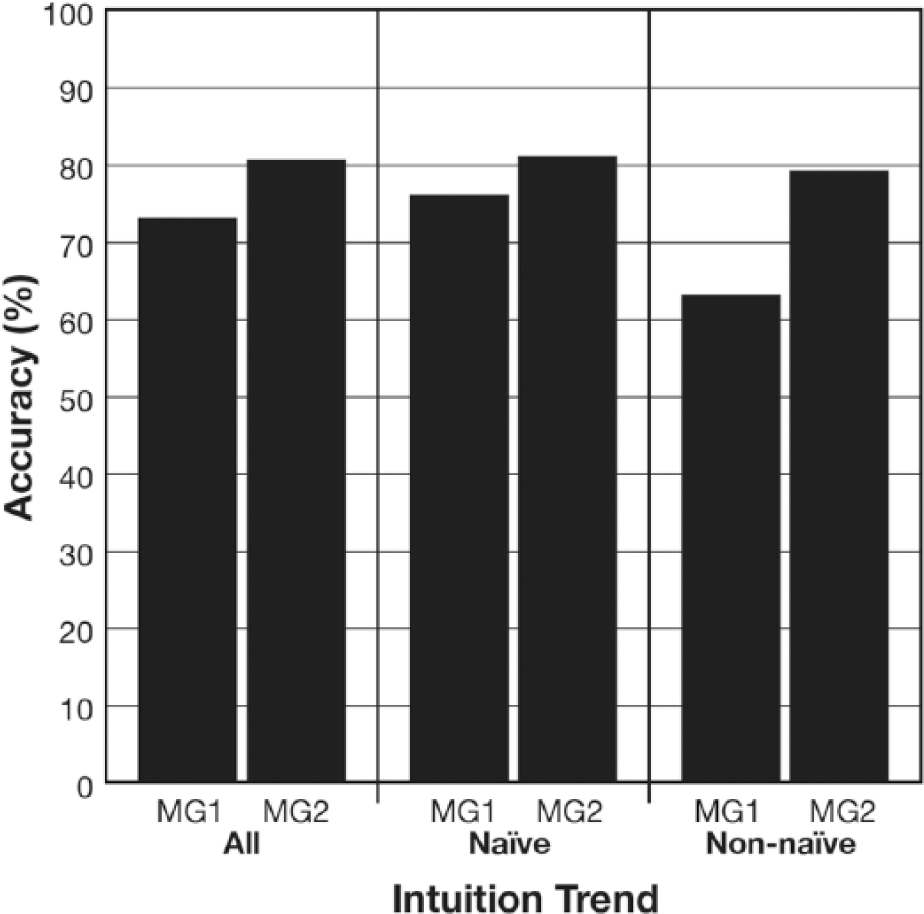
Participants’ accuracy on the comprehension questions associated with each MG broken down by intuition trend.
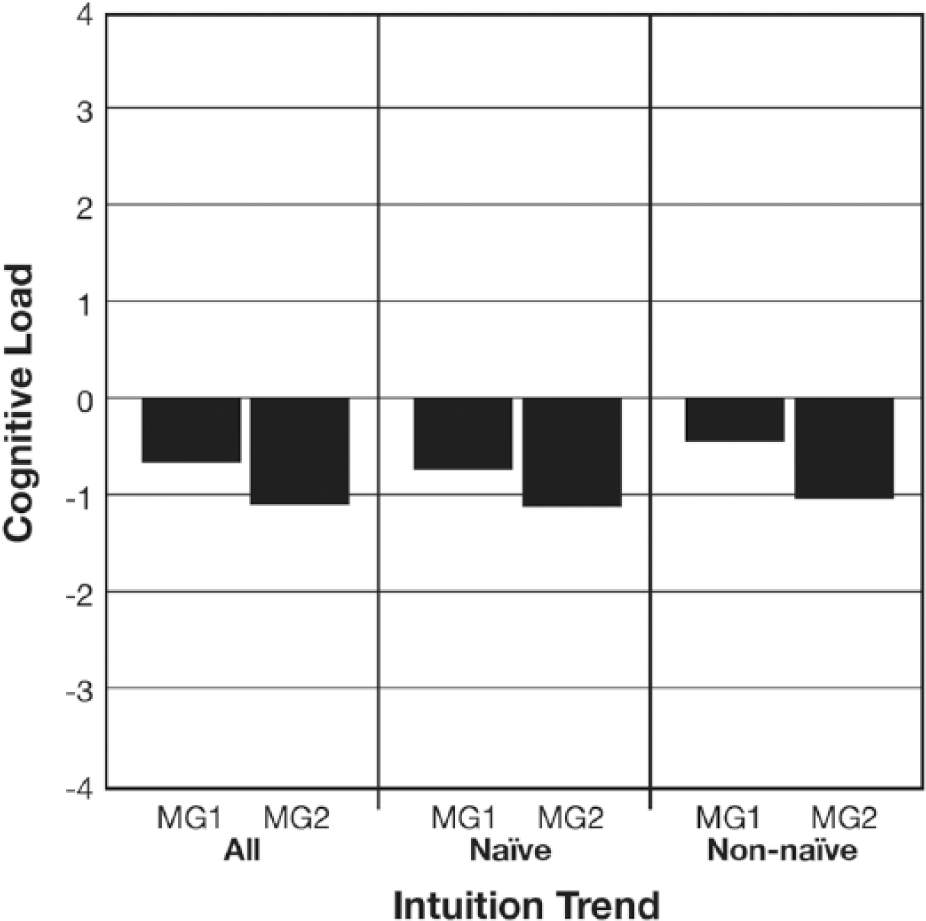
Participants’ accuracy CL on the comprehension questions associated with each MG broken down by intuition trend.
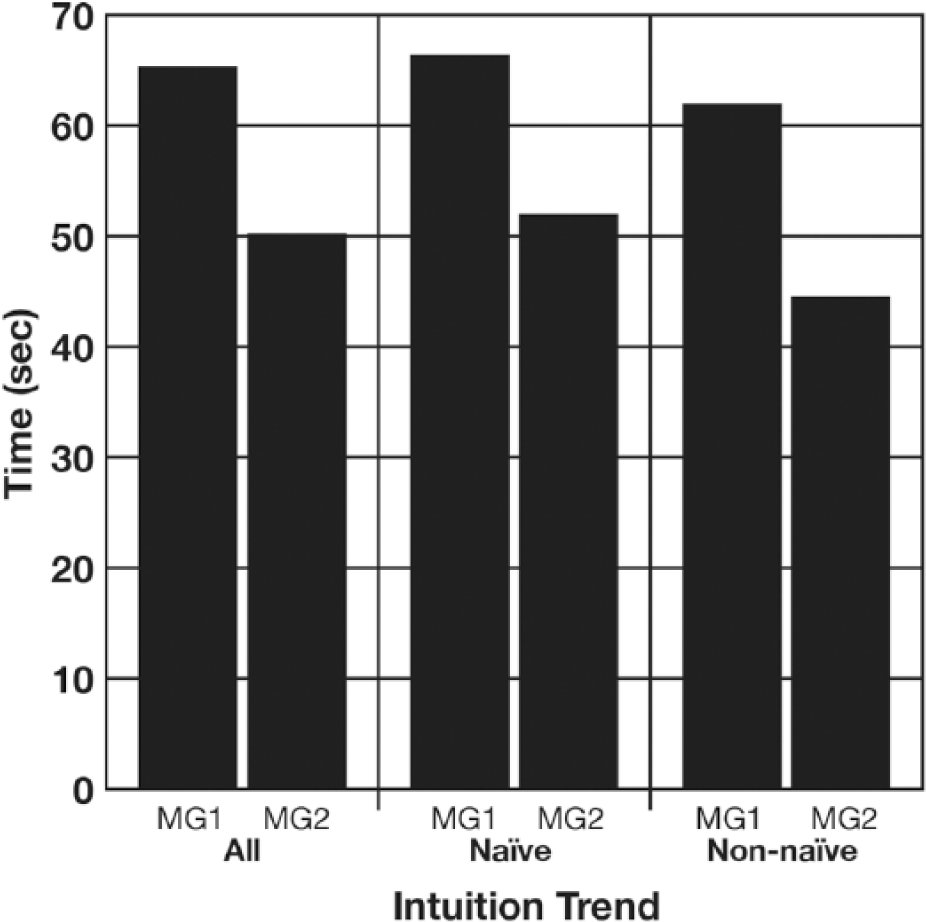
Participants’ accuracy time on the comprehension questions associated with each MG broken down by intuition trend.
Recurrence rates
The two recurrence rates mainly consisted of successive intuitions where participants preferred high fidelity expository graphics (see Figure 12). The initial recurrence rate was lower than the secondary recurrence rate and a generalized linear mixed model substantiated this difference. The majority of the participants from the naïve group and the non-naïve group had intuitions favoring high fidelity expository graphics at the initial recurrence rate but this pattern changed at the secondary recurrence rate. There the naïve participants still favored high fidelity MGs but the non-naïve participants favored low fidelity MGs. According to a generalized linear mixed model intuition trend and the recurrence rates interacted such that there were marked differences within and between the naïve group’s and non-naïve group’s initial and secondary recurrence rates, F(1, 266) = 18.46, p < .001. The naïve group’s initial and secondary recurrence rates steadily increased over time and remained higher than the non-naïve group’s rates which decreased about 29.5 percent by the end of the study.
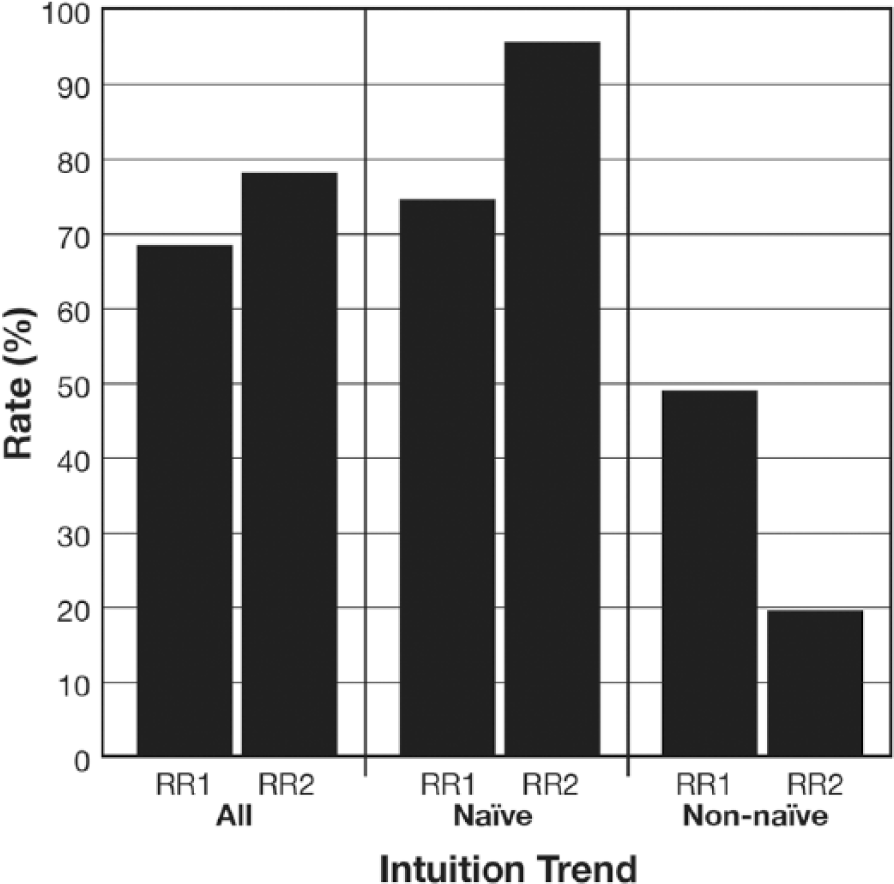
Participants’ primary recurrence rate (RR1) and secondary recurrence rate (RR2) broken down by intuition trend.
5 Discussion and conclusion
The study presented in this article sought to explore how complex animation influenced the viewing experience associated with expository MGs by shadowing participants as they reported their intuitions about graphics and as they made choices about what expository MGs to view. Two theories were used to facilitate this inquiry: the theory of naïve realism and cognitive load theory. The main premise of the theory of naïve realism is that task performance can be enhanced or maximized if VMS such as MGs are devoid of excessive detail such as complex animation, which has the potential to produce visual clutter. According to the theory of naïve realism is a behavior that is exhibited when an individual chooses to view a high fidelity MG and use it as a basis for task performance.
The study presented in this article was not conducted without limitations. There were only two opportunities in this study for participants to choose and view expository MGs but future research may need to involve more opportunities to fully understand recurrence rates and the persistence of certain intuitions. Also, more measures that assess the content of participants’ mental models needed to have been incorporated into this study. Cognitive task analysis is an apt methodology for truly decomposing mental models and understanding how they implicate task performance. Lastly, because this study was a quasi-experiment with a repeated-treatment design it did not use a control group of participants to provide an objective contrast for the present findings.
The findings of this study have demonstrated that complex animation has value in the context of expository MGs and that the efficacy of visual explanations can benefit from complex animation. Venues where expository MGs are employed such as news simulations and online news packages should include expository MGs with complex animation to supplement the content. The same admonition applies to documentaries and informational television programming that employs graphics during cut-away sequences intended to offer visual explanations of subject matter. This article makes a contribution to the sparse literature pertaining to MGs and complex animation by evaluating the efficacy of expository MGs and by attempting to characterize the MG viewing experience. Further research should endeavor to expand the theoretical synthesis of the theory of naïve realism and cognitive load theory, and examine graphics in both expository and entertainment contexts.
Footnotes
Funding
This research received no specific grant from any funding agency in the public, commercial, or not-for-profit sectors.