



Abstract
In three experiments, a virtual preparation for humans of the Morris water task (VMWT) was used. Experiment 1 established that four landmarks were of similar salience. Then, in Experiments 2 and 3, participants were trained to locate a hidden platform in the presence or either two or four of the previous landmarks. In Experiment 2, one pair of groups was trained with four visual landmarks spaced at equal intervals around the edge of the pool, while a second pair was trained with two landmarks only, either relatively close to or far from the hidden platform. After training, a reciprocal overshadowing effect was found: on a test without the platform with two landmarks only (either close to or far from the platform position), the participants trained with four landmarks spent less time in the platform quadrant than those trained with only two. Finally, Experiment 3 showed that at least participants trained with two landmarks relatively close to the platform and then tested with four also performed worse on test than those trained and tested with two close landmarks only. This result suggests that generalisation decrement, rather than associative competition, could provide a sufficient explanation for the overshadowing observed in Experiment 2 in the proximal groups. The present set of experiments extend, although only partially, the generalisation decrement results documented in rats to human participants.
In recent years, it has been shown that the spatial and the temporal domains often obey the same associative laws (for reviews, see Chamizo, 2003; Leising & Blaisdell, 2009). The same seems to be true when dealing with geometric and non-geometric information (for reviews, see Pearce, 2009; Tommasi, Chiandetti, Pecchia, Sovrano, & Vallortigara, 2012). Experiments where cue competition designs are used (i.e., blocking and overshadowing), especially those obtained with strictly spatial tasks, are a good demonstration in favour of the first claim. In spatial blocking pretraining on one set of landmarks often interferes with learning about another set when participants have to find a hidden goal (in rats see Biegler & Morris, 1999; Roberts & Pearce, 1999; Rodrigo, Chamizo, McLaren, & Mackintosh, 1997; in humans, Hamilton & Sutherland, 1999; Wilson & Alexander, 2010). Demonstrations of spatial overshadowing are less frequent in the literature. The term overshadowing refers to the finding that the presence of a second relevant cue will cause animals to learn less about a first than they would have done if trained on the first cue in isolation (Kamin, 1969; Pavlov, 1927). A critical question of interest is can one landmark be overshadowed by another landmark? One study by Sánchez-Moreno, Rodrigo, Chamizo, and Mackintosh (1999) offers a good example of spatial overshadowing in an attempt to answer the previous question.
The experiments by Sánchez-Moreno et al. (1999) were designed to see whether two landmarks, a visual one and an auditory one, placed in the same location, would overshadow each other (specifically, the visual landmark was a green plastic plant that included an auditory component—effectively, white noise─, produced by a small radio hidden among the leaves, with a non-tuned broadcasting station switched on). Rats were trained in a Morris pool to locate a hidden platform. The location of the platform was defined by four visual landmarks, A, B, C, and D, spaced at equal intervals round the edge of the pool. Control animals were trained with these four visual landmarks only. But for animals in overshadowing groups, an auditory component, X, was added to landmark D. Control by D was assessed by testing animals with A, C, and D, and control by X by testing animals with A, C, and X. Rats were also tested with A, B, and C, to see whether they had learned the basic spatial discrimination. Animals trained with both components (one auditory, the other visual) present performed less accurately on test with either component than did animals initially trained with that component alone. Therefore, a reciprocal overshadowing was obtained. Moreover, the final experiment suggested that an appeal to generalisation decrement (i.e., to the fact that there was a greater change between training and testing for overshadowing groups—see Pearce, 1987, 1994) was insufficient to explain the previous results, which are those expected by any associative learning theory. It seems probable that the overshadowing effect observed by Sánchez-Moreno et al. (1999) occurred because the two landmarks in question, D and X, were in exactly the same position, and in that sense were truly redundant. (Similar results have been found by Blaisdell, Denniston, and Miller [1998] in the temporal domain. They found greater overshadowing by associative competition in Pavlovian conditioning between two cues that bore exactly the same temporal relation to the delivery of the unconditioned stimulus [US] than between two cues providing slightly different temporal information about the delivery of the US).
In Pavlovian conditioning, overshadowing depends on the relative salience of both overshadowing and overshadowed stimuli (Mackintosh, 1976), on their relative temporal proximity to reinforcement (Revusky, 1971), and on their relative validity (Wagner, 1969b)—i.e., whether the reinforcer is also signalled by other events. This Pavlovian phenomenon is traditionally explained by theories (such as Mackintosh, 1975; Pearce & Hall, 1980; Rescorla & Wagner, 1972) that appeal to some form of associative competition. But when rats are trained in a circular pool with four equally salient landmarks spaced at equal intervals around the pool, it is not clear that some landmarks will be better predictors of the location of the platform than others. It is true that some will be closer to the platform than others (see Chamizo, Manteiga, Rodrigo, & Mackintosh, 2006, for a demonstration that a landmark close to the platform may overshadow one further away), but this difference may be largely counteracted by the fact that rats start each trial from different positions in the pool, are free to swim around the pool, and will therefore approach the platform from different directions (via different landmarks) on different trials. Following this argument, each landmark could provide an independent solution for the location of the platform. Therefore, it is possible that any overshadowing observed in this preparation may not be due to associative competition. All this reasoning was present in the previous study by Chamizo, Rodríguez, Espinet, and Mackintosh (2012), which addressed this question. In this study, rats were trained in a circular pool to find a hidden platform whose location was defined by several landmarks (either two or four). The question of interest was whether animals trained with four landmarks spaced at equal intervals round the edge of the pool would perform less accurately when tested on either a configuration of two landmarks (either two proximal landmarks in relation to the platform, or two relatively distal landmarks in relation to the platform) than animals that had learned to find the hidden platform on the basis of two landmarks alone (either proximal or distal in relation to the platform). Equally important was to see whether animals initially trained with two landmarks (either proximal or distal in relation to the platform) but subsequently tested with four landmarks would perform less accurately than other rats trained and tested with the same two landmarks (either proximal or distal in relation to the platform). The results showed that both the addition of two new landmarks and the removal of two old ones disrupted performance. A result that is consistent with a generalisation decrement analysis, instead of associative competition.
Because behaviour is lawful, and the best way to discover these laws is through controlled experiments, the purpose of the present study was to investigate whether the previous results found in rats could also be extended to humans. It is worth noting that nowadays a lot of effort is being devoted to successfully develop the next generation of animal models, tools, and technologies that would lead to the development of effective therapies—for example, to treat disorientation problems in the old age and in several mental disorders like Alzheimer disease. In this sense, it has been shown that virtual environments are very useful (Fernandez Montenegro & Argyriou, 2017; Gazova et al., 2012; Li & Singh, 2014). Moreover, we have seen that rat spatial navigation is susceptible to a performance decrement when new landmarks are added to already trained landmarks (Chamizo et al., 2012) and also that non-spatial human learning shows a comparable effect (e.g., Glautier, 2004; Thorwart & Lachnit, 2009). On this basis, then we would expect human spatial navigation to mirror the rat literature. This was the purpose of the current study.
In the present set of experiments, a virtual preparation of the Morris water task was used with Psychology students as participants. Four virtual landmarks were used. Would Psychology students perform like the non-human participants in the adapted task?
Experiment 1
Four virtual landmarks were employed: a pink sphere, a green cylinder, a blue cone, and a yellow cube. They were centred in the same place in relation to a hidden goal. The aim in Experiment 1, a single landmark-learning experiment, was to determine if the four landmarks had a similar salience. Preliminary work with the landmarks had shown no difference at all between them (neither in males nor in females) when they were placed relatively near to the platform. However, things were not so clear when the single landmarks were placed relatively far from the platform; females showed a clear tendency to perform worse than males did. For this reason, only female participants participated in Experiment 1 and the single landmarks were always placed relatively far from the platform. Because Chamizo, Rodrigo, Peris, and Grau (2006) have shown that salient landmarks control navigation to a higher degree than less salient landmarks, if the four landmarks had the same salience, the four landmarks would acquire the same control of the participant’s performance.
Method
Participants
The participants were 32 female psychology students from the University of Barcelona who were between 18 and 30 years old (M = 21.41; se ±0.48). They were divided at random into four groups (of 8 participants each). Each group was assigned with a specific landmark: A sphere (Group Sphere), a cylinder (Group Cylinder), a cube, (Group Cube), and a cone (Group Cone). The participants had no prior knowledge of the experiment’s hypothesis, and they received course credits for their participation.
Materials
We conducted the experiment in a room with four individual compartments. Each compartment was equipped with a PC computer that had a colour monitor, a set of headphones, and a chair from which the participants could comfortably reach the keyboard of the computer. Each monitor had a 15-in. diagonal screen and was equipped with a WinFast 3D Graphic card, which allows accelerated graphics and high-resolution configurations. The programme language used to run the experiments was C++/Open GL (a software interface for 3D graphics, with hardware developed by Silicon Graphics, California, USA). Each computer was programmed to control the presentation of the virtual environment (which was in a first person perspective), the auditory information (a background sound, and positive and negative feedback sounds), and to register both the time taken by the participants to reach the platform in the escape trials and the time spent in the correct quadrant (where the platform should have been) in the test trials. The auditory positive feedback consisted of a brief song (“That’s all folks”) that lasted 3 s. The auditory negative feedback consisted of an unpleasant melody (the sound of mournful bells, three times) that also lasted 3 s. The auditory background sound was slightly unpleasant in order to generate some distress in the participants and thus to reproduce the conditions of an escape task. All the auditory information was presented through headphones, and the visual information was presented through the colour monitor. In order to navigate, the participants had to use three of the keyboard arrow keys. The “up” arrow key controlled forward movement, the “right” arrow key turning right, and the “left” arrow key controlled turning left.
The virtual space was an octagonal swimming pool (radius = 100 units) modelled after that used by Chamizo, Aznar-Casanova, and Artigas (2003-see also Artigas, Aznar-Casanova, & Chamizo, 2005). This length, 100 units, implies that a participant could cross the diameter of the pool in a minimum time of approximately 4 s, and perform a complete turn (360°), without any displacement, in approximately 2.5 s. These speeds (speed = space/time) to move ahead and to turn around are equivalent to those used by Chamizo et al. (2003- see also Artigas et al., 2005). The pool was situated in the middle of the virtual space (centred in coordinates: 0,0), had a red wall that could not be crossed, and was filled with a blue surface (i.e., the “water”). The pool was surrounded by a pale blue surface. The single object (i.e., a different one for each group) was placed hanging from an invisible ceiling. A circular platform (radius = 8 units) could be placed in the pool, slightly below the surface of the “water” (i.e., an invisible platform), as shown in Figure 1 (top). The landmarks used in this experiment (and also in the remaining experiments of this study) were three-dimensional objects of similar size (approx. radius = 10 units). They were as follows: a pink circular sphere, a green cylinder, a blue cone, and a yellow cube.

Top: A schematic representation of the pool and the position of the single landmark (X), as well as the hidden platform and the facing positions (I, II, III, and IV) for Experiment 1. X was a different landmark for each group (i.e., a sphere, a cone, a cylinder, and a cube). Bottom: A schematic representation of the pool and the position of the four landmarks (A, B, C, and D), as well as the hidden platform and the facing positions (I, II, III, and IV) for Experiments 2 and 3.
Procedure
The experiment lasted one session, and the participants were tested individually. There were four individual compartments within the experimental room. At the beginning of the experiment, the participants had to read specific instructions presented on the screen to become familiar with the task. All of the instructions were in Spanish. Any question was then answered by the researcher in charge of the study. The first piece of information that the participants received is transcribed below: This experiment will last about 20 min and it will consist of several trials. Imagine that you have been swimming for a long time in a circular pool from which you are not able to get out of and that you are very tired. You will only be able to rest if you find a floating platform. Your task consists of reaching it. On the first two trials you will see the platform. In the following trials you will not be able to see it, but you can be sure that it will always be in the same position in relation to one object surrounding the pool.
Following this information, the participants had a drawing similar to the schematic pool in Figure 1, with the main exception that no platform was indicated (only the shape of the pool and the single object, X). To the right of this drawing, inside a rectangular frame, whose title was “Being at the helm,” information to navigate was presented to all the participants. It was indicated, with symbols, that the vertical arrow meant “advance”; the arrow facing right, “turn to the right”; and the arrow facing left, “turn to the left.” Then, a new paragraph with the following information followed: To move, please use the navigation keys (see above “Being at the helm”). When you find the platform you will hear the song “That’s all folks,” and then a new trial will begin. If you do not find the platform in the permitted time for each trial, mournful bells will sound and then a new trial will begin. At the beginning of each trial, you will always find yourself in the middle of the pool (facing either North, South, East, or West). Please try to find the platform as quickly as you can. When you think you have understood the instructions, click on OK to begin a trial. If you have not understood, ask the experimenter. Good luck!
To start the experiment, after the participants had indicated verbally that they had understood the instructions, they had to click one OK button on the keyboard. Following this, a new screen was presented telling them that they had to click on OK again, and then, they found themselves in the middle of the pool (facing either North, South, East, or West—see Figure 1). Trials 1 and 2, with a visible platform and no landmark present, were escape-from-the-water preliminary trials, to familiarise the participants with the task. The student was given 60 s to reach the platform. Reaching the platform was rewarded by playing the song “That’s all folks” and also ended the trial. Then, there were 24 escape trials with the hidden platform and one landmark present (each group with a different landmark, always placed relatively far from the platform). Finally, there was a test trial that did not contain the platform, and in which, the training landmark was presented to each group. During the escape trials, the platform was located in the South-East quadrant for all the participants. The four possible starting views were equally used for each of them. Each test trial lasted a maximum of 60 s.
The escape trials were identical to the preliminary trials, although with the single landmark and the hidden platform present, as shown in Figure 1 (top). The participants received 24 consecutive trials, with an average intertrial interval (ITI) of approximately 10 s. Each student was given a maximum of 60 s to find the platform. As in the preliminary trials, reaching the platform was rewarded by playing the song “That’s all folks” and also ended the trial. Then, a new screen with a rectangular framed message appeared. This frame had the written instruction “click on OK to continue.” When that happened, a few seconds afterwards another screen appeared, whose composition was a square frame (containing a small symbol and the address of the University of Barcelona), and the rectangular frame “Being at the helm,” both at the top of the screen, and below this the following phrase: Your attention please, when you click on OK the next trial will begin.
If a participant did not find the platform within 60 s, the trial ended and the mournful sound was presented. Then, the instructions appeared on the screen and he or she had to click on OK twice to begin a new trial. The platform was invisible for all the participants. At the beginning of each trial, the participants in all groups found themselves in the centre of the pool (i.e., coordinates 0,0) facing equally often all four cardinal positions (North, South, East, and West) at the beginning of a trial.
Following escape trials, all of the participants underwent a test trial, without the platform but with the training landmark present, that lasted for 60 s. Participants in all groups found themselves in the middle of the pool, equally often facing in all four cardinal positions (North, South, East, and West). For purposes of recording the participant’s behaviour, on the test trial, the pool was divided into four quadrants of 90º (where the platform should have been, right to it, left to it, and opposite to it), and the amount of time the participants spent in the correct quadrant (where the platform should have been) was recorded. Importantly, because the programme used allowed calculating the time it took each student to start moving (i.e., the latency of the response), this latency was recorded for subsequent analysis. This time was also subtracted from the total time (60 s) available. Therefore, the final test data are presented in percent of time spent in the platform quadrant.
A significant level of p < .05 was adopted for the statistical tests reported in this article. Only significant results are presented.
Results and discussion
Figure 2 (top) shows the mean escape latencies of the four groups during acquisition. In this experiment, and also in the remaining ones, the trials in this phase were analysed in blocks of two. An analysis of variance (ANOVA), with groups (Sphere, Cylinder, Cone, and Cube) and blocks of trials (1-12) as factors revealed that the only significant effect was blocks of trials, F(11, 308) = 7.47 (p < .001, η2 = 0.201). No other main effect or interaction was significant (Fs < 1). All participants improved their performance as blocks went by.
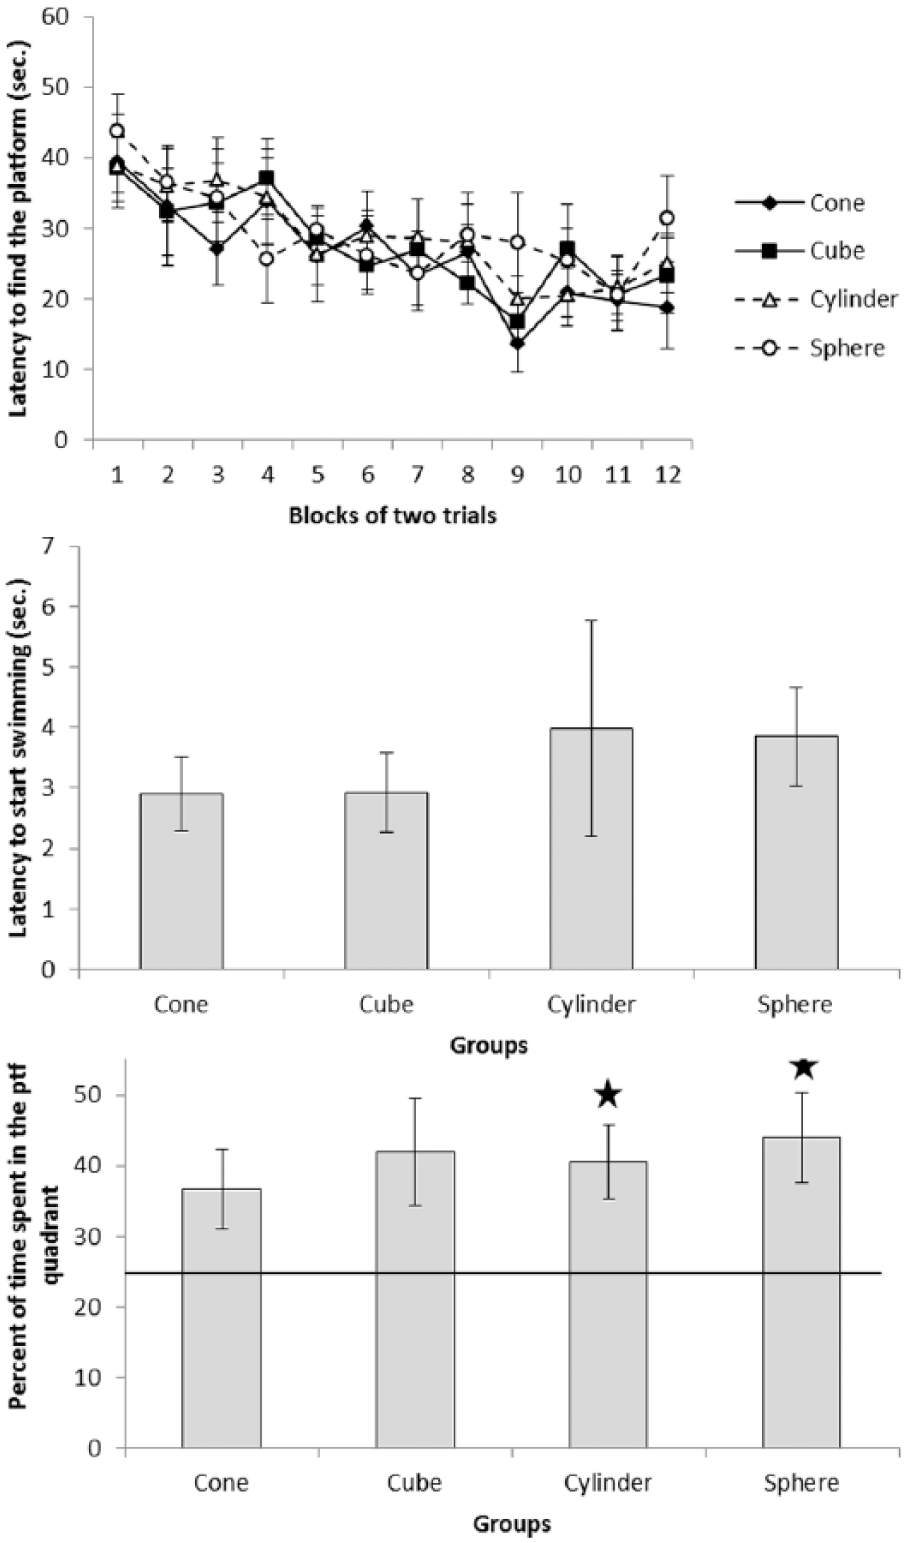
Experiment 1. Top: Mean escape latencies made by the participants during landmark learning. Middle: Mean escape latencies made by the participants to start moving in the test trial. Bottom: Mean time spent in the platform quadrant by the participants during the test trial. Error bars denote standard error of means. A small asterisk above each bar indicates whether the participants’ performance differed significantly from chance (i.e., horizontal line, 15 s).
Figure 2 (middle) shows the mean latency of the four groups to start moving (Sphere, Cylinder, Cone, and Cube) in the test trial. All the latencies were very similar, and an ANOVA confirmed that there were no statistical differences between the groups (F < 1).
Figure 2 (bottom) shows the percent of time that the four groups spent in the platform quadrant during the test trial. Student t tests were used to compare the participant’s performance in the four groups with chance (i.e., 25% spent searching in the quadrant where the platform should have been) in order to evaluate whether the test results reflected significant spatial learning. Only two groups differed from chance: Group Sphere, t(7) = 2.99 (p = .020), and Group Cylinder, t(7) = 2.92 (p = .023). The other two groups were close to the significance level: Group Cone, t(7) = 2.06 (p = .079) and Group Cube, t(7) = 2.23 (p = .061). A subsequent ANOVA showed that the groups did not differ among themselves, F < 1.
Experiment 2
Although in Experiment 1 the four landmarks acquired the same control of the participants’ performance, when comparing the groups against chance the result of two of them were worse than the result of the remaining two landmarks. Therefore, in Experiments 2 and 3, the pink sphere and the green cylinder (i.e., the two landmarks that differed from chance) were always used as the distal landmarks (A and D), while the blue cone and the yellow cube (i.e., the two landmarks that did not differ from chance) were always used as the proximal landmarks (B and C). The reason for this selection was to counteract the possible harmful effect of the relative distance to the hidden platform. Working with rats (Chamizo, Manteiga, et al., 2006 −see also Chamizo & Rodrigo, 2004) it has been shown that the relative distance to the hidden platform can determine differences in salience between landmarks.
Experiment 2 asked whether a configuration formed by two proximal landmarks would overshadow the configuration formed by two relatively distal landmarks, and vice versa. As in the study by Chamizo et al. (2012, Experiment 1), the participants were trained either with a configuration of four landmarks (i.e., A, B, C, and D, in Figure 1, bottom), or with a configuration of only two landmarks (specifically, with B and C, or with D and A in Figure 1, bottom). The design of Experiment 2 is illustrated in Table 1. The main question of interest was whether participants trained with the four landmarks would perform less accurately when tested on either configuration of two landmarks alone than participants that had learned to find the hidden platform solely on the basis of the configuration of two landmarks.
Design of Experiment 2.

The experiment was conducted with four groups of participants. Four landmarks were used (as shown in Figure 1, bottom). For two groups, the position of the hidden platform was predicted by the four landmarks simultaneously present (4-landmark groups) while for the remaining two groups, the location of the hidden platform was predicted either by the two proximal landmarks (B and C—Group 2-2P) or by the two distal landmarks (D and A—Group 2-2D) only. A subsequent test trial, without the platform, was conducted with only the proximal landmarks (i.e., with B and C) or the distal landmarks (i.e., with D and A).
Method
Subjects and materials
The participants were 28 male and 28 female psychology students from the University of Barcelona who were between 18 and 36 years old (M = 20.64; se ±0.40). They were divided at random into four groups (of 7 males and 7 females each). The participants had no prior knowledge of the experiment’s hypothesis, and they received course credits for their participation. The experiment was conducted in the same room and with the same equipment used in Experiment 1.
Procedure
The instructions were very similar to those in Experiment 1, as well as the general procedure, although with a few exceptions. After preliminary trials, which were identical to those in Experiment 1, there were 24 escape trials with the hidden platform and with either two or four landmarks present. The participants were divided into four groups: two 2-landmark groups (2-2P and 2-2D) and two 4-landmark groups, one eventually tested with the two proximal to the platform landmarks (Group 4-2P), the other tested with the two distal to the platform landmarks (Group 4-2D). Thus, for two groups (4-2 groups), the position of the hidden platform was predicted by the four landmarks simultaneously present, while for the remaining two groups, the location of the hidden platform was predicted either by the two proximal landmarks (B and C—Group 2-2P) or by the two distal landmarks (D and A—Group 2-2D). Following acquisition, all the participants had a test trial (trial 25), without the platform, with only the proximal landmarks (i.e., with B and C) or the distal landmarks (i.e., with D and A). The amount of time the participants spent in the correct quadrant (where the platform should have been) was recorded. As in Experiment 1, the latency of the response was also measured and this time was subtracted from the total time (60 s) available. Therefore, the final test data are presented in percent of time spent in the platform quadrant.
Results and discussion
Because the sex variable (both in Experiment 2 and in Experiment 3) has only been marginally significant, in the present study, we have decided to collapse the data of both sexes to simplify the analyses. Figure 3 (top) shows the mean escape latencies during the escape trials in blocks of two trials. An ANOVA conducted on these data with the variables of blocks (1-12), number of landmarks present (4, 2), and position (proximal, distal), revealed that the variables blocks, F(11, 572) = 20.66 (p < .001; η2 = 0.277); group, F(1, 52) = 24.42 (p < .001; η2 = 0.255); and position, F(1, 52) = 11.72 (p = .001; η2 = 0.123), were significant, as well as the group x position interaction, F(1, 52) = 7.52 (p = .008; η2 = 0.079). No other main effect or interaction was significant (Fs < 1). The analysis of the group x position interaction revealed that in the two groups trained with two landmarks only (Group 2-2P and Group 2-2D), the participants trained with the proximal landmarks reached the platform faster than those students trained with the distal landmarks, F(1, 26) = 12.00 (p = .002; η2 = 0.316). This result reveals that the effectiveness of the two configurations of landmarks was not the same, proximal landmarks are better than distal ones. As expected, the two groups trained with the four landmarks (groups 4-2P and 4-2D) did not differ (F < 1). In addition, in both positions (proximal and distal), the two groups trained with the four landmarks reached the platform faster than their specific control groups, trained with two landmarks only, F(1, 26) = 5.17 (p = .032; η2 = 0.166) and 19.27 (p < .001; η2 = 0.426), proximal and distal, respectively.
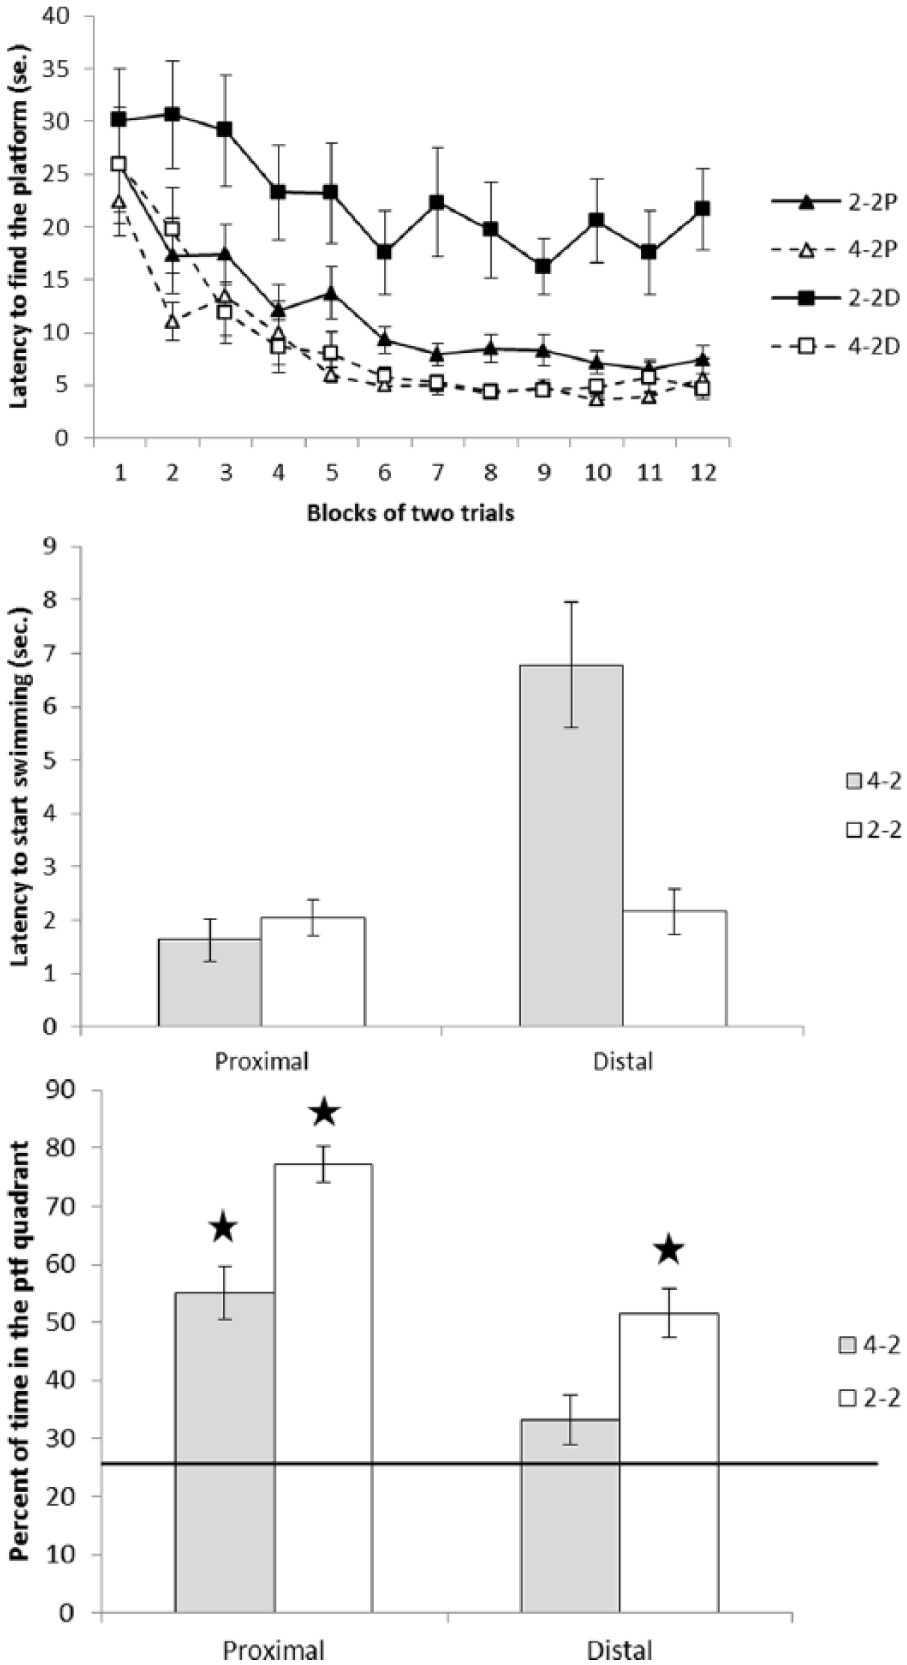
Experiment 2. Top: Mean escape latencies made by the participants during landmark learning. Middle: Mean escape latencies made by the participants to start moving in the test trial. Bottom: Mean time spent in the platform quadrant by the participants during the overshadowing test trial. Error bars denote standard error of means. A small asterisk above each bar indicates whether the participants’ performance differed significantly from chance (i.e., horizontal line, 15 s).
Figure 3 (middle) shows the mean latency to start moving in the four groups during the test trial. Those participants trained with 4 landmarks and tested with the distal ones (4-2, Distal) took longer to start swimming than the other three groups. An ANOVA conducted on these data, taking into account, the variables of number of landmarks present during training (4, 2) and position (proximal, distal), revealed that the effect of the number of landmarks was significant, F(1, 52) = 9.61 (p = .003, η2 = 0.106) as well as the variable position, F(1, 52) = 15.12 (p < .001, η2 = 0.167). The interaction between these variables was also significant, F(1, 52) = 13.82 (p < .001; η2 = 0.153). The analysis of the interaction revealed that Group 4-2D took longer to start moving than both Group 4-2P, F(1, 28) = 17.25 (p < .001; η2 = 0.399), and Group 2-2D, F(1, 28) = 13.63 (p = .001; η2 = 0.344). No other comparisons were significant (Fs < 1). It is possible that these results show the difficulty that the participants had in orienting themselves when the proximal landmarks were removed. In other words, in the presence of a set of landmarks, those near the goal location, are more salient and have more informative value, than those that are further away.
Figure 3 (bottom) shows the percent of time in the platform quadrant of the four groups (4-2P, 2-P, 4-2D, 2-D) during the test trial. Student t tests were used to compare the participants’ performance in the four groups with chance (i.e., 25% spent searching in the quadrant where the platform should have been) in order to evaluate whether the test results reflected significant spatial learning. All groups differed from chance, minimum t(13) = 5.98, and all ps < .001, with the exception of group 4-2 tested with the distal landmarks, t(13) = 1.87, p = .084. An ANOVA conducted on these test data taking into account the variables number of landmarks present during training (4, 2), and position (proximal, distal) revealed that the effect of the number of landmarks was significant, F(1, 52) = 24.20 (p < .001, η2 = 0.220), with the groups trained and tested with only two landmarks spending more time in the platform quadrant than the groups trained with the four landmarks and then tested with any two, as well as the variable position, F(1, 52) = 33.46 (p < .001, η2 = 0.305) (with the participants tested with the proximal landmarks spending more time in the platform quadrant than those tested with the distal landmarks). The interaction Group x Position was not significant (F < 1). These results reflect an overshadowing effect since Group 2 performed more accurately than Group 4. In addition, it was clear that, overall, the proximal landmarks controlled the participants’ searching behaviour better than the distal landmarks.
In conclusion, a significant overshadowing effect was observed. The overshadowing was reciprocal, with proximal landmarks overshadowing distal landmarks, and distal landmarks overshadowing proximal landmarks. These results clearly replicate those previously found by Chamizo et al. (2012) with rats. In addition, proximity to the goal seemed to be important in determining the effectiveness of landmarks in guiding navigation: on the test trial without the platform the proximal landmarks controlled the searching behaviour to a higher degree than the distal landmarks (for a related finding see Artigas et al., 2005; Chamizo, Artigas, Sansa, & Banterla, 2011; in rats, Chamizo, Manteiga, et al., 2006; Civile, Chamizo, Mackintosh, & McLaren, 2014).
Experiment 3
In Experiment 2, a reciprocal overshadowing effect between proximal and distal landmarks was found. Overshadowing between proximal and distal landmarks in terms of associative competition is not easily reconciled with the observation that, at least rats, apparently learn about all four equally spaced landmarks in other experiments (Prados & Trobalon, 1998; Rodrigo et al., 1997). But one possible explanation of overshadowing is to appeal to the concept of generalisation decrement. Generalisation decrement from training to test would be greater for subjects trained with four landmarks than for those trained with only two. It is possible therefore that the overshadowing observed in Experiment 2 is a case of generalisation decrement (Pearce, 1987, 1994), as was the case with rats (Chamizo et al., 2012). Participants trained with four landmarks (with A, B, C, and D) may have performed less accurately when tested with either set of two landmarks alone (B and C or D and A) than subjects initially trained with these components in isolation, because B and C or D and A alone are perceived as different from A, B, C, and D, and responding established to one configuration of stimuli does not transfer perfectly to a different configuration (Pearce, 1987, 1994). Experiment 3 considered a test for this explanation. Some participants were initially trained with B and C (Group Proximal), while other students were initially trained with D and A (Group Distal). On completion of training, half the participants in each group were tested with the same landmarks, proximal participants with B and C and distal participants with D and A, while the remaining half of each group were tested with landmarks A, B, C, and D. The design of Experiment 3 is illustrated in Table 2. Note that in this experiment, the variable Groups refers to the number of landmarks presented on the test trial rather than the number of landmarks present during acquisition, as in Experiment 2 (see Chamizo et al., 2012, Experiment 2).
Design of Experiment 3.

Method
Subjects and materials
The participants were 32 male and 32 female psychology students from the University of Barcelona who were between 18 and 44 years old (M 22.79; se ±0.65). They were divided at random into four groups (of 8 male and 8 female each). The participants had no prior knowledge of the experiment’s hypothesis, and they received course credits for their participation. The experiment was conducted in the same room and with the same equipment used in Experiments 1 and 2.
Procedure
The instructions were very similar to those in Experiments 1 and 2, as well as the general procedure, although with a few exceptions. After preliminary trials, there were 24 escape trials with the hidden platform and two landmarks present only (two groups with the landmarks relatively proximal to the platform, and the remaining groups with the two landmarks relatively distal to the platform). For the proximal groups (2P-2 and 2P-4), the landmarks present were those close to the hidden platform (i.e., B and C); for the distal groups (2D-2 and 2D-4), the landmarks present were those relatively far from the hidden platform (i.e., D and A). The test trial, Trial 25, did not contain the platform, and it was as follows: Group 2P-2 was tested in the presence of landmarks B and C, while group 2D-2 was tested in the presence of landmarks D and A. The remaining two groups (2P-4 and 2D-4) were tested in the presence of all four landmarks, A, B, C, and D. On the test trial, the amount of time the participant spent in the platform quadrant was recorded. As in Experiments 1 and 2, the latency of the response was also measured and this time was subtracted from the total time (60 s) available. Therefore, the final test data are presented in percent of time spent in the platform quadrant.
Results and discussion
Figure 4 (top) shows the mean escape latencies during the escape trials in blocks of two trials. An ANOVA conducted on these data taking into account the variables blocks (1-12), and position (proximal, distal), revealed that the variables blocks, F(11, 682) = 16.52 (p < .001, η2 = 0.207), and position, F(1, 62) = 96.29 (p < .001, η2 = 0.608), were significant. The interaction blocks x position was not significant (F = 1.12). Although all participants improved their performance as training trials progressed, the participants trained with the pair of proximal landmarks reached the platform faster than those trained with the pair of relative distal landmarks.

Experiment 3. Top: Mean escape latencies made by the participants during landmark learning. Middle: Mean escape latencies made by the participants to start moving in the test trial. Bottom: Mean time spent in the platform quadrant by the participants during the overshadowing test trial. Error bars denote standard error of means. A small asterisk above each bar indicates whether the participants’ performance differed significantly from chance (i.e., horizontal line, 15 s).
Figure 4 (middle) shows the mean latency to start moving in the four groups (2P-4, 2-P, 2D-4, 2-D) during the test trial. It is evident that those participants trained with 2 distal landmarks and tested with all four (i.e., group 2D-4) took longer to start moving than the other three groups. An ANOVA conducted on these data with the variables of number of landmarks at test (4, 2), and position (proximal, distal) revealed that the effect of the number of landmarks was significant, F(1, 60) = 8.14 (p = .006, η2 = 0.106) (with Group 2-2 spending less time to start swimming than Group 2-4), as well as the variable position, F(1, 52) = 7.49 (p = .008, η2 = 0.098) (with those participants trained with the proximal landmarks spending less time to start swimming than the participants trained with the distal landmarks). The interaction group x position was not significant (F = 1.03). However, since this pattern of data was very similar to that observed in Experiment 2, despite the differences in experimental manipulation, it made sense to perform pairwise comparisons.
These analyses revealed that the Group 2D-4 took longer to start moving than both Group 2P-4, F(1, 30) = 4.89 (p = .035; η2 = 0.140), and Group 2-D, F(1, 30) = 5.04 (p = .032; η2 = 0.144). The comparison between Group 2-P and Group 2P-4 was close to the significance level, F(1, 30) = 3.274 (p = .080, η2 = 0.098). Finally, the comparison between Group 2-D and Group 2-P was not significant (F = 2.65).
It is possible that the results show the difficulty that the participants had to orient themselves when the proximal landmarks were added. Therefore, proximity to the goal seemed to be important in determining the effect of the added landmarks on the test trial without the platform: The addition of the new proximal landmarks altered the searching behaviour more than the addition of the new distal landmarks. Figure 4 (bottom) shows the amount of time spent by the participants in the platform quadrant during the 60-s test trial. We used Student t tests to compare the participants’ performances in the four groups with chance (i.e., 25% spent searching in the quadrant where the platform should have been) to evaluate whether the test results reflected significant spatial learning. The performance of all groups differed from chance, minimum t(15) = 4.94, and all ps < .001. An ANOVA conducted on the test data with the variables of the number of landmarks at test (2-4, 2-2), and position (proximal, distal), revealed an effect of the number of variables, F(1, 60) = 4.70 (p = .034, η2 = 0.065), and position, F(1, 60) = 5.36 (p = .024, η2 = 0.074). The interaction was not significant (F = 2.32, p = .133, η2 = 0.032). Those participants, tested with two landmarks (either proximal or distal) had a better performance than groups (either proximal or distal) tested with the four landmarks. Although the interaction group x position was not significant, Figure 4 (bottom) shows that Group 2P-2 has a better performance than Group 2P-4, and this difference was not observed between Group 2D-2 and Group 2D-4. Thus, it made sense perform pairwise comparisons.
These analyses revealed that, as expected, Group 2P-2 performed better than both Group 2P-4, F(1, 30) = 5.47 (p = .026; η2 = 0.154), and Group 2D-2, F(1, 30) = 7.12 (p = .012; η2 = 0.192). Likewise, the comparisons between Group 2D-4 and Group 2D-2, and between Group 2D-4 and Group 2P-4 were not significant (Fs < 1).
In conclusion, Experiment 3 showed a significant generalisation decrement effect, although only in the proximal groups. Responding established to the configuration formed by B and C did not transfer well to a different configuration (to A, B, C, and D). This result is entirely consistent with the idea that test performance was affected by generalisation decrement. Thus, generalisation decrement, rather than associative competition, can provide a sufficient explanation for the overshadowing observed in Experiment 2 in the proximal groups. However, no effect was found in the distal groups. Responding established to the configuration formed by A and D transferred well to a different configuration (to A, B, C, and D). Taken together, the results of Experiment 3 replicate, although only partially, those obtained by Chamizo et al. (2012) in rats, where a significant reciprocal generalisation decrement between proximal and distal landmarks was found.
General discussion
The results of Experiment 1 allowed us to decide which landmarks were more appropriate for the two configurations needed in the following experiments, Experiment 2 and Experiment 3. Then, Experiment 2 addressed overshadowing. Specifically, we asked whether a configuration formed by two proximal to the platform landmarks will overshadow the configuration formed by two relatively distal to the platform landmarks, and vice versa. A reciprocal overshadowing effect between proximal and distal landmarks was found. Finally, Experiment 3 addressed generalisation decrement. The results of this experiment revealed that, in the proximal groups only, what could be initially considered as overshadowing by associative competition between configurations of landmarks could be in fact a case of generalisation decrement. Responding established to the configuration formed by B and C (i.e., the two proximal landmarks) did not transfer well to a different configuration (to A, B, C, and D). We attributed this result to generalisation decrement. No effect was found in the distal groups. After training with only two distal landmarks, no difference was found between group 2-4 in comparison to group 2-2 in the test trial. Therefore, although Experiment 2 has replicated the results by Chamizo et al. (2012) with non-human participants, that is not the case with Experiment 3, which has only replicated the results of the previous study with rats in the proximal groups. We do not know what the differences between non-human subjects and human subjects may be due to. It is possible that there are important differences in the two tasks, and also in the motivation of the subjects, who may be affecting these results.
From a generalisation decrement perspective, it was expected that a change between training and testing would produce a less accurate performance on test than when no change between these two phases occurred. Accordingly, we predicted groups 2-4 spending less time in the platform quadrant than groups 2-2. But this was true only in the proximal groups. Another factor to consider refers to the possibility that adding two wholly novel landmarks for a test trial disrupted performance, by a process akin to Pavlov’s (1927) concept of external inhibition (i.e., a decrease in the strength of the conditioned response due to the presentation of a novel stimulus at the same time as the conditioned stimulus). For example, two different results could be expected, one for the proximal groups and a different one for the distal groups. After training with only two proximal landmarks, with B and C, the addition of landmarks A and D on test may lead to the participants approaching and exploring these landmarks. If so, such an exploration will reduce the searching time in the platform quadrant, which is away from the new objects added. Consequently, it could be expected group 2P-4 spending less time in the platform quadrant than group 2P-2, as was the case. On the other hand, after training with only two distal landmarks, with A and D, the addition of landmarks B and C on test may lead to the participants approaching and exploring these landmarks. If so, such an exploration converges in the platform quadrant. Consequently, it could be expected group 2D-4 spending more time in the platform quadrant than group 2D-2, but this was not the case. However, it is also possible that the two factors have acted and been mutually counteracted, which could explain the results obtained in the distal groups, which do not differ between them. Admittedly, we do not know why proximity to the goal location of the new added landmarks should have a differential effect in non-human and in human participants. Therefore, we have to conclude that the present set of experiments only partially extend the generalisation decrement results documented in rats (Chamizo et al., 2012) to human participants.
There is ample evidence in the literature that sometimes animals and humans can rely preferentially on nearer landmarks. Spatial contiguity explains that landmarks at the goal or very near the goal can act as the best predictors of the goal location (with humans and a virtual preparation see Artigas et al., 2005; Chamizo et al., 2011; with rats, Chamizo, Manteiga, et al., 2006; Civile et al., 2014. For a review of landmark use, see Cheng & Spetch, 1998). In a study by Spetch (1995), pigeons and humans were tested using a touch-screen procedure and computer-generated landmarks. An invisible target was placed at a fixed distance and direction from one or more landmarks. In both species, Spetch found that the control over the response (pecking for pigeons and pressing for humans) acquired by a landmark a given distance from the target was reduced or overshadowed by the presence of another landmark closer to the target (with rats, see Chamizo, Rodrigo, et al., 2006).
Overshadowing effects are predicted by most current theories of associative learning. In fact, finding such an effect is often considered a demonstration that we are dealing with a standard associative paradigm. But apparent overshadowing is susceptible to alternative interpretations. One uninteresting possibility, noted by Wagner (1969a), is that since an overshadowing group will be trained with more relevant cues than a control group, it may make fewer errors while learning the task. This possibility is ruled out by the finding that in Experiment 2 (and also in Experiment 3), at least in the proximal groups, overshadowing and control groups did not differ in their latency to find the platform on escape trials given at the training phase.
A second possibility is that overshadowing can be explained simply by appeal to generalisation decrement: Animals trained with an AB compound and tested with B alone, experience a greater change from training to test than those trained and tested with B alone. This is of course the explanation of overshadowing provided by Pearce’s (1994) configural theory, and by Wagner and Brandon’s (2001) replaced element model. The present results in fact show that this is a real possibility. In Experiment 2, participants trained with all four landmarks were tested with a different configuration (only two landmarks), while participants trained with only two landmarks were tested with the same configuration as they had been trained with. Similarly, in Experiment 3, when all participants were trained with only two landmarks, for those tested with all four landmarks, there was a change from training to test, while for those tested with only two landmarks, there was none. Although the results of Experiment 3 do not prove that generalisation decrement can explain the apparent overshadowing effect observed in Experiment 2, they are consistent with such an explanation at least with the proximal groups. More research is needed with the distal groups.
We claim that redundant landmarks may overshadow one another in a spatial task just as redundant cues overshadow one another in experiments on Pavlovian or instrumental conditioning (for a critical example, with rats, see Sánchez-Moreno et al., 1999; with pigeons, Leising, Garlick, & Blaisdell, 2011; with pigeons and humans, Spetch, 1995; with humans and a virtual preparation, Chamizo et al., 2003). The same is true when geometrical and non-geometrical cues are used. Landmarks can overshadow, or be overshadowed by geometrical information (Cole, Gibson, Pollack, & Yates, 2011; Graham, Good, McGregor, & Pearce, 2006; Gray, Bloomfield, Ferrey, Spetch, & Sturdy, 2005; Horne & Pearce, 2011; Kosaki, Austen, & McGregor, 2013; Pearce, Graham, Good, Jones, & McGregor, 2006; Redhead, Hamilton, Parker, Chan, & Allison, 2013; Rodríguez, Chamizo, & Mackintosh, 2011).
The results by Sánchez-Moreno et al. (1999) are those expected by any standard associative learning theory, but when the landmarks are spaced evenly round a pool, as in the present experiments with human participants, so that each can provide an independent directional fix on the location of the platform, they do not seem to overshadow each other by associative competition. In this case, both with rats and humans, an appeal to generalisation decrement could be sufficient to explain the results.
Footnotes
Declaration of conflicting interests
The author(s) declared no potential conflicts of interest with respect to the research, authorship, and/or publication of this article.
Funding
The software for this study was designed by J.A. Aznar-Casanova. This research was supported by a grant from the Spanish “Ministerio de Ciencia e Innovación” (Ref. PSI2013-47430P) to VDC.