
Abstract
Our decision to believe what another person says can be influenced by vocally expressed confidence in speech and by whether the speaker–listener are members of the same social group. The dynamic effects of these two information sources on neurocognitive processes that promote believability impressions from vocal cues are unclear. Here, English Canadian listeners were presented personal statements (She has access to the building) produced in a confident or doubtful voice by speakers of their own dialect (in-group) or speakers from two different “out-groups” (regional or foreign-accented English). Participants rated how believable the speaker is for each statement and event-related potentials (ERPs) were analysed from utterance onset. Believability decisions were modulated by both the speaker’s vocal confidence level and their perceived in-group status. For in-group speakers, ERP effects revealed an early differentiation of vocally expressed confidence (i.e., N100, P200), highlighting the motivational significance of doubtful voices for drawing believability inferences. These early effects on vocal confidence perception were qualitatively different or absent when speakers had an accent; evaluating out-group voices was associated with increased demands on contextual integration and re-analysis of a non-native representation of believability (i.e., increased N400, late negativity response). Accent intelligibility and experience with particular out-group accents each influenced how vocal confidence was processed for out-group speakers. The N100 amplitude was sensitive to out-group attitudes and predicted actual believability decisions for certain out-group speakers. We propose a neurocognitive model in which vocal identity information (social categorization) dynamically influences how vocal expressions are decoded and used to derive social inferences during person perception.
Introduction
Evaluating interpersonal believability and trust is a critical social skill for humans, affecting cognition (Adolphs, 2002; Fiske & Neuberg, 1990; Krueger et al., 2007; McArthur & Baron, 1983) and adaptive functions, such as promoting reciprocal behaviour (Tanis & Postmes, 2005), facilitating collaborations (Fareri, Chang, & Delgado, 2015), and biasing important decisions (e.g., in political elections, Chen, Jing, & Lee, 2014). Research is demonstrating how verbal descriptions and/or facial cues influence believability impressions, trust-related decisions, and their underlying neurocognitive response (Castle et al., 2012; Dzhelyova, Perrett, & Jentzsch, 2012; Long, Jiang, & Zhou, 2012; Meconi, Luria, & Sessa, 2014; Riedl & Javor, 2012; Sessa & Meconi, 2015; Stanley et al., 2012; Wincenciak, Dzhelyova, Perrett, & Barraclough, 2013). Curiously, the manner in which trust-related impressions are formed from a person’s voice have rarely been examined, nor are the associated neurocognitive mechanisms well understood. Empirical attention to how a speaker’s voice guides social inferences about other people (person perception) is long overdue; for example, learning how vocal cues are used to make trust-related decisions in daily life can inform popular debate about whether statements made by public figures should be believed, as these impressions are often strongly biased by the speaker’s voice.
In this study, we recorded event-related brain potentials (ERPs) to examine how listeners use voice information to form impressions about whether they should believe statements made by an unfamiliar speaker. Our goal was to elucidate the perceptual and cognitive operations associated with this process and to define the time course of the underlying neural response for the first time. More specifically, we sought to understand the interplay of two sources of voice information that promote impressions of believability and trust (Jiang, Sanford, & Pell, 2018): cues that express a speaker’s confidence level when uttering a statement (confident vs. doubtful voice) and knowledge associated with the group membership of a speaker, as implied by their accent (in-group vs. out-group status in relation to the listener). Our approach will contribute to a new understanding of how the neurocognitive system uses voice information to make trust-related decisions during spoken interactions.
Believability and vocally expressed confidence
Social impressions are formed based on the individuating characteristics of another person and/or by categorising them in some way (Fiske & Neuberg, 1990). When one narrows in on the case of how believability impressions are derived from spoken language, a listener evaluates cues provided by the speaker as they make a statement (e.g., word choices, vocal expressions), but can also draw upon different sources of knowledge and experience associated with the speaker (e.g., group-related stereotypes, information about the number of peers who previously endorsed the truthfulness of a statement; Frank, Feeley, Paolantonio, & Servoss, 2004; Giffin, 1967).
One of the potential individuating features available to a listener is a speaker’s vocally expressed confidence level as they make a statement, which has been strongly linked to impressions of speaker believability (Jiang, Sanford, & Pell, 2017; Jiang et al., 2018). A confident voice tends to be more low-pitched, louder, and spoken at a faster rate than voices expressing doubt (S. Brennan & Williams, 1995; Jiang & Pell, 2017). A high and/or rising tone of voice, the use of fillers (e.g., um, uh), and frequent pauses in an utterance are known to mark a speaker’s doubt or uncertainty (Corley & Stewart, 2008; Smith & Clark, 1993). According to pragmatic theory, vocal confidence expressions serve as “evidentiality” devices for inferring the reliability, correctness, or truth value of what is expressed by the speaker (Caffi & Janney, 1994). Vocal cues perceived as lacking confidence have largely negative social implications, impairing speaker credibility when making marketing, political, and legal statements (Boyle & Brodsky, 2012; Leigh & Summers, 2013; Markham, 1968; Ruva & Bryant, 2004) and promoting more effortful comprehension in daily conversations (Arnold, Hudson Kam, & Tanenhaus, 2007; Barr & Seyfeddinipur, 2010; S. Brennan & Schober, 2001). In contrast, vocal cues signalling confidence tend to have positive effects on the perception of speaker trust and credibility, such as when government officials communicate messages of public risk (Montrey, 2005; Reynolds, 2011). These findings emphasise that vocal confidence expressions are a key factor in the process of evaluating interpersonal believability, trust, and related social traits from spoken language.
The neurocognitive mechanisms underlying different stages of vocal expression analysis have been associated with different ERP effects. In general, the fronto-central N100 has been linked to the extraction of acoustic cues that differentiate the identity of vocal signals, such as frequency and intensity parameters (e.g., Paulmann & Kotz, 2008). The fronto-central P200 has been associated with early attentional allocation or evaluation of vocal signals, after initial analysis of acoustic information (Kotz & Paulmann, 2011; Schirmer & Kotz, 2006), to ensure preferential processing of vocal stimuli of high motivational significance (Pell et al., 2015). The late positive component (LPC) or P300, often centro-posteriorly maximised and peaking as early as 300 ms, is likely to involve multiple in-depth processes for (re-)evaluation of the meaning of vocal expressions. In some cases, the N400, which may merge into a late sustained negativity, is thought to index the integration of the meaning of vocal signals into the communicative context (Jiang, Li, & Zhou, 2013; Van Berkum, van den Brink, Tesink, Kos, & Hagoort, 2008).
Specific neurocognitive mechanisms for decoding and construing meaning from vocal confidence expressions have recently been studied (Jiang & Pell, 2015, 2016a, 2016b). Jiang and Pell (2015) presented short personal statements (She has access to the building) expressed in a confident, “close-to-confident,” or doubtful manner to English listeners, who rated the speaker’s confidence level on a 5-point scale for each vocal expression while the electroencephalography (EEG) was recorded. For these utterances, only vocal attributes, and not the semantic context, provided meaningful cues about the speaker’s confidence level. Results showed that highly confident statements increased the P200 response relative to doubtful statements (Jiang & Pell, 2015). This pattern implies that attentional resources were rapidly deployed to decode confident voices, which were registered as more motivationally significant for rating the speaker’s confidence level (Jiang & Pell, 2015). Compared to confident voices, close-to-confident and doubtful vocal expressions elicited an increased late positivity (P300/Late Positive Component, Jiang & Pell, 2015, 2016b), suggesting that these vocal expressions require a more fine-grained cognitive analysis as the utterance unfolded, allowing their meaning to be differentiated at a later stage (Kotz & Paulmann, 2011). Interestingly, follow-up studies revealed that when statements containing vocal confidence expressions were preceded by a congruent or incongruent hedge phrase (e.g., “Maybe,” “For sure”), exposing listeners to conflicting confidence-related speech cues increased the N400, P300/LPC, and the delayed positivity effect (see Jiang & Pell, 2016a for details).
These experiments underscore that confidence-related vocal cues are decoded rapidly in speech and fully elaborated over multiple neurocognitive stages, consistent with three-stage models of vocal expression processing (Kotz & Paulmann, 2011; Schirmer & Kotz, 2006). Moreover, it would seem that when vocal confidence expressions are somehow ambiguous or evaluated in demanding situations (e.g., when verbal and vocal cues conflict), processes for updating a mental representation of speaker meaning, and for using this information to generate social inferences about the speaker, are indexed by late neural responses as an utterance continues to unfold (Jiang & Pell, 2016a, 2016b). This evidence can be used here to investigate the time course for making believability inferences based on the vocal confidence attributes of a speaker.
Recently, Jiang et al. (2017) investigated the functional neural architecture underlying how listeners use vocally expressed confidence to infer that a speaker’s statement is believable (as opposed to rating how confident a speaker sounds). In a functional magnetic resonance imaging (fMRI) design, 26 English-speaking Canadians used a 4-point scale to rate how believable the speaker sounds after listening to personal knowledge statements expressed in a confident, doubtful, or neutral tone of voice. Results uncovered a fronto-temporal network which responded differently to each vocal expression type: the left superior and inferior frontal gyri were more activated for confident statements and the right superior temporal gyrus (STG) for doubtful expressions. The activation in the bilateral cerebellum was observed for statements produced in a neutral (“prosodically unmarked”) voice, suggesting that distinct neural mechanisms were involved when socio-inferential demands on the vocal expression were high, given that neutral statements lack explicit vocal markers for inferring believability (Jiang et al., 2017; see also Hensel, Bzdok, Müller, Zilles, & Eickhoff, 2015). Evidence that distinct neural circuitry is engaged when using confident, doubtful, and neutral expressions to render believability judgements supplies further context to inform and motivate the present work.
Believability, accent, and the in-group bias
In addition to vocal expressions that refer to a speaker’s confidence level, believability impressions can be affected when speakers are not perceived to be part of the listener’s “in-group”; this occurs due to categorization processes that play a role in social impression formation and decision-making (Fiske & Neuberg, 1990). Social categorization based on voices can occur in a number of ways but is readily inferred from the speaker’s manner of pronunciation in the target language. Accents rapidly mark the out-group status of a speaker based on perceived differences in the first language of the speaker, their geographical or cultural background, and/or social orientation (Bresnahan, Ohashi, Nebashi, Liu, & Shearman, 2002). Accent is a salient cue in person perception (Cargile, Giles, Ryan, & Bradac, 1994; Giles, 1970), and having an out-group accent is typically associated with negative social repercussions (“social stigma”; Gluszek & Dovidio, 2010). In-group favouritism can be triggered by many types of foreign accents that diverge from the perceived norm (Bresnahan & Kim, 1993; Bresnahan et al., 2002; Rubin & Smith, 1990), leading to the activation of stereotypes and discriminatory behaviours (Cargile et al., 1994). For example, a negative bias towards out-group members has been linked to reduced impressions of the intelligence (Bradac, 1990; Lindemann, 2003), competence (Boyd, 2010; Bresnahan et al., 2002), social status and solidarity (Giles & Ryan, 1982), and credibility (Hanzlíková & Skarnitzl, 2017; Lev-Ari & Keysar, 2010) of accented speakers. Despite some inconsistent results (e.g., no negative bias towards out-group members, Souza & Markman, 2013), it is shown that negative stereotypes can even be activated without accurately recognising the source of the speaker’s accent (Lindemann, 2005).
Accented speakers are generally characterised as less reliable in conveying their intentions, whether they are foreign-language speakers or speak a regional variant of the listener’s native language; this may be due to the fact that listeners form a more ambiguous representation of their message (Gill, 1994; Lev-Ari, 2015; Lev-Ari & Keysar, 2012). In one study, listening to in-group speakers resulted in an increased positivity (800–1,200 ms) for ungrammatical versus grammatical utterances, whereas foreign-accented speech yielded no difference in this time frame. However, listening to sentences with semantically incongruent words resulted in comparable N400 in response to these words for speakers with different accents (Hanulíková, van Alphen, van Goch, & Weber, 2012). This effect was interpreted as evidence that foreign accents require a greater reliance on contextual knowledge (regarding the distribution of grammatical errors in speakers with certain non-native accents) when building a non-native representation from a semantically congruent utterance. Another experiment, involving participants with a southwestern British dialect, found that listening to northern regional accents of English increased the early phonological mismatch negativity (PMN) response (200–350 ms) in relation to the native accent; in contrast, listening to foreign (Polish) accents reduced the PMN and the subsequent semantic N400 response (Goslin, Duffy, & Floccia, 2012). These findings exemplify that processes for constructing a mental representation of an utterance vary in fundamental ways when listening to in-group and out-group speakers (Ellis et al., 2015; Foucart et al., 2015; Hatzidaki, Baus, & Costa, 2015; Romero-Rivas, Martin, & Costa, 2015) and that these processes may be further influenced by the type of out-group accent (e.g., regional vs. foreign). These fundamental differences imply that social inferences generated about in-group/out-group speakers, such as believability judgements, are likely to differ in their nature and/or time course at the neurocognitive processing level.
In addition to accent-induced differences in language processing, listeners may exhibit greater emotional sensitivity to speakers of their own accent when compared to out-group speakers. In an fMRI study in which British English participants passively listened to number lists, hearing in-group speakers heightened the neural response in the bilateral amygdalae, right Rolandic operculum (extending to STG), and anterior cingulate cortex when compared to out-group speakers with regional English accents (Bestelmeyer, Belin, & Ladd, 2015). These differences in functional brain activity were attributed to the preferential attitude listeners hold towards the native accent (in-group bias), highlighting additional ways that the brain might respond differently to in-group versus out-group voices as social inferences are formed. Note, however, that studies on vocally induced group differences in social inferences typically did not take a speaker’s tone of voice into account. Moreover, individual attitudes about accent cues are likely to vary depending on particular stereotypes held about a speaker’s nationality or background (Frumkin, 2007; Kristiansen, 2001; but see Gill, 1994), the perceived familiarity, (dys)fluency and intelligibility of the accent (Bresnahan et al., 2002; Cargile & Giles, 1997; Ryan, 1983; Souza & Markman, 2013), the degree of nonstandardness in the accent (E. Brennan & Brennan, 1981; Bresnahan et al., 2002), and even whether the listener and speaker share group membership (Hanzlíková & Skarnitzl, 2017). These variables must be kept in mind when examining the impact of attitudes towards particular out-group accents on social judgements of the voice.
On the interplay of vocally expressed confidence and speaker identity information
If one considers the different sources of information listeners use to decide that a speaker is believable, it has been proposed that social impressions of another person are initially dominated by processes for categorising the group membership of the speaker and activating related stereotypes and attitudes (Fiske & Neuberg, 1990). This view predicts that accent cues will have a significant effect, and perhaps cost, on social-evaluative processes applied to out-group voices, such as those for inferring believability. However, it is poorly understood how the neurocognitive system simultaneously adjusts to vocal confidence information and vocal identity (accent) information as listeners infer whether to believe what a speaker says.
The neural underpinnings of these mechanisms were reported recently by Jiang et al. (2018). They monitored changes in the hemodynamic response as English Canadians rated whether they believed statements produced by in-group and out-group speakers (those with a regional or foreign accent), expressed with different levels of vocal confidence. Results confirmed that believability impressions and related brain activity were significantly influenced by categorization of the speaker’s in-group or out-group status, affecting how vocal confidence expressions (i.e., “individuating attributes”) were processed. Temporal, medial parietal, and medial occipital regions and basal ganglia were activated in systematically different conditions by in-group versus out-group voices, implying that the process for mentalizing and rendering believability judgements varied according to the speaker’s in-group or out-group status. Moreover, the right STG, a region associated with deriving vocally expressed confidence for in-group voices (Jiang et al., 2017), showed greater functional connectivity to the left lingual gyrus and right middle temporal gyrus when evaluating statements spoken by out-group speakers (Jiang et al., 2018). These data imply that processes for decoding vocal confidence cues were involved more extensively when believability impressions are derived about out-group voices; that is, detecting out-group voices appears to promote a more “piece-meal” analysis (Fiske & Neuberg, 1990) of vocal confidence cues or greater attention to the individuating attributes of accented speakers (Jiang et al., 2018). There was evidence that individual attitudes about particular (regional or foreign) out-groups and accent intelligibility further modulated the underlying neural connectivity.
Based on the neuroimaging results, Jiang et al. (2018) speculated that social inferences about in-group versus out-group voices involve partially distinct neurocognitive processing mechanisms: a “heuristic route” is used to process in-group accents, driven to a greater extent by personal experience and knowledge of in-group behaviour and conventions, and an “indirect route” is triggered by out-group voices and is mediated to a greater extent by individuating features such as vocal confidence cues. These ideas may be constructively evaluated by looking at the temporal evolution of neural responses to similar utterances in an ERP setup; this will elucidate how and when processes underlying the social categorization of accents and the concurrent evaluation of vocally expressed confidence interact during online speech processing as believability impressions are formed. In particular, analysing ERP responses will help verify whether in-group and out-group voices engage different cognitive routines during person perception, that is, that early category-based heuristics (Fiske & Neuberg, 1990) promote the use of distinct cognitive processing “routes” as listeners decide whether a speaker’s statement should be believed (Jiang et al., 2018).
The present study
This study investigates how the neurocognitive system jointly evaluates vocally expressed confidence and accent to arrive at a social impression of the speaker based purely on evidence from the vocal channel of communication. By simultaneously manipulating the voice-implied linguistic background of speakers (in-group vs. out-group) and the individuating cues they provide in speech (confident, unconfident voice), our goal was to elucidate whether early categorical processes promote differences in the nature and time course of neural responses as believability inferences are generated for in-group versus out-group speakers. According to the dual process theory of social perception (Fiske & Neuberg, 1990), categorising speakers as belonging to an out-group may promote a more “piecemeal” analysis of their vocal confidence expressions, altering how believability impressions are subsequently formed (Jiang et al., 2018).
In terms of behavioural decisions, we expected confident voices to be rated as more believable than unconfident expressions overall (Jiang et al., 2017). Also, in-group accents are likely to be rated as more believable than out-group accents, due to negative stereotypes implied by out-group speech patterns shown in our earlier study (Jiang et al., 2018) and in the majority of studies which did not separately consider speakers with different tones of voices (Hanzlíková & Skarnitzl, 2017; Jiang et al., 2018; Lev-Ari & Keysar, 2010; Souza & Markman, 2013). When the online effects are examined, processing speaker accent should dominate the early category-based process due to its high salience, taking priority over vocal confidence information (Fiske, 1980; Fiske & Neuberg, 1990). The relative effort and timing of processes for decoding vocal confidence information (i.e., individuating attributes of a speaker) should differ for in-group versus out-group speakers, given that listeners first map vocal identity information onto a representation formed by the social category of the speaker. Decoding speaker confidence may be more demanding or long-lasting when encountering out-group voices, due to negative bias and increased difficulty mapping vocal expressions onto a nonstandard representation of accented English (Fiske & Neuberg, 1990).
To test these hypotheses, we recorded EEGs of listeners judging vocally confident or unconfident statements produced by speakers with a Canadian English accent (in-group) or one of two out-group accents: Australian English (regional out-group) or Québécois-French (foreign out-group). We included two out-group accents—one reflecting a regional variant of English and the other produced by second-language speakers of English—to better generalise our effects and to briefly explore how accent distance, intelligibility, and social attitudes towards particular out-groups influence our findings (Fuertes, Gottdiener, Martin, Gilbert, & Giles, 2011; Lev-Ari & Keysar, 2010; Pantos & Perkins, 2013).
We hypothesised that accent information would alter and/or delay vocal confidence processing for out-group speakers, although it was difficult to predict the ERP effects with precision. If listeners build less detailed representations of out-group utterances and rely more on contextual-pragmatic information (Lev-Ari, 2015), the N100, P200, and LPC—indices of the sensory, motivational, and in-depth analysis of vocal expressions—should be more clearly modulated by the vocal confidence expressions of in-group speakers (Jiang & Pell, 2015, 2016b; Pell et al., 2015). In particular, we expected confidence-related differences to be robustly observed in the P200 amplitude, at least for in-group speakers, demonstrating that listeners quickly register the motivational significance of confidence cues for evaluating believability. These early responses may be increased for in-group speakers given the increased significance of these voices to listeners (Bestelmeyer et al., 2015; Charest et al., 2009).
Group-related differences at an early stage of salience detection may alter ongoing cognitive analysis of confident/unconfident voices to elaborate their contextual relevance in terms of believability, differentially affecting the LPC amplitude for in-group versus out-group voices (Zougkou, Weinstein, & Paulmann, 2017). Assuming that out-group categorization hampers the process of integrating vocal confidence cues into a speaker representation of believability (Coulson & Kutas, 2001; Jiang et al., 2013; Wlotko & Federmeier, 2012), ERP effects that reflect increased effort in contextual integration and reanalysis of meaning (e.g., N400, late negativity response) may also be more pronounced for out-group versus in-group speakers (Van Engen & Peelle, 2014). These hypotheses provide a structure for our current design and analyses.
Materials and methods
Participants
Participants were 44 right-handed, native Canadian English speakers living in Montréal, Canada (22 females/22 males, age: M = 24.9 years, range = 18–36 years; years of education: M = 16.6, range = 14–23). Sample size was calculated a priori using simr package in R (Brysbaert & Stevens, 2018; Green & MacLeod, 2016; O’Keefe, 2007). The effect sizes were specified according to the beta coefficients of relevant comparisons in the linear mixed effects models (LMM) of ERP effects from the previous report (Jiang & Pell, 2015). The minimally required sample size was estimated through powerCurve function with an alpha level set to .05 and the number of simulations set to 1,000. The initial power analysis indicated that at least 29 participants were required to reach 95% statistical power to detect the effects of the given sizes. This statistical power was therefore ensured given that the actual number of participants was larger than this estimation.
All participants were born and raised in an English-speaking family, in or outside the province of Québec. Given our focus on two out-group accents, Australian English and Québécois-French, we defined the extent to which participants had knowledge or were exposed to each group. None of the participants had travelled to Australia, although all reported being exposed to Australian speakers through television and other media. As testing was conducted in Montréal, all participants were actively exposed to French and it is commonplace to hear French speakers using English in central Montreal. The majority of participants (39/44) had themselves learned French as a second language in school (in addition to other languages). Each participant was asked to rate their proficiency on speaking, listening, writing, and reading in English and in French (from 1 to 10). The self-rated oral proficiency was significantly higher in English (Listening: 9.95 ± .21; Speaking: 9.93 ± .26) than in French (Listening: 5.46 ±2.82; Speaking: 4.43 ± 2.67; ps < .01). No participant reported any hearing, psychiatric, neurological, or developmental disorder. All participants were given informed consent prior to the experiment and were compensated CAD30 for their participation. The study was approved by the McGill Faculty of Medicine Institutional Review Board.
Materials
Stimuli were 44 sets of utterances selected from a larger recording inventory (Jiang & Pell, 2017, 2018). All stimuli were short statements of personal opinions (e.g., She doesn’t have the right personality) or personal knowledge (He eats meat and cheese), spoken in a confident or doubtful voice. As listeners are unable to draw upon shared knowledge or contextual cues to judge the believability of these statements, they must rely solely on the form of the vocal expression. In relation to the experimental participants, the same statements were produced by in-group speakers (Canadian English), out-group/regional speakers (Australian English), and out-group/foreign speakers (Québécois-French) using a standardised procedure for eliciting and recording vocal stimuli (Jiang & Pell, 2017; Pell, Paulmann, Dara, Alasseri, & Kotz, 2009). Most of these stimuli have been presented in previous works (Jiang & Pell, 2015, 2016a, 2016b; Jiang et al., 2017; Jiang et al., 2018).
Auditory stimuli were digitally recorded in a sound-attenuated chamber and edited as .wav audiofiles (see Jiang & Pell, 2017 for full details of stimulus recording and validation procedures). For each of the three accent types, stimuli were produced by one female and one male speaker (n = 88/accent). Out-group regional versus foreign speakers were selected based on distinct criteria: out-group/regional (Australian) speakers were young adults who had recently moved to Montréal to study at McGill University (<1 year in Canada). Out-group/foreign (Québécois) speakers were recruited for being late-learners of English (age of acquisition >10 years) but having attained a high level of English fluency. Each of the 44 critical statements had six recorded variants (2 confidence levels × 3 accents). The selected statements varied in length from 5 to 11 syllables (M = 7.32), and once recorded, varied naturally in duration from 1.03 to 2.98 s (M = 1.90 s) due to confidence-related differences in speech rate (Jiang & Pell, 2017). Neutral expressions of the same statements (n = 132) were also recorded by the same speakers and included as fillers in this study (44 per accent group). Including fillers, a total of 396 utterances were pseudo-randomised in the experiment and presented to each participant.
Perceptual and acoustic features of selected stimuli
Prior to the EEG study, pilot tests were conducted to perceptually characterise the 44 sets of utterances from the perspective of Canadian listeners and to provide contextual information on the stimuli for the current study. Eighteen participants (10 females/8 males, mean age = 21.39 years, range = 18–26 years) who did not participate in the EEG study listened to each utterance and rated the speaker’s level of confidence on a 5-point scale (1 = not at all confident; 5 = very much) for all three accents. Confident expressions in each stimulus set always scored higher than the corresponding doubtful statement per accent group, as shown in Table 1 (Canadian: b = −2.66, t = −65.03, p < .0001; Québécois: b = −1.54, t = −33.98, p < .0001; Australian: b = −1.92, t = −45.54, p < .0001). Mean confidence ratings were comparable in range for utterances produced by Canadian (confident = 3.4–4.9; doubtful = 1.1–3.1), Australian (confident = 2.9–4.4; doubtful = 1.6–2.7), and Québécois (confident = 2.8–4.4; doubtful = 1.4–2.8) speakers (ps > .1). 1
Perceptual and acoustic features of selected stimuli.
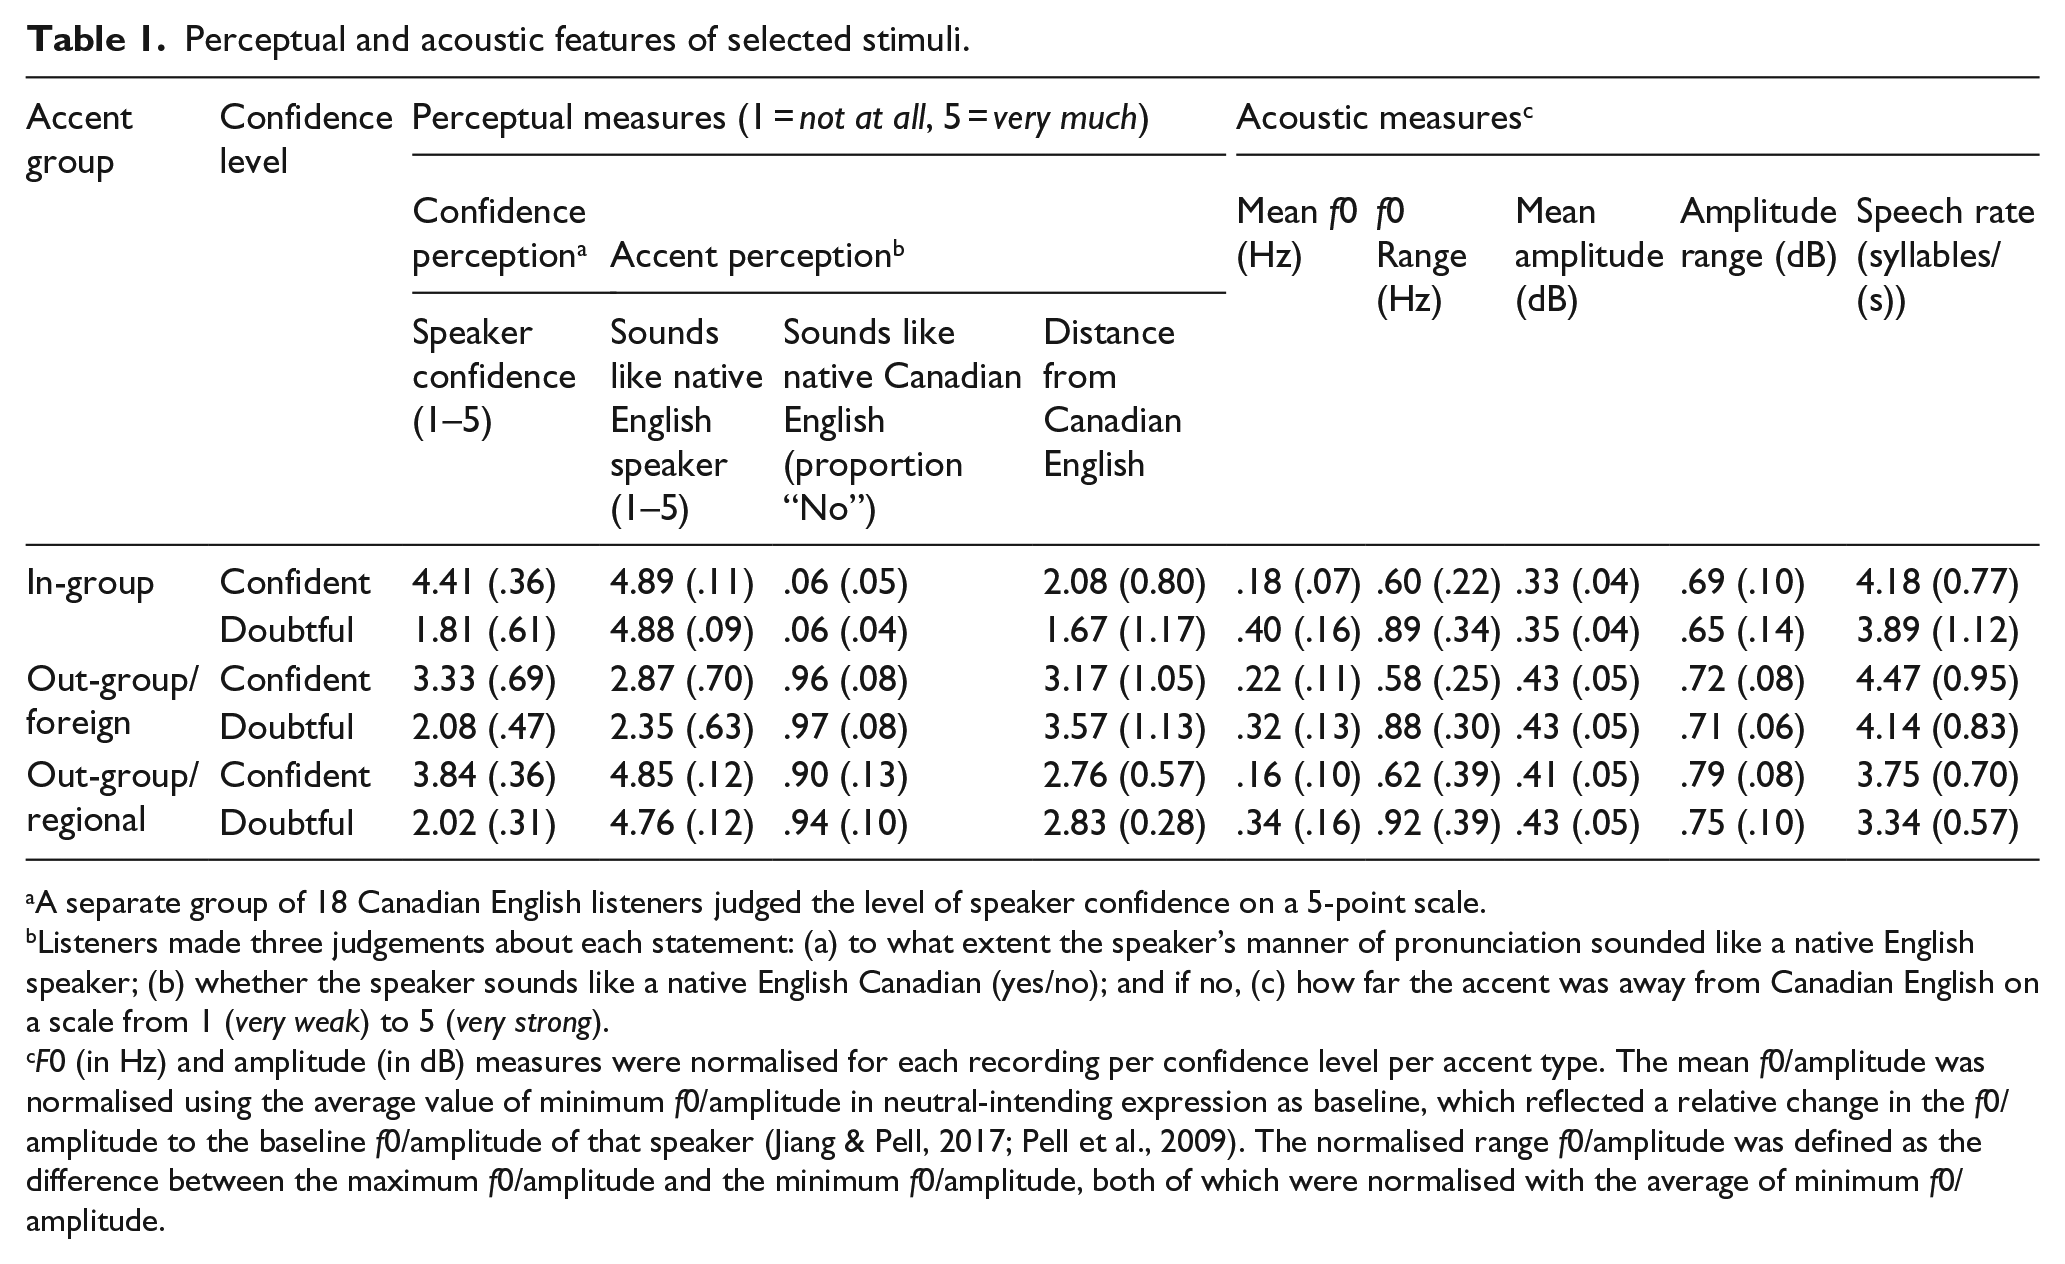
A separate group of 18 Canadian English listeners judged the level of speaker confidence on a 5-point scale.
Listeners made three judgements about each statement: (a) to what extent the speaker’s manner of pronunciation sounded like a native English speaker; (b) whether the speaker sounds like a native English Canadian (yes/no); and if no, (c) how far the accent was away from Canadian English on a scale from 1 (very weak) to 5 (very strong).
F0 (in Hz) and amplitude (in dB) measures were normalised for each recording per confidence level per accent type. The mean f0/amplitude was normalised using the average value of minimum f0/amplitude in neutral-intending expression as baseline, which reflected a relative change in the f0/amplitude to the baseline f0/amplitude of that speaker (Jiang & Pell, 2017; Pell et al., 2009). The normalised range f0/amplitude was defined as the difference between the maximum f0/amplitude and the minimum f0/amplitude, both of which were normalised with the average of minimum f0/amplitude.
The same 18 participants then rated characteristics of the speaker’s accent along a 5-point scale for a subset of 72 expressions (8 per level of confidence per accent). Participants judged whether the speaker talks “in a manner that resembles a native English speaker” and rated “how distant is the manner of pronunciation from a native (Canadian) accent.” Compared to the foreign accent, Canadian and Australian speakers were correctly perceived as “speaking in a manner that resembled a native English speaker” (Canadian = 4.9, Australian = 4.8, Québécois = 2.6, where 5 = “native,” Canadian vs. Québécois: b = 2.02, t = 21.46, p < .0001; Australian vs. Québécois: b = 1.98, b = 21.02, p < .0001). For the second rating, where 5 means “very far” from the native accent, both Australian (M = 2.8) and Québécois (M = 3.4) accents were perceived as more distant from the Canadian accent (M = 1.9, Australian vs. Canadian: b = 0.82, t = 2.39, p = .02; Canadian vs. Québécois: b = −1.24, t = −3.61, p = .0003; Australian vs. Québécois: b = −0.42, t = −3.57, p = .0004).
Finally, acoustic analyses were conducted on utterances expressing each confidence level, separately by accent type, to characterise their major physical properties (Jiang & Pell, 2017; Pell et al., 2009). Regardless of accent type, doubtful expressions exhibited a higher mean fundamental frequency (f0) with increased f0 range and mean amplitude over confident expressions (Table 1). Also, speaking rate and amplitude range tended to be reduced when speakers lacked confidence, and doubtful expressions exhibited differences in voice quality (increased harmonics-to-noise ratio) relative to confident expressions. This implies that a similar set of acoustic features was used to vocally communicate different levels of confidence by speakers with in-group and out-group accents.
Task procedure and EEG recording
Testing was conducted in an electrically shielded, sound-treated booth. Participants were instructed to listen to each statement and judge “how much they believed the speaker” on a 5-point scale (from not at all to “very much”). This task can effectively capture neural responses associated with graded impressions of speaker (un)believability (Jiang et al., 2017; Jiang et al., 2018). Each trial began with a fixation point followed by a jittered delay (M = 750 ms, range = 500–1,000 ms) before the onset of the vocal stimulus. The rating scale appeared on the screen 500 ms following the offset of the statement and disappeared upon a response or after 3 s without a response. The direction of the scale was counterbalanced across participants of each gender. All statements were normalised to a peak intensity of 75 dB to avoid gross perceptual differences across stimuli when combined in the experiment. Each participant received 18 practice trials before the formal session, and the examiner confirmed that none of the speakers sounded familiar to the listeners.
Trials were pseudo-randomised, ensuring that expressions with the same lexical content never appeared consecutively. Other conditions included no more than three consecutive utterances of the same speaker; no more than four consecutive utterances conveyed the same confidence level; no more than five bore the same accent; and no more than six were expressed by the same speaker sex. The EEGs were recorded continuously from 64 electrodes using the actiCap System (Brain Products, Germany). The vertical electro-oculograms were recorded from above and below the right eye, and horizontal electro-oculograms were recorded from the outer canthus of both eyes. The recordings were online referenced to FCz and re-referenced offline to the mean activity of the bilateral mastoids. The EEGs were digitised at 500 Hz and filtered with a bandpass from 0.016 to 100 Hz. The whole EEG session lasted 1.5 hr, including electrode preparation.
After the EEG testing, all participants (except one) judged a subset of 24 utterances (4 per accent per confidence level), randomly selected from the critical stimuli, to gather data on other social impressions created by the experimental stimuli (Table 2). Using a 5-point scale (where 1 = not at all, 5 = very much), participants rated in three separate tasks: (a) the explicit confidence level of the speaker; (b) impressions of voice-related speaker characteristics (competence, pleasantness, intelligence, level of education, social status); and (c) impressions of speaker accent (perceived distance, intelligibility). Participants made all judgements on the same subset of stimuli with different sequences of randomizations across the three tasks. 2 In a final task, the EEG participants were also asked to write down the accent(s) they had heard during the experiment. All reported hearing accents other than their native dialect, with 22 participants identifying the Australian accent and 20 identifying that they heard a Québécois accent.
Mean (and standard deviation) of the post-EEG perceptual judgement tasks for vocal expressions of each accent group in each level of confidence.
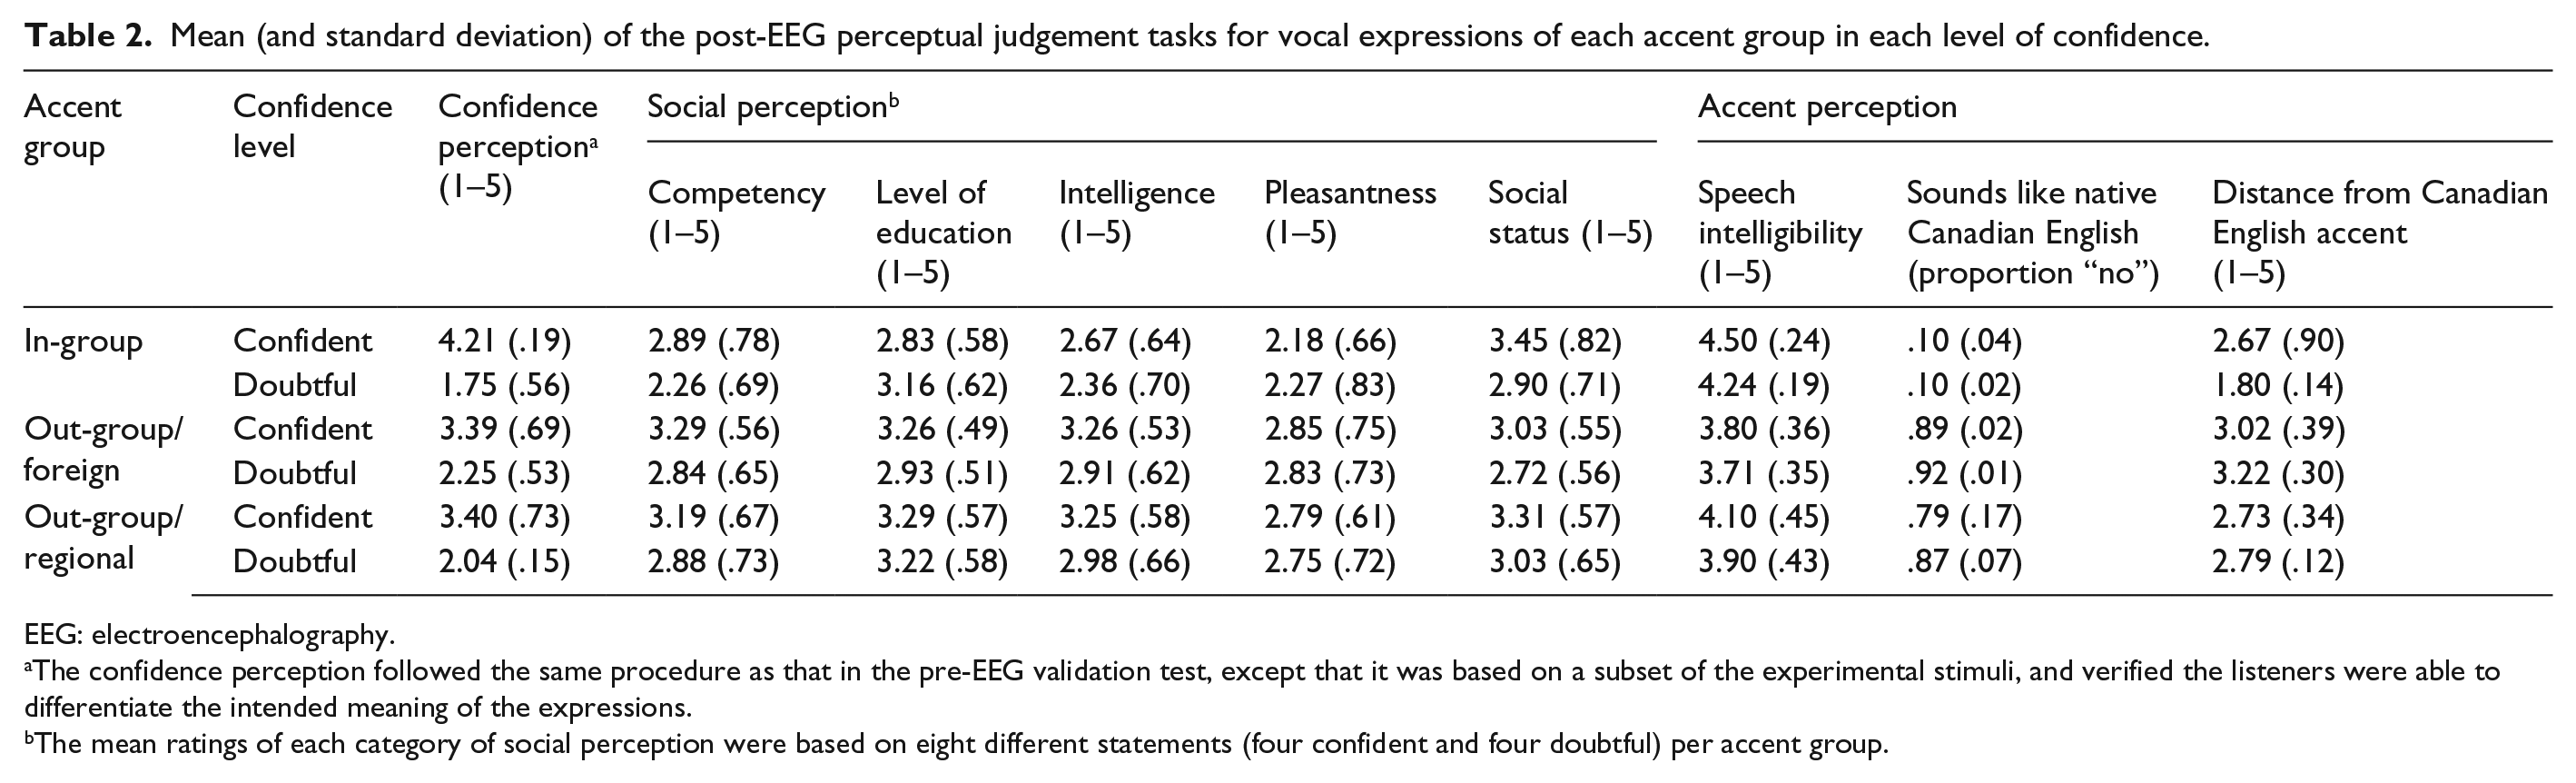
EEG: electroencephalography.
The confidence perception followed the same procedure as that in the pre-EEG validation test, except that it was based on a subset of the experimental stimuli, and verified the listeners were able to differentiate the intended meaning of the expressions.
The mean ratings of each category of social perception were based on eight different statements (four confident and four doubtful) per accent group.
EEG and statistical analysis
Pre-processing was performed using EEGLAB and ERPLAB. The continuous EEGs were first visually inspected, and signals with excessive movement artefacts, alpha activity, or amplifier saturation were manually excluded from the analysis. The subsequent EEGs were low-pass filtered at 30 Hz and decomposed with an independent component analysis (ICA) algorithm to remove ocular artefacts. To allow for a complete exhibition of all ERP effects (Jiang & Pell, 2015), datasets were segmented into an epoch starting 200 ms before and 1,200 ms after the onset of each stimulus, covering the entire time course of 98.1% of statements. The epoch was baseline corrected based on the mean EEG activity in the 100 ms pre-stimulus interval. Segments with peak-to-peak signal voltage exceeding 70 µV within a 100 ms sliding window were automatically rejected. Three participants (two females and one male) ended up having less than 70% artefact-free trials and were removed from further analysis.
The ERP response was time-locked to the onset of the vocal stimulus. To examine early operations associated with the analysis of acoustic and motivational information in the vocal signal (Paulmann, Bleichner, & Kotz, 2013; Pell et al., 2015), we calculated the mean amplitude in the 105–145 ms window for N100 (Mean Latency = 122 ms, SD = 16 ms) and in the 180–220 ms window for P200 (Mean Latency = 202 ms, SD = 26 ms), following a peak detection procedure to determine the time window. To tap into the late continuous evaluation process, we defined time windows based on previous literature on vocal expression processing (Jiang & Pell, 2015; Vespignani, Canal, Molinaro, Fonda, & Cacciari, 2010). Based on a continuous small-window analysis and visual inspection, the following time windows were selected: 340–400 ms for the P300-like effect; 450–550 ms for the N400-like effect; and 550–1,200 ms for the late negativity effect. To allow for detailed analysis on the late effects, the late negativity was further segmented into 550–900 and 900–1,200 ms time windows (Jiang et al., 2013).
LMM 3 were built to fit the mean believability ratings as well as the ERP amplitudes per subject per condition in each time window of interest. The ERP signals within one subject were averaged before being entering into the model due to low signal-to-noise ratio in single EEG data (Payne, Lee, & Federmeier, 2015). The LMM included Confidence (confident vs. doubtful, baseline = confident), Accent (in-group vs. out-group/regional vs. out-group/foreign, baseline = in-group), and topographic factors for ERP data (see in the following). The mean number of valid trials surviving artefact rejection was above 38 for all conditions (mean = 38.3). Topographic factors included hemisphere (medial vs. left vs. right, baseline = medial) and region (anterior vs. central vs. posterior, baseline = anterior), which formed nine regions of interest (ROI), composed of 6–8 electrodes: left anterior (AF3, FP1, F7, F5, F3, FT7, FC5, FC3), left central (T7, C5, C3, TP7, CP5, CP3), left posterior (P7, P5, P3, PO9, PO7, PO3), medial anterior (F1, Fz, F2, FC1, FCz, FC2), medial central (C1, Cz, C2, CP1, CPz, CP2), medial posterior (P1, Pz, P2, O1, POz, O2), right anterior (AF4, FP2, F4, F6, F8, FC4, FC6, FT8), right central (C4, C6, T8, CP4, CP6, TP8), and right posterior (P4, P6, P8, PO4, PO8, PO10). Electrodes were not averaged and were treated as random variances. Age and years of education were included as control factors. Participants were included as random intercept as well as random slopes to evaluate individual adjustments in the magnitude of ERP responses as a function of (the combination of) fixed factors (Jiang & Pell, 2015; Newman, Tremblay, Nichols, Neville, & Ullman, 2012). The random structure of the model was kept maximal to reduce Type I error (Barr, Levy, Scheepers, & Tily, 2013).
Additional models were built on the ERP responses, with mean scores in the post-EEG tasks treated as an additional fixed effect; this allowed us to evaluate individual differences and to examine/rule out the impact of intrinsic differences in the perception of speaker confidence for in-group and out-group accents, evident in our stimulus validation task (review Table 1). Models were examined by way of F tests for main effects and interactions and t tests for specific contrasts. Lower bound (conservative) probability values were considered for significance testing (Jiang & Pell, 2015; Newman et al., 2012). Simple coding 4 was applied to categorical fixed factors to obtain the parameter estimates for the main effects in the omnibus model. Treatment coding was applied only to identifying simple effects in a sub-model resolving the significant interaction (Barr et al., 2013; Pivneva, Mercier, & Titone, 2014). All analyses were performed in RStudio (R Version 3.2.2, http://cran.r-project.org) with lme4, lmerConvenienceFunctions, and lmerTest packages.
Results
Believability ratings
The LMM taking Confidence and Accent as fixed factors, with Participant and Item as random intercepts, revealed a significant interaction of Confidence and Accent on the believability ratings, F(2, 10,706) = 144.16, p < .0001. Confident expressions were always rated as more believable than doubtful expressions irrespective of accent; however, the extent to which vocally expressed confidence modulated believability ratings was greatest for in-group speakers (b = −2.11, t = −66.17, p < .0001), followed by out-group/regional (b = −1.37, t = −43.17, p < .0001), and least evident for out-group/foreign accent (b = −1.52, t = −48.73, p < .0001). When using a confident voice, statements produced by in-group and out-group/regional speakers were judged to be more believable than those produced by foreign-accented speakers (b = 0.13, t = 3.91, p < .0001; b = 0.11, t = 3.24, p = .001, baseline = foreign accent), implying bias favouring native English speakers in this condition. When vocal expressions communicated a lack of confidence, believability impressions of in-group speakers were significantly lower than those attributed to both out-groups (b = 0.57, t = 19.25, p < .0001; b = 0.62, t = 20.82, p < .0001; baseline = in-group accent). These patterns highlight subtle asymmetries in the way that vocally expressed confidence and accent jointly influence decision outcomes about believability (Figure 1).
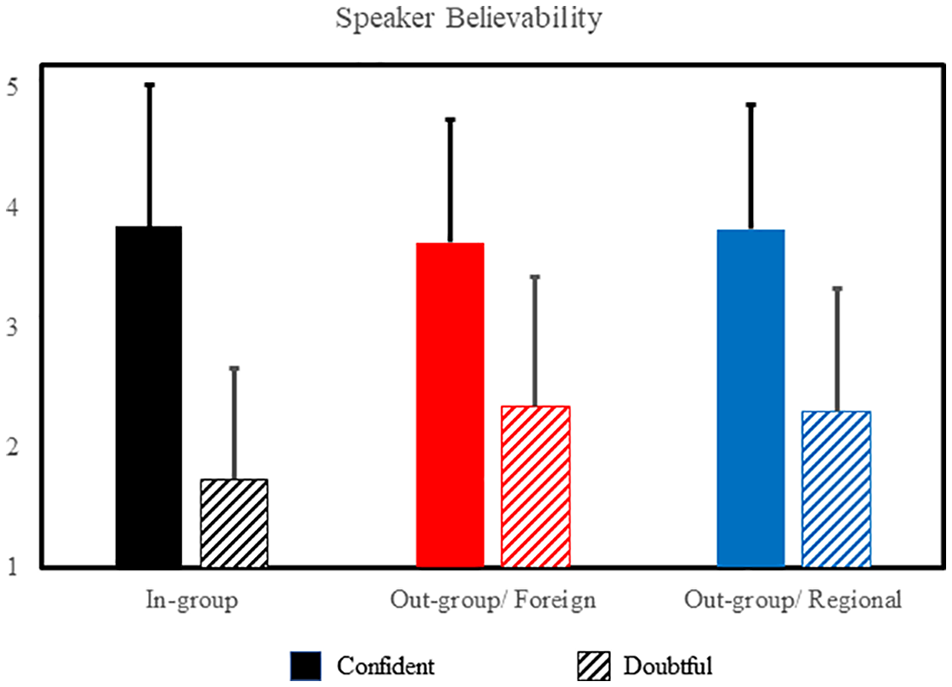
Effects of accent type and vocally expressed confidence on impressions of believability for statements presented to 41 Canadian participants (1 = not at all, 5 = very believable).
Effects of vocal confidence and accent on ERPs
Data overview
Figures 2 and 3 demonstrate the ERP grand average waveforms as a function of accent and vocal expression type. To first summarise the major patterns relating to Accent type (reported in Figure 2), the N100 and the P200 were strongest in response to in-group speakers and most reduced in the out-group/regional accent. For confident expressions, the out-group/regional accent appeared to elicit an earlier positive response peaking at around 50 ms (P50). This early positivity has been associated with differential pitch values of short words produced by different speakers (Latinus & Taylor, 2012) or with different emotional vocalisations (Liu et al., 2012) and may here be linked with an early detection of acoustic changes (Pinheiro, Barros, Vasconcelos, Obermeier, & Kotz, 2017). The P200 was followed by an N400 response, which developed into a negative-going wave that was sustained until the end of the epoch. The N100 and P200 were both increased in response to in-group and out-group/foreign accent, whereas the N400-late negativity response was increased in response to the two out-group accents.
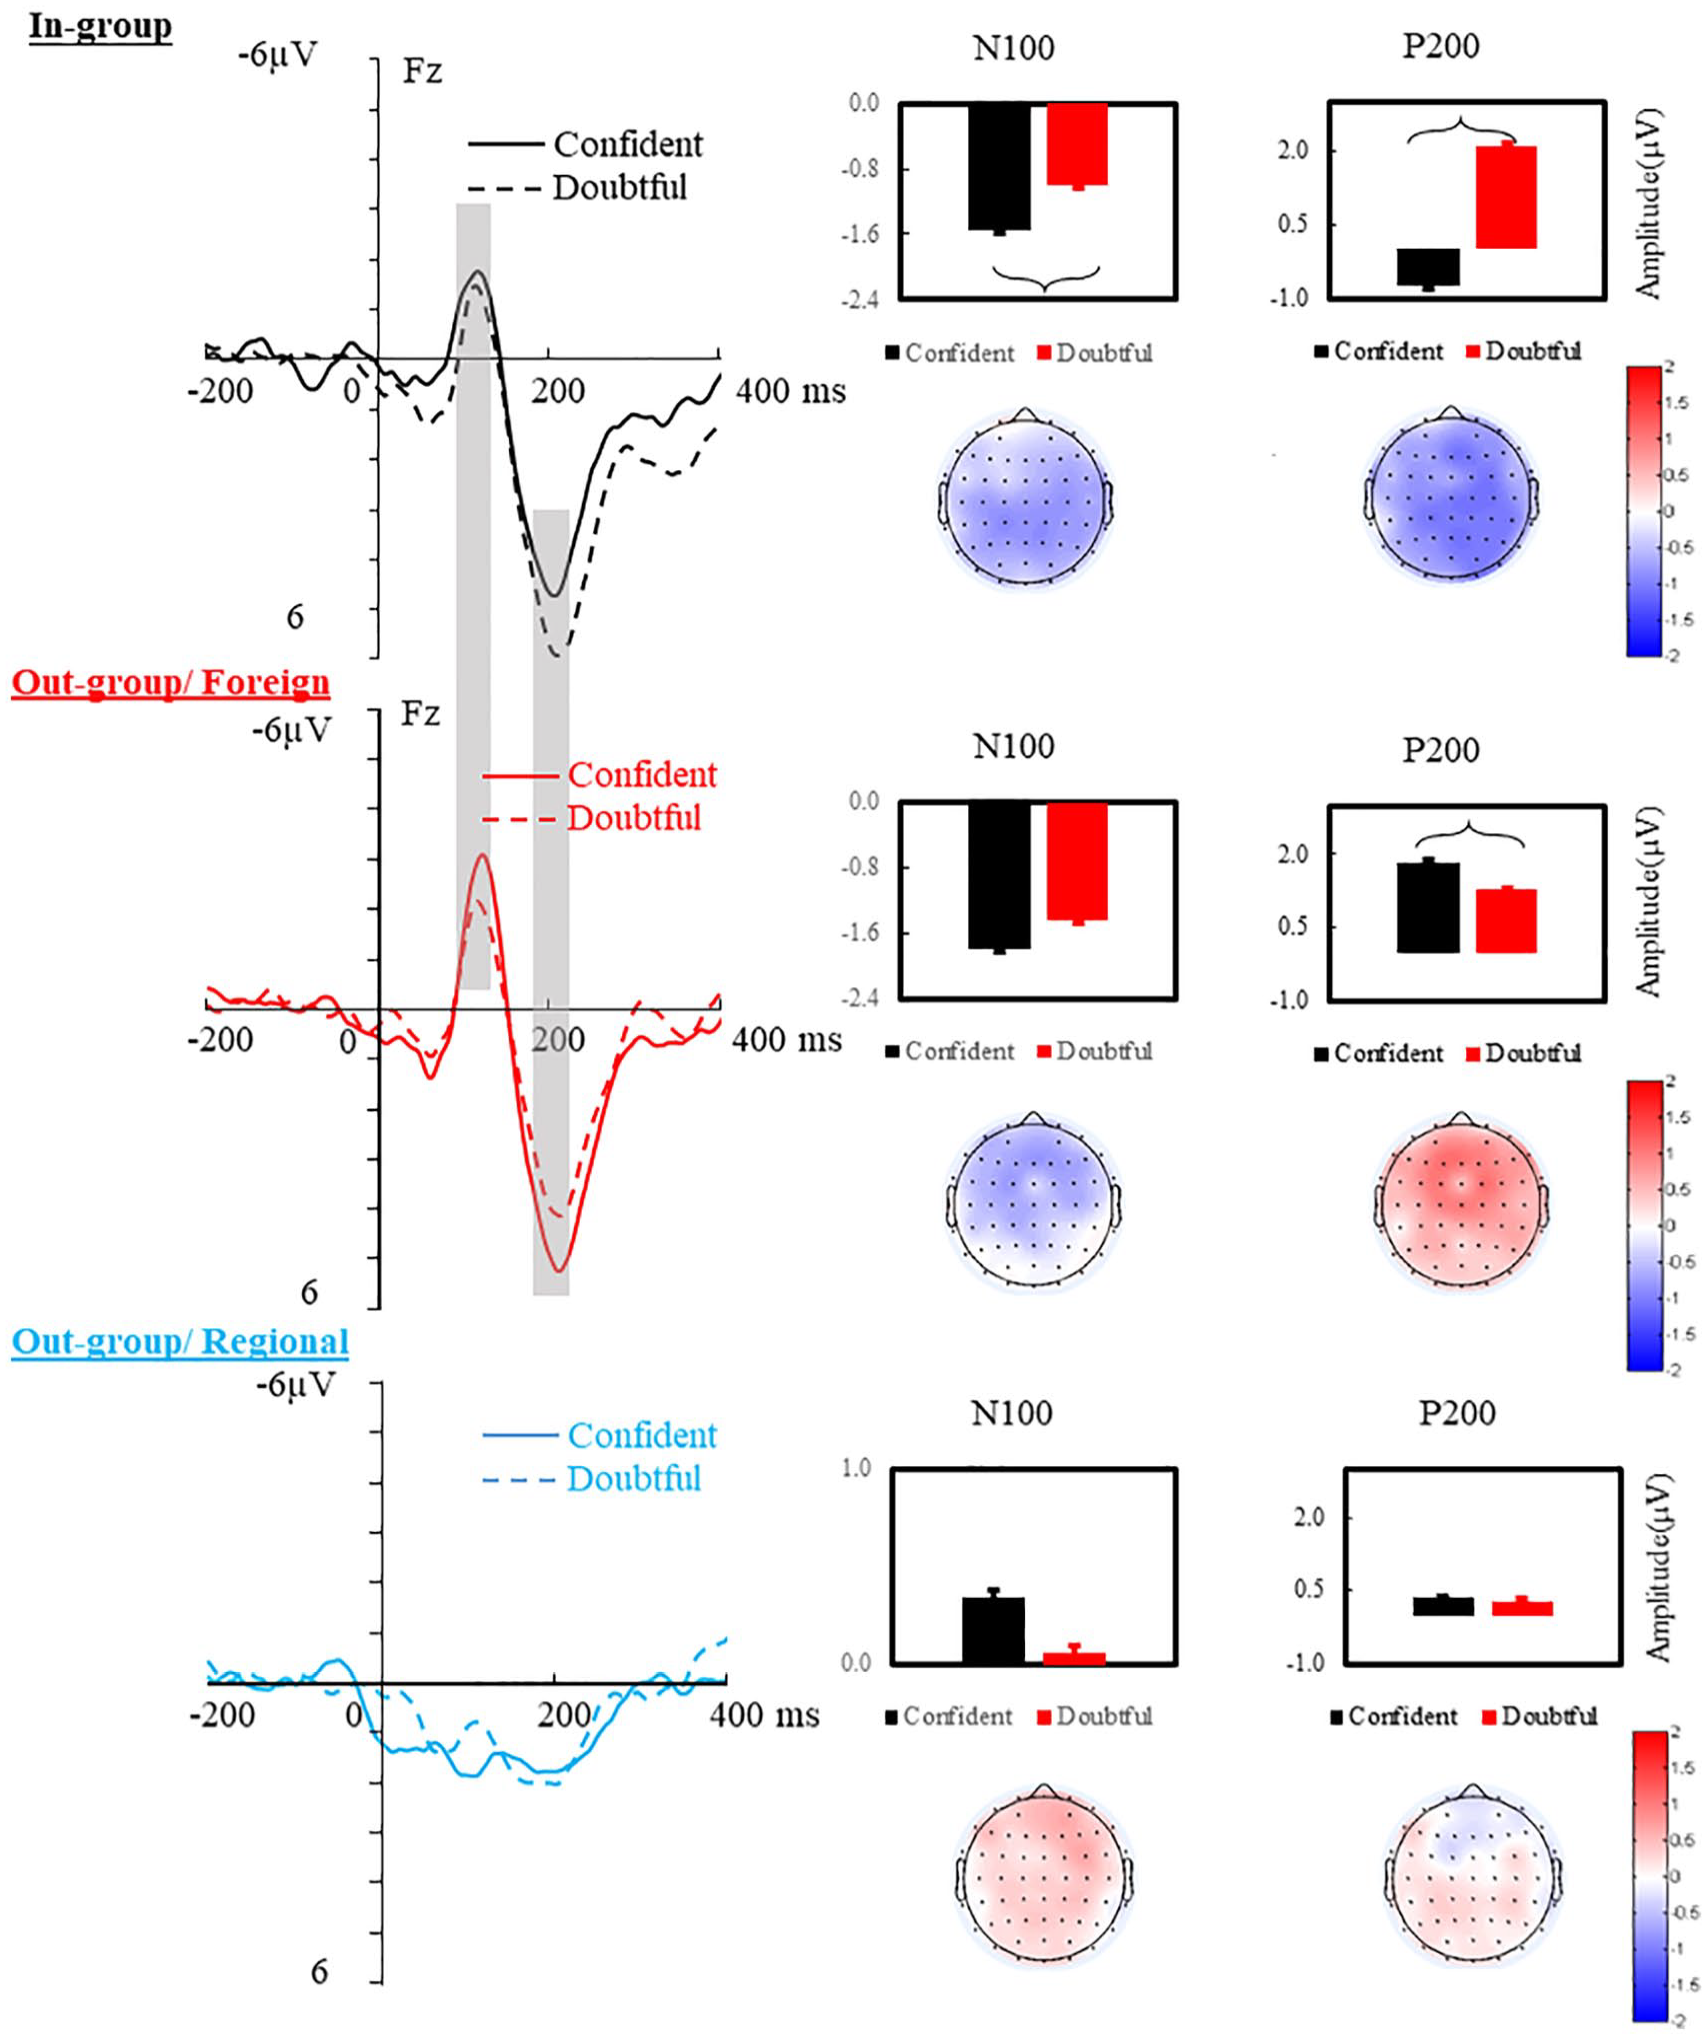
Effects of accent type and vocally expressed confidence on early ERP effects: Grand average waveforms, time locked to the onset of the utterances on Fz, and epoched from −200 pre-onset to 400 ms post-onset of the utterance, for the confident and doubtful voice in each accent type. Bar graphs summarise the mean amplitude difference (µV) between confident and doubtful voice in the N100 (105–145 ms) and P200 (180–220 ms) windows per accent group. Topographical maps were calculated by subtracting the mean amplitude of doubtful from confident voice per accent group. Significant differences are highlighted on waveforms and on bar graphs.
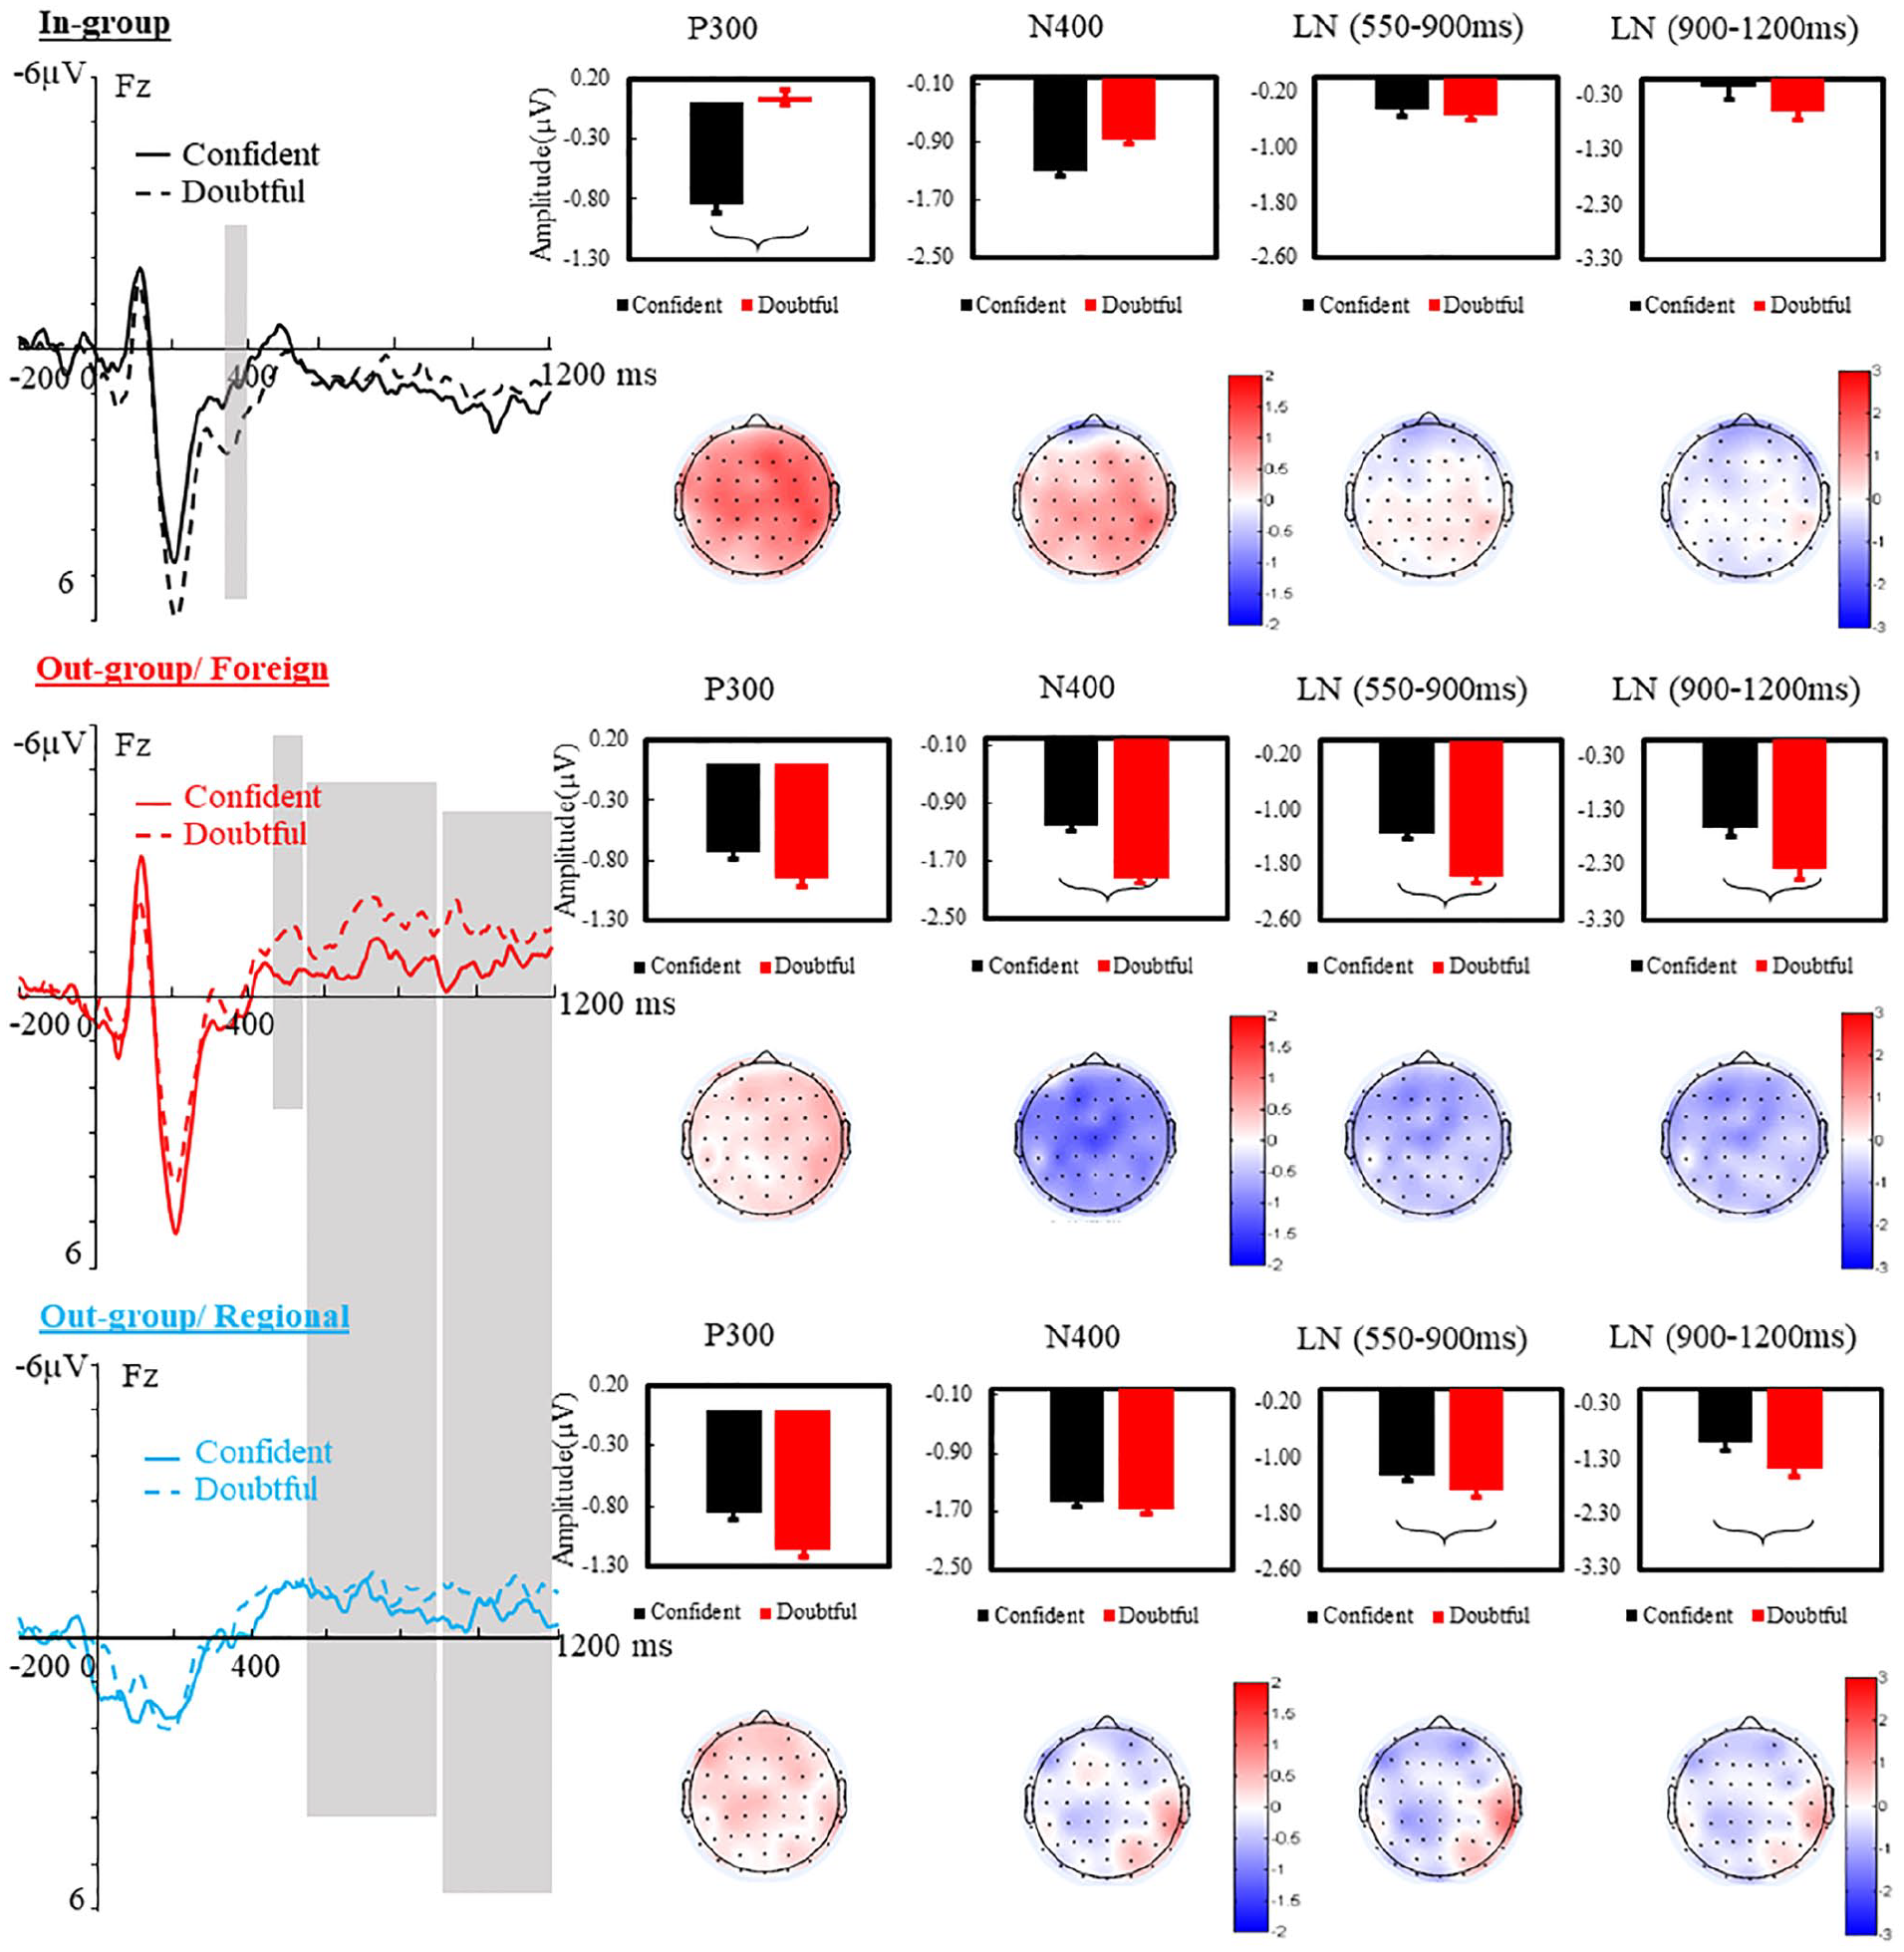
Effects of accent type and vocally expressed confidence on late ERP effects: Grand average waveforms, time locked to the onset of the utterances on Fz and epoched from −200 to 1,200 ms, for the confident and doubtful voice in each accent type. Bar graphs summarise the mean amplitude difference (µV) between confident and doubtful voice in the P300 (340–400 ms), N400 (450–550 ms), and late negativity (LN, 550–900 ms on the whole scalp; 900–1,200 ms, on medial hemisphere) windows per accent group. Topographical maps were calculated by subtracting the mean amplitude of doubtful from confident voice per accent group. Significant differences are highlighted on waveforms and on bar graphs.
Figure 3 summarises the confidence effects, which were decomposed for each accent type in each time window. Confident statements elicited increased N100 and reduced P200 for in-group speakers, whereas they elicited increased N100 and increased P200 for speakers with an out-group/foreign accent. Doubtful statements evoked a P300-like effect uniquely for in-group speakers (from 340 to 400 ms), whereas they elicited an N400-like effect followed by a late negativity for both out-groups (starting around 550 ms for the foreign accent and 900 ms for the Regional accent). There was evidence of a negativity in response to doubtful utterances produced by out-group speakers in the 900–1,200 ms time window; as such, we separately analysed effects in the 550–900 ms and 900–1,200 ms time windows. Results of the statistical modelling are reported in the following.
N100 (105–145 ms). A significant effect of Accent, F(2, 13,720) = 71.54, p < .0001, revealed that the N100 amplitude was largest for the out-group/foreign accent, which was larger than the in-group accent (b = 0.33, t = 2.04, p = .04), which in turn surpassed the out-group/regional accent (b = 1.47, t = 9.04, p < .0001). The interaction between Accent and Region was significant, F(4, 13,720) = 213.30, p < .0001, demonstrating that the enhanced N100 was significant in the anterior region for out-group/foreign versus in-group accent (b = 0.65, t = 2.88, p = .01) and maximised in the medial region for in-group versus out-group/regional accent (b = 2.83, t = 14.29, p < .0001). Vocally expressed Confidence interacted with Accent, F(2, 13,720) = 150.88, p < .0001, indicating that confident voices enhanced the N100 over doubtful voices, but only when produced by in-group (b = 0.55, t = 2.46, p = .02) and out-group/foreign (b = 0.33, t = 2.07, p = .05) speakers.
P200 (180–220 ms). Accent also modulated the amplitude of the P200, F(2, 13,720) = 24.81, p < .0001, which was increased overall for in-group and out-group/foreign accents than for the out-group/regional accent (b = 1.34, t = 6.24, p < .0001; b = 1.20, t = 5.59, p < .0001, baseline = regional). Confidence and Accent interacted, F(2, 13,720) = 214.3, p < .0001, highlighting that doubtful statements enhanced the P200 over confident statements for in-group speakers (b = 0.76, t = 3.39, p = .002), whereas the opposite occurred for the out-group/foreign-accented speakers (confident > doubtful, b = −0.56, t = −2.22, p = .03). There was no effect of vocal confidence expressions on P200 amplitude when spoken in the out-group/regional accent.
P300-like effect (340–400 ms). Accent modulated the P300 wave, F(2, 13,720) = 3.40, p = .03, with an increased P300 overall for in-group speakers compared to both out-group accents (foreign: b = −4.26, t = −1.97, p = .05; regional: b = −5.72, t = −2.37, p = .02). An interaction of Confidence and Accent, F(2, 13,720) = 161.87, p < .0001, revealed that doubtful statements elicited an increased positive deflection than confident statements in this time window (peaking at 374 ms ± 35 ms), but only for in-group speakers (b = 0.89, t = 2.31, p = .03).
N400-like effect (450–550 ms). This analysis produced a significant interaction of Confidence and Accent, F(2, 13,720) = 104.03, p < .0001. Doubtful statements elicited an increased N400-like effect than confident statements (peaking at 501 ± 28 ms), but only when listening to the out-group/foreign accent (b = −0.72, t = −2.06, p = .05).
Late negativity effects (550–900 ms; 900–1,200 ms). The main effect of Accent was significant in both time intervals, 550–900 ms: F(2, 13,720) = 5.58, p = .0038; 900–1,200 ms: F(2, 13,720) = 4.18, p = .02. Overall, both out-group accents were associated with an increased late negativity response compared to the in-group accent (550–900 ms: b = −1.16, t = −3.23, p = .002; b = −0.85, t = −2.37, p = .02; 900–1,200 ms: b = −1.19, t = −2.87, p = .005; b = −0.72, t = −1.74, p = .09). In each window, the interaction of Confidence and Accent, 550–900 ms: F(2, 13,720) = 21.95, p < .0001; 900–1,200 ms: F(2, 13,720) = 4.89, p = .01, and the three-way interaction of Confidence, Accent, and Hemisphere were significant, 550–900 ms: F(4, 13,720) = 2.31, p = .05; 900–1,200 ms: F(4, 13,720) = 2.70, p = .04. Doubtful expressions increased the late negativity over confident expressions only when speakers had some form of out-group accent (for the foreign accent, 550–900 ms: b = −0.61, t = −2.05, p = .05; 900–1,200 ms: b = −0.64, t = −2.01, p = .05; for the Regional accent, 550–900 ms: b = −0.54, t = −2.01, p = .05 in the left hemisphere; 900–1,200 ms: b = −0.56, t = −2.98, p = .05 in the medial hemisphere).
Relationship between ERP effects and believability outcomes
To characterise the relationship between ERP effects and the believability impression that was formed for each utterance, linear regression models were built to predict differential believability ratings between Confidence levels or between Accent groups, with the linear combination of ERP differences in each time window (N100, P200, P300, N400, late negativities, see also Kubota & Ito, 2007). Four separate models—one comparing the two confidence levels and three comparing each combination of the two accents—were built on data from each of the six time windows, controlling for age and years of education. The increased N100 effect observed for out-group/foreign versus in-group speakers negatively predicted the difference in believability ratings between these two accents (b = −0.13, t = −2.11, p = .04). 5 This suggests that an increased N100 response to statements made by foreign-accented speakers was associated with stronger impressions of believability (higher ratings). No other relationships were observed for these analyses.
Post-EEG judgements: effects of individual differences on ERP effects
Speaker confidence rating
Results of the confidence manipulation check task served to confirm that confident statements, in addition to being rated as more believable during the EEG study, were judged by participants to express more speaker confidence than doubtful statements, F(1, 663) = 666.33, p < .0001.
Intelligibility rating
Canadian participants rated speakers with out-group accents (regional and foreign) as less intelligible than in-group speakers overall, F(2, 931) = 37.67, p < .0001, with higher intelligibility for the regional versus foreign out-group (b = 0.41, t = 3.02, p = .003). Speakers in both out-groups were perceived as less native than in-group speakers, F(2, 197) = 305.08, p < .0001. The out-group/foreign accent was perceived as more distant than the out-group/regional accent from native pronunciation, F(1, 511) = 28.62, p < .0001.
To evaluate potential effects of intelligibility on the ERP patterns, we used the mean intelligibility score for each accent (regardless of confidence level) to calculate an intelligibility difference score between each combination of accents: out-group/foreign versus in-group (M = −.68 ± .50), out-group/regional versus in-group (M = −.39 ± .45), and out-group/foreign versus out-group/regional (M = −.30 ± .42). An LMM regressed ERP effects in each time window with the intelligibility difference score as a fixed effect, keeping all other effects the same. Significant predictions were shown in the N100 and N400 time windows. The intelligibility difference between out-group/regional versus in-group speakers negatively predicted N100 amplitude in anterior regions (b = −0.09, t = −2.08, p = .05). Canadian participants who perceived the out-group/regional (Australian) accent to be less intelligible displayed a reduced N100 (Figure 4b). The intelligibility difference between out-group/foreign versus in-group speakers negatively predicted the N400 effect between the two accents in the right hemisphere (b = −0.06, t = −1.98, p = .05). Participants who perceived the out-group/foreign (Québécois) accent to be less intelligible exhibited an increased N400-like response to this accent. These patterns point to differential effects of speech intelligibility on the nature and time course of neural responses to each out-group accent in a social evaluation task.

(a) Overview of accent-related effects on the time course of vocal confidence processing: Grand average waveforms, time locked to the onset of the utterances on Fz and epoched from −200 to 1,200 ms, for the in-group, out-group/foreign, and out-group/regional accents when all statements are collapsed, or on confident-statement only or on doubtful statement only. (b) Effects of accent intelligibility on ERPs: Scatterplots show the association between intelligibility ratings across listeners (1–5, calculated as the difference of mean intelligibility ratings between accents at the subject level) and particular ERP effects (µV, calculated as the difference of mean ERPs between accents at the subject level). (c) Effects of social impressions of out-group/foreign speakers on ERPs and believability decisions: Scatterplots show the association between competency ratings across listeners (1–5, calculated as the difference of mean competency ratings between accents at the subject level) and the mean differential ERP responses (µV) between the out-group/foreign versus in-group accent. A mediation model shows that the N100 mediated the relationship between a listener’s social bias towards the out-group/foreign accent and behavioural ratings of believability for that accent.
Social impressions ratings
When speakers made confident statements, they were generally perceived as more competent, F(1, 908) = 59.22, p < .0001; educated, F(1, 905) = 30.68, p < .0001; intelligent, F(1, 908) = 28.45, p < .0001; and possessing higher social status, F(1, 908) = 44.54, p < .0001, than speakers making doubtful statements. Interestingly, speakers with both out-group accents were rated as more competent, F(2, 908) = 36.05, p < .0001; educated, F(2, 905) = 17.61, p < .0001; intelligent, F(2, 908) = 59.99, p < .0001; and pleasant, F(2, 908) = 45.61, p < .0001, than in-group speakers. In-group and out-group/regional speakers were both perceived as possessing higher social status than speakers with a foreign accent, F(2, 908) = 9.18, p = .0001.
As group-related social impressions may be a source of individual bias (positive or negative) that affects believability inferences, a principal component analysis was performed on the five social impression ratings. This yielded one component explaining 80.5% of total variance (71.4%–89.1% per judgement), with highest factor loadings for the “competence” scale (.94, followed by intelligence, social status, education, and pleasantness). We therefore used the mean competence rating of each accent (in-group = 2.58 ± .79, out-group/regional = 3.03 ± .71, out-group/foreign = 3.06 ± .64) and calculated a difference score between each accent pair to use as a predictor. ERP effects between accents were regressed with the competence difference score as a fixed effect, keeping other factors the same. The competence difference score between the out-group/foreign versus in-group accent negatively predicted differences of the N100 in these two accents in medial posterior (b = −0.02, t = −2.02, p = .05) and right posterior (b = −0.02, t = −2.03, p = .05) regions. This measure also showed a significant positive relationship to the N400 amplitude in the medial central region (b = −1.42, t = −2.91, p = .03) and the late negativity effects (550–1,200 ms) in the right central region (s > .04, ts > 2.07, ps < .05). Participants who judged out-group/foreign speakers to be more competent displayed an increased early negativity for that accent and reductions in the N400/late negativities elicited by foreign-accented English (Figure 4c). 6
Our results show that increased N100 amplitudes predicted believability ratings for the out-group/foreign speakers, and an increased N100 was also observed in participants who considered foreign-accented speakers to be more competent. Mediation models were therefore built to characterise the extent to which the N100 mediates effects of the social bias towards out-group/foreign speakers on believability decisions. 7 As illustrated in Figure 4, the significance of the direct path was absent when the magnitude of medial posterior N100 was considered as a mediator (from b = 0.19, t = 2.07, p = .04 to b = 0.12, t = .78, p = .38), suggesting that the N100 amplitude fully mediated the relationship between an individual’s social bias—the global impression of speaker competence for foreign-accent speakers—and impressions of whether their statement was believable. Confirming the mediation, robustness testing revealed a significant effect of the indirect path, b = 0.01, 95% confidence interval (CI) = [.01, .15].
Discussion
This research builds on literature demonstrating how the brain processes vocally expressed confidence in speech (Jiang & Pell, 2015, 2016a, 2016b; Jiang et al., 2017), providing new evidence that a speaker’s accent or identity jointly affects how listeners evaluate whether a statement is believable. As anticipated, statements produced in a confident voice were judged to be more believable overall than those that vocally expressed doubt (Jiang et al., 2018). However, when speakers used a confident voice, they were also assigned a range of positive social attributes (more competent, intelligent, possessing a higher social status, etc.) than when their voice lacked confidence. These results exemplify a broader “positive” bias towards the confident voice overall, irrespective of a speaker’s accent.
When the online brain response was examined, the early N100 and P200 appeared to be increased by accents that were more familiar to our Canadian participants (in-group, out-group/foreign), albeit in fundamentally different ways. In contrast, late negativity effects (500–1,200 ms) were systematically increased for all out-group accents when evaluating speaker believability. As utterances dynamically unfold, vocal expressions of doubt increased P200 and P300 responses over confident expressions for in-group speakers, whereas they increased N400 and late-negativity responses when evaluating out-group speakers. The implications of these patterns on the supporting neurocognitive architecture are elaborated in the following.
Inferring speaker believability from in-group speakers
The decoding of vocal information in spoken language is viewed as a multi-step process (Schirmer & Kotz, 2006). In the case of statements made by in-group speakers, our ERP results document the ongoing effects of vocally expressed confidence on the generation of believability inferences in the absence of explicit accent-related information for the first time. We first observed an increased N100 amplitude for confident versus doubtful statements, consistent with tasks that instructed listeners to evaluate the confidence level or “feeling of knowing” of in-group speakers (Jiang & Pell, 2016b). The P200 response was then increased for doubtful versus confident statements, in contrast to what Jiang and Pell (2015, 2016a) reported when listeners judged speaker confidence (confident > doubtful).
The auditory N100 and P200 are thought to index separable functions (e.g., Ho, Schroger, & Kotz, 2015). The N100 has been linked to early sensory encoding of acoustic properties of the input (Näätänen & Picton, 1987), and as such, this brain potential is sensitive to different types of sound categories (e.g., human vs. nonhuman sounds, Charest et al., 2009; nonlinguistic vs. speech-embedded vocal emotions, Pell et al., 2015). The observation that the N100 elicited by confident voices is larger across studies may be explained by the increased arousal level of underlying acoustic features (e.g., greater intensity; Sauter & Eimer, 2010). Differentiating confident and doubtful voices at this early stage ensures that emerging vocal expressions can be selected for attentional analysis according to their motivational significance (Pell et al., 2015), which is coded and reinforced in the P200 time window (Kotz & Paulmann, 2011; Paulmann et al., 2013). P200 amplitudes are enhanced by deployment of attentional resources to facilitate preferential processing of expressions that are more relevant (Pell et al., 2015) or contain more salient features, for detecting the “believability” trait of the speaker. Although the P200 was not associated with the believability response, the data reveal that N100 differences had longer lasting effects in our study, predicting believability decisions about certain speakers and indexing the social bias of individual listeners and their effects on behaviour in some conditions (see in the following). This highlights the N100 as a key neural stage in the process of drawing inferences about other people.
Changes in the P200 evoked by vocal expressions have been attributed to attentional shifts that facilitate preferential processing of cues that are significant in relation to contextual and task demands (Hensel et al., 2015; Paulmann et al., 2013; Pell et al., 2015; Schirmer, Chen, Ching, Tan, & Hong, 2013). The fact that this response was increased for doubtful statements, but only for in-group speakers, implies that vocal cues expressing doubt are quickly prioritised to infer whether a speaker is believable, augmenting the P200 amplitude over confident statements. Differential task demands seem to play a crucial role in determining which vocal cues are prioritised at this stage, explaining why an opposite pattern of modulation on P200 (confident > doubt) was observed when listeners focused on a speaker’s confidence level (Jiang & Pell, 2015; 2016). These findings emphasise that when a speaker does not have an accent, the differentiation and structuring of vocal confidence information occurs rapidly. Arguably, it would be advantageous to quickly divert attention to acoustic features that potentially mark a speaker as unbelievable—for example, syllable lengthening, increased pause duration, and rising pitch—to arrive at a decision about whether to believe what the speaker says (Carpenter, 2012; Leigh & Summers, 2013; Markham, 1968; McAleer, Todorov, & Belin, 2014; Ruva & Bryant, 2004; Tsantani, Belin, Paterson, & Mcaleer, 2016). In line with these arguments, we previously observed that doubtful statements produced by in-group speakers increased activation in the right STG when compared to confident voices (Jiang et al., 2017). These effects could reflect greater demands placed on auditory association areas (e.g., the ventral “what” stream of prosody perception, Sammler, Grosbras, Anwander, Bestelmeyer, & Belin, 2015) as listeners form a percept of the socio-emotional value of doubtful expressions, which are attentionally highlighted in the course of generating believability inferences.
Ongoing analysis of vocal confidence expressions revealed a P300-like effect which was larger for doubtful versus confident expressions in the 340–400 ms time interval. The P300/LPC reflects differences in the cognitive elaboration of motivationally salient nonverbal cues (Kubota & Ito, 2007; Ito, Thompson, & Cacioppo, 2004; Paulmann et al., 2013; Pell et al., 2015; Schirmer et al., 2006) or can be observed when linguistic cues are constrained by a highly predictive context (Molinaro & Carreiras, 2010; Vespignani et al., 2010). Increases in the late positivity have been reported when vocal confidence expressions require sustained monitoring to disambiguate subtle, graded meanings that refer to a speaker’s mental state (e.g., to differentiate “close-to-confident” voices from confident and doubtful voices, Jiang & Pell, 2015; Jiang & Pell, 2016b) or to resolve “mixed messages” in expressed confidence between the vocal and verbal channels (Jiang & Pell, 2016b). This neural response may exemplify conditions in which listeners conduct a more in-depth analysis of vocal features to resolve ambiguous messages or otherwise update an initially built utterance representation (Brouwer, Fitz, & Hoeks, 2012). Since doubtful statements continued to receive in-depth analysis over confident statements in the P300 time window, it can be argued that vocal markers of uncertainty act as primary input for generating inferences about whether to believe speakers who share the same accent with the listener. The data also emphasise that when judging in-group speakers, neurocognitive processing of expressed confidence in speech unfolds in a rapid sequence, allowing inferences to be made following the P300 time window.
Inferring speaker believability from out-group speakers: early effects
Behavioural and neural response patterns described for in-group speakers can be compared to situations in which listeners simultaneously encounter vocally expressed confidence and out-group accents. First, it is noteworthy that when speakers use a confident-sounding voice, out-group speakers with a foreign accent are generally perceived as less believable than native English speakers (Canadian or Australian), irrespective of whether English speakers share the same accent. This result bolsters claims of a negative social bias towards non-native patterns of pronunciation in a social evaluation task (e.g., Bresnahan et al., 2002; Lev-Ari & Keysar, 2010; Pantos & Perkins, 2013) and extends these findings to when speakers use a confident tone of voice. 8 Perceptually, our listeners could more clearly differentiate confident and doubtful statements produced by in-group speakers when compared to both out-groups; this difference was driven largely by doubtful expressions, which were rated as much less believable, as intended by the speaker, when produced by in-group versus out-group members. Given that not all studies report a bias towards out-group voices (Souza & Markman, 2013), it is possible that the speaker’s tone of voice is a relevant factor that should be considered when investigating group-related differences in speaker believability.
The neurophysiological data underscore that speaker identity creates an important context that alters both early and late neural responses to vocal confidence expressions. The effects of accent were first registered prior to 100 ms post-onset of a statement, showing increased N100 peaks to accents that were known to be familiar to our participants (Canadian and Québécois speakers of English). Modulation of N100 by different target accents is thought to be driven by the intelligibility of acoustic events, engaging superior temporal lobe–processing mechanisms (Scott, Blank, Rosen, & Wise, 2000; Yi, Smiljanic, & Chandrasekaran, 2014). This idea fits with our observation that N100 amplitudes were increased when listening to in-group versus out-group/regional speakers, who were perceived as less intelligible by Canadian listeners; also, N100 amplitudes were reduced in participants who rated the Australian accent as less intelligible. However, accent intelligibility does not explain why the N100 was largest in response to foreign-accented speakers who were considered least intelligible.
An alternate explanation is that N100 differences were modulated to a large extent by language experience (Porretta, Tremblay, & Bolger, 2017; Yi, Phelps, Smiljanic, & Chandrasekaran, 2013). A listener’s familiarity with a speaker’s accent is known to predict speech recognition accuracy (Bent & Bradlow, 2003; Bradlow & Pisoni, 1999). In recent work, the extent to which English listeners considered Korean-accented speech to be foreign predicted activations in the right primary auditory cortex, similar regions to those that encode speech intelligibility (Yi et al., 2013; Yi et al., 2014). These data argue that familiarity towards an accent shapes early neural processing, affecting low-level spectro-temporal analysis of acoustic properties of the signal (Grey, Schubel, McQueen, & Van Hell, 2018; Larraza & Best, 2018; Porretta, Tremblay, & Bolger, 2017). We propose that the high familiarity of the out-group/foreign accent to our listeners was largely responsible for accent-induced changes in the N100, despite the fact that listeners ultimately rated these speakers as less intelligible. The fact that the out-group/regional accent in our design was both less familiar and less intelligible could explain why the N100 amplitude was noticeably reduced, representing a combined influence of these factors. The notion that familiarity/experience with particular out-group accents is registered by the N100 is consistent with our evidence that attitudes about the foreign out-group had additional effects at the N100 stage among our listeners. We also found that the P200 amplitude was increased overall for the two familiar accents (in-group, out-group/foreign) compared to the regional accent. These patterns imply that experience with particular accents has a rapid and detectable effect on social-evaluative processes right from initial stages of acoustic-sensory processing.
The early time course for registering confidence-related differences in out-group voices was different from that observed when the speaker-listener shared the same accent. For foreign-accented speakers, vocal confidence was registered in a qualitatively similar manner in the N100 (confident > doubtful), but this pattern persisted in the P200, a reversal of what was observed for in-group speakers who seemed to prioritise emerging representations of doubt to form an impression of believability. As familiar accents in our paradigm led to enhanced perceptual processing of statements made by the out-group/foreign vs. regional speakers (N100), this may have allowed differences in vocally expressed confidence to be registered earlier and in a more differentiated manner for the foreign-accented group, although not in the same manner as for in-group speakers. For example, we found no evidence that listeners strategically re-oriented their attention to vocal cues that signal a lack of confidence when exposed to the out-group foreign accent (in both N100 and P200). The fact that confident/doubtful expressions were less acoustically and perceptually distinct when produced by out-group speakers (Tables 1 and 2) may have influenced processes underlying motivational significance detection in a way that contrasts with in-group speakers, driving preferential processing on different levels of vocally expressed confidence for in- and out-group speakers.
For the out-group/regional accent, the complete absence of confidence-related effects in the early N100 and P200 is noteworthy. As argued above, a lack of experience with these speakers, and possibly increased processing demands due to reduced intelligibility of the Australian accent, appeared to suspend early processes for registering motivationally significant details about their vocal confidence expressions, reported here and elsewhere (Jiang, Paulmann, Robin, & Pell, 2015; Jiang & Pell, 2016a, 2016b). In another ERP study, the authors concluded that listeners sometimes discontinue their evaluation of social information when processing (foreign) accented speech (Hatzidaki et al., 2015). Here, this idea could extend to the temporary suspension/interruption of early social-evaluative processes that help construct a representation of believability from vocal expressions when the accent of a speaker is unfamiliar to a listener (even for a regional accent). Interestingly, in a companion fMRI study, neural activity associated with empathy (e.g., the anterior cingulate cortex, medial superior frontal gyrus, and ventral medial prefrontal cortex) was also reduced when evaluating the current speakers with the out-group/regional accent compared to the in-group accent (Jiang et al., 2018). One can speculate that listeners are less inclined to attend to detailed socio-emotive features of speakers who are demographically or functionally different and unfamiliar (Fiske & Neuberg, 1990). This could lead to a suspension or delay in social-evaluative processes for encoding vocally expressed confidence. Pending replication of these effects, there can be little doubt that out-group accents have a major impact on early processes for marking the social significance of vocal expressions in the speech signal (see similar early N100 and P200 reduction in Kokinous, Kotz, Tavano, & Schröger, 2015; Sowman, Kuusik, & Johnson, 2012).
Inferring speaker believability from out-group speakers: late effects
We found that doubtful statements evoked a P300-like effect for in-group speakers, whereas they elicited an N400-like effect followed by a late negativity for all out-group speakers (starting at around 550 ms for the foreign accent and 900 ms for the Regional accent). Previous research has reported N400-like effects, which later merged into a sustained negativity, in response to words or utterances produced in different emotional tones (e.g., Paulmann, Ott, & Kotz, 2011; Spreckelmeyer, Altenmüller, Colonius, & Münte, 2013) or to contextually incongruent vocal exclamations (Bostanov & Kotchoubey, 2004). N400 amplitudes, which can refer to the relative effort in accessing/integrating new meanings into the speaker-related representation (Kutas & Federmeier, 2011), increase when words fail to match the voice-implied social identity of a speaker (e.g., their social class or sex; Van Berkum et al., 2008; van den Brink et al., 2012). N400 effects also emerge when vocally expressed confidence violates a preceding linguistic phrase made by the speaker (Jiang & Pell, 2016a; see also Schirmer et al., 2013). In contrast, the late negativity suggests a second-pass, combinatorial analysis of vocal features in face of integration or access difficulties (Kissler, Herbert, Peyk, & Junghöfer, 2007; Paulmann et al., 2011), to form an integrated representation (Bostanov & Kotchoubey, 2004; Wu & Coulson, 2007) or to generate pragmatic inferences (Baggio, van Lambalgen, & Hagoort, 2008; Jiang et al., 2013).
In our study, a listener’s attempt to form a coherent out-group speaker representation of believability is seemingly complicated by the fact that vocal attributes rapidly activate meaning about the speaker’s out-group status as information about their confidence state unfolds while producing a statement. For in-group speakers, doubtful voices were the subject of in-depth appraisal in the P300 time window; however, these expressions were registered later and in a hypothetically more effortful manner for out-group speakers. Doubtful voices amplified the N400 response for speakers with a foreign accent (peaking at 501 ms); then, they were associated with an increased late negativity for both out-group accents in the 550–1,200 ms interval. Independent of confidence distinctions, out-group accents were also associated with a stronger negativity response than in-group accents in the late time window (550–1,200 ms).
It can be hypothesised that when out-group accents are registered, the failure to efficiently tag doubtful voices as motivationally salient at early processing stages (N100, P200) promotes ongoing difficulties in the integration of different meaning sources relevant for rendering a believability inference about out-group speakers (irrespective of accent type). Some of these difficulties could be driven by the increased demands of analysing vocal cues signifying doubt in the face of non-standard input; this explanation is suggested by the increased N400 amplitude we observed for less intelligible foreign-accented speakers and the fact that the late negativity was increased for all out-group accents in general. Another possibility is that listeners typically rely on contextual knowledge when building a non-native representation of what is being communicated by accented speakers (Goslin et al., 2012; Lev-Ari, 2015). In a recent study that highlights the importance of context in accent perception, words spoken by accented speakers were perceived as stronger in accent when embedded in a minimally versus strongly constraining sentence context (Incera, Shah, McLennan, & Wetzel, 2017). Given that no contextual information was available in our task, this may have rendered the process of inferring believability from out-group voices longer and more effortful at late stages of cognitive processing and inference-making (Collard, Corley, MacGregor, & Donaldson, 2008; Corley, MacGregor, & Donaldson, 2007; Zougkou et al., 2017). Social attitudes associated with particular out-groups may also lead to a protracted analysis of vocally expressed confidence in speech; we found that foreign-accented speakers who were rated as less competent elicited increased N400 and late negativity responses, establishing a clear relationship between out-group social impressions and presumed difficulties in the construction of a non-native representation of speaker believability. Together, these findings point to marked differences in the time course and nature of neural processes that lead to believability decisions about in-group and out-group speakers.
Effects of social categorization and bias
Humans are highly adept at detecting foreign accents, possibly as an evolved trait for determining group membership and fostering in-group relations (Munro, Derwing, & Burgess, 2010). According to long-standing theory (Charman, Marianna, Jon, & Hyman, 2010; Fiske & Neuberg, 1990), category-based heuristics play an important role in forming impressions of another person; the activation of stereotypes and perceived out-group characteristics provides a “shortcut” for construing another person’s attributes and mental state, facilitating social behaviour. Individuals who “have an accent” may be treated as exemplars of a particular linguistic or cultural out-group, or simply as non-members of one’s own group (Hornsey, 2008). Of key importance here, social categorization is thought to take precedence during person perception and influence processes that analyse stimulus features provided by a speaker on a more “piecemeal” basis, such as vocal expressions conveying socio-affective or attitudinal meanings.
Our data supply new evidence that social categorization via out-group accents alters how the brain responds to vocal confidence expressions in speech (Jiang et al., 2018) and fundamentally alters the pattern of neural responses that act on vocal expressions as they are decoded and associated with other knowledge to derive social impressions of a speaker. Almost immediately after listeners begin to process a statement (by 100 ms), accent-based social categorization appears to interfere with and delay critical operations for registering the significance of vocal expressions based on the acoustic features provided by the speaker. Irrespective of the type of out-group accent, this induced processes for re-constructing a speaker representation of believability (i.e., late negativities), which were not observed when the speaker-listener shared the same accent.
Interestingly, while the foreign speakers of English were generally rated as less believable, ERP patterns show that the extent to which individuals held a positive social bias towards the Québécois accent predicted their believability ratings (Pantos & Perkins, 2013) and this relationship was mediated by the strength of the N100 response. 9 This result emphasises that listeners had begun to map accent information onto social category knowledge in the first 100 ms of the utterance, at least for familiar out-group accents, introducing biases that ultimately shaped a believability decision towards statements produced in that accent (Sumner, 2015). Although a negative social bias towards the out-group accent also increases difficulties in the construction of a non-native representation, with increased N400/late negativity effects, such difficulties do not seem to further alter the believability decision. These findings provide new evidence on how initial social categorization processes have an impact on the ultimate formation of speaker impressions.
One must be mindful that attitudes and affective responses towards an accent are not static and can be modulated in various ways by the listener’s identity and beliefs; for example, Bresnahan and colleagues (2002) showed that Americans with a weaker ethnic identity judged standard American accents to be more pleasant, arousing, and more dominant than foreign out-group accents. The fact that our study was conducted in central Montreal, where a bicultural (French/English) identity is prevalent, could explain why our analyses were more sensitive to differences in social bias towards the Foreign and not the regional out-group accent. For the out-group/regional accent, increased demands on linguistic (phonological) processing might have contributed more heavily to our current findings; lack of direct experience with Australian speakers might have limited any detailed effects of social category knowledge and related biases on vocal expression processing, while still producing robust differences due to the detection of an out-group speaker. Future work should pay close attention to both experience and intelligibility of out-group accents and probe what explicit and implicit attitudes listeners hold about target out-groups, to usefully advance this literature.
A neurocognitive architecture underlying person perception from in-group/out-group voices
Our investigation presents a novel case for looking into different stages of social perception based on evidence from the vocal channel of communication, with fine-grained temporal precision. Using fMRI, Jiang et al. (2018) concluded that social categorization of a speaker’s in-group/out-group status influences believability impressions and related brain activity; they reported accent-related differences in temporal, medial parietal–occipital, and basal ganglia regions when Canadian listeners evaluated vocally expressed confidence and had to use this information to construe whether in-group versus out-group speakers are believable. Moreover, when statements produced by out-group speakers were judged to be more believable, increased functional connectivity was observed between the right STG and the right middle temporal gyrus/left lingual gyrus; this implies that processes for decoding vocal confidence cues in the right superior temporal cortex are engaged to a greater extent when believability impressions are derived from out-group voices. Based on patterns in the functional brain activity, the authors postulated that out-group voices lead to a more effortful, piece-meal analysis of vocal confidence cues during social perception; believability inferences about out-group speakers cannot proceed smoothly due to difficulties in phonological processing and/or the absence of personal experience and knowledge that is acquired for in-group members. Rather, social biases tend to hamper processes for analysing or “individuating” the actual cues provided by out-group speakers in the speech signal (Jiang et al., 2018).
The neurophysiological data allow refinement of these ideas, as outlined in Figure 5. It should be noted that while different types of meaning begin to be extracted in parallel from vocal cues directly from utterance onset, the analysis of vocal expressions (e.g., emotions, attitudes, affective stance) is typically accomplished over a longer time interval than vocal cues that refer to a speaker’s identity (e.g., Pell & Kotz, 2011). Based on the nature and time course of our current effects, we hypothesise that unfamiliar in-group accents allow individuating features of the speaker (e.g., vocal confidence expressions) to be processed with minimal impedance; this quickly highlights the value of motivationally significant cues (e.g., cues reflecting doubt, P200), which receive ongoing evaluation to refine impressions of their social relevance for inferring believability (P300/LPC). Given that there were no neurophysiological signs that listeners were taxed in their use of vocal confidence information to form an impression of believability for in-group speakers, we argue that forming these impressions is facilitated by drawing upon personal experience and detailed socio-pragmatic knowledge of in-group members (Adams et al., 2009; Han & Northoff, 2008; Jiang et al., 2017), due to shared knowledge of “nonverbal dialects” (e.g., Elfenbein, 2013). According to our data, social perception via this “direct path” (Jiang et al., 2018) seems to lead to greater perceptual sensitivity when characterising graded differences in the mental state of in-group speakers based on their vocal expressions.
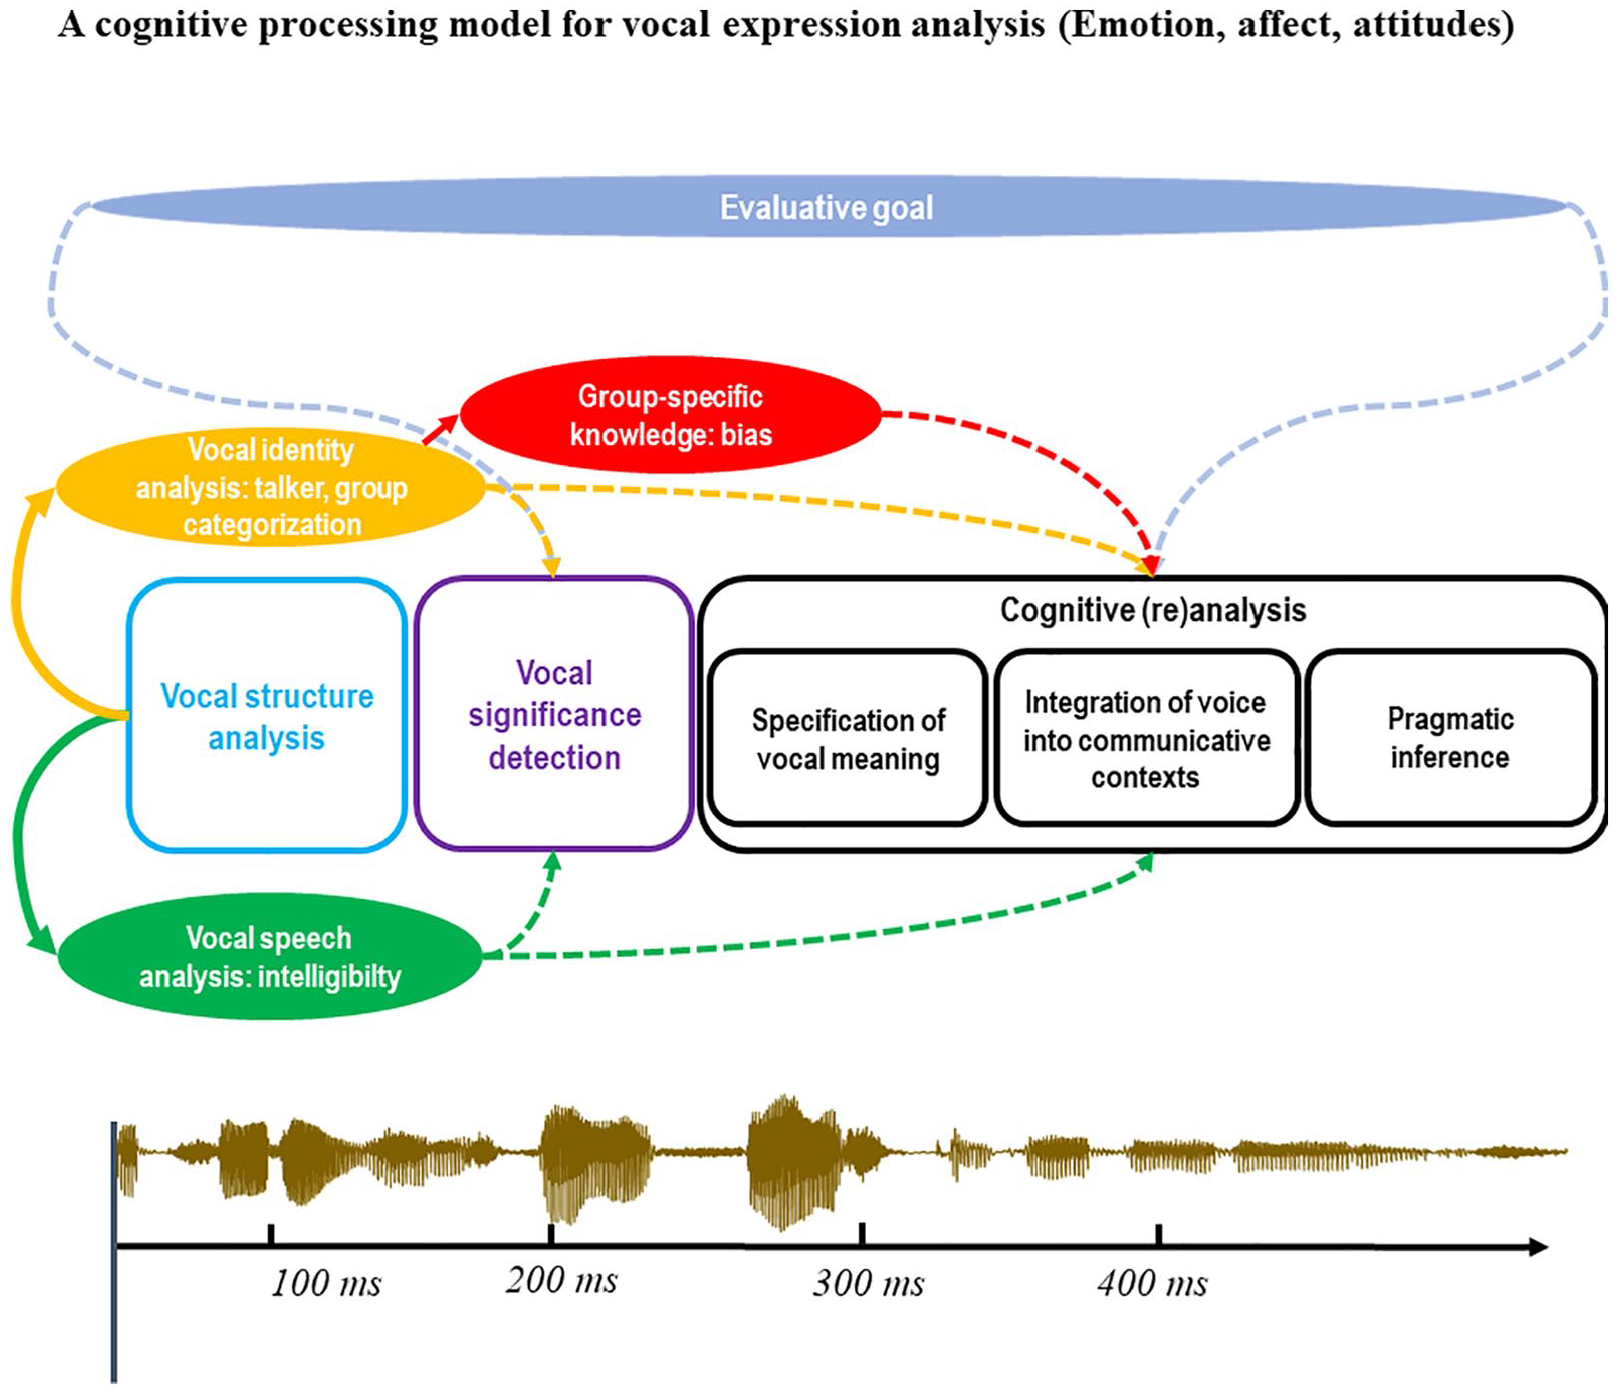
A cognitive model of vocal expression processing: Unfamiliar in-group accents allow individuating features of the speaker (e.g., vocal confidence, affect) to be processed with minimal impedance (“direct route”). Social impressions of in-group speakers are facilitated by personal experience and detailed socio-pragmatic knowledge at late cognitive stages. For unfamiliar out-group speakers, social category information activated by accent-related features alters/delays the piecemeal process for determining the socio-affective relevance of vocal expressions, causing listeners to follow a more effortful, prolonged “indirect route” to form social impressions about out-group speakers. The perceptual quality and listener’s experience with an accent, as well as stereotypical knowledge/attitudes held about the speaker out-group, contributes incrementally to the construction of a non-native speaker representation from vocal cues.
For unfamiliar out-group speakers, social category information activated by accent-related features tends to alter and delay the piece-meal process for determining the socio-affective relevance of concurrent vocal expressions. This causes listeners to follow a more effortful and prolonged “indirect route” to form social impressions about out-group voices (Figure 5). For certain speakers, knowledge about a perceived out-group (biases, experience) may hamper how attention is strategically allocated to social meanings conveyed by the accented voice, producing qualitative differences in N100 and P200 (e.g., for our foreign-accented speakers). In other instances, increased demands on phonological encoding of unfamiliar, less intelligible accents may interfere with early procedures for semantically encoding the emerging vocal expression altogether (e.g., for our regional out-group speakers). The N100 acts as the initial impression formation stage and appears to dominate the speaker believability judgement, controlling the extent to which believability impressions are influenced by an individual’s bias towards out-group speaker characteristics.
In both scenarios, failure to rapidly incorporate vocal expression information into a non-native speaker representation promotes delays and ongoing processing difficulty for out-group speakers, as reflected by N400-late negativity effects. We speculate that the perceptual quality of an accent, a listener’s level of exposure/familiarity, as well as stereotypical knowledge/attitudes about the speaker out-group all contribute incrementally in different ways to the construction of a non-native speaker representation from vocal cues via the indirect route (Fiske & Neuberg, 1990). Ultimately, a resolution process must coordinate processing based on the speaker category and their expressed confidence to re-adjust believability impressions; our data suggest that these efforts are indexed by the late negativity, occurring within the 550–1,200 ms time range. These ideas can serve as a stepping stone for future work.
Despite evidence that the neurocognitive mechanisms applied to in-group and out-group voices are qualitatively distinct and that out-group voices promote a more complex and protracted stage of re-analysis, it is noteworthy that differences at the neurocognitive level do not always translate into obvious differences in how different speaker groups are judged along certain social dimensions. For example, Canadian listeners rated Canadian (in-group) and Australian (out-group/regional) speakers as equally believable when they used a confident voice, despite evidence that social categorization fundamentally alters the multistage analysis of vocal confidence expressions for the Australian speakers. Our study is instrumental for exploring these and other questions that advance knowledge of how interacting sources of voice information are used in speech communication, interpersonal behaviour, and person perception.
Footnotes
Acknowledgements
We thank François Anderson-de Serres, Joshua McCall, Shawn Wen, and Kelly Hennegan for running tests and/or analysing data.
Declaration of conflicting interests
The authors declare that the research was conducted in the absence of any commercial or financial relationships that could be construed as a potential conflict of interest.
Funding
The author(s) disclosed receipt of the following financial support for the research, authorship and/or publication of this article: This work was supported by Insight Grant from the Social Sciences and Humanities Research Council of Canada (to M.D. Pell), McGill McLaughlin Scholarship, the Fundamental Research Fund for the Central Universities from Tongji University and a research fund from the Shanghai Planning Office of Philosophy and Social Science (to X. Jiang).