



Abstract
Attentional networks are sensitive to sleep deprivation. However, variation in attentional performance as a function of normal sleep parameters is understudied. We examined whether attentional performance is influenced by (a) individual differences in sleep duration, (b) sleep duration variability, and/or (c) their interaction. A total of 57 healthy participants (61.4% female, Mage = 32.37 years, SD = 8.68) completed questionnaires, wore wrist actigraphy for 1 week, and subsequently completed the attention network test. Sleep duration and sleep duration variability did not predict orienting score, executive control score, or error rates. Sleep duration variability appeared to moderate the association between sleep duration with overall reaction time (β = –.34, t = –2.13, p = .04) and alerting scores (β = .43, t = 2.94, p = .01), though further inspection of the data suggested that these were spurious findings. Time of testing was a significant predictor of alerting score (β = .35, t = 2.96, p = .01), chronotype of orienting (β = .31, t = 2.28, p = .03), and age of overall reaction time (β = .35, t = 2.70, p = .01). Our results highlight the importance of examining the associations between variations in sleep–wake patterns and attentional networks in samples with greater variation in sleep, as well as the importance of rigorously teasing apart mechanisms of the sleep homeostat from those related to the circadian rhythm in studies examining cognition.
Introduction
Insufficient sleep, in either quantity or quality, initiates a cascade of physiological events, which alter brain neurochemistry, and in consequence—our health and behaviour. Perhaps, one of the most notable consequences of insufficient sleep is the inability to successfully focus attention and maintain an alert state. Numerous studies have highlighted the detrimental effects of experimentally induced sleep restriction or total sleep deprivation on vigilant attention (Basner & Dinges, 2011; Basner et al., 2011; Lim & Dinges, 2008), while other studies show that response speeds decrease in a dose–response manner as sleep duration decreases (Belenky et al., 2003; Van Dongen et al., 2003).
Some reports suggest that contemporary society imposes a state of chronic sleep deprivation in the Western world (Webb & Agnew, 1975). Today it is common to impose restrictions on our sleep to optimise our time spent awake, but this comes at a cost to our health, mood, occupational safety, and cognition (Cappuccio et al., 2010; Fernandez-Mendoza et al., 2010; Kalmbach et al., 2017). An epidemiological study demonstrated that the typical sleep duration of young adults during weekdays is around 6.7 hr (Breslau et al., 1997), which is below the 8 hr recommended for this age group (Hirshkowitz et al., 2015). In addition to suboptimal sleep duration, adherence to consistent and biologically compatible sleep schedules are often impinged by external environmental factors such as work commitments, social engagements, and 24/7 electronic stimulation (Wittmann et al., 2006). Indeed, it is common to see a mismatch between sleep obtained on work-days and that obtained on free-days, which is indicative of a state of “social jetlag,” imposed by our social world (Wittmann et al., 2006). On work-days, constrained sleep offset times often result in drastically curtailed sleep duration—a sleep “debt” that is paid off on free-days by extending sleep where the opportunity permits. However, employing compensatory behaviours, such as extension of time in bed on free-days, and going to bed earlier than what would be dictated by the endogenous circadian rhythm on work-days, is maladaptive (Buysse et al., 2010). This coupling of short sleep duration and self-imposed variability in sleep behaviours may disrupt the homeostatic drive for sleep, making it difficult to get to sleep when desired, and potentially contributing to a delayed circadian phase. Consequently, we may develop a sleep schedule at conflict with the constraints of the social world.
Several studies have shown that intra-individual variability in sleep duration is often greater than that observed between individuals (Knutson et al., 2007; Tworoger et al., 2006), and it is possible that sleep duration variability contributes to the development or maintenance of sleep disorders (Billiard et al., 1987; Buysse et al., 2010; Spielman et al., 1987). Indeed, individuals with insomnia often experience night-to-night variability across various domains assessed subjectively by sleep diaries, and objectively—by actigraphy (Buysse et al., 2010; Vallières et al., 2005; Vallières et al., 2011). Difficulty sleeping on one night may increase sleep pressure such that the subsequent sleep period is longer, deeper, and more restorative. In some cases, several nights of poor sleep may be followed by a night of relatively good sleep (Vallières et al., 2005; Vallières et al., 2011), though this pattern is not predictably consistent (Buysse et al., 2010).
While most research on the consequences of insufficient sleep have focussed on short sleep duration or sleep disruption, the importance of consistent sleep schedules is often overlooked. Sleep variability has been broadly defined as inconsistencies in various sleep indices including sleep onset and offset timing, sleep latency, sleep quality, wake after sleep onset, sleep duration, and efficiency. It is typically calculated as the variability from weekdays to weekends (Lemola et al., 2012) or as the within-subject standard deviation for the corresponding variables over the course of several days (Whiting & Murdock, 2016) to weeks (Lemola et al., 2013; Lev Ari & Shulman, 2012; Sánchez et al., 2012).
Greater sleep variability has been negatively associated with health (e.g., higher body mass index: Moore et al., 2011), mood (e.g., poorer subjective well-being: Lemola et al., 2013; increased severity of depression: Suh et al., 2012), and behaviour (e.g., adolescent aggression: Lemola et al., 2012). Of particular relevance to the current study, Whiting and Murdock (2016) demonstrated that sleep duration variability moderates the association between sleep duration and attentional disengagement, that is, the capacity to withdraw attention from the currently focused stimulus (attentional switch). Shorter sleep duration was associated with poorer ability to switch attention when coupled with low sleep duration variability. Therefore, consistently short sleep duration was associated with greatest deficits in attentional disengagement, and consistently longer sleep duration was associated with better performance.
The majority of work on visual attention has used the “gold standard” measure of the psychomotor vigilance test (PVT), which has consistently been shown to be sensitive to sleep deprivation (see Tkachenko & Dinges, 2018, for a review). However, visual attention is not limited to our ability to switch focus between stimuli; it is a complex system of functionally and anatomically distinct brain networks, which support our ability to (a) maintain an “alert” state (alerting network), (b) “orient” attention to stimuli (orienting network), and (c) resolve conflict when numerous stimuli simultaneously compete for attention (executive control network) (Fernandez-Duque & Posner, 2001 ; Petersen & Posner, 2012). These networks are governed by distinct neurobiological pathways (Fan & Posner, 2004), and they are individually supported by network-specific genetic modulators (Fossella et al., 2002), making it likely that they are also differentially affected by sleep. Indeed, previous research has registered differential effects of sleep deprivation on the functioning of these distinct networks (see Tkachenko & Dinges, 2018). For example, one study compared the attention network test (ANT) performance at baseline versus following 24-hr of sleep deprivation within subjects and observed longer reaction times (RTs), poorer accuracy, and diminished P3 event-related potential response following sleep deprivation (Trujillo et al., 2009). Similarly, another study demonstrated longer RTs and impaired functioning of the orienting and executive control networks following sleep deprivation compared with baseline (Martella et al., 2011), though these effects were only partially replicated by some researchers (Jugovac & Cavallero, 2012) and not replicated by others (Muto et al., 2012; Roca et al., 2012).
Despite this growing body of research on the relationships between experimentally induced sleep deprivation and the performance of attentional networks, a dearth of research focuses on what happens in the real world. Our own previous work demonstrated that impairments in attentional performance emerge after 18-hr of sustained wakefulness—a period of wakefulness, which is typical of many adults during the working week (Barclay & Myachykov, 2017). Given that today’s society may foster inconsistent sleep patterns due to the changing responsibilities on work- and free-days, it appears pertinent to examine in detail the influence of sleep duration variability on attention and to determine whether sleep duration and its variability have differential effects on distinct attentional networks.
Thus, this study investigated the associations between sleep duration over 1 week assessed by actigraphy and the efficiency of the attentional networks, as well as the possibility that these associations are moderated by sleep duration variability. We hypothesised that poorer attentional performance would be predicted by (a) shorter sleep duration and greater sleep duration variability, independently, and (b) consistently shorter/inconsistently longer sleep duration across the week. Given previously observed chronotype and time-of-day effects on attentional performance (e.g., Barclay & Myachykov, 2017; Matchock & Mordkoff, 2009), analyses accounted for their potential direct and interactive effects where relevant.
Method
Participants
Participants were recruited from the general population of England through poster advertisements; emails to staff and students of Northumbria University, Sheffield Hallam University, and University of Oxford; and through social media. To be eligible to participate, potential participants had to be between 22 and 50 years of age; not taking any medications that may affect their sleep; not have a history of/or current medical, neurological, or psychiatric illness (including anxiety or depression); not have a sleep disorder (treated or untreated); and not be a shift worker. A total of 58 participants meeting these eligibility criteria initially enrolled in the study; 57 provided complete data (61.4% female, Mage = 32.37 years, SD = 8.68).
Measures
Screening questionnaire
An in-house screening questionnaire assessing sleep, sleep disorders, general health, and demographic information assessed eligibility for participation.
Sleep quality
Sleep quality over the past month was assessed using the Pittsburgh Sleep Quality Index (PSQI: Buysse et al., 1989). The PSQI is an 18-item self-report questionnaire, which assesses seven components of sleep quality: subjective sleep quality, sleep latency, sleep duration, sleep efficiency, sleep disturbances, use of sleeping medication, and daytime dysfunction. Component scores are summed to produce a global sleep quality score ranging from 0 to 21. Higher scores represent poorer sleep quality. Global sleep quality score was considered as a covariate in the statistical analyses if it was shown to be associated with the dependent variable of interest.
Chronotype
Chronotype was assessed using the Morningness–Eveningness Questionnaire (MEQ: Horne & Östberg, 1976). The MEQ is a 19-item self-report questionnaire, which assesses preferred timing of daytime activities, sleep habits, hours of peak performance, and times of “feeling best” and maximum alertness. Responses are combined to provide a total score ranging from 16 to 86. Higher scores represent a tendency towards morningness. Chronotype score was considered as a covariate in the statistical analyses if it was shown to be associated with the dependent variable of interest.
Sleepiness
State sleepiness was assessed using the Stanford Sleepiness Scale (SSS: Hoddes et al., 1972). The SSS is a 1-item measure assessing momentary alertness. Responses range from 1 (wide awake) to 7 (sleep onset soon). Sleepiness was considered as a covariate in the statistical analyses if it was shown to be associated with the dependent variable of interest.
Actigraphy
Actilife GT3X and CamNtech Ltd MW8 actiwatches were used to detect movement bouts, worn for seven consecutive nights on the non-dominant wrist. Data collection started immediately following the initial laboratory visit and concluded on the morning of Day 8. Actilife 5 (Actigraph Corp, 2011) and Motionware 1.1.25 software were used to analyse the actigraphy data to provide summary statistics of the participants’ weekly sleep. We used the Sadeh algorithm (Sadeh et al., 1994) to determine sleep–wake status for each 60 s (Actilife) or 30 s (CamNtech) epoch with 30 Hz sample rate, as per device recommendations for optimal sleep recording (note that there were no differences between device type on any of the independent variables or outcomes of interest). Participants also kept daily sleep diaries, indicating bed-time and rise-time, and these times were entered into the software as start times for actigraphic analysis (i.e., to indicate intention to sleep). Sleep duration was averaged for each participant across the seven nights. Variability in sleep duration was calculated as the within-participant standard deviation in sleep duration across the seven nights.
Attention
The ANT (Fan et al., 2002) is a computerised RT task used to examine the individual attentional networks’ performance (see Figure 1). In the ANT, participants perform on trials containing centre, double, spatial cues, or no cues (100 ms) between two central fixation events. At the second central fixation (400 ms), the target arrow (left or right) is presented either above or below the fixation cross and is either presented alone (neutral condition) with two flankers either side pointing in the same direction (congruent condition) or with two flankers either side pointing in the opposite direction (incongruent condition) (lasting no longer than 1,700 ms). Upon presentation of the target, participants are required to indicate by pressing designated keys on a computer keyboard whether the corresponding arrows point leftwards or rightwards. As outlined by us previously (Barclay & Myachykov, 2017), the ANT provides a raw RT measure for each of the conditions (cue type: no cue, centre cue, double cue, spatial cue; flanker type: neutral, congruent, incongruent) as well as error rates. In addition, the ANT provides specific measures of alerting, orienting, and conflict resolution (executive control). The alerting score is calculated by subtracting the mean RT of the double-cue conditions (which alerts the participant to the imminent target and provides no information on its location either above or below the cross) from the mean RT of the no-cue conditions. The orienting score is calculated by subtracting the mean RT of the spatial cue conditions (which alerts participants to the imminent target and provides information on its location) from the mean RT of the centre cue conditions (which only alerts participants to the imminent target at one location). The conflict (executive control) score is calculated by subtracting the mean RT of all congruent flanked conditions from all incongruent flanked conditions (from all cue types). Lower scores typically indicate difficulty: (a) maintaining alertness without a cue (alerting); (b) disengaging from the centre cue (orienting); or (c) resolving conflict (executive control) (Fan & Posner, 2004).

Attention network test procedure: (a) the four cue conditions, (b) the flanker types, and (c) an example of the procedure.
Procedure
Interested participants completed the screening questionnaire to confirm eligibility. Eligible participants met with the researcher to provide their informed consent and to receive an actiwatch and sleep diary as well as information regarding their use each day/night. Participants wore actiwatches for seven consecutive nights, and they were informed that the week should be “typical” for them. Participants returned to the laboratory on Day 8 to hand back the actiwatch and sleep diary; to complete the PSQI, MEQ, and SSS; and to participate in the ANT. Note that all participants completed the ANT between 8 am and 8 pm (57% completed the ANT before 12 pm and 89% before 6 pm). Time of testing was included in statistical analyses as a covariate. All procedures complied with the ethical principles laid out by the American Psychological Association and the Declaration of Helsinki. Approval was granted by Oxford Central University Research Ethics Committee and Northumbria University Psychology Department Ethics Committee.
Statistical analyses
Previous researchers observed a large effect size for change in R2 for sleep duration variability predicting one facet of attention (Whiting & Murdock, 2016). In this study, a power calculation using G*Power indicated that to identify large effects as hypothesised (i.e., F2 for ΔR2 ⩾ .35), 47 participants would be required to achieve 90% power with an α < .01 (Cohen, 1988). Our final sample of 57 participants provided sufficient power to address our hypotheses. Descriptive statistics were first derived followed by t-tests to examine possible sex differences in the dependent and independent variables. Correlations between dependent variables, independent variables, and potential covariates were then examined. A repeated-measures within-subject analysis of variance (ANOVA) was performed to examine the sensitivity of the ANT in the current sample. A series of hierarchical regression models were then run for each dependent variable (overall mean RT; alerting, orienting, and executive control scores; and overall error rates). Covariates that were significantly correlated with the outcome variables were incorporated in regression models in the first steps (age, chronotype, and time of testing). In each regression model, predictor variables and covariates were grand-mean centred. A reciprocal transformation was applied to the error rate data to reduce positive skew. Simultaneous regression models were also run to derive individual coefficients for each predictor/covariate for significant models.
We examined five models in separate blocks as follows: (a) covariate 1 (if applicable), (b) covariate 2 (if applicable), (c) sleep duration, (d) sleep duration variability, and (e) sleep duration × sleep duration variability interaction. Moderation models were run using the PROCESS tool for SPSS (Hayes, 2013) to further examine significant interactions. Of note, linear regression models were also run with covariates entered in the last steps to examine potential mediation effects. Mediation effects were not indicated for any models (models not reported, available upon request). Significance of each model, and each predictor within each model, was considered at a Bonferroni corrected level of p < .01 (.05/5) to account for the multiple testing of ANT-derived dependent variables.
Results
Mean sleep quality score was 4.39 (SD = 2.24), indicating good sleep, and chronotype score was 54.47 (SD = 10.43), indicating a largely “neither” type chronotype. Mean actigraphically measured sleep duration across the week was 421.45 (SD = 39.70, range = 336.71–541.71) min, and mean variability in sleep duration across the week was 60.99 (SD = 38.42, range = 16.22–256.14) min. Mean ANT RTs were pooled from all correct trials for all participants. Incorrect trials accounted for 3.65% of the total trials. In addition, trials with RT <200 ms and >4 absolute deviations from the median (MAD; see Leys et al., 2013 for information) were excluded from the analysis (2.87% of correct trials). In total, 6.41% of trials were excluded. Table 1 shows the mean RT and standard deviation and Table 2 the mean error rates and standard deviation for each of the experimental conditions (4 × cue type; 3 × flanker type).
Mean and standard deviation of RT (ms) for each experimental condition of the ANT (correct trials only and outliers 4 absolute deviations from the median excluded).

RT: reaction time; ANT: attention network test.
Percentage of errors and standard deviation for each experimental condition of the ANT.
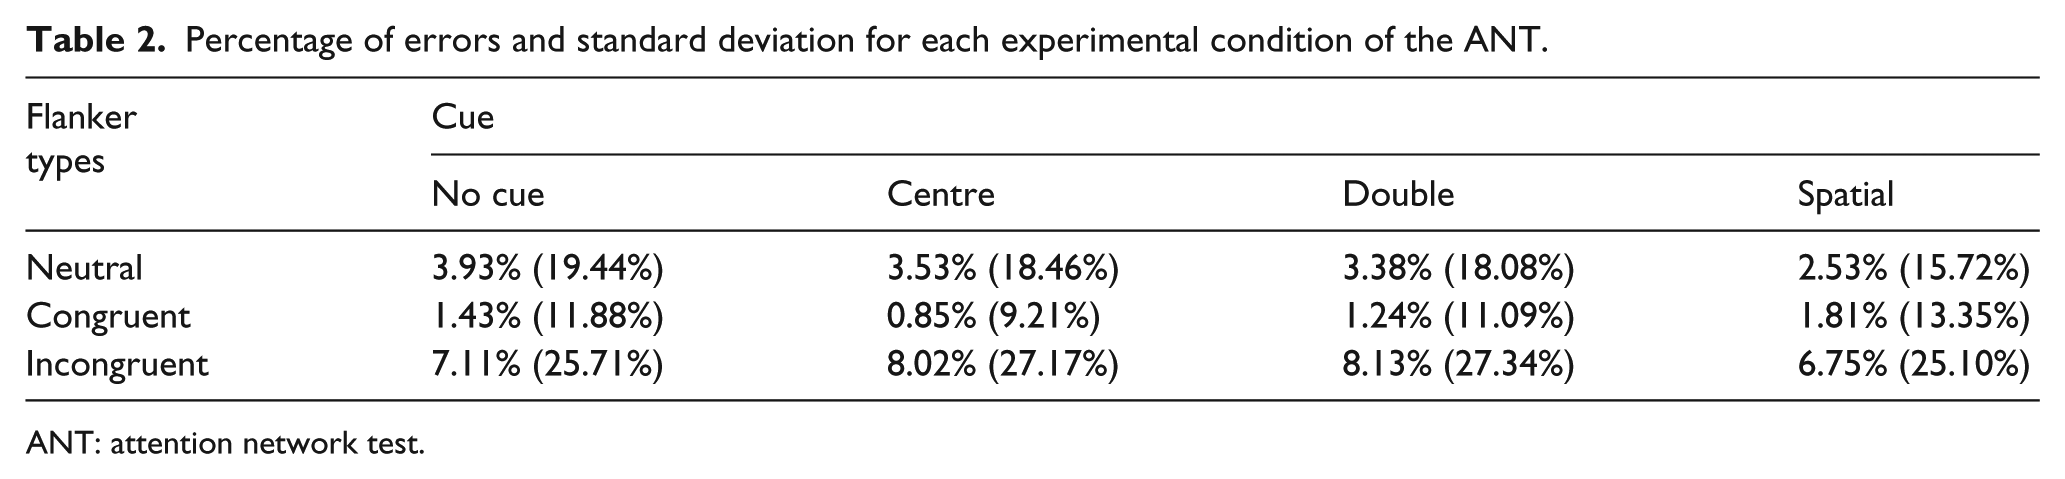
ANT: attention network test.
There were sex differences in actigraphically derived mean sleep durations, t(55) = –2.89, p < .05, Hedges’ g = .79. Males had significantly shorter mean sleep duration (M = 403.44 min, SD = 34.39 min) than females (M = 432.76 min, SD = 39.03 min). There were also significant sex differences in orienting, t(55) = –2.35, p < .05, Hedges’ g = .64. Orienting score for males was significantly lower (M = 22.11, SD = 17.63) than females (M = 33.94, SD = 19.00), suggesting that females were faster to orient their attention. There were no sex differences in any of the remaining key actigraphically assessed sleep variables or key ANT variables, sleep duration variability: t(55) = 0.95, p = .35; overall RT: t(55) = –0.54, p = .59; alerting: t(55) = 0.55, p = .59; executive control: t(55) = 0.16, p = .87; and overall error rates: t(55) = 0.04, p = .97. There were several significant correlations that are fundamental to the analyses (see Table 3): (a) older age and longer overall RTs; (b) lower sleep duration variability and poorer alerting scores; (c) older age and poorer alerting scores; (d) earlier time of testing and poorer alerting scores; (e) younger age and poorer orienting scores; and (f) increasing tendency towards eveningness and poorer orienting scores.
Correlations between key dependent variables, independent variables, and potential covariates (raw data).
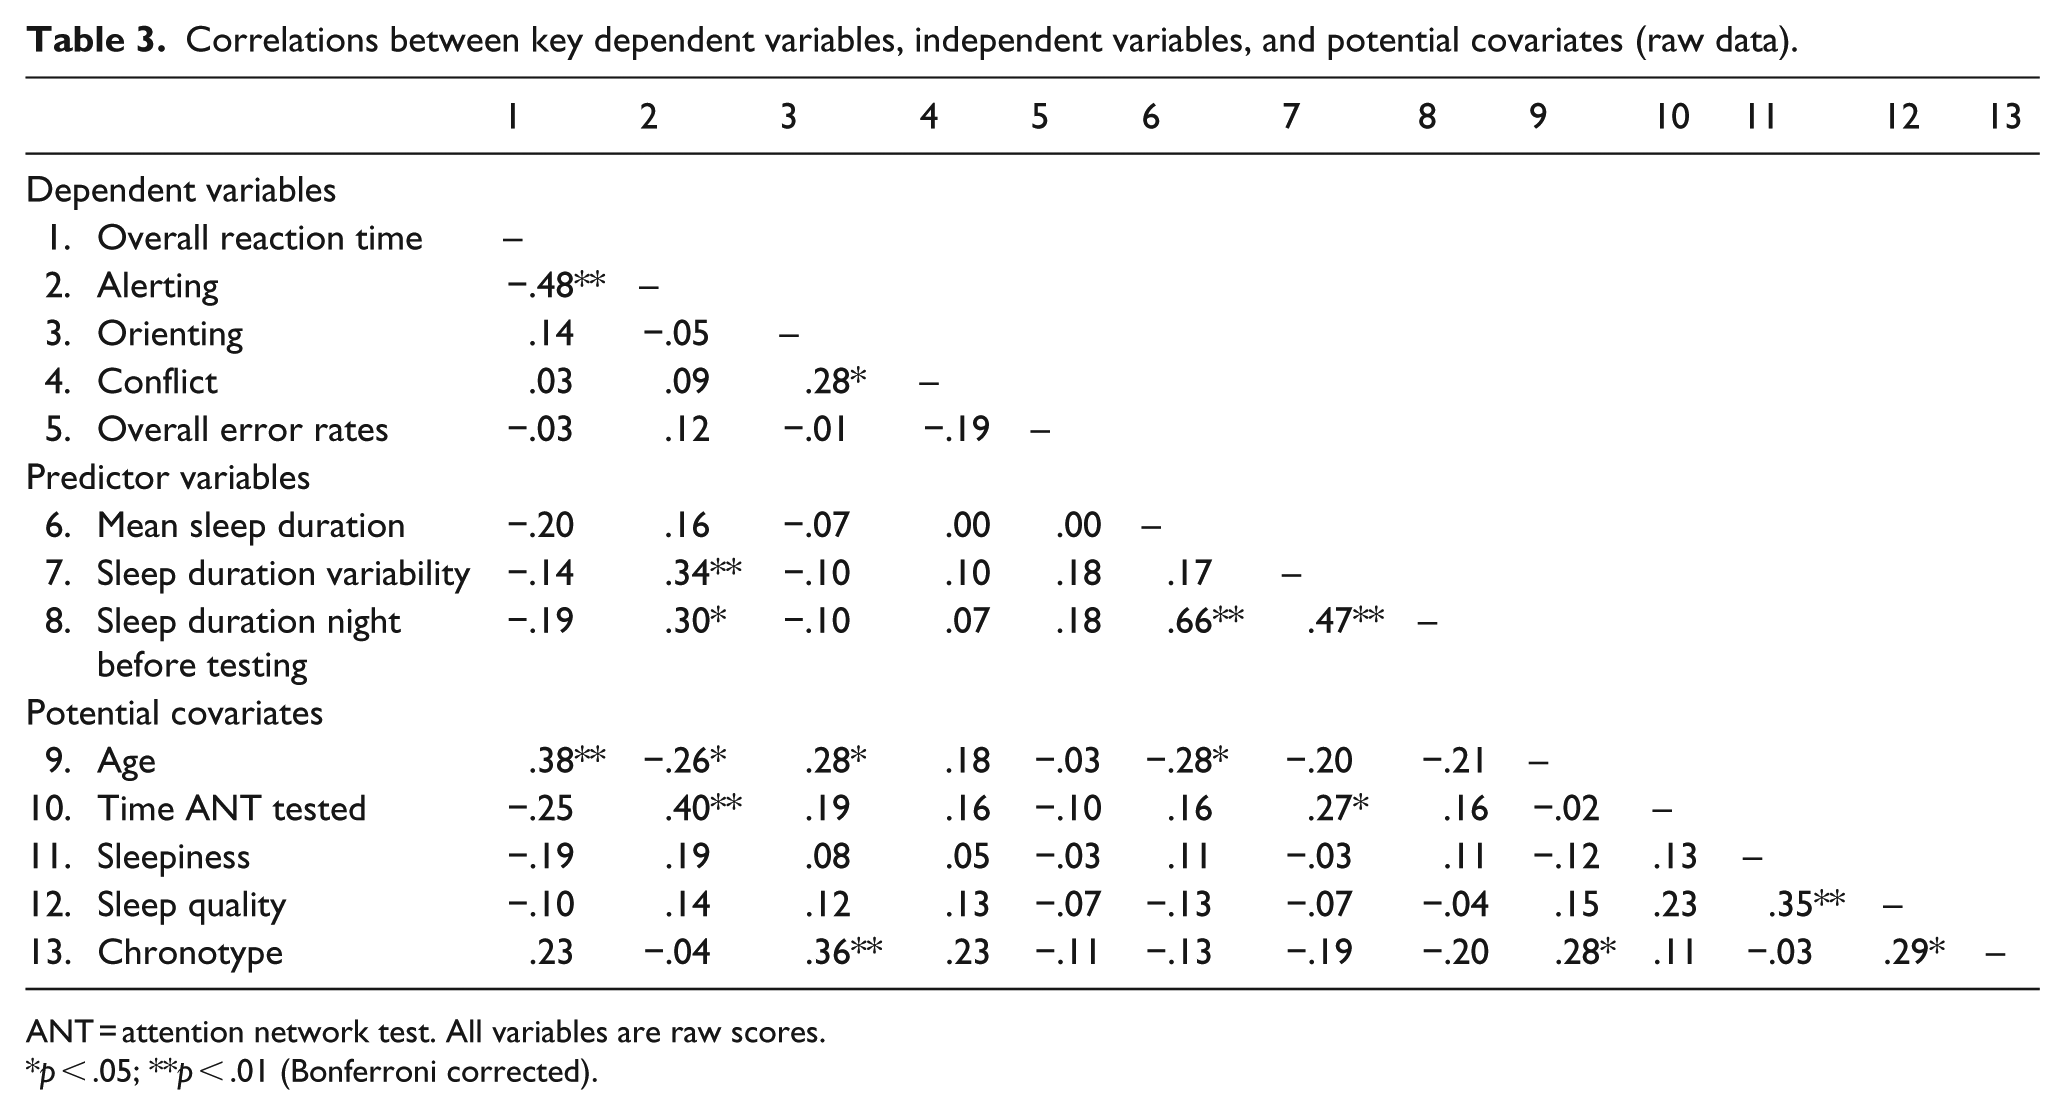
ANT = attention network test. All variables are raw scores.
p < .05; **p < .01 (Bonferroni corrected).
A repeated-measures ANOVA was performed on mean overall RTs, with cue (no cue, centre, double, and spatial cues) and flanker type (neutral, congruent, and incongruent) as within-subject factors. Assumptions of sphericity were not met for the main effects of cue and flanker type, and the interaction between cue and flanker type. Consequently, Greenhouse–Geisser correction to degrees of freedom was employed. There were significant main effects of cue, F(2.50, 137.52) = 176.27, p < .01,
A series of hierarchical linear regression models were run separately for each outcome variable (see Tables 4–6). For mean overall RT as the dependent variable, Model 1 (including age) was significant, F(1, 56) = 9.03, p = .00, and Model 4 (including age, sleep duration, sleep duration variability, and the sleep duration × sleep duration variability interaction) significantly improved model fit, ΔF(1, 52) = 4.52, p = .04. The final model explained 22% of variance in overall RT (see Table 4). From the simultaneous regression model, age was a significant predictor of overall RT, such that older age predicted longer overall RTs (β = .35, t = 2.70, p = .01), as was the sleep duration × sleep duration variability interaction (β = –.34, t = –2.13, p = .04). Moderation analysis in PROCESS revealed that the slowest RTs were predicted by shorter sleep duration and high sleep duration variability, and that the fastest RTs were predicted by longer sleep duration and high sleep duration variability (t values for each moderator level: low: t = .36, p = .72; medium: t = –1.11, p = .27; high: t = –2.21, p = .03) (see Figure 2a).
Multiple regression analyses of mean sleep duration, sleep duration variability, and covariates predicting overall reaction time.
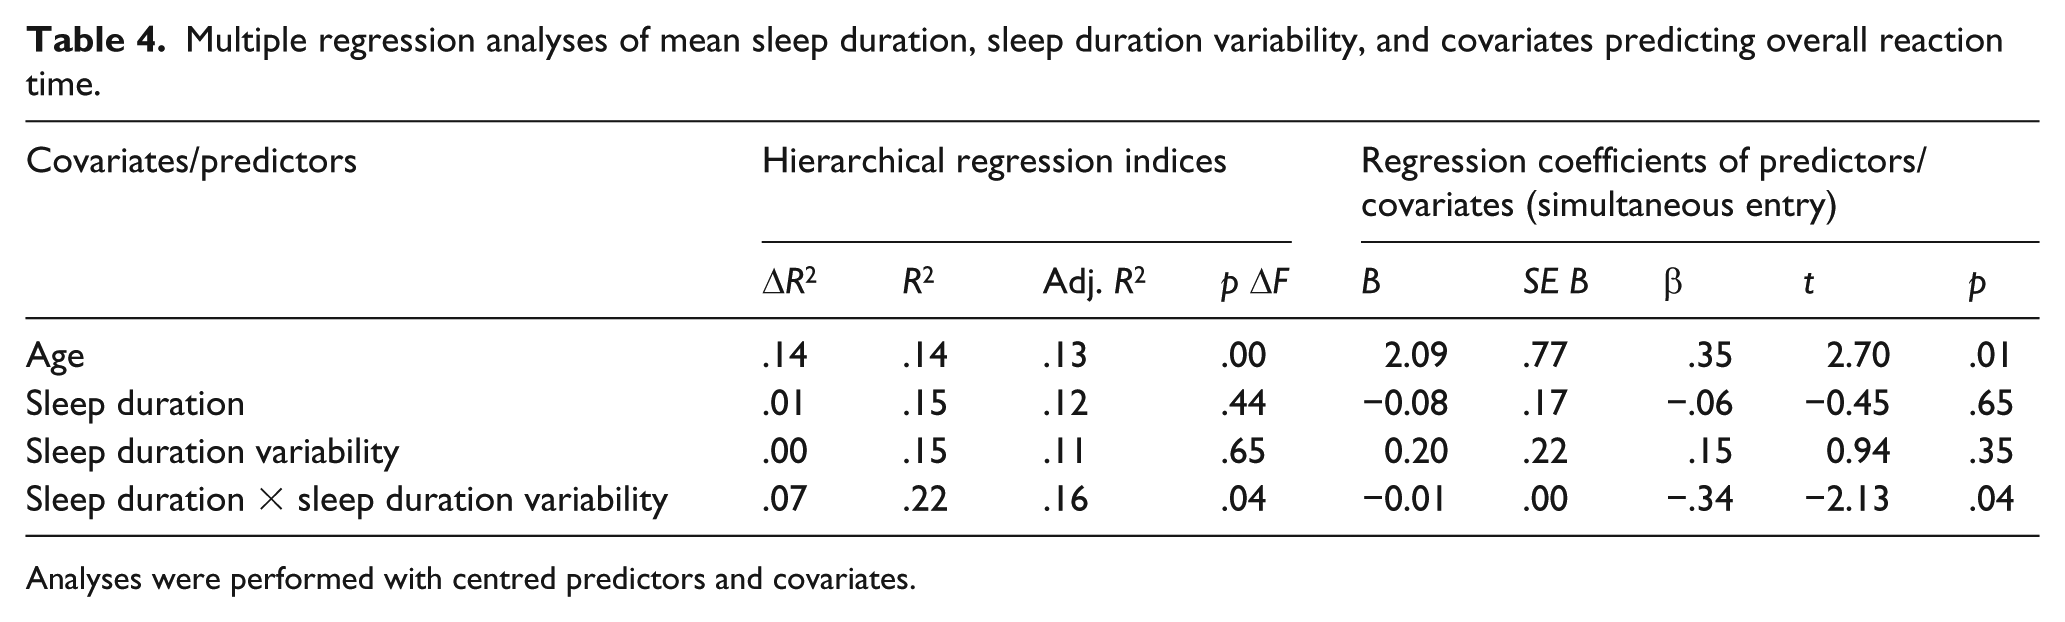
Analyses were performed with centred predictors and covariates.
Multiple regression analyses of mean sleep duration, sleep duration variability, and covariates predicting alerting.
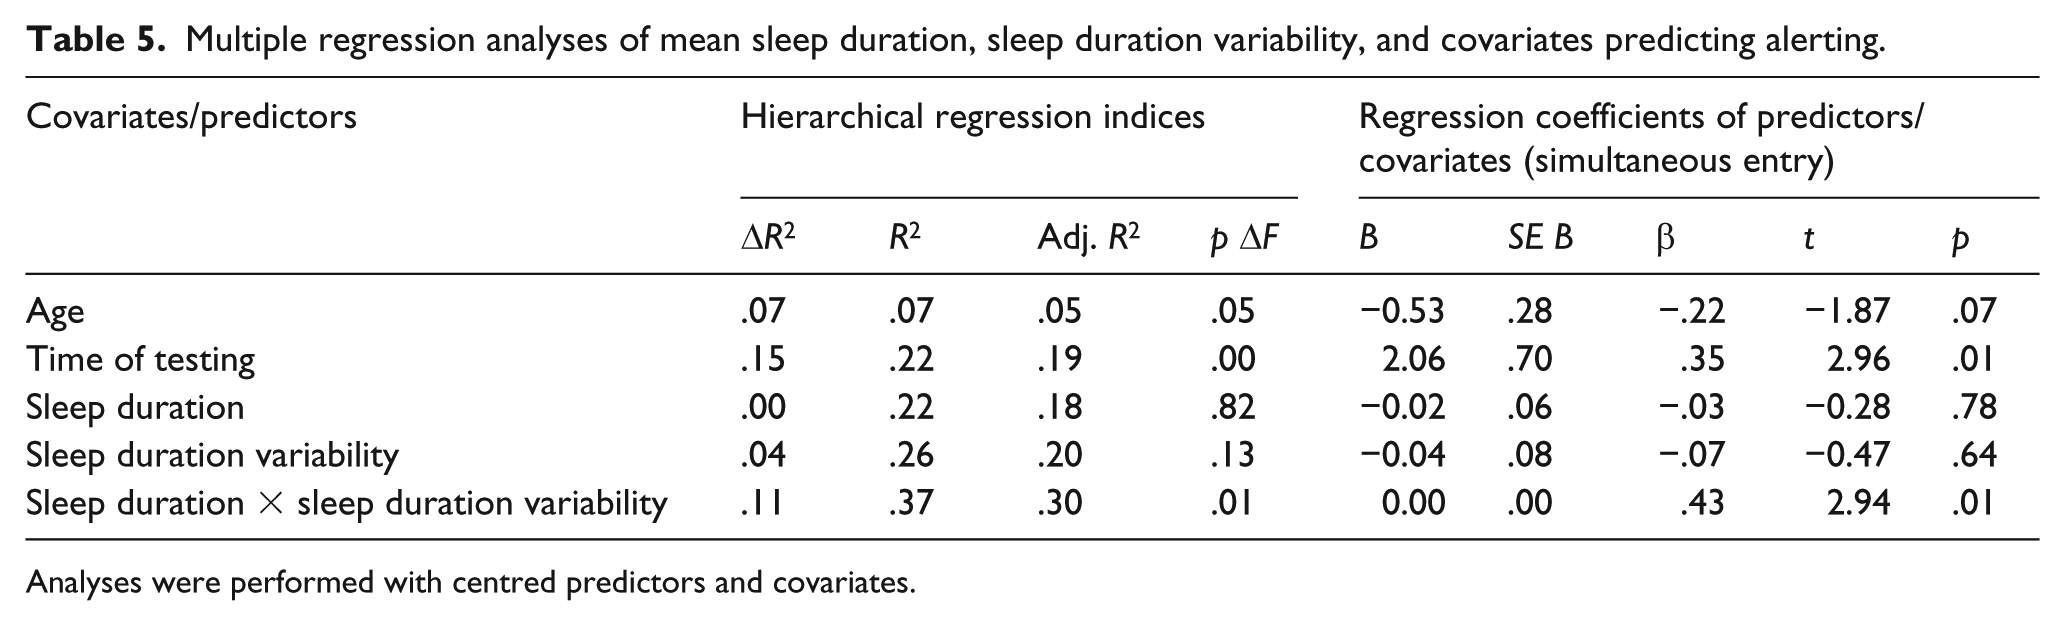
Analyses were performed with centred predictors and covariates.
Multiple regression analyses of mean sleep duration, sleep duration variability, and covariates predicting orienting.
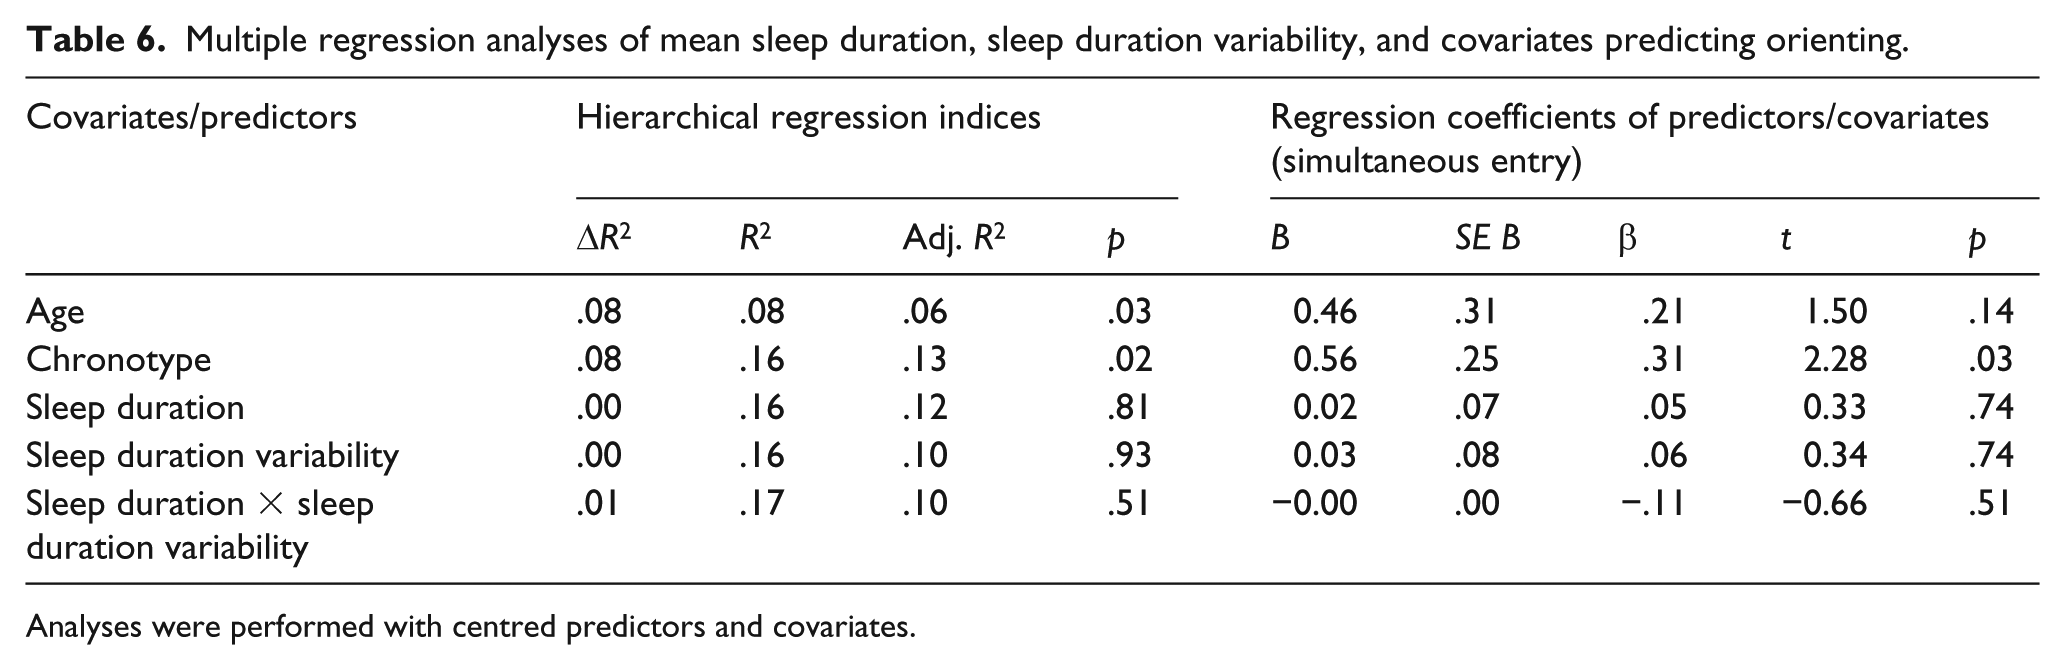
Analyses were performed with centred predictors and covariates.
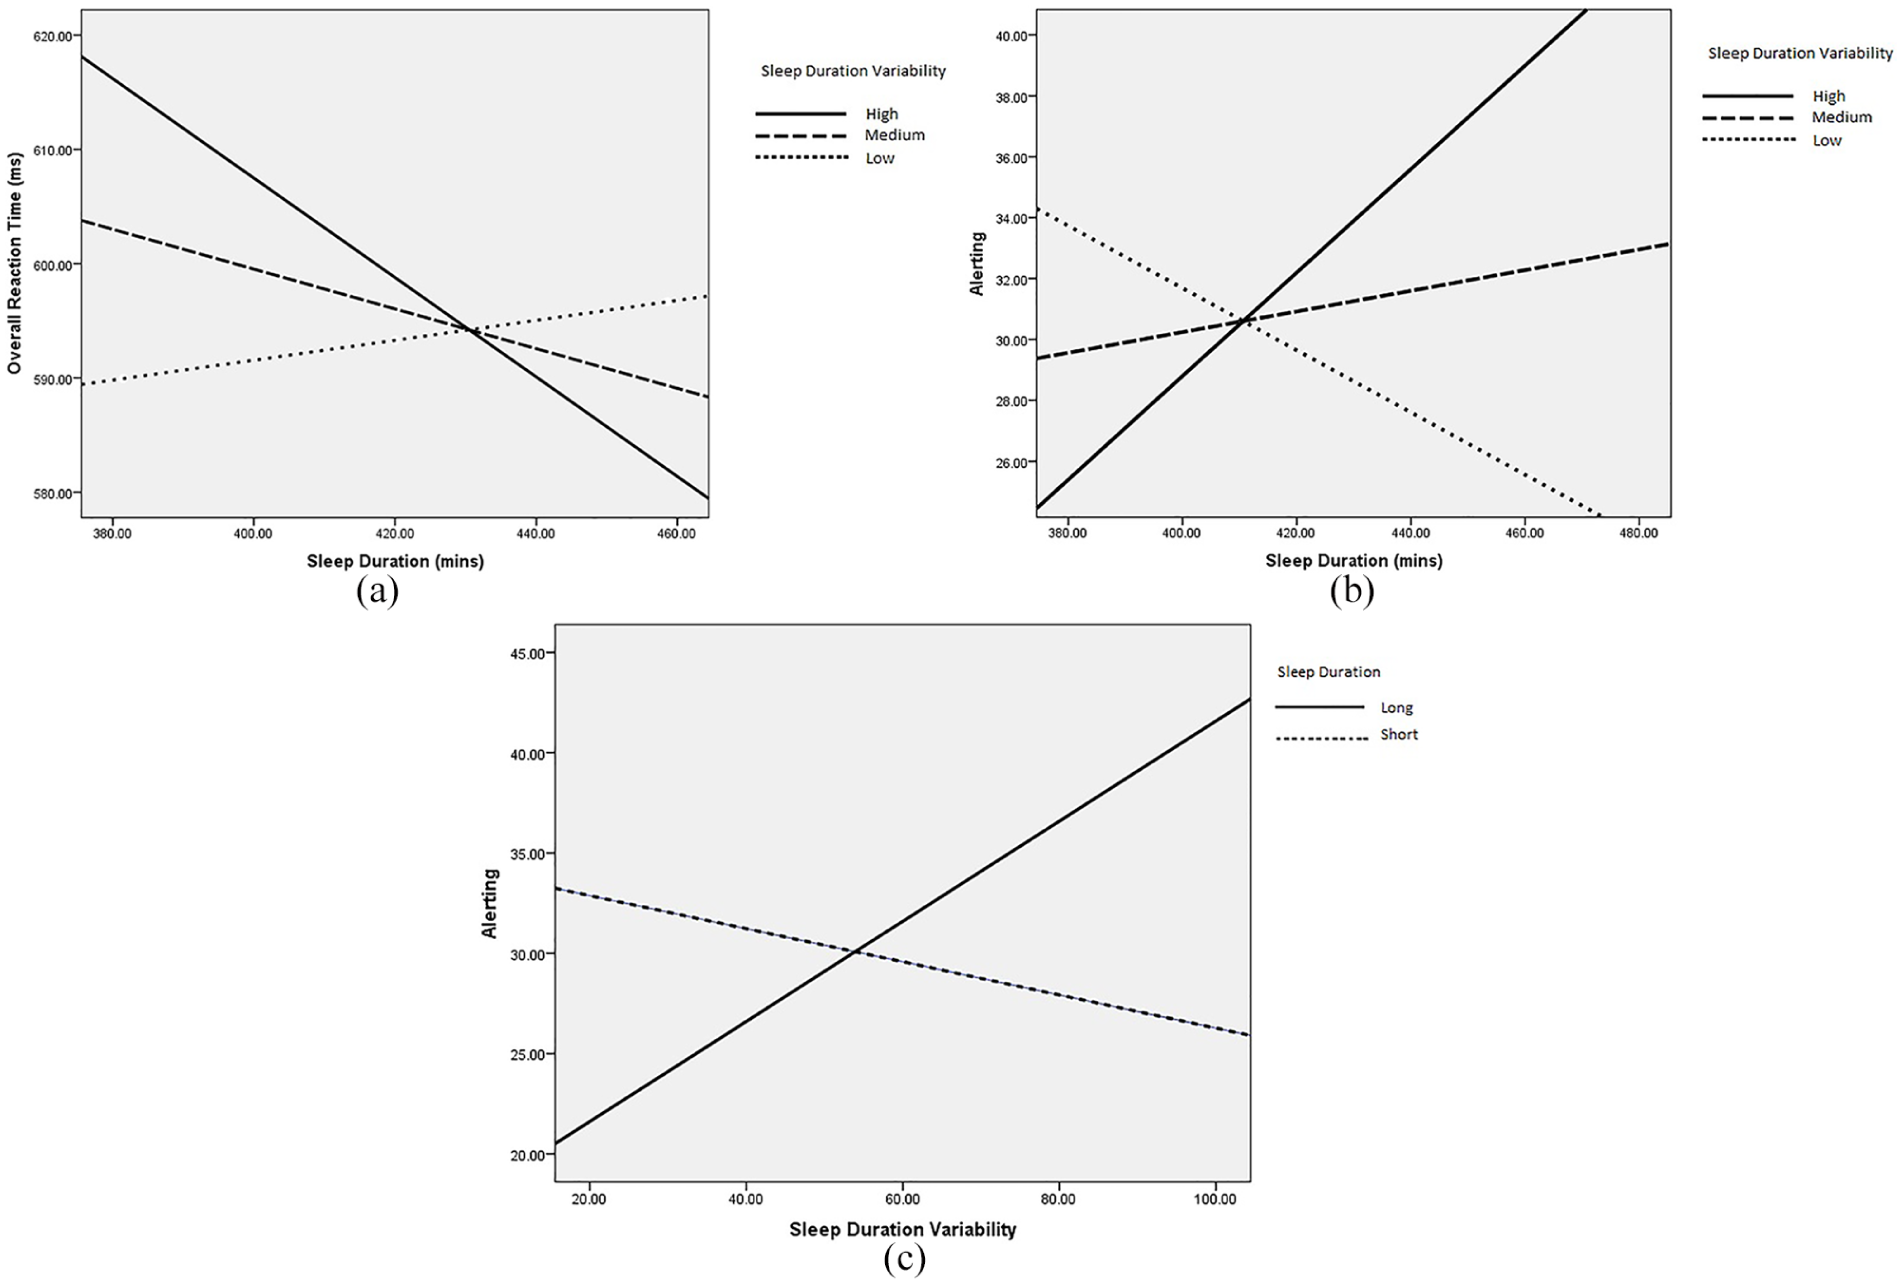
Moderation models in PROCESS of (a) association between sleep duration and overall reaction times moderated by sleep duration variability; (b) association between sleep duration and alerting score moderated by sleep duration variability. Separate lines represent low (22.58 min), medium (61 min), and high (99.41 min) sleep duration variability; and (c) association between sleep duration variability and alerting score moderated by sleep duration derived by median split (short sleepers <419.14 min; long sleepers ⩾419.14 min). Higher alerting scores indicate better efficiency of the alerting network.
For alerting score as the dependent variable, Model 2 (including age and time of testing) and Model 5 (including age, time of testing, sleep duration, sleep duration variability, and the sleep duration × sleep duration variability interaction) significantly improved model fit, ΔF = 10.32, p = .00, and ΔF = 8.62, p = .01, respectively. The final model explained 37% of variance in alerting score. From the simultaneous regression model, time of testing and the sleep duration × sleep duration variability interaction significantly predicted alerting score (β = –.22, t = –2.96, p = .01, and β = .43, t = 2.94, p = .01, respectively). Mod-eration analysis in PROCESS revealed that the poorest alerting score was predicted by longer sleep duration and low sleep duration variability, and that the best alerting score was predicted by longer sleep duration and high sleep duration variability (t values for each moderator level: low: t = –1.15, p = .25; medium: t = 0.53, p = .60; high: t = 2.17, p = .03) (see Figure 2b). Because of the strength of the correlation between sleep duration variability and alerting score (Table 3), we decided to examine the extent to which sleep duration moderates this association. We performed a median split on the sleep duration variable and performed moderation analysis in PROCESS. It appeared that long sleep duration drives the association between sleep duration variability and alerting score (t value for short and long sleep duration: short: t = –0.57, p = .57; long: t = 3.26, p = .00) (see Figure 2c).
Due to the unexpected direction of the interaction effect (i.e., that long sleep duration with low sleep duration variability predicted poorest alerting), we further visualised the distribution of sleep duration variability and alerting score (see Figure 3a). The presence of an outlier experiencing high sleep duration variability and high alerting score is present in the data (256.14 min and alerting score of 110.8). Indeed, inspection of the nightly sleep duration data for this individual revealed nightly sleep durations ranging from 142 to 924 min, the latter of which occurred the night prior to testing. Inspection of the distribution of sleep duration the night prior to testing and alerting score also revealed the contribution of this outlier to the association (Figure 3b). The average sleep duration experienced by this participant was not unusual (501.43 min); hence, the distribution of mean sleep duration and alerting appears normal (Figure 3c). Due to the presence of this outlier, we re-ran the correlations after excluding this participant. The association between sleep duration variability and alerting reduced from .34 (p < .01) to –.03 (p = .82), and the association between sleep duration the night prior to testing and alerting reduced from .30 (p < .05) to –.06 (p = .65). The regression analyses were re-run after exclusion of this participant, and the pattern of results for overall RT as the dependent variable changed such that the interaction term was no longer significant (though age remained a significant predictor of overall RT, β = .36, t = 2.65, p = .01); likewise, for alerting as the dependent variable, the interaction between sleep duration and sleep duration variability reduced to non-significance, while time of testing remained a significant predictor (β = .37, t = 2.85, p = .01).

Scatterplots of (a) the association between sleep duration variability and alerting score, showing the presence of an outlier experiencing high sleep duration variability; (b) the association between sleep duration the night before testing and alerting score, showing the presence of an outlier experiencing long sleep duration the night before testing; and (c) the association between mean sleep duration and alerting score. Higher alerting scores indicate better efficiency of the alerting network.
For orienting score as the dependent variable, Model 1 (including age) and Model 2 (including age and chronotype) significantly improved model fit (ΔF = 4.73, p = .03, and ΔF = 5.54, p = .02, respectively). Model 2 explained 16% of variability in orienting score. From the simultaneous regression model, only chronotype significantly predicted orienting score (β = .31, t = 2.28, p = .03) such that a tendency towards morningness was associated with better orienting. These results remained after excluding the anomalous participant.
For executive control scores and overall error rates, all regression analyses were non-significant (all model ps > .05) (both with the inclusion and the exclusion of the anomalous participant).
Discussion
The results presented here expand previous research investigating the importance of sleep for optimum cognitive functioning. Here, we extend research from experimental sleep-deprivation studies to demonstrate the influence of normal sleep duration variability in the general population on various components of visual attention. There are four key findings stemming from this study: (a) neither sleep duration, nor sleep duration variability, nor their interaction were predictive of orienting, executive control, or error rates; (b) earlier time of testing was associated with poorer efficiency of the alerting network; (c) the associations between sleep duration with overall RT and efficiency of the alerting network appeared to be moderated by sleep duration variability; however, the presence of an outlier experiencing high sleep duration variability and extremely long sleep duration the night prior to testing appeared to solely account for the interactive effects of sleep duration and sleep duration variability on overall RT/alerting score; and (d) older age was associated with longer overall RTs, and this was independent of sleep duration and sleep duration variability. Below we explain these findings in relation to our initial hypotheses and in the context of the emerging field.
Sleep duration and sleep duration variability did not predict orienting score, executive control score, or error rates
Contrary to our hypotheses, we did not find that sleep duration or sleep duration variability predicted components of attention (the efficiency of the orienting network, the efficiency of the executive control network, or proportion of errors made). Likewise, the interaction between sleep duration and sleep duration variability was not a significant predictor of these measures of attention. Other experimental studies show a general detriment to sustained attention under varying degrees of sleep deprivation, fragmentation, and restriction (see Tkachenko & Dinges, 2018 for a review), while observational studies similarly show that consistently short sleep duration is associated with attentional disengagement (Whiting & Murdock, 2016). Our data do not show a similar effect, at least in terms of orienting, executive control, and accuracy.
There are a couple of plausible explanations for this. First, it is possible that these particular ANT-derived variables are insensitive to natural variation in sleep duration and intra-individual sleep duration variability. The experimental sleep-deprivation literature indeed suggests that while sustained attention (which would be analogous to our measure of overall RT) and alerting are particularly sensitive to sleep loss, other attentional functions, including orienting and executive function, may remain spared (Cunningham et al., 2018; Roca et al., 2012; Tkachenko & Dinges, 2018, but see Martella et al., 2011). Second, it is possible that there was not enough variability in our data for such effects to emerge. Indeed, we sampled the average sleep duration over the course of 7 days in healthy good sleepers and asked them to maintain their “habitual” sleep patterns. The standard deviation of our “mean sleep duration” variable was 39.90 min, and 86% of our sample had a mean sleep duration between 6 and 8 hr. Thus, it is possible that meaningful effects on attentional performance occur at far greater extremes of sleep duration than the ones exhibited by our sample. Studies examining consequences of sleep duration variation often focus on greater extremes and demonstrate a U-shaped curve: highlighting the detrimental effects of both short (conceptualised as <6 hr per night) and long (usually conceptualised as >8 hr per night) sleep duration on various indicators of health (Patel & Hu, 2008), all-cause mortality (Cappuccio et al., 2010), and cognition (Kronholm et al., 2009). Our intention was to show that in the “real world,” consistently short sleep or inconsistently long sleep results in deficits in attention, yet it is possible that our selection process yielded a sample of healthy good sleepers that failed to allow these patterns to emerge. Future research needs to encapsulate more variable sleep–wake patterns to truly describe the heterogeneity of sleep (by including those with sleep disturbances/more variable sleep–wake patterns such as shift workers) that exists in the general population and examine concomitant associations with cognition.
Third, effects of sleep duration and sleep duration variability may have been obscured by the effect of time of testing. While the majority of our participants completed the ANT before mid-day, we did not strictly control time of testing, and so testing was performed up until 8 pm. Had time of testing been consistent, we may have seen an effect of sleep duration emerge. Matchock and Mordkoff (2014), for example, observed increased RTs on the ANT upon awakening under conditions of restricted sleep durations of 3 and 6 hr, compared with a baseline condition of normal sleep duration. However, the results of Matchock and Mordkoff may actually reflect “sleep inertia” or result from testing at suboptimal circadian phase in the early morning, rather than purely the effect of short sleep duration. We chose not to restrict our testing time to upon awakening as we wanted to rule out the effect of sleep inertia, and we wanted to examine the potential effects of time of testing.
Nevertheless, our data revealed a reliable effect of time of testing on the efficiency of the alerting network. The alerting network efficiency was progressively better as the time of testing was later in the day. This finding is partially consistent with the studies that observed significant time-of-day effects on the alerting, orienting, and executive control networks (Fimm et al., 2016; Matchock & Mordkoff, 2009) and corroborates what is typically observed in relation to the circadian rhythm of neurobehavioural functioning: it is poor upon awakening in the morning, and then steadily improves across the waking day to a peak around early evening, followed by a progressive decline into the night (Goel et al., 2011; Mollicone et al., 2010). Taken together, these findings highlight the importance of systematically isolating variables relating to the sleep homeostat and the circadian rhythm. Future research from our team aims to tease apart the homeostatic and circadian mechanisms underlying changes in attentional networks under natural conditions.
Associations between sleep duration with overall RT and efficiency of the alerting network appeared to be moderated by sleep duration variability
Contrary to our hypotheses, shorter sleep duration coupled with high sleep duration variability predicted the longest overall RTs, and longer sleep duration coupled with high sleep duration variability predicted the shortest RTs. Concerning alerting, on one hand, longer sleep duration coupled with low sleep duration variability appeared to be associated with poorer efficiency of the alerting network, while on the other hand, longer sleep duration coupled with high sleep duration variability appeared to be associated with better efficiency of the alerting network. However, further inspection of our data revealed that these effects were accounted for by an individual exhibiting extremely high sleep duration variability and extremely long sleep duration the night prior to testing—with this participant excluded, these interaction effects were reduced to non-significance. This finding highlights the importance of considering the nightly variability in sleep duration when taking an average of such data. Many research studies rely on taking an average of sleep variables across a pre-specified time period (three nights a week), but such crude measures fail to capture the nightly variability in sleep duration. With this participant excluded, the standard deviation of our sleep duration variability predictor reduced from 38.41 to 28.24. Thus, our data were perhaps too homogeneous for important effects on RT and alerting to emerge.
Association between age and overall RT
Perhaps, less surprising in our study was the finding that older age was associated with longer overall RT. It appears that the relative deficit in attention shown here stems from age-related factors rather than short sleep duration per se. The efficiency of the alerting network is significantly impaired in older adults compared with younger adults (Gamboz et al., 2010; Jennings et al., 2007). Given that sleep patterns dramatically change across the lifespan (Ohayon et al., 2004), it is pertinent to further investigate the interactive effects of ageing and sleep on cognition. Others have hypothesised that increased RT following sleep restriction results from diminished oculomotor functioning (Zils et al., 2005), and this effect may become more pronounced as we age, given the natural progression of oculomotor functioning across the lifespan (Katsanis et al., 1998).
Limitations and conclusions
It is worth noting a couple of key limitations of this study: (a) our analyses focus on sleep duration and sleep duration variability rather than other indices of sleep, such as sleep onset latency, sleep efficiency, wake after sleep onset, and number of awakenings. However, our sample size did not allow us to assess these variables at an acceptable level of power. In addition, we wanted to focus on a variable that is to some extent under voluntary control, that is, we can control the time we go to bed and the time we get out of bed, and by consequence our sleep duration, whereas we cannot control our sleep onset latency. We wanted to address a variable that can be behaviourally manipulated and thus be the potential target of interventions to improve sleep and, by consequence, cognition. Further investigation of sleep under normal conditions (rather than the artificial setting of experimental sleep restriction/deprivation), investigating an array of sleep characteristics in a more heterogeneous sample, will further shed light on the role of sleep duration and its variability on attention. (b) Our objective measure of sleep using actigraphy is not completely free of subjective biases, as the calculation of sleep parameters is partially dependent on subjectively reported bed times and rise times. Measuring sleep by using polysomnography would not only address this issue but would also provide us with the opportunity to examine the architectural properties of sleep macro- and micro-structure to identify the residual neural underpinnings of attention.
To conclude, this work did not demonstrate an effect of actigraphically measured sleep duration or sleep duration variability on measures of visual attention. However, this conclusion is derived from data focussing on the healthy population, experiencing good sleep. We do not rule out the possibility that poor sleep and inconsistencies in sleep patterns contribute to cognitive impairments in populations for whom sleep is disturbed.
Footnotes
Acknowledgements
The authors thank the participants for their participation. A part of this study was carried out as an MSc project by author S.R.
Declaration of conflicting interests
The author(s) declared no potential conflicts of interest with respect to the research, authorship, and/or publication of this article.
Funding
The author(s) disclosed receipt of the following financial support for the research, authorship, and/or publication of this article: The study was supported by Northumbria University Psychology Department, internal funds from the Sleep and Circadian Neuroscience Institute, University of Oxford, and the Russian Academic Excellence Project “5-100.”
