



Abstract
The “positivity effect” (PE) reflects an age-related increase in the preference for positive over negative information in attention and memory. The present experiment investigated whether Chinese and UK participants produce a similar PE. In one experiment, we presented pleasant, unpleasant, and neutral pictures simultaneously and participants decided which picture they liked or disliked on a third of trials, respectively. We recorded participants’ eye movements during this task and compared time looking at, and memory for, pictures. The results suggest that older but not younger adults from both China and UK participant groups showed a preference to focus on and remember pleasant pictures, providing evidence of a PE in both cultures. Bayes Factor analysis supported these observations. These findings are consistent with the view that older people preferentially focus on positive emotional information, and that this effect is observed cross-culturally.
Evidence suggests that as people age they develop a bias to focus on and process positive emotional stimuli (Isaacowitz et al., 2007). This is known as the positivity effect (PE; Carstensen et al., 1999; Fung et al., 2008; Isaacowitz et al., 2006; Kwon et al., 2009; Wang et al., 2015), and is defined as preferential cognitive processing of positive affective information, along with avoidance of negative affective information in the environment (Kwon et al., 2009).
The socioemotional selectivity theory (SST; Carstensen et al., 1999; see Reed & Carstensen, 2012) postulates that with age, people are motivated to derive emotional meaning from life, leading them to pay more attention to positive, relative to negative/neutral, information (Fung et al., 2008; Kwon et al., 2009). Accordingly, older adults should show increased preference for positive emotional information compared with younger adults (Wang et al., 2015). The SST suggests that in older people, the perception of a limited future life-time motivates development of the PE. When future life-time is perceived as less limited, as for young adults, people tend to pursue goals with future benefits (e.g., education and employment). However, when the future appears limited, as for older adults, individuals focus instead on goals that benefit them in the present time (Isaacowitz et al., 2006).
The PE is well-documented in Western cultures, with studies showing that older adults look less at negative and more at positive stimuli compared with young adults (Charles et al., 2003; Hess et al., 2003; Isaacowitz et al., 2006; Mather & Carstensen, 2003 but see Isaacowitz et al., 2015). For example, Mather and Carstensen (2003) found that older participants responded faster to a dot probe if this was presented on the same side as a neutral face, than when it was presented on the same side as a negative face. Moreover, older participants remembered the positive faces better than the negative faces in that study. Similarly, Hess et al. (2003) tested younger and older participants and found that when participants were primed with negative pictures, memory performance decreased in recall and recognition tasks in comparison to those who were not primed with negative information. In a later study, Isaacowitz and colleagues (2006) found that older participants preferred to look at positive (e.g., happy) faces and avoided attending to negative (e.g., angry and sad) faces. Research also reports a shift with age in the ratio of positive versus negative information attended to or remembered (Charles et al., 2003; Chung & Lin, 2012), with older participants more likely to remember positive information. Moreover, while the degree to which the PE may change with age varies across studies (Charles et al., 2001; Mroczek & Kolarz, 1998), such effects appear present throughout older adulthood in Western cultures.
In Western cultures, the focus is on individual development and achievement of goals, where there is strong encouragement for independence and a public expression of one’s achievements. Cultivation of optimism and a sense of pride is promoted at an individual level, and compared with East Asians living in collective cultures, Western people who believe in individualism have preferential cognitive processing of positive stimuli with high arousal levels (Tsai et al., 2006).
In contrast, in East Asian cultures, the focus is on interdependence between adults, leading to collectivist societies, where group harmony is considered to be optimal. Individualism is not considered to be of main importance in such a culture, and as a result of this, it is inevitable that individuals experience concession and endurance to enhance the group goals of unity and solidarity. It has been suggested that such experiences will involve the suppression of some positive emotions in such a culture, perhaps leading to an absence of a PE in East Asian cultures (Wang et al., 2015).
However, the existence of a PE in Eastern cultures is controversial. In an attempted replication of Isaacowitz et al.’s (2006) study, Fung et al. (2008) found no attentional preference for happy over neutral faces in older Hong Kong Chinese participants. They inferred that this null effect provided evidence for a cultural difference between Western and Eastern participants, and they proposed that negative and positive information is equally important in Eastern cultures. However, as Fung et al. did not directly compare Western and Eastern participant groups, it is unclear whether their findings necessarily do show this proposed cultural difference. Moreover, alternative research studies have reported that the PE does exist in Eastern populations. For example, using a picture recognition task, Kwon et al. (2009) showed enhanced memory for pleasant compared with unpleasant pictures in older compared with younger Korean adults, but they did not compare the effect cross-culturally. More recently, Wang et al. (2015) reported a PE among older, but not younger, Chinese adults. Specifically, younger and older Chinese participants showed an emotional bias for both pleasant and unpleasant pictures when these were paired with a neutral picture, but only the older adults showed avoidance of negative pictures when these were paired with positive pictures. Again, this study was not conducted cross-culturally which means that a direct comparison cannot be made between Eastern and Western cultures from that study. Thus, an important aim of this study was to directly compare the PE across Eastern and Western samples.
Most previous studies have used techniques in which pleasant and unpleasant pictures are presented separately, alongside a neutral picture, to assess biases towards pleasant pictures in pleasant versus neutral comparisons, and biases away from unpleasant pictures in unpleasant versus neutral comparisons (Fung et al., 2008; Isaacowitz et al., 2006). However, Wang et al. (2015) found the most robust PE when unpleasant and pleasant pictures were presented together. Therefore, we used a variant of this method in this study, by assessing gaze patterns for pleasant, unpleasant and neutral images that were presented simultaneously. This novel method allows us to investigate the preference to focus on pleasant emotional pictures, along with avoidance of processing unpleasant pictures (as measured by eye-fixations on, and subsequent memory for all types of pictures) when all types of pictures are presented in the same trial. The task we used involved participants making a judgement on a proportion of trials to indicate which was the most or least preferred picture. Asking participants to choose their most or least preferred picture ensured that all pictures presented in the displays were engaged with and fixated during each trial. Hence, the pictures would not be processed mindlessly—as might be the case in an entirely free-viewing paradigm.
Based on SST, which proposes that individuals who demonstrate a PE prefer to focus on positive stimuli and avoid negative stimuli, we predicted that initial looking time on each image would be longer for pleasant relative to unpleasant pictures in older participants in both cultures. We also predicted that older participants would have better memory for the pleasant pictures.
Methods
Ethics statement
This study was approved by the research ethics committee of the Faculty of Psychology at Tianjin Normal University and University of Southampton, and each participant provided written informed consent.
Participants
The Chinese sample were 24 young adults aged 21–26 years (M = 24 years) from Tianjin Normal University and 24 older adults aged 65–80 years (M = 70 years) from the Tianjin community. The UK sample were 24 young adults aged 19–29 years from University of Southampton, United Kingdom (M = 21 years) and 24 older adults aged 65–89 years (M = 74 years) from the Southampton and Leicester communities. All participants were right-handed and had normal or corrected-to-normal vision (20/30 or better) determined using a Tumbling E acuity chart (Taylor, 1978). All participants reported no neurological or mental disorders, and all showed typical cognition as assessed using the Montreal Cognitive Assessment (Beijing version in China, Original version in United Kingdom; applying a standard exclusion criterion of <26/30; Nasreddine et al., 2005). Participants were selected to have at least 11 years of formal education (equivalent to senior high schooling). No participants had taken part in similar experiments. Before taking part in the current experiment, demographic data and scores on the Positive Affect and Negative Affect Scale (PANAS; Watson et al., 1988) were recorded. There were no differences between Chinese young and older participants in Positive Affect (PANAS), young adults: M = 28, standard deviation (SD) = 0.88; older adults: M = 27, SD = 1.66; t(46) = 0.64, p = .50, or Negative Affect (PANAS), young adults: M = 12, SD = 1; older adults: M = 11, SD = 2; t(46) = 1.35, p = .187. Similarly, there was no difference for UK young and older participants in Positive Affect (PANAS), young adults: M = 31, SD = 4; older adults: M = 34, SD = 7; t(46) = 1.82, p = .08, or Negative Affect (PANAS), young adults: M = 13, SD = 3; older adults: M = 13, SD = 3; t(46) = 0.00, p = 1.00.
Vocabulary and short-term memory were assessed using the Wechsler Intelligence Test (Wechsler, 1997). Vocabulary scores were similar across Chinese young and older adults, young adults, M = 61, SD = 8; older adults, M = 59, SD = 8; t(46) = 0.68, p = .500. A similar pattern was also observed for UK older and young adults, young adults, M = 57, SD = 5; older adults, M = 60, SD = 5; t(46) = 1.72, p = .09. As is typical for these age groups (Ryan et al., 2000), digit span scores were lower for the older than the younger adults in both the China sample, young adults, M = 15, SD = 3; older adults, M = 12, SD = 2; t(46) = 4.77, p < .001, and the UK sample, young adults, M = 18, SD = 3; older adults, M = 17, SD = 2; t(46) = 2.11, p = .04, and note, all the values of vocabulary and digit span refer to raw scores.
Materials and design
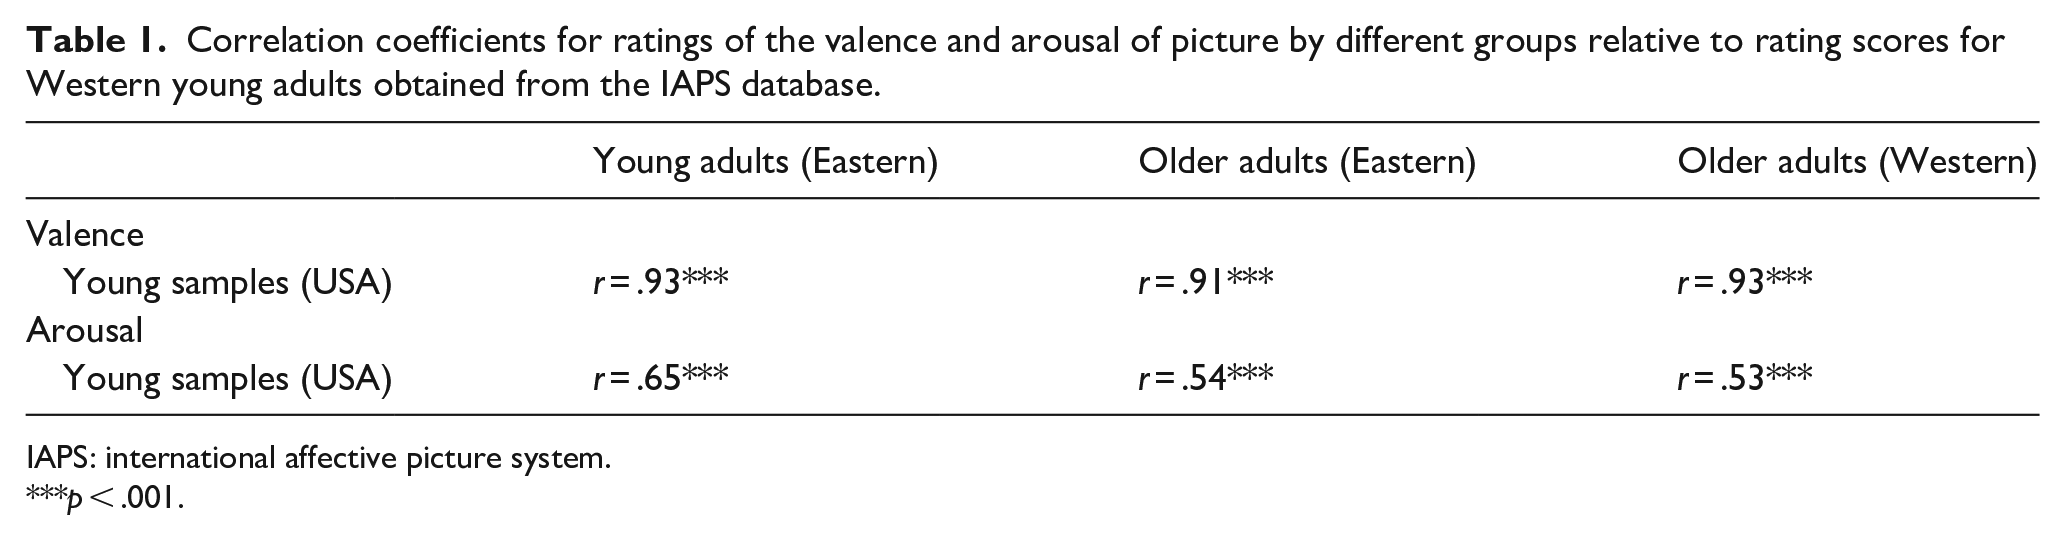
Picture stimuli were from the International Affective Picture System (IAPS; Lang et al., 2005), rated for valence and arousal by Western young adults. Two hundred and thirty-six pictures were chosen from the database based on these scores. For the selected pictures, we conducted additional assessments of valence and arousal using groups of Eastern (China) young and older adults, and Western (United Kingdom) older adults. Forty-seven young Chinese adults aged 19–26 years (M = 23 years), 44 older Chinese adults aged 60–78 years (M = 67 years), and 10 older UK adults aged 66–72 years (M = 66 years) re-rated the pictures for valence and arousal using the same scale. The raters did not take part in the experiment. We then compared these scores with scores obtained from the database (IAPS). The results showed strong correlations between the scores rated by each group of raters and the scores from the original US sample, indicating that our participant groups agreed on the emotionality of the pictures. Correlation coefficients are shown in Table 1. From the rated pictures, we selected 36 pleasant, 36 unpleasant, and 36 neutral pictures as stimuli. For these stimuli, participants closely agreed on valence and arousal scores, and stimuli were selected so that unpleasant pictures had lower valence but the same arousal as pleasant pictures, and neutral pictures had higher valence than unpleasant pictures, lower valence than pleasant pictures, and lower arousal compared with both. We controlled the luminance levels of the pictures using Adobe Photoshop 7.0. to ensure that this did not differ significantly across the pictures (p > .05). The means and standard deviations of the luminance level of each picture were computed using Scion Image software (Scion Corp, version Alpha 4.0.3.2, Frederick, MD, USA).
Correlation coefficients for ratings of the valence and arousal of picture by different groups relative to rating scores for Western young adults obtained from the IAPS database.
IAPS: international affective picture system.
p < .001.
The pictures were randomly assigned to form 36 displays; each display included a single pleasant, neutral, and unpleasant picture. The emotional pictures in each display were matched on arousal and valence. The three pictures that made up each trial display were presented together only once, and no pictures were presented twice in the same location. A total of four blocks of 36 pictures was created and all participants completed all four blocks. A mixed measures design was used with the within-participant factor picture type (pleasant, neutral, and unpleasant) and between-participant factors age group (older adults, younger adults) and culture (China, UK). There were four display blocks, each containing 36 experimental trials and two practice trials.
Apparatus and procedure
An EyeLink 1000 eye-tracking system (SR Research inc., Kanata, ON, Canada), with high spatial and temporal resolution, recorded each participant’s right-eye gaze location every millisecond during binocular viewing. Displays were presented on a 19-inch monitor (150 Hz refresh rate, 1,024 × 768 resolution). Each picture was 10.4°× 7.2°, with a distance of 3.2° from its inner edge to the display screen centre.
At the start of the experiment, each participant completed a 9-point calibration procedure. On one third of trials, participants indicated using a mouse-click, which of the pictures they liked most, and on another third of trials, which they liked least. For the remaining third of trials, there was no instruction and no response was required. Each display was presented for 5,000 ms and participants could look at the pictures in any order. The whole experiment lasted 40 min.
Following the eye-tracking task, participants received an (unexpected) recognition memory task. They were instructed to indicate, using a key press, whether they had seen the picture presented in the memory test in the eye movement experiment. All 36 stimuli were included, along with 36 unseen pictures, with order of stimuli presentation counterbalanced across participants. Figure 1 shows a schematic of the trial sequence.
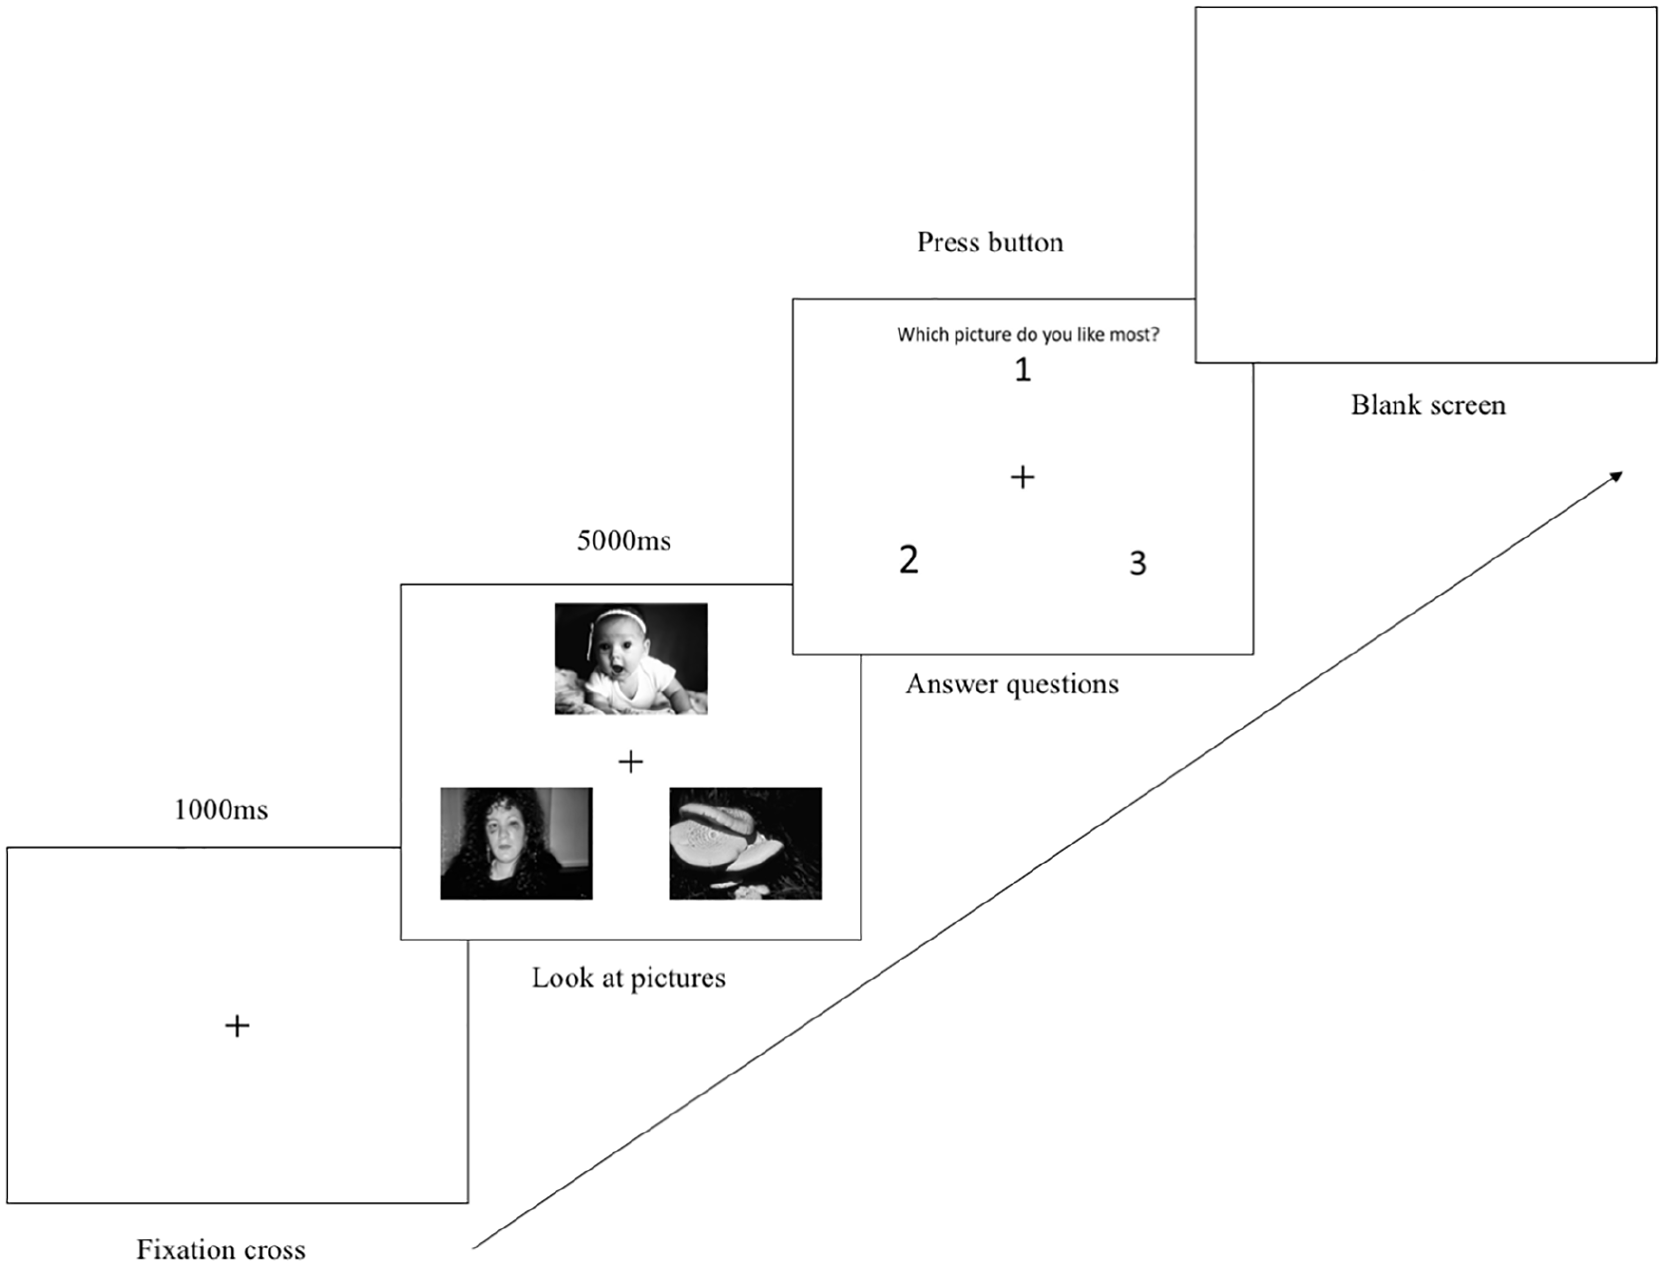
Shows a schematic of the trial sequence.
Results
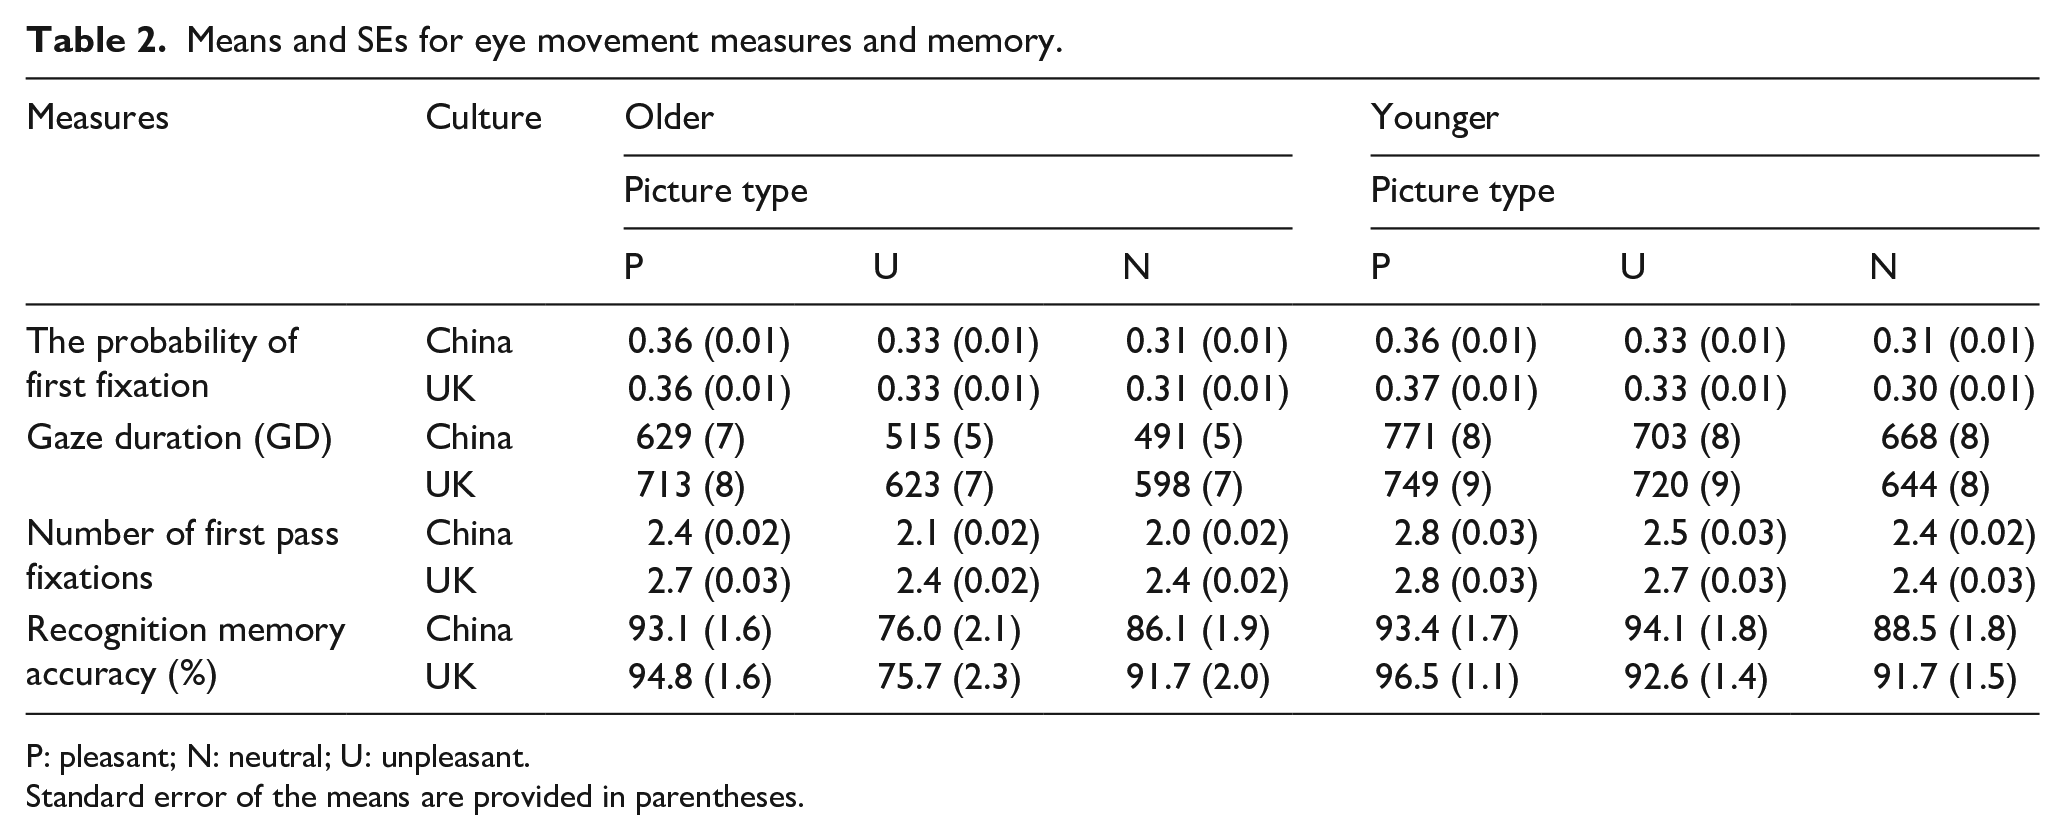
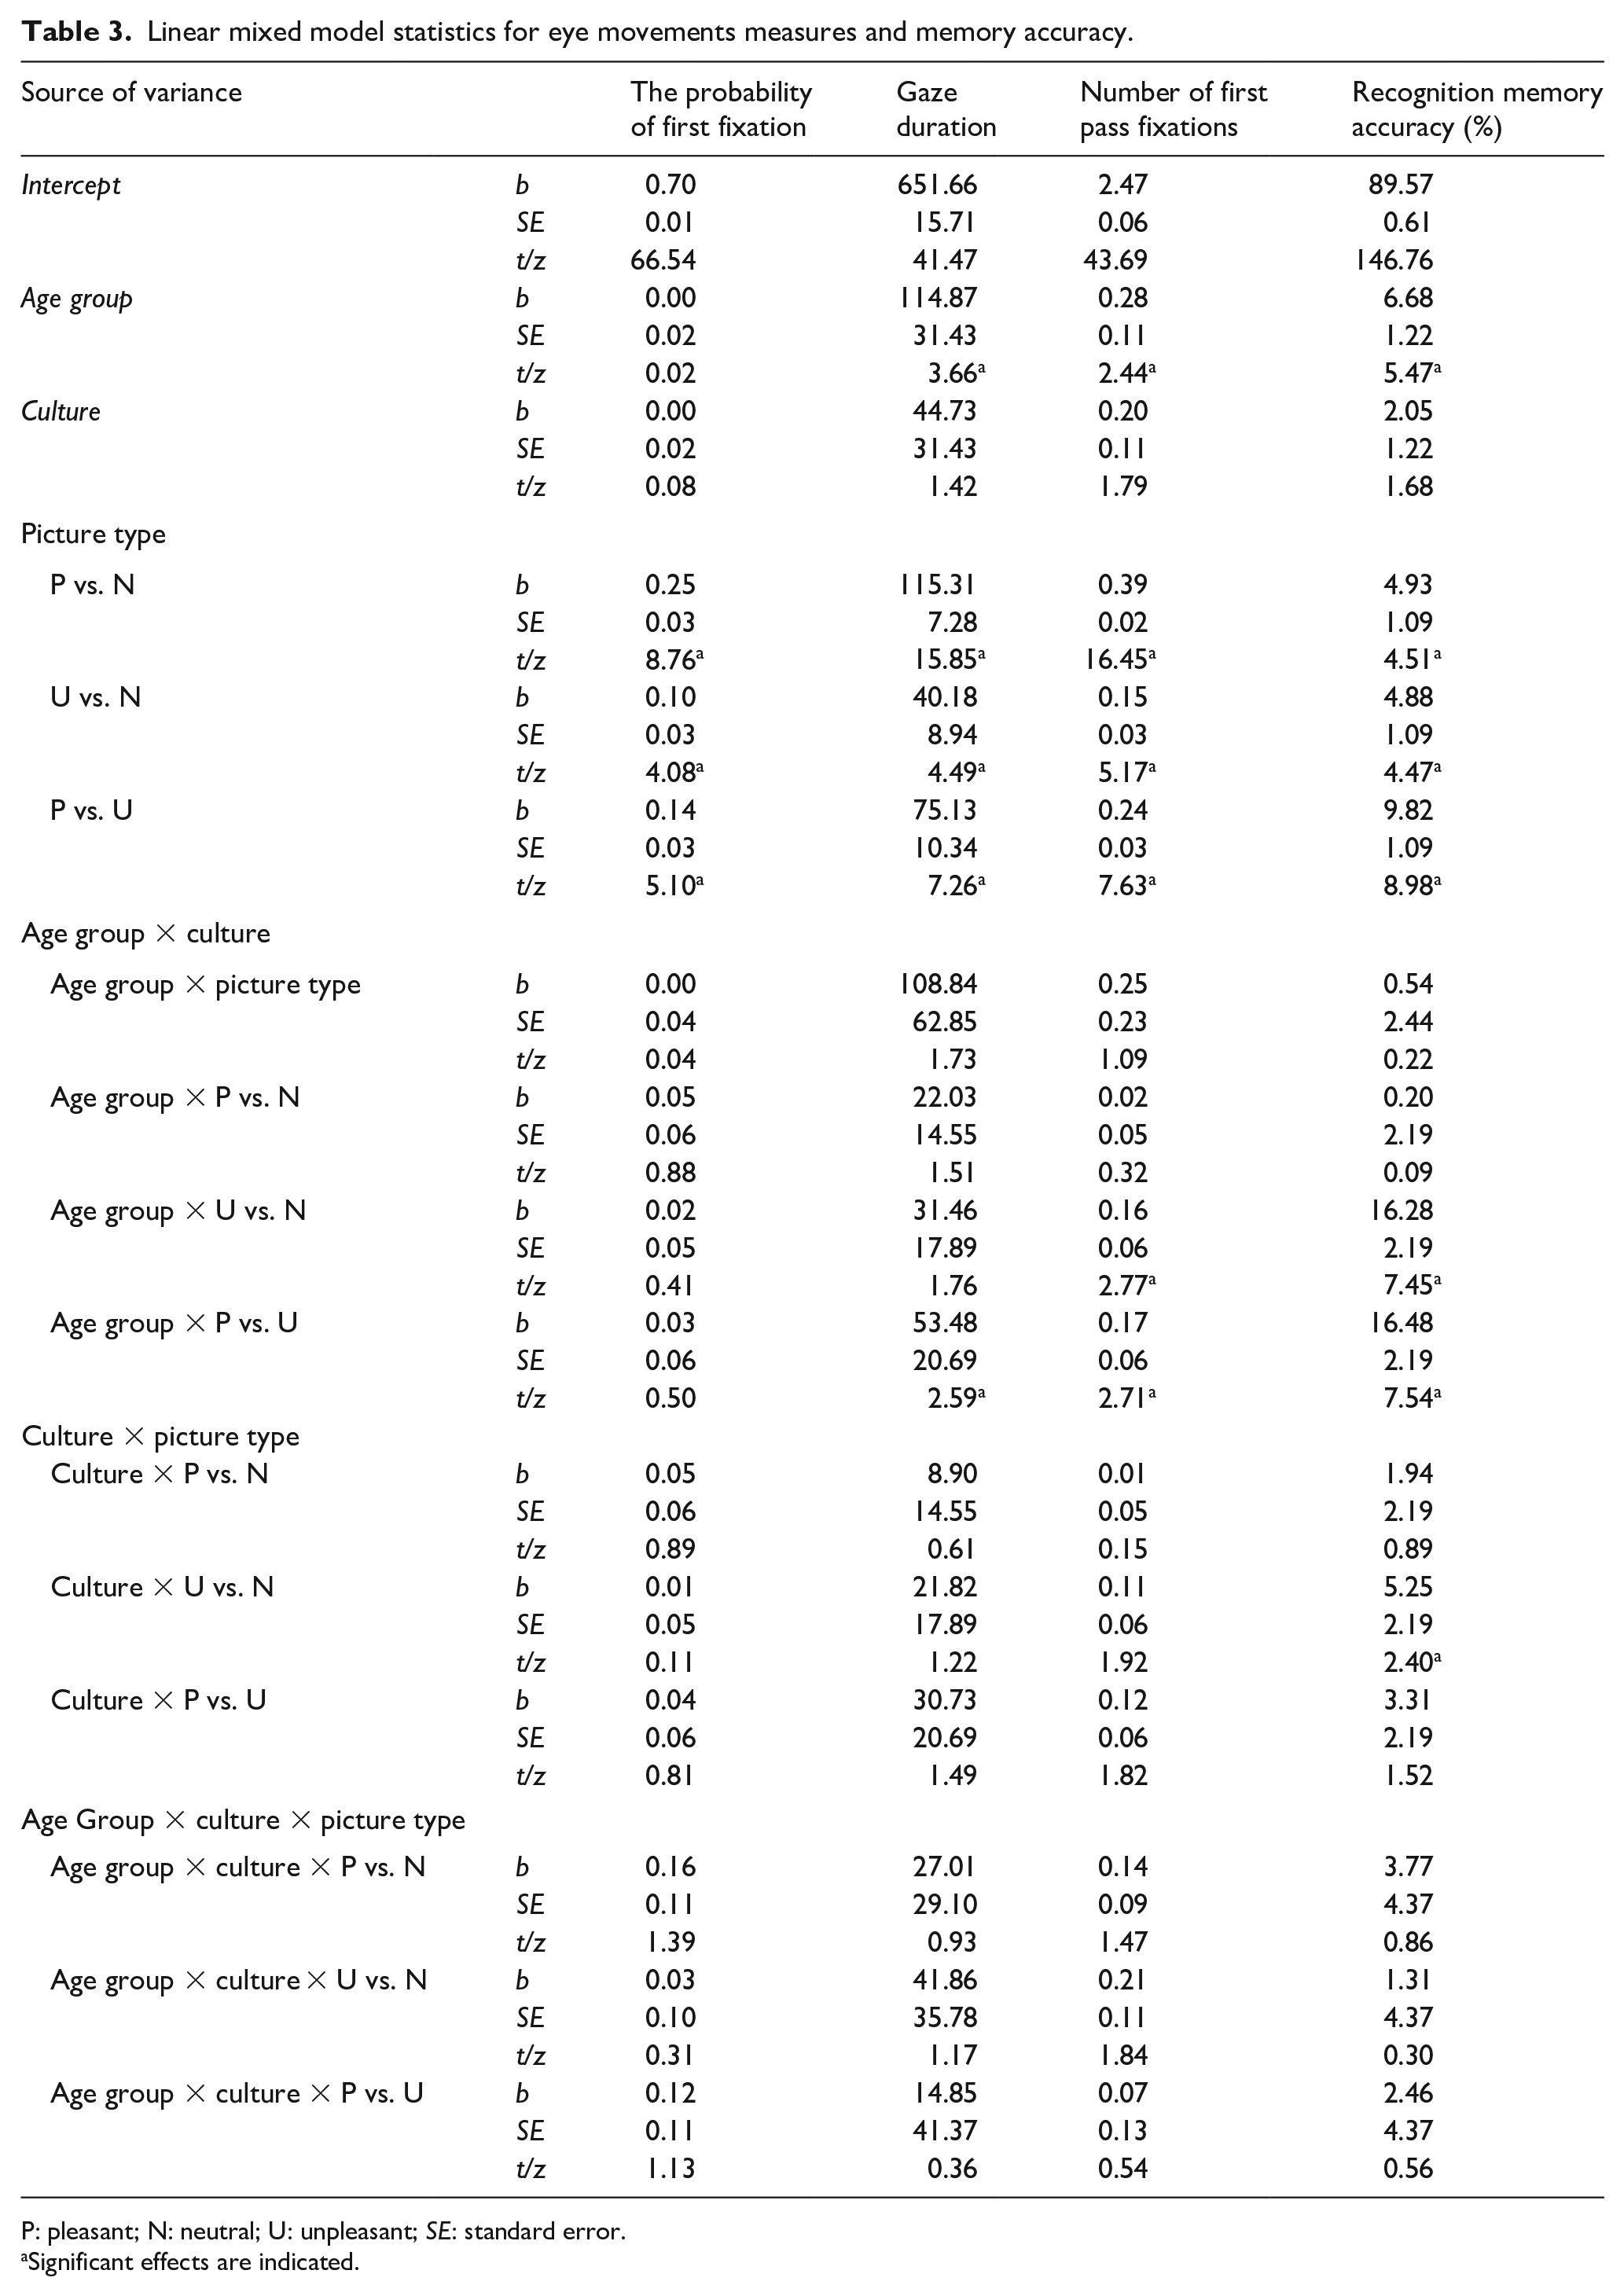
Invalid data (including data recorded when participants moved their head or where fixations were off-centre at the beginning of a trial by >1°) were excluded from analysis (<0.5% in total). Following standard procedures, fixations shorter than 80 ms or longer than 1,200 ms were also removed (affecting <0.5% of trials). We collected data from the interest areas (each picture in the display) and calculated the time spent looking in that area, gaze duration (GD), before participants inspected another picture. The proportion of the first fixations landing in an interest area and the number of fixations made to an interest area (from first fixation up to leaving that area) are also reported in the main text. Data were analysed using linear mixed effects models (LMMs, Baayen et al., 2008) using R (R Development Core Team, 2016) and the lme4 package (Bates et al., 2014). A maximal random effects structure was used where possible (see Barr et al., 2013). The MASS package (Venables & Ripley, 2002) was used to define main effects of age group, culture, and a contrast matrix was used to assess picture type effects. Following convention, t > 1.96 was considered statistically significant. Means and standard errors are summarised in Table 2. The statistics for eye movement measures and memory accuracy are summarised in Table 3.
Means and SEs for eye movement measures and memory.
P: pleasant; N: neutral; U: unpleasant.
Standard error of the means are provided in parentheses.
Linear mixed model statistics for eye movements measures and memory accuracy.
P: pleasant; N: neutral; U: unpleasant; SE: standard error.
Significant effects are indicated.
The probability of first fixation
This measure is used to address any selective attentional orienting or preference for one picture type compared with the others. The main effect of picture type was significant, the probability of first fixation was higher for pleasant pictures (36%) followed by the unpleasant pictures (33%), and least for neutral (31%) pictures. No other effects were significant, zs < 1.96. This finding indicates that all participants were more likely to initially orient to the pleasant pictures.
However, since the task demands of this study required participants to fixate and engage with all three pictures in the display, if there were any group differences in the time spent engaging with one type of stimuli compared with another (before moving the eyes to a different picture), then this would indicate preferential processing for that type of stimulus for one group over another. This is what we looked at next.
GD
GD is the summed duration of all fixations from the first fixation within a region until a fixation is made outside that region. Participants make more fixations on pictures (before moving the eyes to a different picture) when they show a preference for that picture. Longer GDs indicate increased focus and engagement with a stimulus, from which one can infer preferential processing of that stimulus. The main effect of age was significant; GD was longer for young adults than their older counterparts. The main effect of picture type was significant; GD was longer for pleasant pictures followed by unpleasant, and least for neutral pictures. The interaction between age group and picture type for pleasant versus unpleasant was also significant. Follow-up contrasts showed both older and young participants looked more at pleasant than unpleasant pictures, but, this effect was significantly larger for older adults, b = 101.92, standard error (SE) = 14.66, t = 6.95, than young adults, b = 48.40, SE = 14.65, t = 3.30. More crucially, the three-way interaction was not significant, suggesting the PE is similar in both cultures. No other effects were observed, ts < 1.96. Figure 2 panel (a) shows the interaction between age group and picture type.
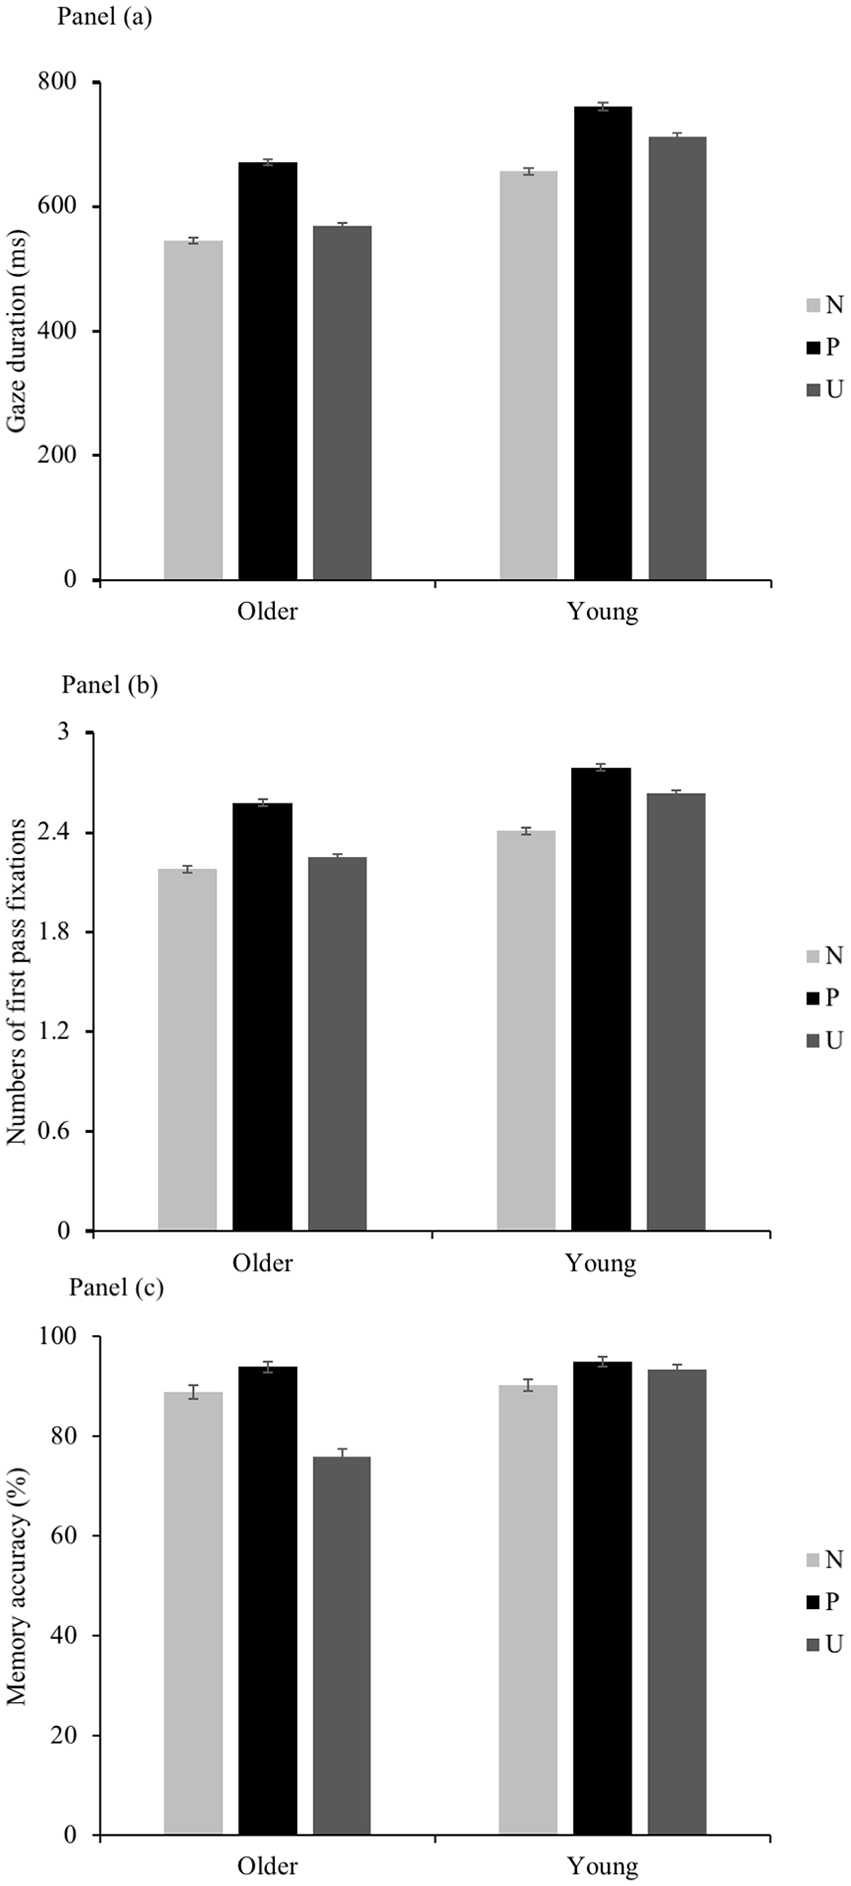
Figure shows the interactions between age group and picture type for eye movement measures and recognition memory accuracy. Panel (a) shows the interaction between age and picture type for GD; Panel (b) shows the interaction between age and picture type for numbers of first pass fixation; and Panel (c) shows the interaction between age and picture type for memory accuracy.
Number of first-pass fixations
The number of first-pass fixations is the count of all fixations within a region from the first fixation until a fixation is made outside this region. For this measure, the data showed a similar pattern to the GD measure. A main effect of age reflects the propensity of young adults to have more fixations than their older counterparts overall. The main effect of picture type was also significant, and numbers of fixations was greater for pleasant pictures followed by unpleasant, and least for neutral pictures. The interaction between age group and picture type was observed for comparisons of age group × pleasant versus unpleasant and age-group × neutral versus unpleasant. Follow-up contrasts showed that both older (b = 0.33, SE = 0.05, t = 7.25) and young (b = 0.16, SE = 0.05, t = 3.46) adults looked more often at pleasant than unpleasant pictures, but again this effect was larger for the older than the young adults. Follow-up contrasts for neutral versus unpleasant revealed more fixations for unpleasant than neutral pictures (b = 0.23, SE = 0.04, t = 5.47), with no difference for older adults (b = 0.07, SE = 0.04, t = 1.66). Again, the three-way interaction was not significant, indicating the PE to be similar in both cultures. No other effects were observed, t < 1.96. Figure 2 panel (b) shows the interaction between age group and picture type.
In sum, the number of fixations measure is in line with the GD measure, showing a clear PE. However, the probability of first fixation shows only a main effect for pleasant pictures. This measure was not modulated by age, showing that the GD measure (the sum of the fixations once a picture has been initially fixated) is a more sensitive measure of the PE in this study, and revealing that the older participants have a preference to explore the pleasant pictures in more detail before moving the eyes to look at the other pictures in the display.
Recognition memory accuracy
We tested for picture recognition accuracy by calculating the proportion of pictures correctly identified as seen previously in the eye movement experiment. A main effect of picture type was significant, and showed that all participants remembered pleasant pictures most, followed by neutral pictures, and participants remembered unpleasant pictures the least well. A main effect also showed that young adults had higher accuracy overall than older adults. An interaction between culture and picture type was found, and follow-up contrasts showed higher recognition accuracy for neutral over unpleasant pictures for UK participants (b = 7.17, SE = 1.79, t = 4.00), but not China participants (b = 2.26, SE = 1.83, t = 1.23). An interaction between age group and picture type was also observed, and follow-up contrasts showed higher recognition accuracy for pleasant over unpleasant pictures for older adults (b = 18.06, SE = 1.57, t = 11.48), but not young adults (b = 1.67, SE = 1.54, t = 1.08). Follow-up contrasts for neutral versus unpleasant revealed higher recognition accuracy for neutral over unpleasant for older adults (b = 13.02, SE = 1.57, t = 8.28), whereas the young adults showed slightly higher recognition accuracy for unpleasant over neutral (b = 3.17, SE = 1.54, t = 2.06). More importantly, the three-way interaction was not significant, p > .05. Figure 2 panel (c) shows the interaction between age group and picture type.
Bayes factors (BFs; Kass & Raftery, 1995) were also computed, using the lmBF function within the BayesFactor package (Morey & Rouder, 2015) in R (R Development Core Team, 2015), with the scaling factor for g-priors set to 0.5, and using 100,000 Monte Carlo iterations, to determine whether the PE is actually similar across both cultures, as suggested by the LMM analysis. Participants were specified as random factors. Following Vandekerckhove et al. (2015), BFs > 3 were taken to provide weak to moderate support for a model, and BFs > 10 to provide strong support, whereas BFs < 1 were taken to provide evidence against a model and in favour of the base model. Based on the LMM analysis, we constructed a denominator model (base model to which other models were compared) for each measure. BF analysis favoured the denominator model over a model containing main effects of age group and picture type plus a three-way interaction among age, culture, and picture type (GD, BF = 84,128; the number of first-pass fixations, BF = 32,536, memory accuracy, BF = 3.15 × 10¹²), suggesting that the age-related PE is independent of culture.
Discussion
Our aim was to compare the PE in Eastern (China) and Western (United Kingdom) cultures when viewing emotional pictures. In an eye-tracking task, both older and younger adults fixated for longer on pleasant pictures, before moving on to inspect another picture in the display. However, the magnitude of this effect was significantly greater in the older adults, suggesting an age difference in the preference for looking at pleasant emotional images, especially in the attentional engagement stage, which is reflected by the GD and number of first-pass fixation measures. This effect was essentially the same across the Chinese and UK participants, and is consistent with an age-related bias for positive emotional information (Carstensen et al., 1999; Charles et al., 2003; Isaacowitz et al., 2006, 2007; Mather & Carstensen, 2003) in both Eastern and Western cultures.
A preference for pleasant pictures was also observed in an unexpected memory test (Charles et al., 2003) given to the participants following the eye-tracking study. Recognition memory for pleasant over unpleasant pictures was evident for older, but not younger adults, from both cultures. Older participants not only remembered more pleasant compared with unpleasant pictures, but remembered more neutral compared with unpleasant pictures, suggesting unpleasant pictures received the least processing (were avoided) in older adults, with no such effect for young adults. Moreover, these effects were obtained even though task demands required all pictures to be engaged with and processed in each trial in the eye movement task. Our findings are therefore consistent with a PE in attention and memory in both Eastern and Western groups.
These findings run counter to the claim that cultural differences in emotional processing are underpinned by collectivist or individualistic cultural practices, with such practices having been proposed to produce an absence of the PE in Eastern cultures (Fung et al., 2008). This controversial claim has, however, received mixed empirical support, with some studies reporting an absence of a PE in Eastern samples (Fung et al., 2008), whereas others provide evidence to support the existence of a PE (Kwon et al., 2009), including evidence from an earlier eye-tracking study from our group which showed that older Chinese participants preferentially looked at positive emotional information (Wang et al., 2015). However, none of those studies has directly compared effects cross-culturally in the same experiment, and the Fung et al.’s claim is based on a null effect. Consequently, the present research contributes to this debate by showing that the PE is found cross-culturally, for both Eastern and Western participants in the same experiment. With this study, we show consistent age differences in PE across both an eye-tracking experiment and a follow-up memory experiment for China and UK participants, whereas Bayesian analysis supports an interpretation of the findings in which the PE is essentially the same across the two cultures.
Such findings are in line with SST theory, which posits that the perception of limited future life-time is what leads to the development of a PE in older people. Moreover, the theory that older adults pursue more positive-related immediate goals, and younger adults focus more on goals that have longer term impact appears to be cross-cultural. Thus, the PE reflects an ageing effect, and the evidence from this study suggests that this ageing effect is likely to be independent of cultural emotional processing differences.
In summary, by comparing the PE cross-culturally, using a novel design permitting presentation of pleasant, unpleasant, and neutral information in a single trial, we replicate key previous findings (Isaacowitz et al., 2006; Wang et al., 2015) and show consistent age differences in the PE in preferential viewing and recognition memory for both Chinese and UK participants. Our analysis shows that the PE is essentially the same across Eastern and Western cultures and, resonant with SST theory, the findings suggest that ageing, and not culture, determines the PE. Indeed, as ageing is fundamental, irrespective of culture, an age-related bias for positive information may exist across Western and Eastern cultures, and this bias may even be universal.
Footnotes
Author contributions
J.W., F.X., L.H., and V.B. contributed to the design of the experiment. F.X. and L.H. implemented the experiment. F.X., L.H., and K.M. collected the data. F.X. analysed the data. F.X., J.W., K.P., and V.B. wrote the manuscript.
Declaration of conflicting interests
The author(s) declared no potential conflicts of interest with respect to the research, authorship, and/or publication of this article.
Funding
The author(s) disclosed receipt of the following financial support for the research, authorship, and/or publication of this article: This work was supported by a National Natural Science Foundation of China ( grant no. 81771823) to J.W., a Chinese Scholarship Council research visit grant to F.X., a Recruitment to Foreign Experts award to V.B., and a 1000 Talents Visiting Professorship to K.P.
