
Abstract
Visual textures are critical in how individuals form sensory expectations about objects, which include somatosensory properties such as temperature. This study aimed to uncover crossmodal associations between visual textures and temperature concepts. In Experiment 1 (N = 193), we evaluated crossmodal associations between 43 visual texture categories and different temperature concepts (via temperature words such as cold and hot) using an explicit forced-choice test. The results revealed associations between striped, cracked, matted, and waffled visual textures and high temperatures and between crystalline and flecked visual textures and low temperatures. In Experiment 2 (N = 247), we conducted six implicit association tests (IATs) pairing the two visual textures most strongly associated with low (crystalline and flecked) and high (striped and cracked) temperatures with the words cold and hot as per the results of Experiment 1. When pairing the crystalline and striped visual textures, the results revealed that crystalline was matched to the word cold, and striped was matched to the word hot. However, some associations found in the explicit test were not found in the IATs. In Experiment 3 (N = 124), we investigated how mappings between visual textures and concrete entities may influence crossmodal associations with temperature and these visual textures. Altogether, we found a range of association strengths and automaticity levels. Importantly, we found evidence of relative effects. Furthermore, some of these crossmodal associations are partly influenced by indirect mappings to concrete entities.
The perception of surface textures is driven by haptic and visual information (Baumgartner et al., 2013; Lederman & Abbott, 1981; Marks, 1978; Phillips et al., 2009). Research has suggested that vision and touch provide independent but complementary information for the perception of textures (Whitaker et al., 2008). More specifically, the sense of sight is more effective for discriminating texture boundaries, whereas touch is better for assessing roughness. In terms of the discrimination of global shapes (albeit those that can be felt and held in the hands), the senses of sight and touch, independently, seem to be equally effective (Norman et al., 2006, 2004; Phillips et al., 2009). However, the sense of touch seems to outperform vision in the perception of high spatial frequencies (Picard, 2006). High spatial frequencies provide information about the fine details of visual stimuli (e.g., surface texture, sharp edges). Given that textures can be perceived through the sense of touch but also through sight, textures can be classified as tactile or visual textures. Tactile textures refer to the physical variations of a given object or material that can be felt by touch (Liu et al., 2015; Manfredi et al., 2014). On the contrary, as defined in the APA Dictionary of Psychology, a visual texture is a “two-dimensional rendering of a three-dimensional object that describes its surface characteristics” (American Psychological Association, n.d.b). In contrast to other visual attributes, visual textures portray approximately repeating patterns across the objects they are part of (Groissboeck et al., 2010). Visual textures are critical for the identification of surfaces and materials (Motoyoshi et al., 2007), and they help in the generation of expectations about the physical properties of tactile stimuli, including temperature (Spence, 2020c). Thus, visual textures contribute to guiding how individuals interact with the physical elements in their environment. Given that the visual and somatosensory aspects (e.g., temperature) of textures are experienced in tandem throughout life, individuals may hold specific associations between material properties and temperature and consequently between visual textures and temperature. More broadly, these associations might be based on the thermal properties of materials, such as thermal effusivity (i.e., the ability of a given material to transfer thermal energy to its surroundings; see Bergmann Tiest & Kappers, 2009). This may be in line with the existence of a myriad of associations between features of different sensory modalities, referred to as crossmodal correspondences (Parise, 2016; Spence, 2011).
Researchers have regained interest in crossmodal associations involving temperature in the past decade (Spence, 2020c), after the first studies dating back to the 1920s (e.g., Mogensen & English, 1926). This literature has investigated associations between temperature, on one hand, and attributes in vision, audition, and taste, on the other (Spence, 2020c). In terms of vision, recent studies have examined elements such as colour hue (Ho, Iwai, et al., 2014; Ho, Van Doorn, et al., 2014) and colour lightness (Motoki et al., 2019). In the auditory modality, Velasco et al. (2013) used pouring sounds to investigate the effect of sonic properties in the perception of temperature in liquids. It is worth noting that the latter association may be based on semantic congruency rather than crossmodal correspondences. The temperature of liquids changes with their viscosity (Gutmann & Simmons, 1952), which ultimately influences the acoustic properties of liquids (Agrawal et al., 2020; Parthasarathy & Chhapgar, 1955; Pellegrino et al., 2019). In this case, the senses may be picking up on an amodal property that is better specified by touch than sound. Further details on the distinction between semantic congruency and crossmodal correspondence are provided later in the text. In addition, Wang and Spence (2017) studied correspondences between temperature and pitch and tempo in melodies. Furthermore, Motoki et al. (2020) explored correspondences between temperature words in Japanese and taste attributes. The latter authors found that the word 温かい (meaning warm) was associated with saltiness and that the word 冷たい (meaning cool) was associated with sourness. These associations might differ across languages, as perceptual information from previous experiences is coded into language, and the latter is also used to describe such experiences (Martino & Marks, 1999, 2001). The literature on temperature-based crossmodal associations has mostly dealt with the visual modality, especially aspects related to colour (Ho, Iwai, et al., 2014; Ho, Van Doorn, et al., 2014; Spence, 2020b). Other attributes, such as visual textures, have not yet been explored in depth despite their close relationship with temperature. Given the complementary roles of vision and touch in the perception of material properties and textures (Picard, 2006; Sun et al., 2016; Whitaker et al., 2008), the study of visual textures in temperature-based crossmodal associations is relevant for the psychological literature, as it can elucidate how individuals integrate information from both modalities, the role of bottom-up and top-down approaches, and how people form expectations about the world around them. From a practical perspective, the present research is relevant for practitioners, as visual textures may be incorporated in physical objects and surroundings (e.g., products, walls) to influence the temperature expectations of the environment or objects. For example, building on van Rompay et al.’s (2018) study, in which the authors found that ice cream posters with smooth visual textures can increase sweetness expectations of ice cream, visual textures may be used to influence temperature expectations of foodstuffs.
It is important to consider that the potential associations between visual textures and temperature may lie somewhere in the broad crossmodal associations’ continuum, between semantic congruency and crossmodal correspondences (Parise, 2016). On one end, semantic congruency relates to the case when a pair of stimuli are tied to the same specific identity or meaning, and it is possible to identify the corresponding identity with both stimuli. For example, taking the sight of a dog, coupled with the sound of a dog (e.g., barking), both sensory signals belong to the same identity (a dog vs. a cat, for instance; Chen & Spence, 2010). On the other end, crossmodal correspondences refer to mappings between low-level features from different sensory modalities, such as the correspondence between visual brightness and auditory loudness, which are not tied to a single common source identity (Parise & Spence, 2013; Spence, 2011). Spence (2020a) has recently attempted to disentangle crossmodal correspondences from semantic congruency in colour–odour associations. As Spence (2020a) suggested, associations using familiar and easily identifiable odours are likely to generate semantic matchings based on a source object, instead of generating perceptual matchings when the odours cannot be linked to specific identities. Related to the present study, some visual textures may portray a specific material, such as wood; in this way, the visual texture provides information about the material properties of wood, including its thermal properties (e.g., low thermal effusivity; Obata et al., 2005), and consequently how warm it may “feel” to the touch. In this case, an association between the visual texture portraying wood and warm temperatures may lie closer to semantic congruency than crossmodal correspondence in the continuum. That being said, it is difficult to pinpoint exactly where these associations may lie in the continuum, as a visual texture may be specific to an identity, whereas temperature relates to a more abstract concept.
In the present study, we start by evaluating the existence of crossmodal associations between visual textures and temperature concepts. We assess these associations through explicit tests and implicit association tests (IATs) to obtain a more holistic view of the associations and evaluate potential differences which could hint at different underlying mechanisms. To this end, we conducted three online experiments. In the first experiment, we used 43 non-computer-generated visual texture categories found in everyday life to assess the existence of explicit correspondences with temperature concepts. In the second experiment, we selected the two visual textures with the strongest associations with low and high temperatures, as found in the first experiment, and probed whether these associations were also found under a speeded task (i.e., IAT) to assess their automaticity. As defined by the APA, automaticity refers to “the quality of a behaviour or mental process that can be carried out rapidly and without effort or explicit intention” (American Psychological Association, n.d.a). In the IAT, associations are inferred from patterns of response times (RTs) and error rates (ERs) stemming from combined sorting tasks, and individuals do not have to judge the respective associations. Importantly, in the IAT, individuals face time pressure, as they are instructed to respond to each trial as fast as they can. Hence, the IAT is a measure of automatic cognitive processes, even if participants are somehow aware of the latent construct the IAT picks up on (Kurdi et al., 2021). As Houwer & Teige-Mocigemba (2009) suggested, the IAT and explicit tests evidence their respective latent constructs under different automaticity conditions. The evaluation of automaticity is relevant for the present study, as it can help elucidate whether the associations require complex levels of processing or strategizing, as well as the underlying account these associations may be based on. Finally, in the third experiment, we evaluated to what extent individuals associated different visual textures with concrete entities, and how this relationship could influence the crossmodal associations between temperature and visual textures. Therefore, this work adds to the existing body of knowledge related to the growing field of temperature-based crossmodal correspondences (see Spence, 2020b, for a review) and to the discussion on the automaticity of crossmodal correspondences (Getz & Kubovy, 2018; Spence & Deroy, 2013).
Visual and tactile perception of textures
Both vision and touch are major contributors to the perception of object textures, although the type of information and how it is encoded in the brain differ depending on the modality (Badde et al., 2018; Whitaker et al., 2008). Vision and touch provide complementary information about material properties, but the perceptual judgements derived from them are highly similar (Fujisaki et al., 2015). Combining visual and tactile information, compared with unimodal stimuli, does not improve roughness discrimination (Guest & Spence, 2003; Jones & O’Neil, 1985). The information derived from vision and touch varies in terms of their priority of processing. For instance, relief—a spatial property of texture characterised by differences in elevations and inequalities—is better assessed by vision, whereas softness is better assessed by touch (Picard, 2006). In addition, while some material properties can only be identified with one sense (i.e., surface colour, transparency with vision), other material properties can be identified with multiple senses. For example, tactile dimensions, such as roughness, can also be identified through the sense of sight (Hanada, 2016). The close relationship between vision and touch in the perception of textures is also evidenced in the brain by the shared activation areas during visual and tactile perception of objects and surface textures (Spence, 2020b). Sun et al. (2016) analysed brain activation in response to visual stimuli of glossy, matte, rough, and textured, three-dimensional (3D) computer generated objects. The authors found that the visual stimuli related to the objects’ surface texture triggered neural circuits (secondary somatosensory cortex, S2) associated with tactile stimulation. Importantly, Sun et al. (2016) found that just imagining the textural properties of the objects did not evoke the brain activity related to tactile stimulation. As the latter authors suggested, the activated area in the brain when seeing visual textures may be part of the circuitry in charge of planning future interactions with specific objects and the physics involved in the process (e.g., expected friction, temperature), which highlights the relevance of vision in the perception of textures and consequently the importance of visual textures.
Accounting for associations between temperature and visual textures
As the previous literature has shown, there is a close link between vision and touch in the perception of textures. Given that individuals generally see objects and textures before touching them and perceiving their temperature (through the somatosensory system; McGlone & Reilly, 2010), it stands to reason that individuals may associate temperature concepts with material properties and therefore visual textures. One of the most likely bases for temperature-based crossmodal associations, and those involving somatosensory information in general, is the internalisation of statistical regularities in the environment (Spence, 2011, 2020c), as well as the continuous adaptation of new sensory signals in the brain to form predictions (Piqueras-Fiszman & Spence, 2015). As Ernst (2007) showed, through statistical co-occurrence in the environment, the brain learns mappings between two different sensory signals originating from vision and touch (e.g., temperature) and can later integrate them. Thus, pertaining to the present study, people may have internalised, through repeated exposure when they see and touch surfaces and materials, that certain textures have specific material properties and are generally encountered at specific temperatures. For example, people may associate smooth stone surfaces with low temperatures as they tend to feel cold to the touch (due to their high thermal effusivity). In addition, this repeated exposure may shape people’s expectations of temperature when they first see specific textures. It is worth noting that these associations may come from associative learning due to semantic congruency or crossmodal correspondence, as discussed before.
Temperature perception of materials
Information about the material properties of objects and textures is primarily conveyed through visual textures (Adelson, 2001; Motoyoshi et al., 2007; Schwartz & Nishino, 2020). As Adelson (2001) suggested, individuals are fairly accurate in making predictions about the material of objects and how hot or cold they will feel based on visual textures. Multiple studies have investigated the role of visual textures on judgements of material properties such as expected weight (Buckingham et al., 2009), roughness (Ho et al., 2006), and slipperiness (Lesch et al., 2008), as well as material categories and perceived material properties (Fleming et al., 2013). This literature highlights the importance of visual textures for individuals to infer the material of surfaces and their thermal properties, which will shape potential associations between temperature and the visual textures themselves.
To the best of our knowledge, this is the first study to systematically investigate crossmodal associations between visual textures and temperature concepts. We relied on the literature on materials science and design to elucidate potential general patterns in these temperature-related associations based on the physical properties of materials and the metaphorical meanings that visual textures can convey. From a physical perspective, the thermal properties of materials may inform potential associations between visual textures and temperature. In particular, materials with lower thermal effusivity feel warmer than those with higher thermal effusivity at the same ambient temperature (Obata et al., 2005; Wastiels et al., 2012b). Thermal effusivity refers to the ability of a specific material to transfer thermal energy to its surroundings, and it depends on its thermal conductivity, specific heat, and density (Blaine, 2018; Cottrill et al., 2018). For example, Wastiels et al. (2012b) found that wood is perceived as warm, whereas stone is perceived as cold. These findings are consistent with the general thermal effusivity values of these materials. For instance, while wood has generally low thermal effusivity values, which depending on the specific type can range from 150 to 640 J/K m s0.5, stones have higher thermal effusivity values of around 3,000 J/K m s0.5 (Obata et al., 2005; Rempel & Rempel, 2013). In addition, Karana et al. (2009) found that wooden products are perceived as warm in a study on the meaning attributions of sensory aspects and manufacturing processes of materials using 125 products.
Different studies have also found correlations between warmth perception and other physical properties. For instance, Wastiels et al. (2012b) investigated the relationship between the perception of warmth of various materials (i.e., bluestone, brickwork, concrete, plaster, steel, and wood) and different technical parameters, including thermal (i.e., conductivity, specific heat, density, effusivity), surface-related (i.e., roughness, glossiness), and colour-related (i.e., hue, lightness, intensity) factors under three perceptual conditions (i.e., visual-only, tactile-only, and visual- and tactile-combined). The authors found a negative correlation between warmth perception and surface gloss in the tactile-only condition. The authors suggested that the basis of this correlation may lie in the relationship between glossiness and roughness, which allows glossiness also to be perceived by touch, despite being a visual feature. More specifically, rough materials absorb more light, as they have more irregularities and hence less glossy surface area. Wastiels et al. (2012b) also found a positive correlation between warmth perception and colour intensity in the visual-only and combined conditions. Unsurprisingly, materials painted in red were perceived as the warmest, followed by those painted in yellow. In another study, Wastiels et al. (2012a) found that locally rough surfaces were perceived as warmer than locally smooth surfaces and also that warm coloured (between yellow and red) surfaces were perceived as warmer than cool coloured (between blue and yellow-green) ones. In this study, the authors found no interaction effects between roughness and colour, and that the effect of colour was larger than the effect of roughness. Nevertheless, Fenko et al. (2010) used two different types of products—scarves and breakfast trays—to study the relative importance of colour (i.e., red vs. blue) and material (i.e., viscose vs. wool for scarves; wood vs. aluminium for breakfast trays) in the perception of warmth and found that both colour and material contribute roughly equally. In addition, Chen et al. (2009) studied the perception of 37 tactile textures applied in confectionery packaging and their physical properties, and they found a negative correlation between hardness and warmth, which indicated that soft tactile textures might be perceived as warmer than hard ones.
From a metaphorical perspective, Fenko et al. (2010) investigated the relative importance of the literal and metaphorical meanings in the overall experience of warmth applied to consumer products through an interview study. The authors found that the metaphorical meaning of warmth was mentioned twice as often as the literal meaning in their associations with products. Materials that come from beings that were once alive (e.g., fur) may carry over associations related to their previous life (and their own production of heat) and hence are regarded as warm (Heschong, 1979, p. 38; Schifferstein & Wastiels, 2014; Wastiels et al., 2012b). In this way, visual textures may trigger imagery related to specific materials, which could generate associations between visual textures and temperatures based on the temperature-related metaphorical meanings of the material that the visual texture resembles.
Overall, based on the statistical account of crossmodal correspondences (Ernst, 2007; Parise et al., 2014; Spence, 2011, 2020c) and the temperature-related perception of textures (physical and metaphorical), it is natural to conjecture that throughout their life, people may have internalised that specific textures and temperatures are perceived in tandem. As the abovementioned literature has shown, textures are perceived both visually and tactually, and visual information (i.e., visual textures) plays a vital role in the formation of expectations about the physical properties—including temperature—of textures and objects. It is, therefore, likely that people associate visual textures with specific temperatures that tend to co-occur. Thus, we expected to observe two general patterns in the associations between temperature concepts and visual textures, mainly in terms of the thermal properties of the materials they resemble and their metaphorical meanings. More specifically, we stated the following hypotheses:
Although we had some expectations on the patterns of associations between visual textures and high-temperature concepts from a metaphorical point of view, associations with low-temperature concepts were not clear.
A consideration in the associations studied here is the potential variation in automaticity when assessed using explicit tests compared with IATs. The degree of automaticity may depend on how the associations are formed (i.e., different accounts of crossmodal correspondences) and the level of strategizing different pathways may require, which will also depend on participants’ experiences (Spence & Deroy, 2013). For instance, some associations may be triggered through indirect comparisons with specific surfaces and materials, which may lead to more strategizing and hence lower levels of automaticity. On the contrary, other associations may be formed via low-level features of the visual textures per se and hence be more automatic. That said, the literature so far has shown that crossmodal correspondences are not necessarily automatic (Getz & Kubovy, 2018).
The study of associations between visual textures and temperature concepts is relevant for the academic literature as it deepens the understanding of the different pathways through which crossmodal associations may occur. Furthermore, this study is of interest for the psychological literature as it elucidates the role of top-down and bottom-up approaches in the formation of crossmodal associations and their effect on their automaticity. Finally, crossmodal associations between visual textures and temperature are relevant for diverse research fields, as these associations may potentially be used to influence environmental and object temperature expectations in online and physical settings.
Experiment 1
Experiment 1 aimed to uncover whether individuals hold explicit associations between visual textures with specific characteristics and either low or high temperature concepts. To this end, we used a plethora of non-computer-generated visual texture categories, validated in terms of their most predominant feature, and we asked people to explicitly evaluate with which temperature they associated each of them.
Methods
Participants
A total of 193 native English speakers (112 females, 79 males, 2 unreported), aged 18–40 years (Mage = 28.68 years, SDage = 6.47) took part in the experiment. The participants were residents of various countries, namely the United Kingdom (n = 151), the United States (n = 17), Canada (n = 12), Ireland (n = 6), Australia (n = 5), New Zealand (n = 1), and Poland (n = 1). The participants were divided into two broad groups depending on the visual texture categories they were presented with. Based on a multilevel one-way ANOVA power calculation, we aimed to recruit at least 80 participants in each of the two groups to achieve a statistical power of .8 using a small effect size of Cohen’s f = 0.1 with an alpha level of .05. The experiment was programmed and conducted in Qualtrics (https://www.qualtrics.com/), and the participants were recruited from Prolific (https://www.prolific.co/). Participants provided their informed written consent before taking part in any of the three experiments reported in the present work. The three studies complied with the World Medical Association’s Declaration of Helsinki. In addition, as simple anonymous online questionnaires, the studies complied with the policies and requirements stated by the Aarhus University Research Ethics Committee and were therefore exempted from the need for formal ethical approval.
Apparatus and materials
The stimuli consisted of images of visual textures found in everyday life from different categories extracted from the Describable Textures Dataset (DTD; Cimpoi et al., 2014). We used the DTD database as it provided a wide pool of categorised and validated images of visual textures with specific predominant properties found in everyday life. We used 43 of the 44 visual texture categories in the DTD database, and we used four images per category. We left out the visual texture category banded as it was virtually identical to the category lined and we sought to reduce redundancy in our models. We selected the four images of each category based on specific criteria. More specifically, the images had to be of sufficient quality to avoid distortions, the textures had to cover the entirety of a given squared area, they could not portray extraneous objects besides the visual textures themselves, and they had to show the textures from approximately a 90° angle. Each of the final stimuli was created by extracting a 300 × 300 px square from the original image to ensure each stimulus complied with the abovementioned criteria. Moreover, to avoid potential confounding effects of colour, all the stimuli were converted to greyscale, and they were histogram equalised. The images were processed using GIMP 2.10.18 (The GIMP Development Team, 2020). Figure 1 presents an example of a visual texture category and its four images. All the final stimuli can be accessed on https://osf.io/hr8nd/.

Example of stimuli used in Experiment 1.
Design and procedure
To avoid fatigue in the participants due to the large number of stimuli, the 43 visual textures categories were divided into two broad groups (with 22 and 21 categories, respectively), based on alphabetical order. Moreover, to mitigate potential stimulus-specific biases, we included four images per visual texture category. Hence, each of the two broad visual texture category groups was further divided into four more subgroups, each one containing one of the four possible images in a specific visual texture category. This resulted in a total of eight groups, each containing either 22 or 21 stimuli (see the online Supplementary Material for details on the visual textures seen by each group and their demographics). Each participant was assigned to one of these eight groups and experienced either 22 or 21 visual textures depending on the group. Before taking part in the experiment, the participants provided their informed written consent and were provided with the aim of the study and general instructions, and they were randomly assigned to one of the eight groups. The participants were then presented with the stimuli, one at a time in random order, and they were asked to respond to a series of questions regarding their temperature associations with the stimuli, what words they would use to describe the images, how much they liked them, and how much they associated them with various material properties. More specifically, the participants indicated what temperature they associated with each visual texture. They indicated these associations by responding to the question “What temperature do you associate this texture with?” on a 100-point visual analogue scale (VAS) anchored from left to right by cold, cool, slightly cool, neither cool nor warm, slightly warm, warm, and hot, positioned at equal distances. They also stated two words that came to mind when describing each stimulus by inputting the words in two separate text boxes. The participants also rated how much they liked each visual texture on a 100-point VAS anchored by strongly dislike on the left end, neither like nor dislike in the middle, and strongly like on the right end. Moreover, the participants evaluated to what extent they associated each stimulus with four different material properties (i.e., rough-smooth, hard-soft, dry-moist, and sticky-slippery), part of the basic tactile dimensions of textures (Okamoto et al., 2013), using the semantic differential technique (SDT) on a 100-point VAS. These specific material properties were selected based on the previous literature suggesting a relationship between temperature material perception and other physical properties, including roughness (Wastiels et al., 2012a) and hardness (Chen et al., 2009), as well as the analysis of perceptual dimensions of visual textures (Thumfart et al., 2011). In addition, the dryness and stickiness scales were selected based on the close relationship between wetness and temperature (Filingeri & Ackerley, 2021). The anchors in each of the dimensions were randomised per participant. Finally, the participants indicated their age, gender, and country of residence. The experiment took approximately 19 min to be completed.
Data analysis
All the analyses were performed in R (R Core Team, 2021). Given that the data violated the normality and homoscedasticity assumptions, we analysed the association of each visual texture with temperature by conducting two separate analyses of variance-type statistics (ATS), one for each of the two broad groups of visual textures. To perform the ATS, we used the {nparLD} R statistical software package (Noguchi et al., 2012) and entered visual texture category as within-subject factor and participant ID as a vector for individual subjects. ATS does not make assumptions regarding the distribution of the data or about equal variances. Hence, ATS is appropriate for non-normal data with outliers (Erceg-Hurn & Mirosevich, 2008). As a measure of effect sizes, we used the relative treatment effects (RTEs) provided by the {nparLD} package. The RTEs indicate the tendency of participants to have a higher (or lower) temperature association rating for a given visual texture compared with the pool of all participants’ ratings for the other visual textures. RTEs range from 0 to 1, and larger differences between RTEs indicate larger differences in the ratings. Next, we performed Bonferroni-corrected Wilcoxon Signed Rank tests to uncover significantly different visual textures in terms of their temperature associations.
Furthermore, to explore how participants described the visual textures and identify whether they used temperature-related terms, we performed a keyword frequency analysis of the visual textures with the two lowest (coldest) and two highest (hottest) temperature ratings. For the coldest and hottest visual texture categories, the keywords were manually standardised based on the root of the words.
To investigate whether specific perceived material properties, as well as liking, exhibited any relationship with the temperature ratings, we performed a hierarchical cluster analysis (HCA) with Euclidian distances and Ward’s method to extract visual textures clusters as a function of their temperature ratings. The number of clusters was determined using the {NbClust} R package (Charrad et al., 2014) and further verified according to the Bayesian information criterion (BIC) as implemented in the {mclust} R package (Scrucca et al., 2016). The {NbClust} package provides 30 indices that are computed simultaneously to determine the relevant number of clusters. The optimal number is subsequently chosen based on a majority rule. Details on all the indices are provided in the original article from Charrad et al. (2014). Subsequently, we fit individual linear mixed models (LMMs) with temperature, liking, and the different material properties as dependent variable. In each of the LMMs, cluster was entered as the main fixed factor, and visual texture category and subject ID were entered as random factors. To perform the LMMs, we used the lmer function of the {lme4} R package (Bates et al., 2015), and the p-values were computed with the Satterwhite method using the {lmerTest} (Kuznetsova, 2017) and {pbkrtest} (Halekoh & Højsgaard, 2014) R packages. In addition, we tested each of the models with a likelihood ratio test (LRT) against a null model including only the visual texture category and subject ID random factors. Subsequently, we analysed differences between the clusters in each of the key variables through post hoc tests with Bonferroni corrections using the glht function of the {multcomp} R package (Hothorn et al., 2008). In addition, we conducted Kendall’s Tau correlation analyses using the temperature ratings, the different material properties, and the liking ratings using only the two visual textures considered as the coldest and hottest. We applied a Bonferroni correction at the value of p = .05/15 = .0033.
Results
The ATS revealed that there was a significant effect of texture on the temperature ratings in Group 1, FATS(1, ∞) = 16.62, p < .001, as well as Group 2, FATS(1, ∞) = 14.12, p < .001. The analysis revealed there were different visual textures associated with both low- and high-temperature concepts (Figure 2 and Table 1). On the lower end of the temperature scale, the visual textures with the lowest mean temperature ratings (most associated with low temperatures) were crystalline and flecked (both from Group 1), with the lowest score of 34.19 for the crystalline visual texture. Nevertheless, none of the visual texture categories had mean ratings below 33—the threshold corresponding to slightly cool. On the other end of the temperature scale, the visual textures with the highest mean temperature ratings (most associated with high temperatures) were cracked and matted (from group 1) and striped and waffled (from Group 2). Figure 3 presents the visual textures most associated with cold and hot temperature concepts. The striped visual texture had the highest score at 71.30, and these four visual texture categories were the ones with scores above 67—the threshold corresponding to slightly warm.
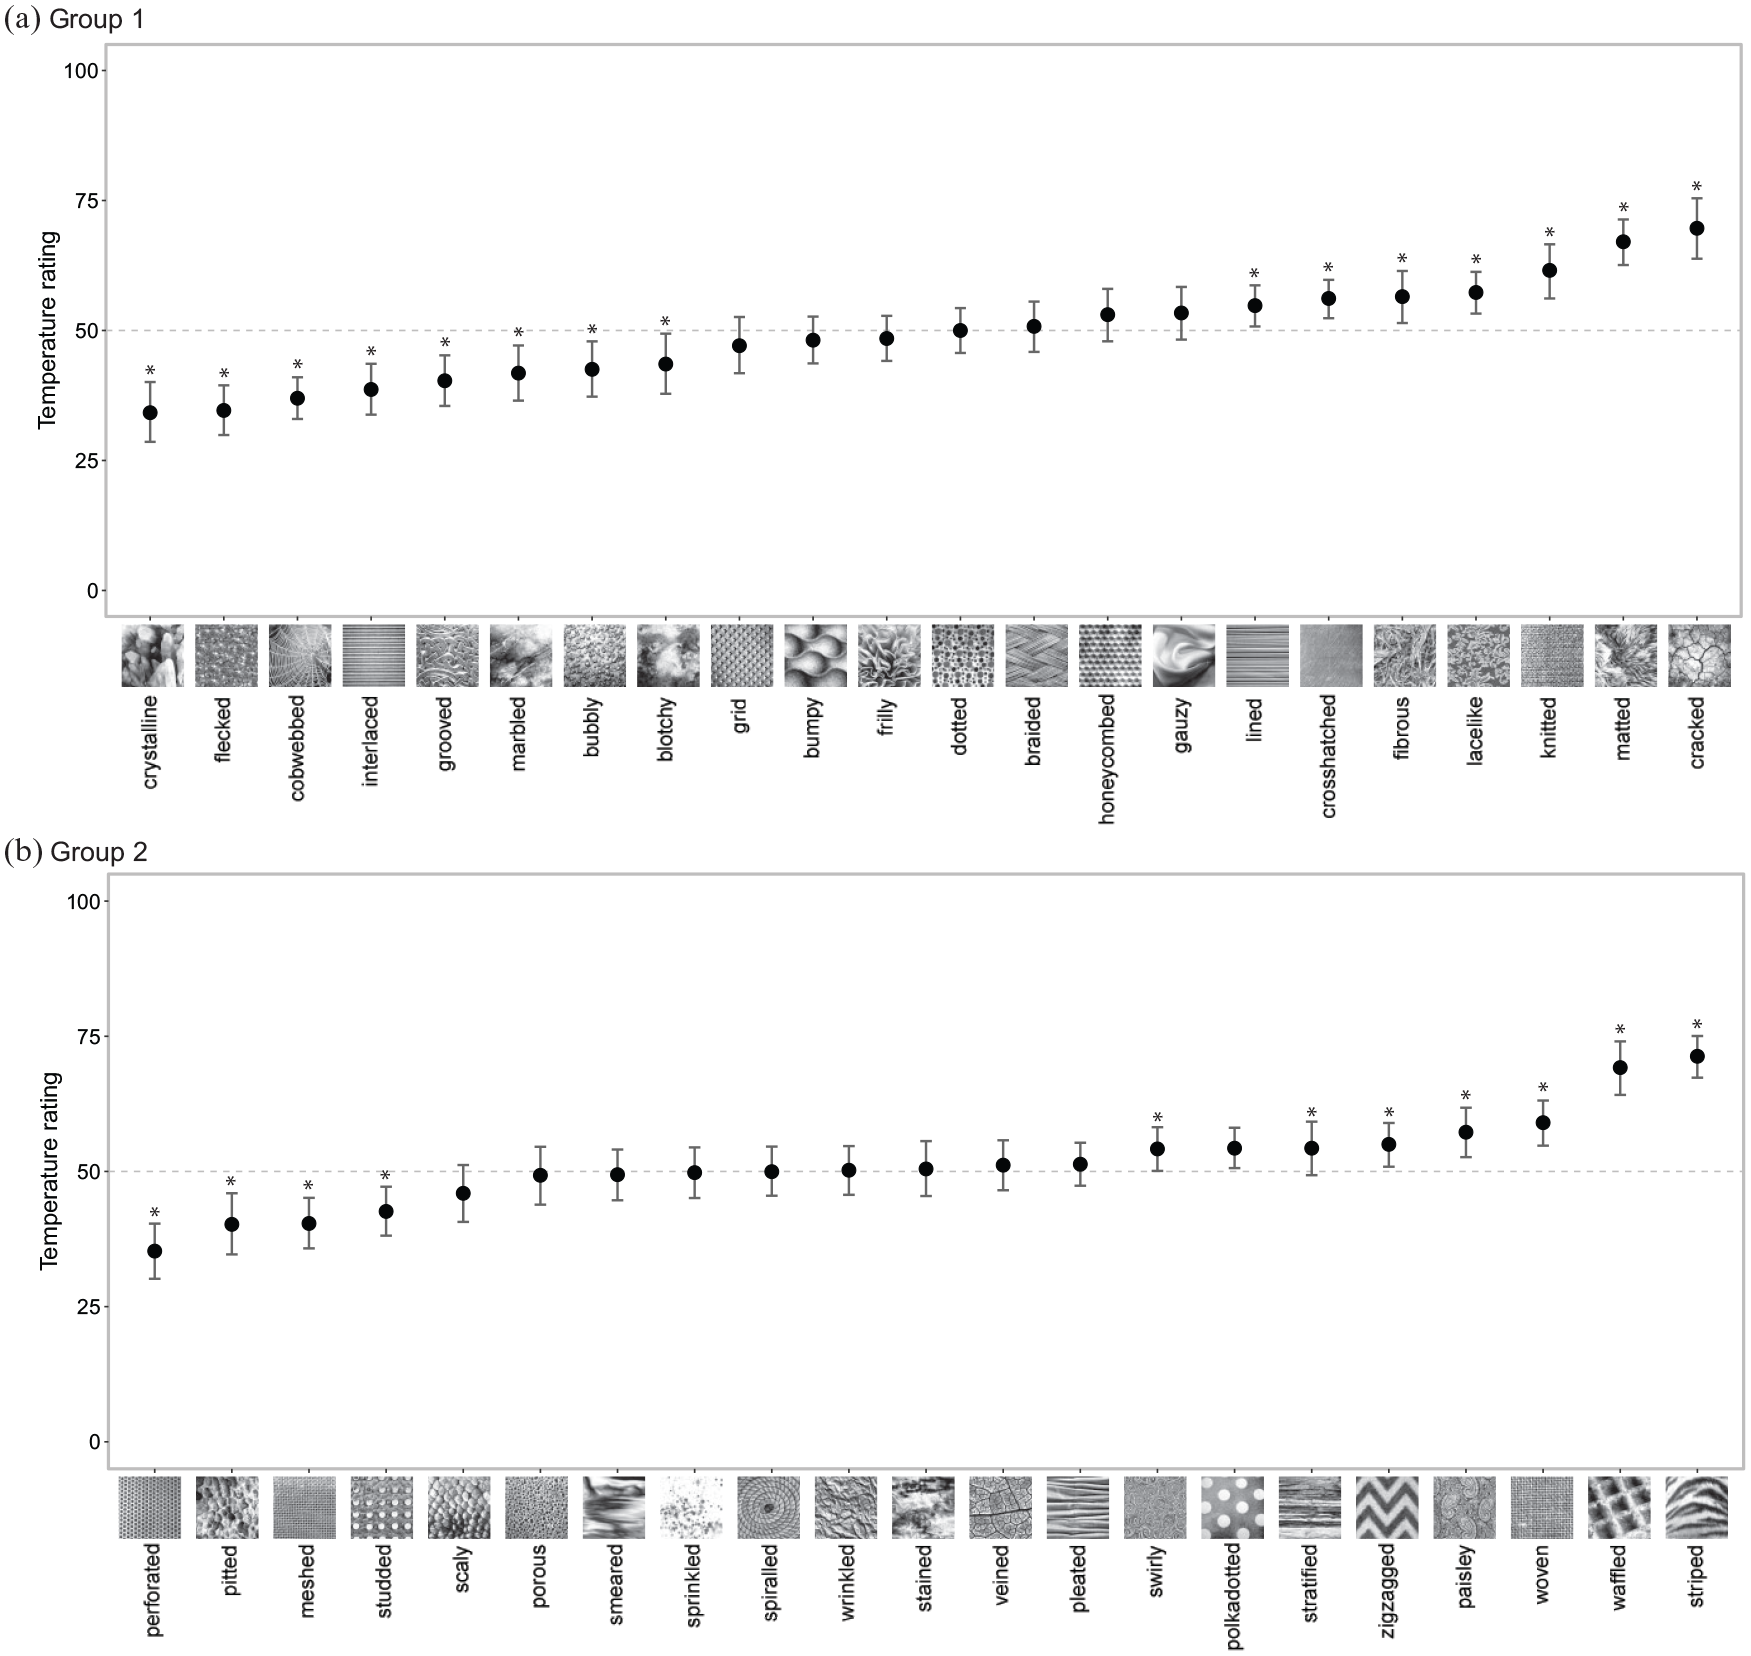
Mean temperature ratings of all visual texture categories in Experiment 1.
Means, standard deviations, and RTEs of temperature ratings of the visual texture categories in Experiment 1.
RTE: relative treatment effects.
The mean values are based on a 100-point visual analogue scale (VAS) from 0 (cold) to 100 (hot). The visual textures are sorted in descending order as per their mean values within each group. An asterisk (*) denotes ratings significantly different from the midpoint of the scale as per Bonferroni-corrected Wilcoxon Rank Sum tests. The RTEs indicate the tendency of participants to have a higher (or lower) temperature association rating for a given visual texture compared with the pool of all participants’ ratings for the other visual textures. RTEs range from 0 to 1, and larger differences between RTEs indicate larger differences in ratings.
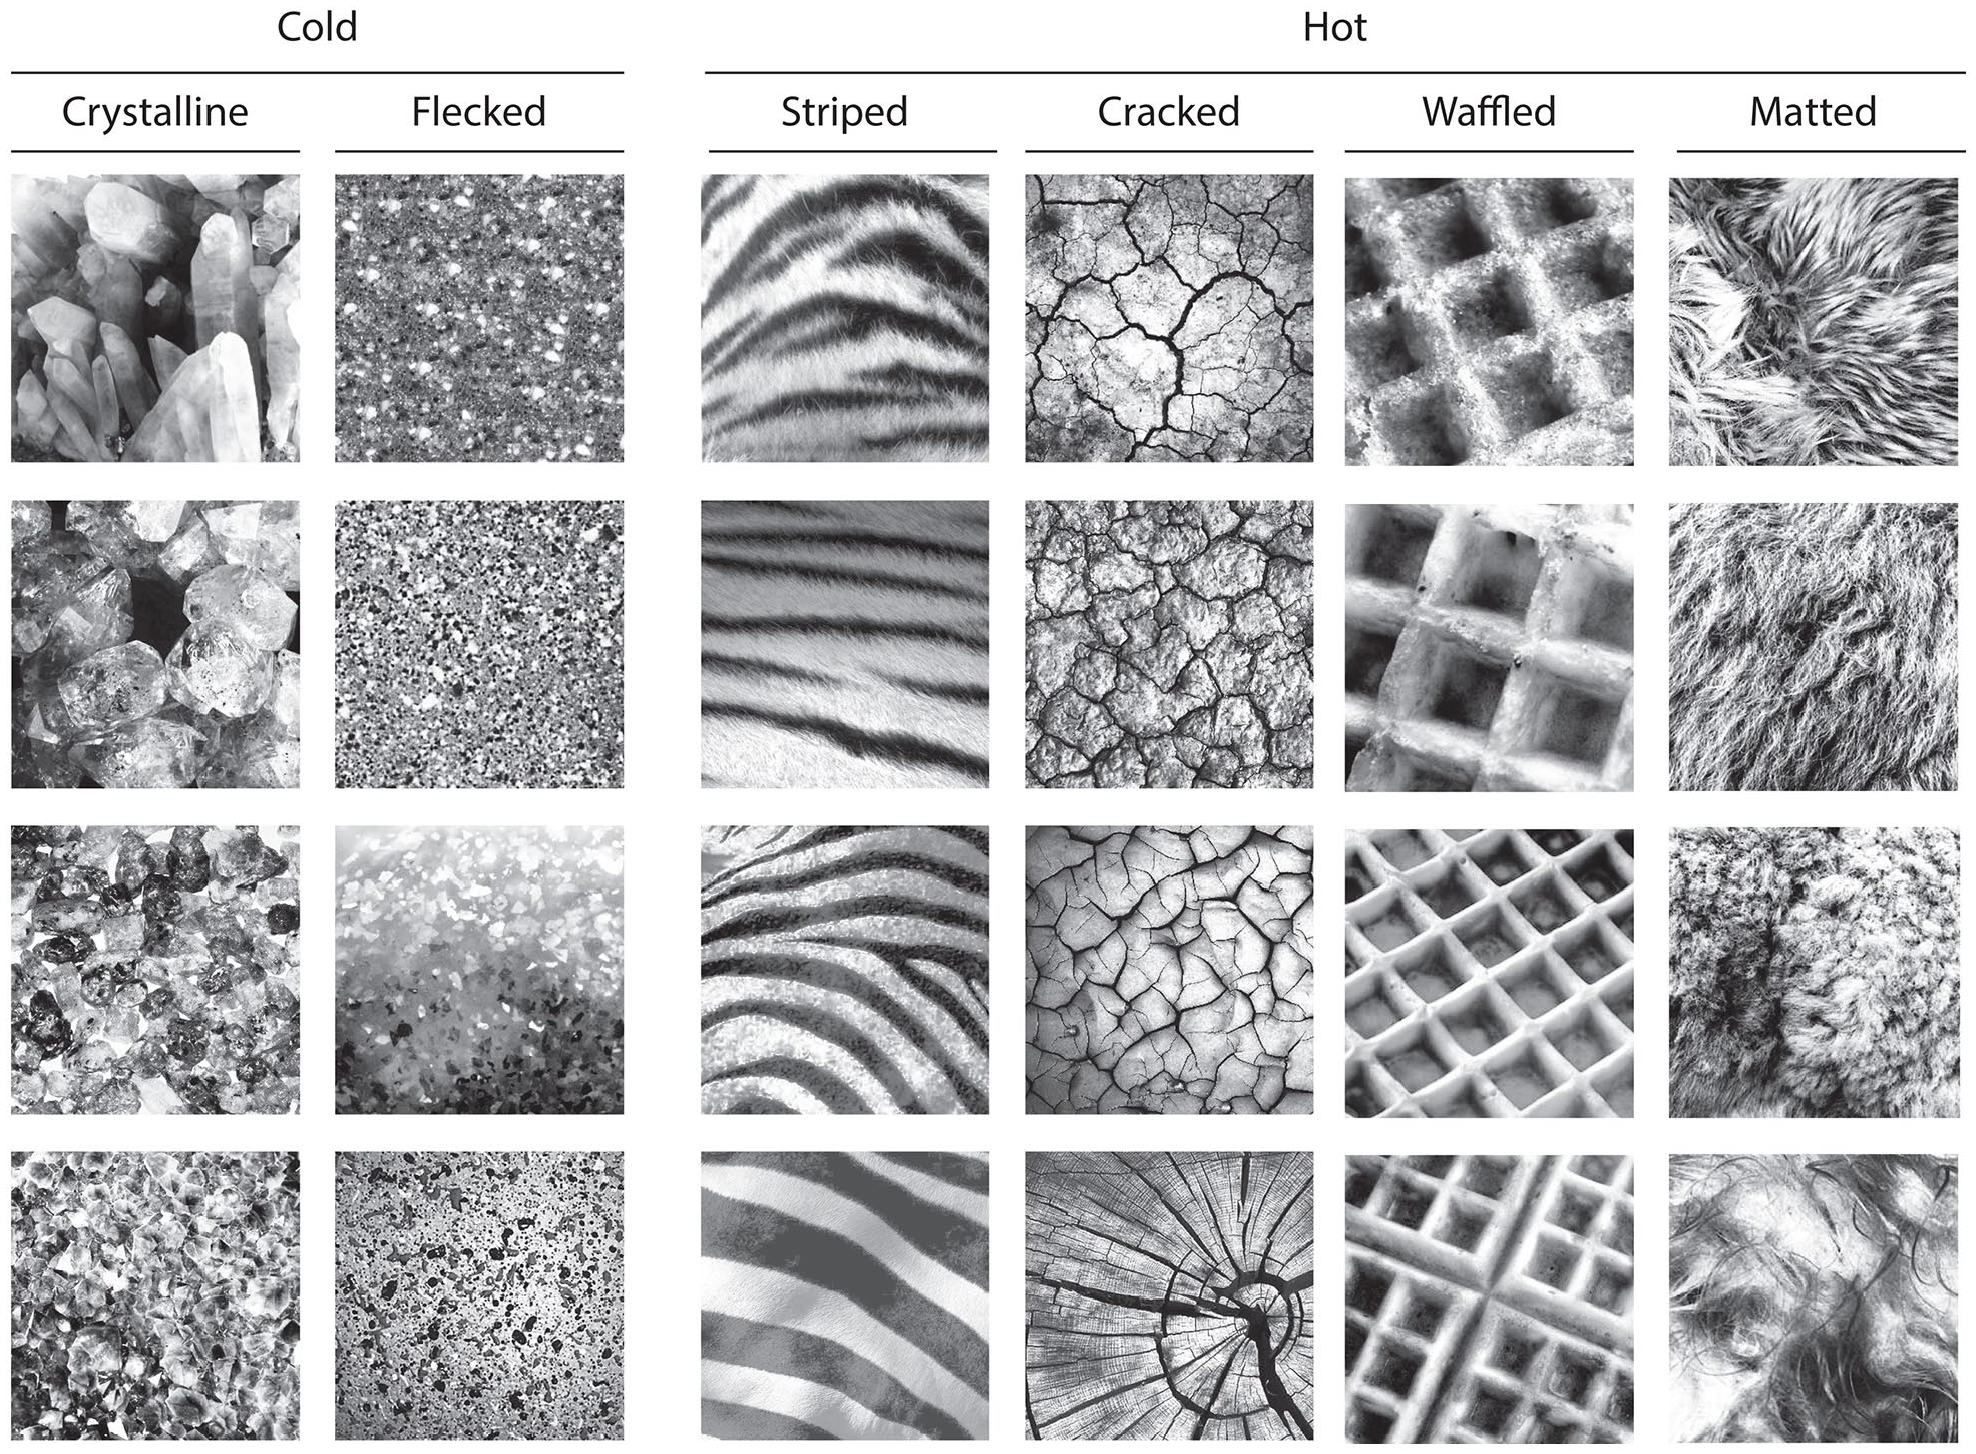
Examples of visual textures rated as hot and cold in Experiment 1.
The word frequency analysis of the visual textures with the coldest and hottest temperature ratings revealed that the participants indeed used various terms related to temperature concepts to describe the visual textures (Table 2). Regarding the crystalline visual texture, a total of 73 terms were mentioned, and it was mostly described with the word crystals, followed by ice, stones, and rocks. This visual texture was described with various words related to low temperatures, namely, ice (n = 12), freeze (n = 4), cold (n = 2). Terms related to high temperatures were mentioned only twice, fire (n = 1) and heat (n = 1). A total of 103 terms were used to describe the flecked visual texture, and it was mostly described as rough and hard, followed by smooth, ice, cold, and rocks. Various terms related to low temperatures were used to describe this texture, namely ice (n = 7), cold (n = 6), freeze (n = 1), and chilly (n = 1). A total of 52 terms were used to describe the striped visual texture, and the most common ones were furry, soft, and striped, followed by terms related to animals (e.g., zebra, tiger, animal, cat). The participants stated terms related to high temperatures, namely warm (n = 5) and heat (n = 1), and there was no mention of terms related to low temperatures. The cracked visual texture was mostly described as cracked and dry, and a total of 62 terms were mentioned. Three words related to high temperatures were mentioned, hot (n = 1), warm (n = 1), fire (n = 1). In addition, the word desert was mentioned eight times. There were no mentions of terms related to cold temperatures.
Keyword frequencies of the two hottest and coldest visual textures in Experiment 1.
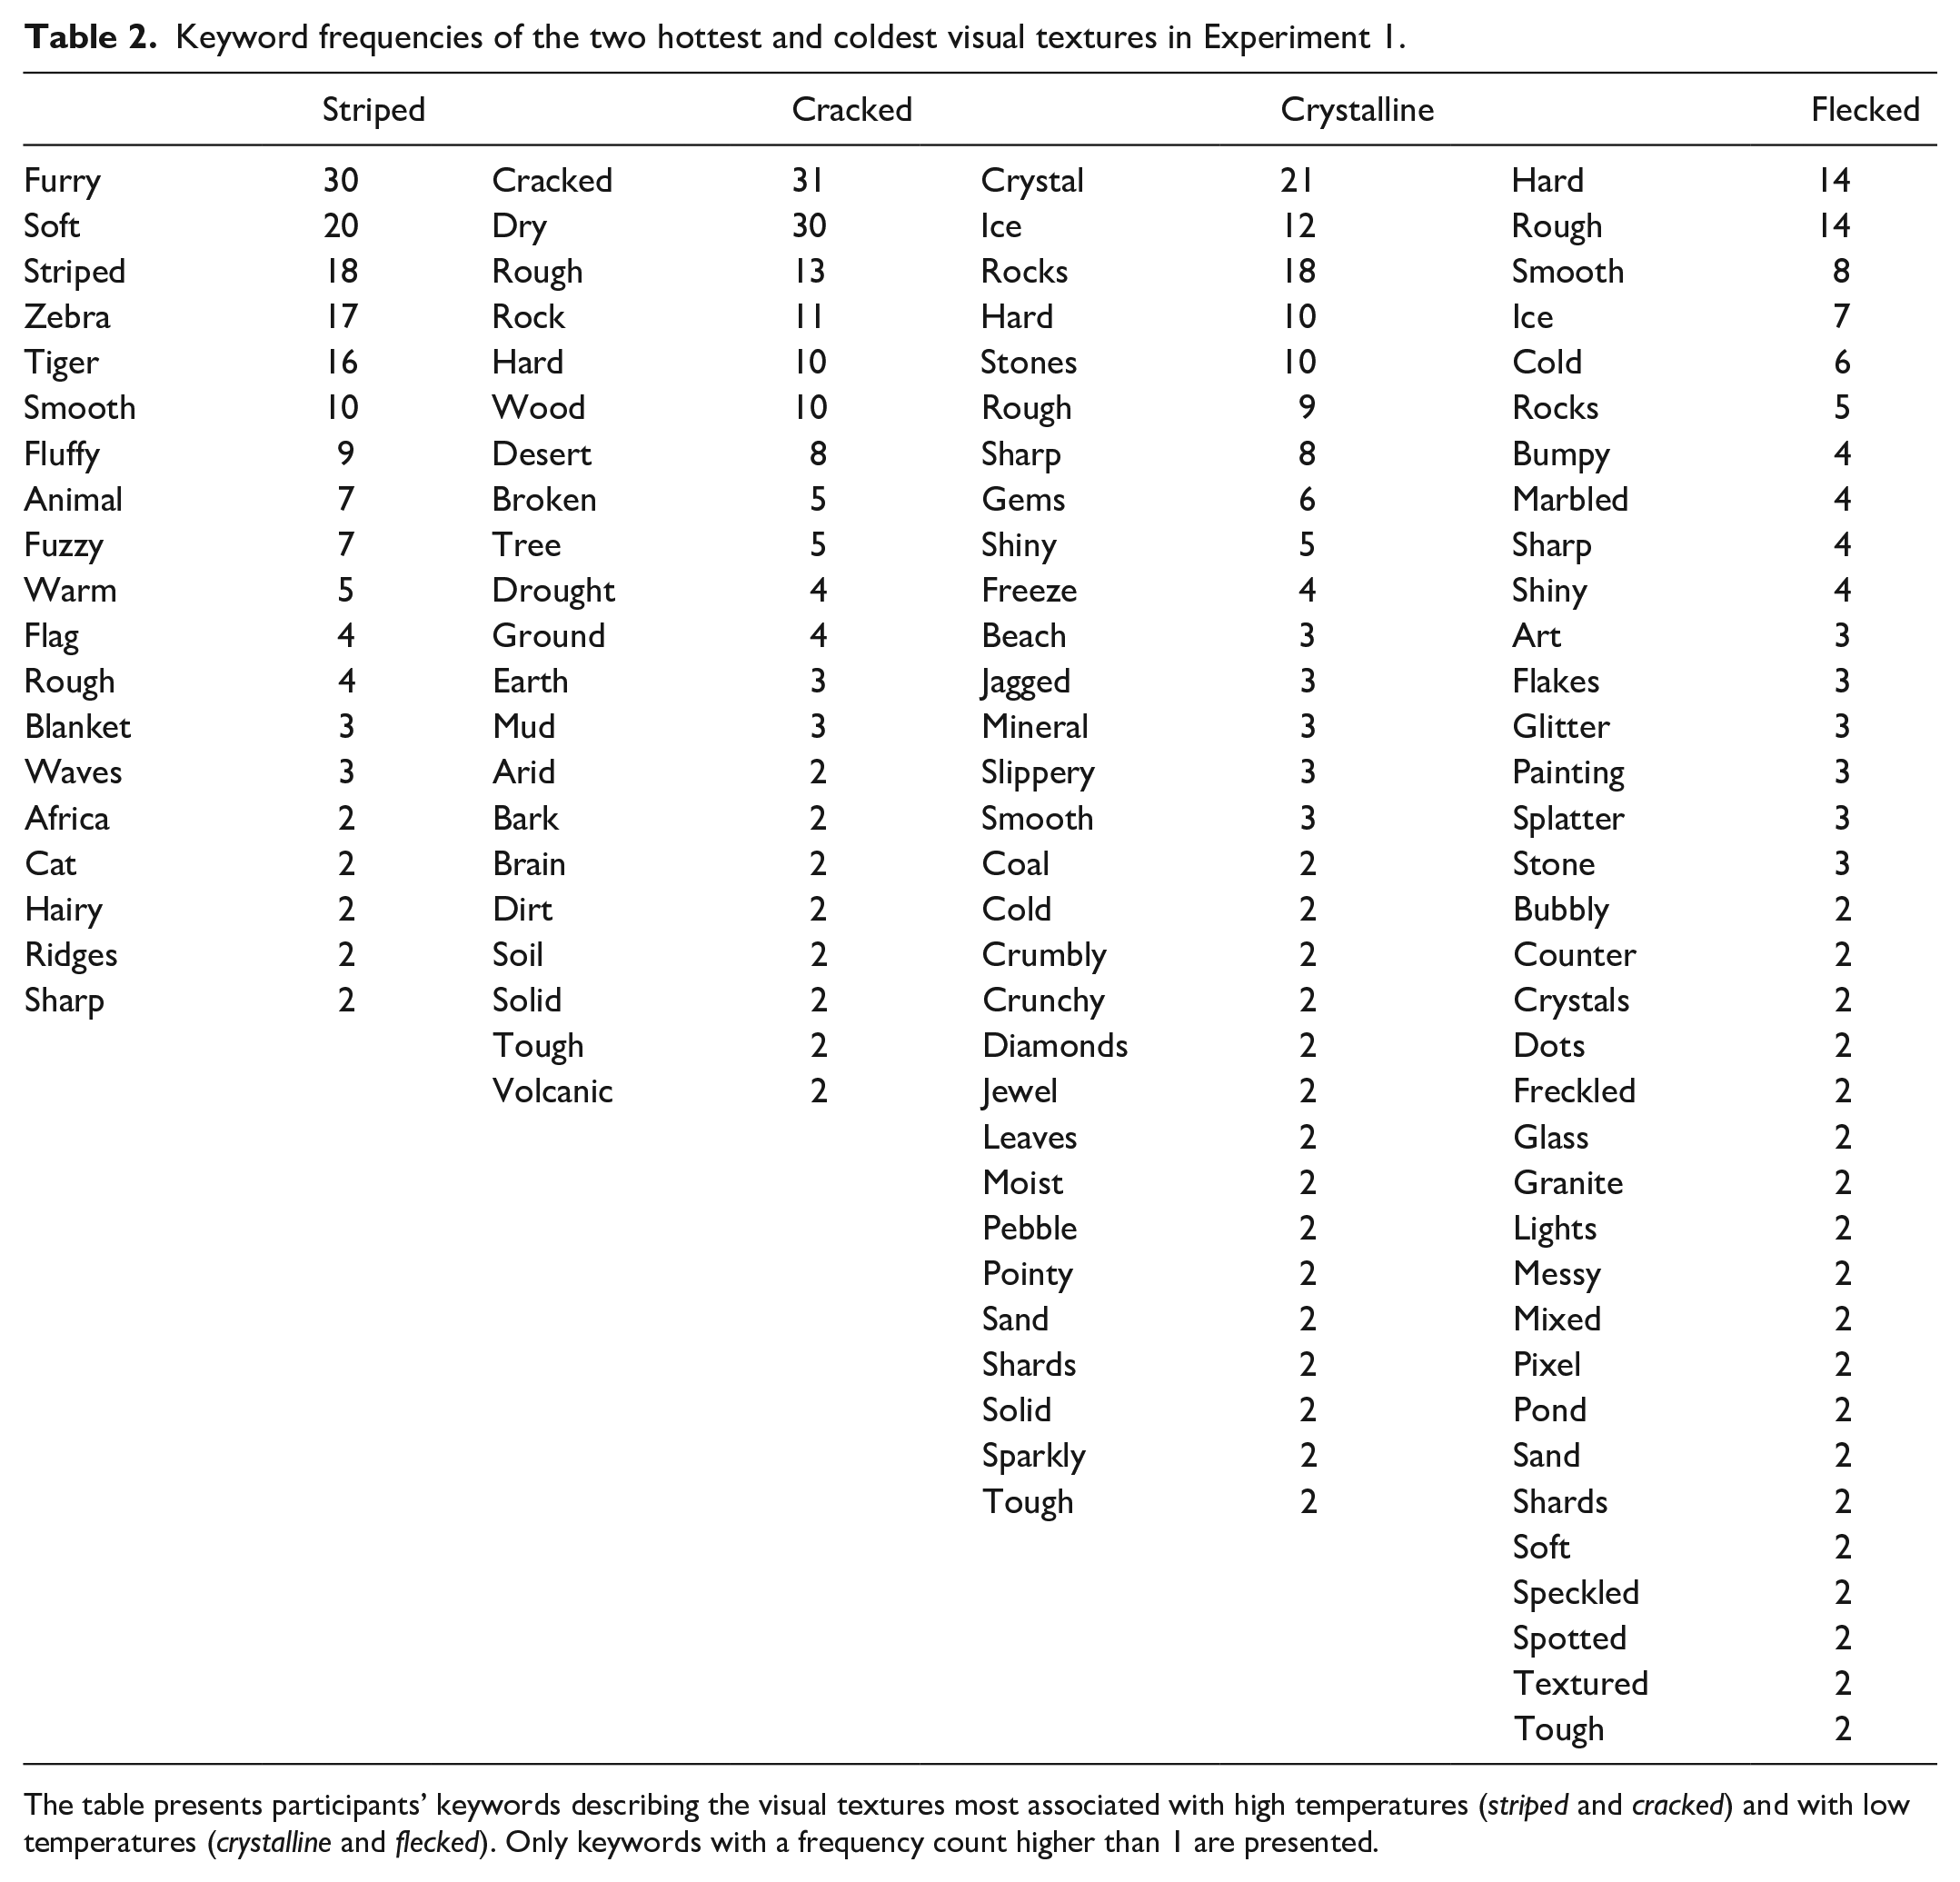
The table presents participants’ keywords describing the visual textures most associated with high temperatures (striped and cracked) and with low temperatures (crystalline and flecked). Only keywords with a frequency count higher than 1 are presented.
The HCA revealed that there were three broad clusters of visual texture categories based on their temperature ratings (Figure 4). The first cluster (C1) included the crystalline and flecked visual textures, as well as other visual textures with relatively low temperature ratings. The second cluster (C2) included visual textures with values close to the midpoint of the scale. The third cluster (C3) included the four visual textures with the highest temperature ratings. Consistent with previous analyses, the cluster analysis showed clearer associations in the high-temperature range compared with the low one, as evidenced by the narrower high-temperature cluster. The LMM revealed a significant effect of clusters on temperature, liking, and hardness (Table 3). The temperature ratings between the three clusters were significantly different from each other. In terms of liking, the cluster with the lower temperature visual textures (C1) was liked less than the other two clusters. Finally, the visual textures in the cluster C1 were perceived as harder than those in cluster C2.
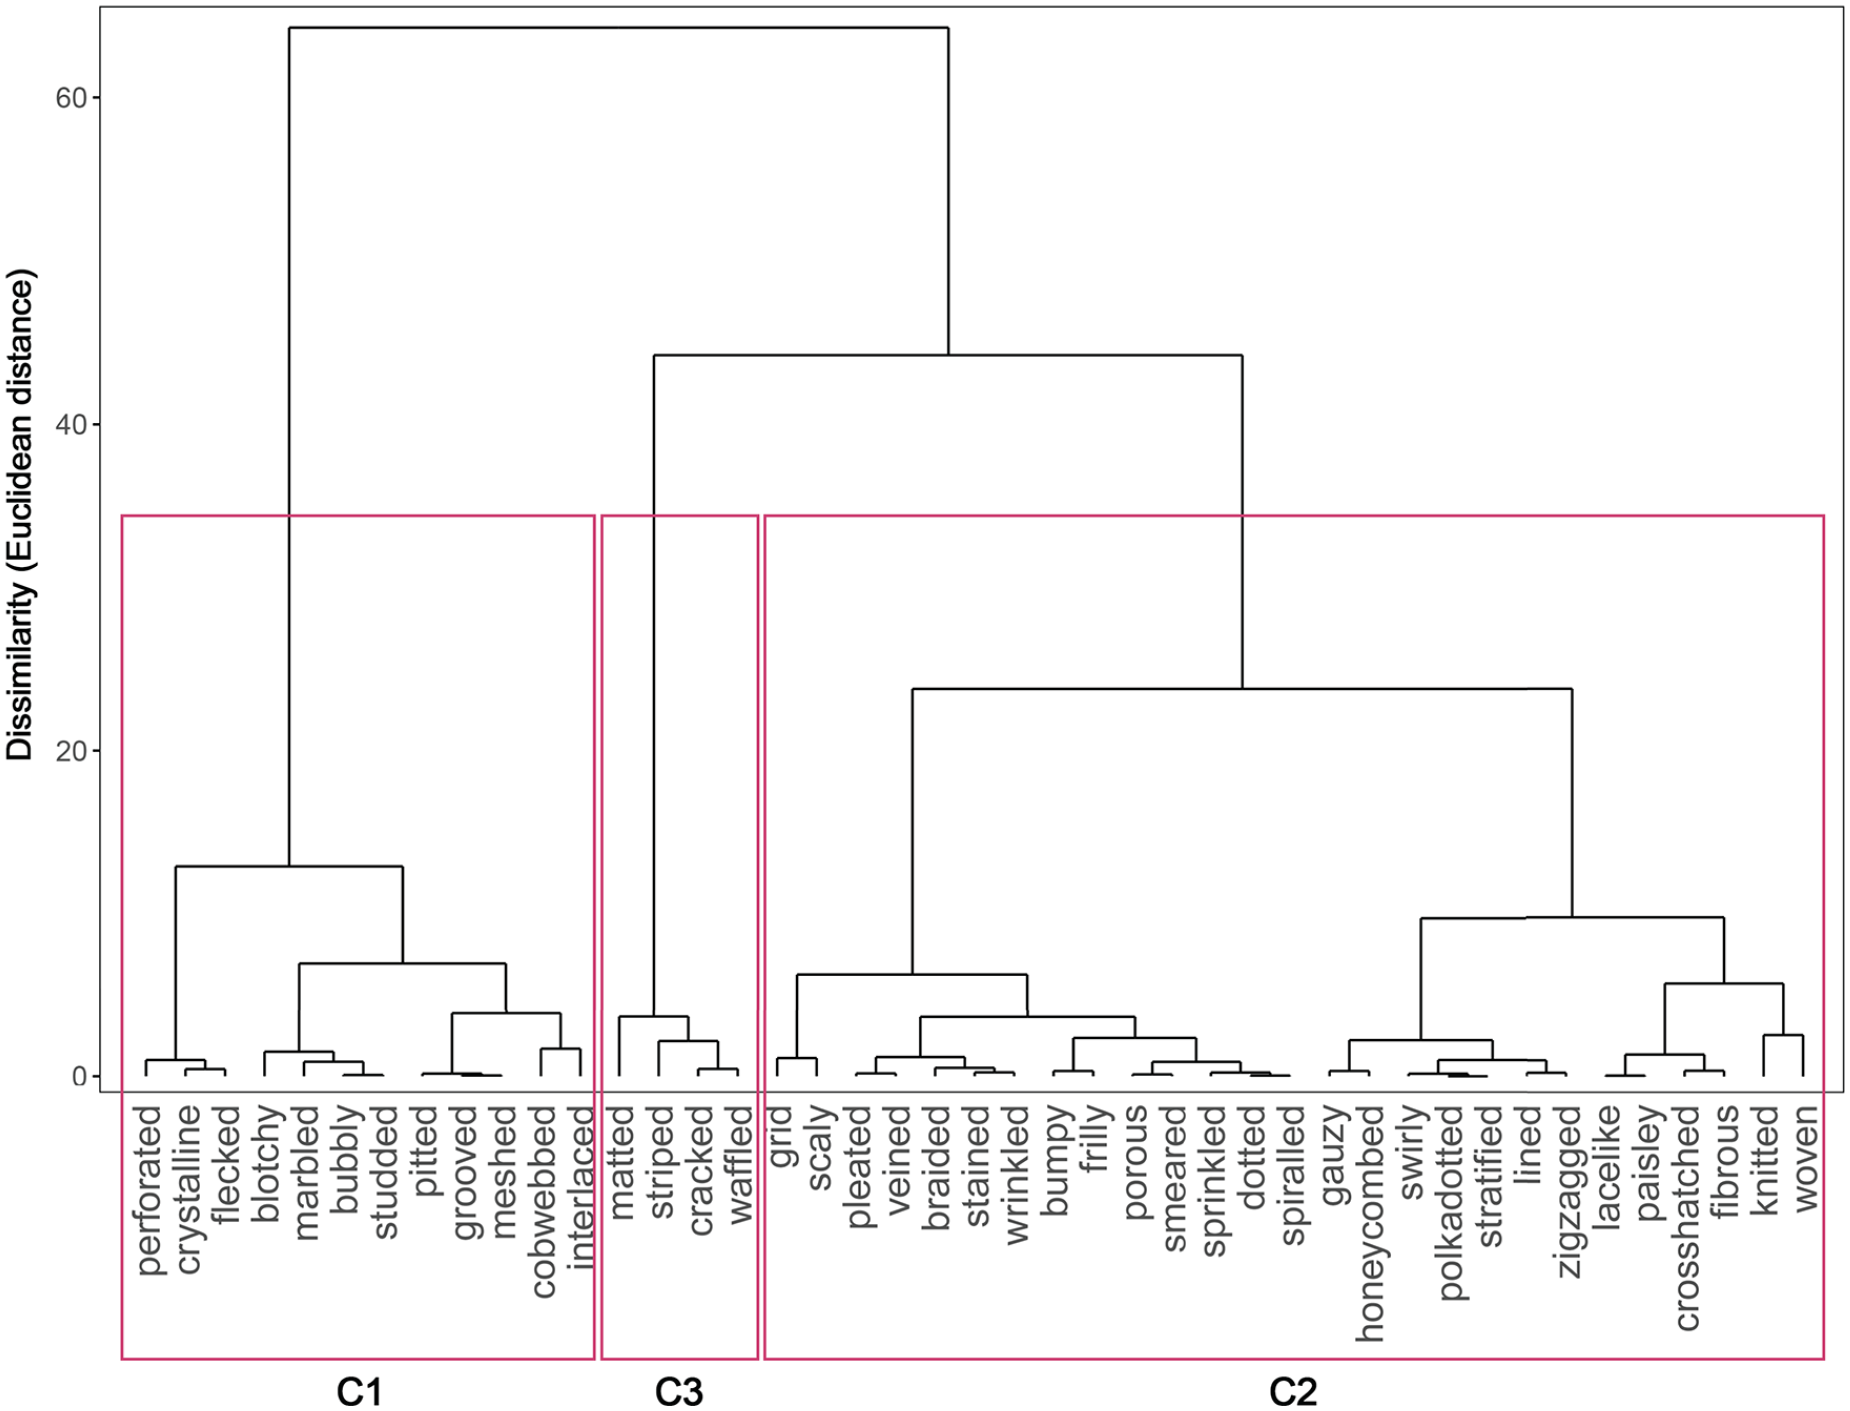
Hierarchical cluster analysis (HCA) in Experiment 1.
LMM, LRT, and post hoc tests results in Experiment 1.
LMM: linear mixed model; LRT: likelihood ratio test.
The LMMs were conducted on each of the key variables with cluster as fixed factor and visual texture category and subject ID as random factors. The LRTs were performed on the full LMMs versus a null model with only the visual texture category and subject ID random factors. Mean values of the three clusters (C1, C2, and C3) sharing the same superscript letters are not statistically significant at p < .05 as per the Bonferroni corrected post hoc analyses.
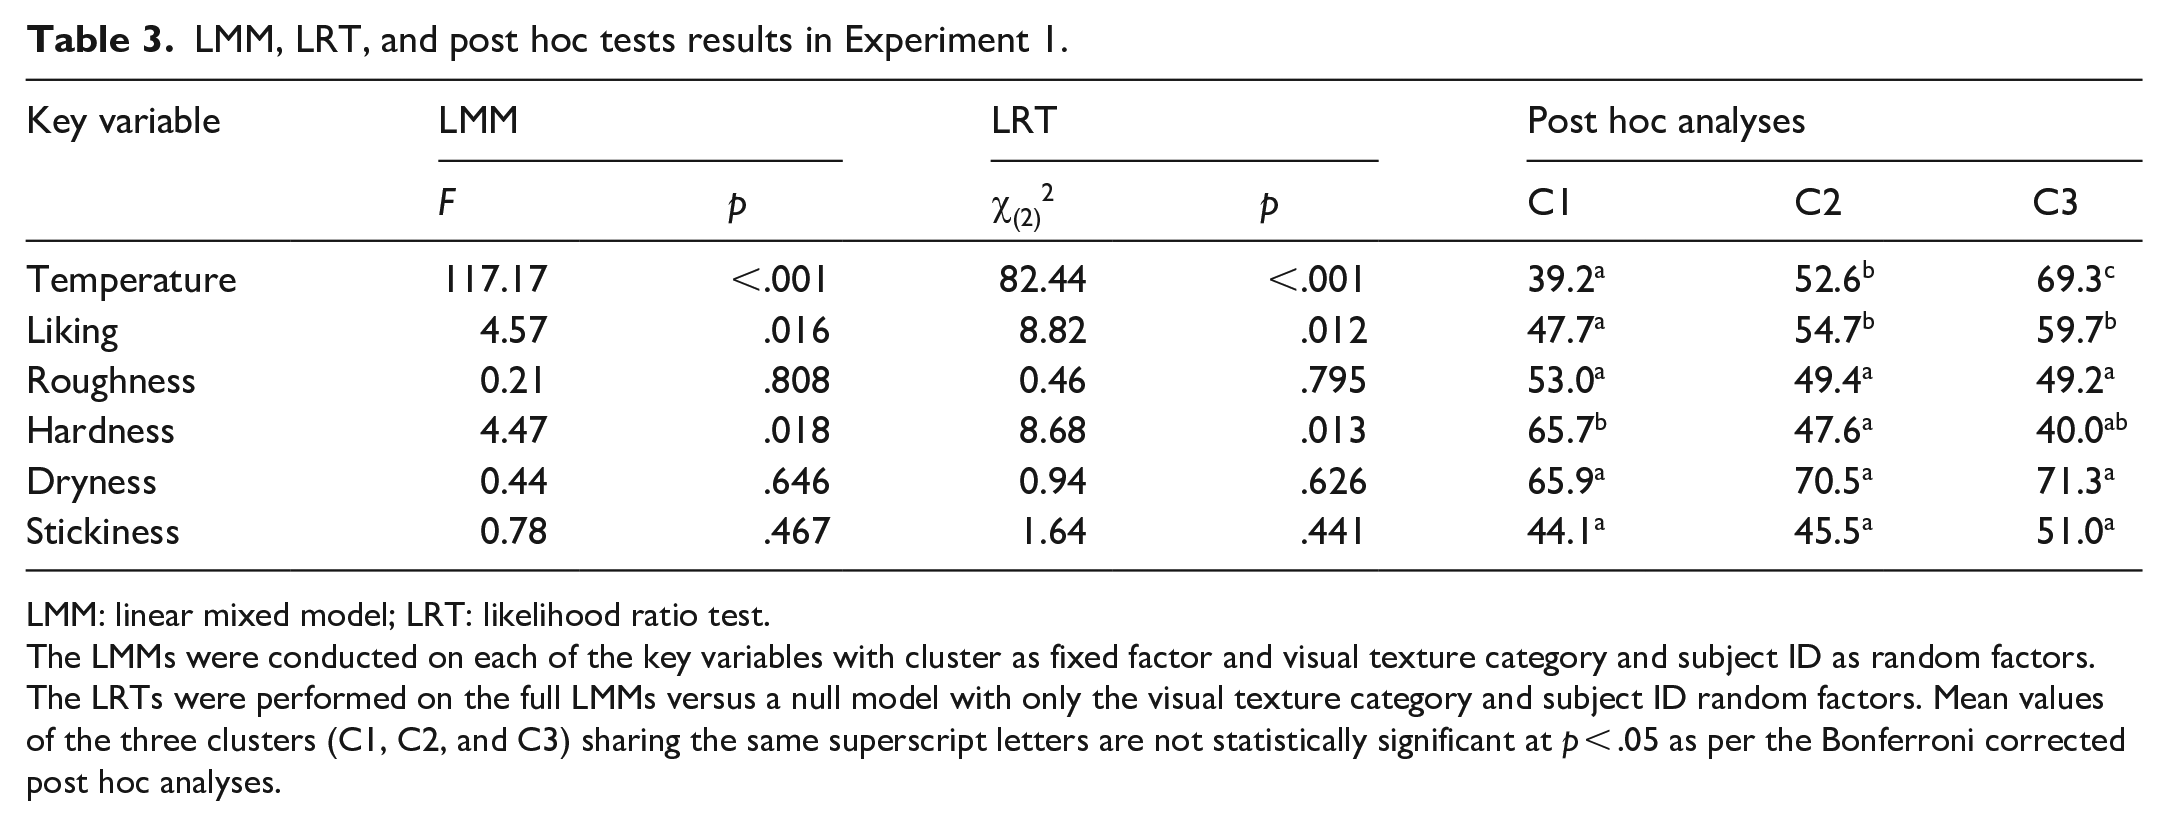
The correlation analysis between temperature, liking, and material properties, including only the two visual textures evaluated as the hottest (striped and cracked) and the two evaluated the coldest (crystalline and flecked) did not reveal large correlations (Figure 5). The highest correlation between temperature and any of the material properties was with hardness (z = -6.59, p < .001). In the case of a specific visual texture, the highest correlation between temperature and any material property was with hardness for the flecked visual texture (z = −4.93, p < .001). A similar pattern was observed between temperature and hardness in the striped visual texture (z = −3.35, p < .001). These results seem to suggest that softer visual textures were considered to be warmer.
Correlation matrix, density plots, and regression lines of temperature ratings, material properties perception, and liking with the two hottest and coldest visual texture categories in Experiment 1.
In sum, the results of Experiment 1 revealed that different visual textures were associated with hot and cold temperature concepts. The associations with hot temperatures concepts compared with cold ones were stronger as evidenced by the larger distances from the midpoint of the former. Supporting H2, the striped and matted visual textures—both related to furry tactile textures—were associated with high-temperature concepts, which seemed to be due to associations with formerly living things or the use of objects with these textures. As the text analysis revealed, the striped visual texture was associated with animals, fur, and warmth, likely because of the warmth of the animals, or the warmth provided by furry garments. As for the cracked visual texture, it was likely associated with deserts and hence hot temperatures. The waffled visual texture may have been associated with the (warm) food item. On the other side of the temperature scale, the participants associated the crystalline and flecked visual textures with low temperatures. The crystalline visual texture seemed to be associated with ice—and also with stones, as revealed by the text analysis. The flecked visual texture also seemed to be associated with stones and ice, partially supporting H1. Nevertheless, the flecked visual textures had the largest number of different descriptors suggesting a high degree of ambiguity. It is possible that the participants did not have clear associations with specific materials or objects. The analysis also revealed that visual textures perceived as cooler tended to be liked less. In addition, there seems to be a negative correlation between hardness and temperature, so that visual textures perceived as harder are also perceived as colder.
Experiment 2
To obtain a more holistic perspective on the crossmodal associations between visual textures and temperature concepts, in Experiment 2, we built on the findings of the first experiment and aimed to test whether the associations uncovered using an explicit test could also be found in a speeded task, to evaluate the automaticity of the associations. To this end, we conducted multiple IATs using the visual textures most strongly associated with both the low- and high-temperature concepts, based on Experiment 1, and the temperature words cold and hot. The evaluation of the present associations with a measure of RT and automatic judgement is highly relevant, as it can help elucidate different paths through which these associations may be formed and the level of strategizing required, as well as indirect mappings to specific materials. Hence, this experiment represents a starting point for further investigation of automaticity on crossmodal associations between visual textures and temperature concepts.
Method
Participants
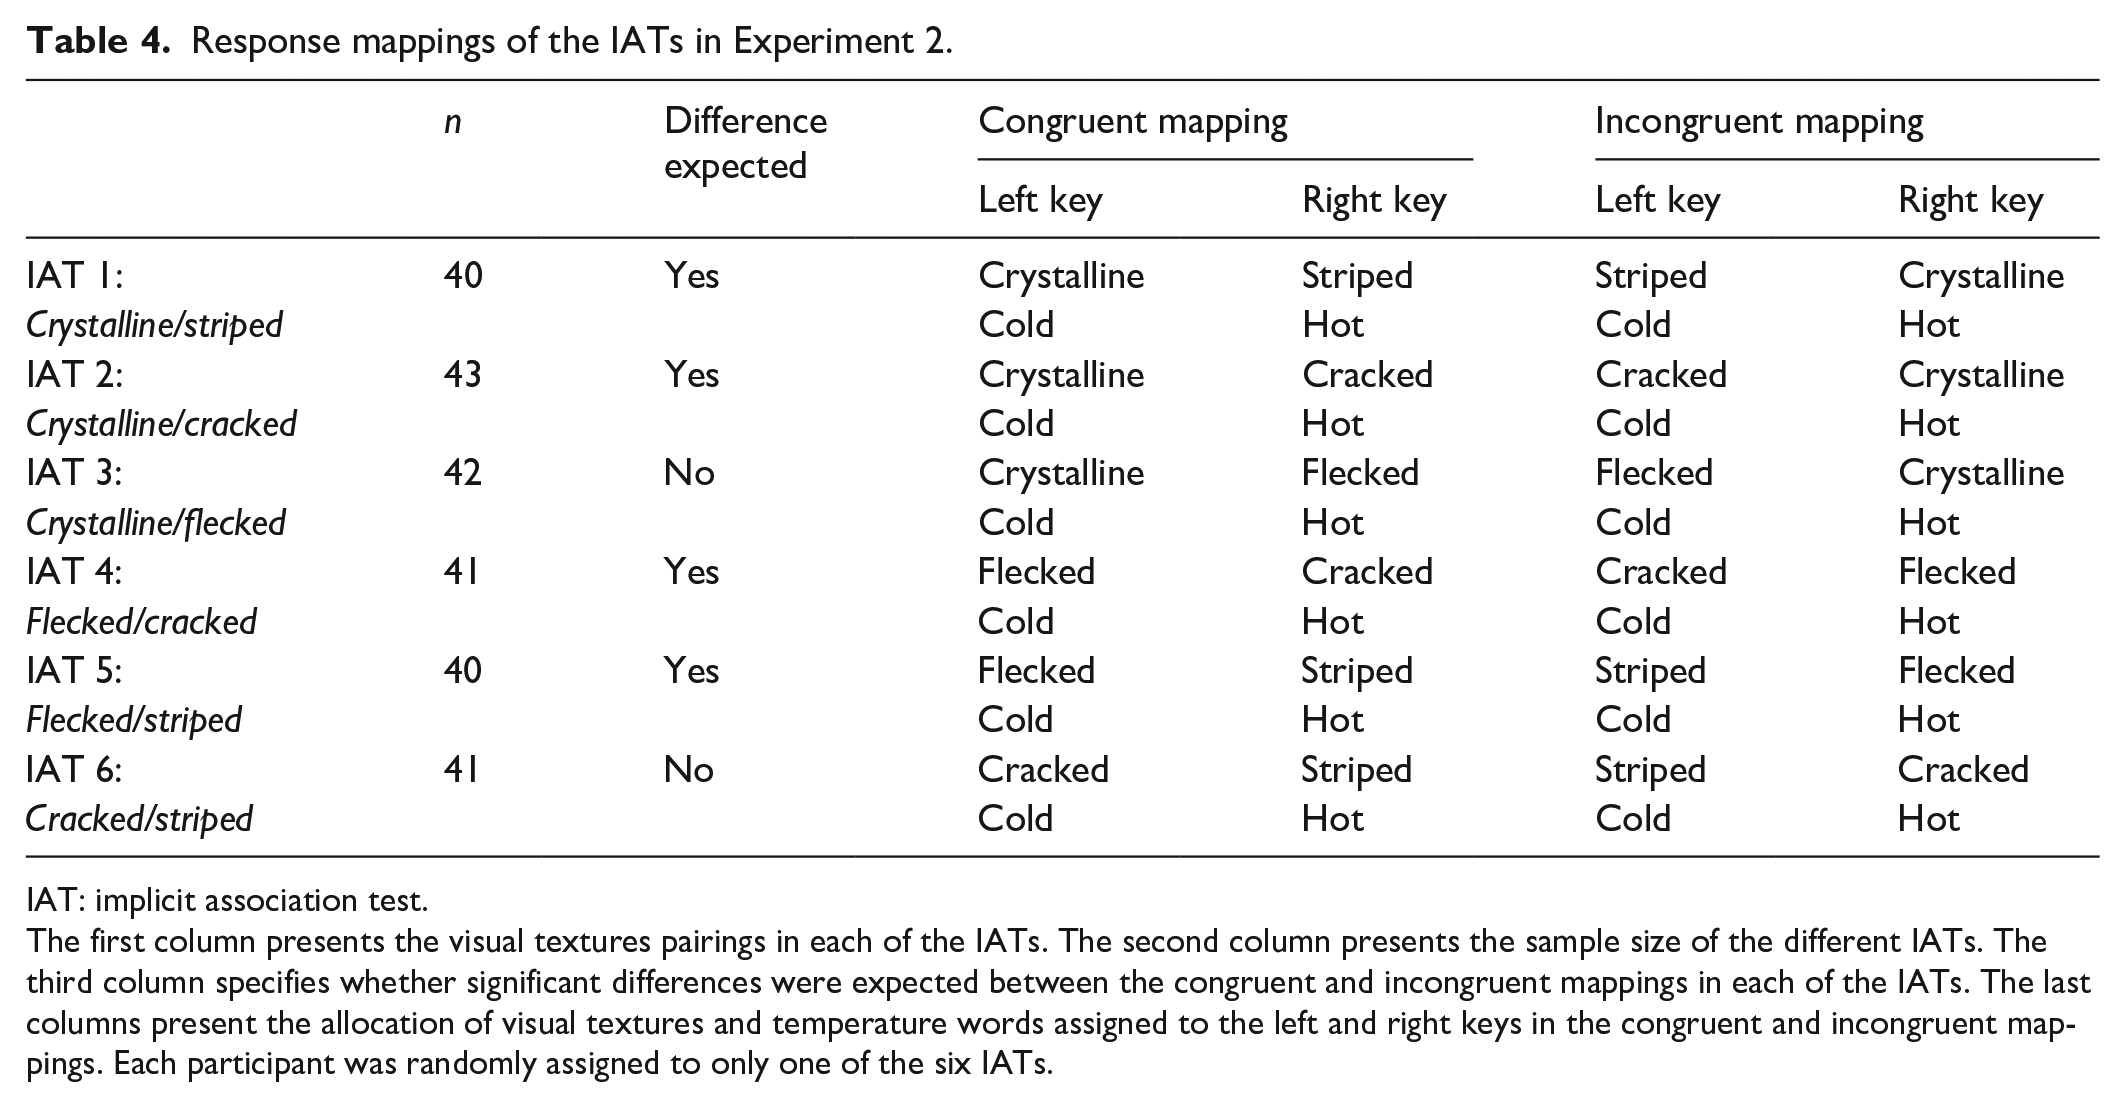
To determine the required number of participants for each IAT, we conducted a power analysis based on a one-sample t-test calculation for the D scores. We aimed to have a sample size of at least 35 participants per IAT to achieve a statistical power of .8 using an effect size of Cohen’s d = 0.5 with an alpha level of .05. The effect size was determined based on previous IATs with similar magnitudes (e.g., Barbosa Escobar et al., 2021; Parise & Spence, 2012; Piqueras-Fiszman & Spence, 2011). A total of 247 native English speakers from the United Kingdom (160 females, 84 males, 3 unreported), aged 18–88 years (Mage = 35.66 years, SDage = 14.31) took part in the experiment. The experiment was programmed on Gorilla (https://gorilla.sc/), and participants were recruited from Prolific (https://www.prolific.co/). At the beginning of the experiment, each participant was randomly assigned to one of six IAT versions resulting from all the possible combinations of four visual textures selected based on the findings in Experiment 1. Table 4 presents the combinations of visual textures for each of the six IATs and their sample size, as well as their congruent and incongruent mappings and expected results. The experiment lasted approximately 7 min.
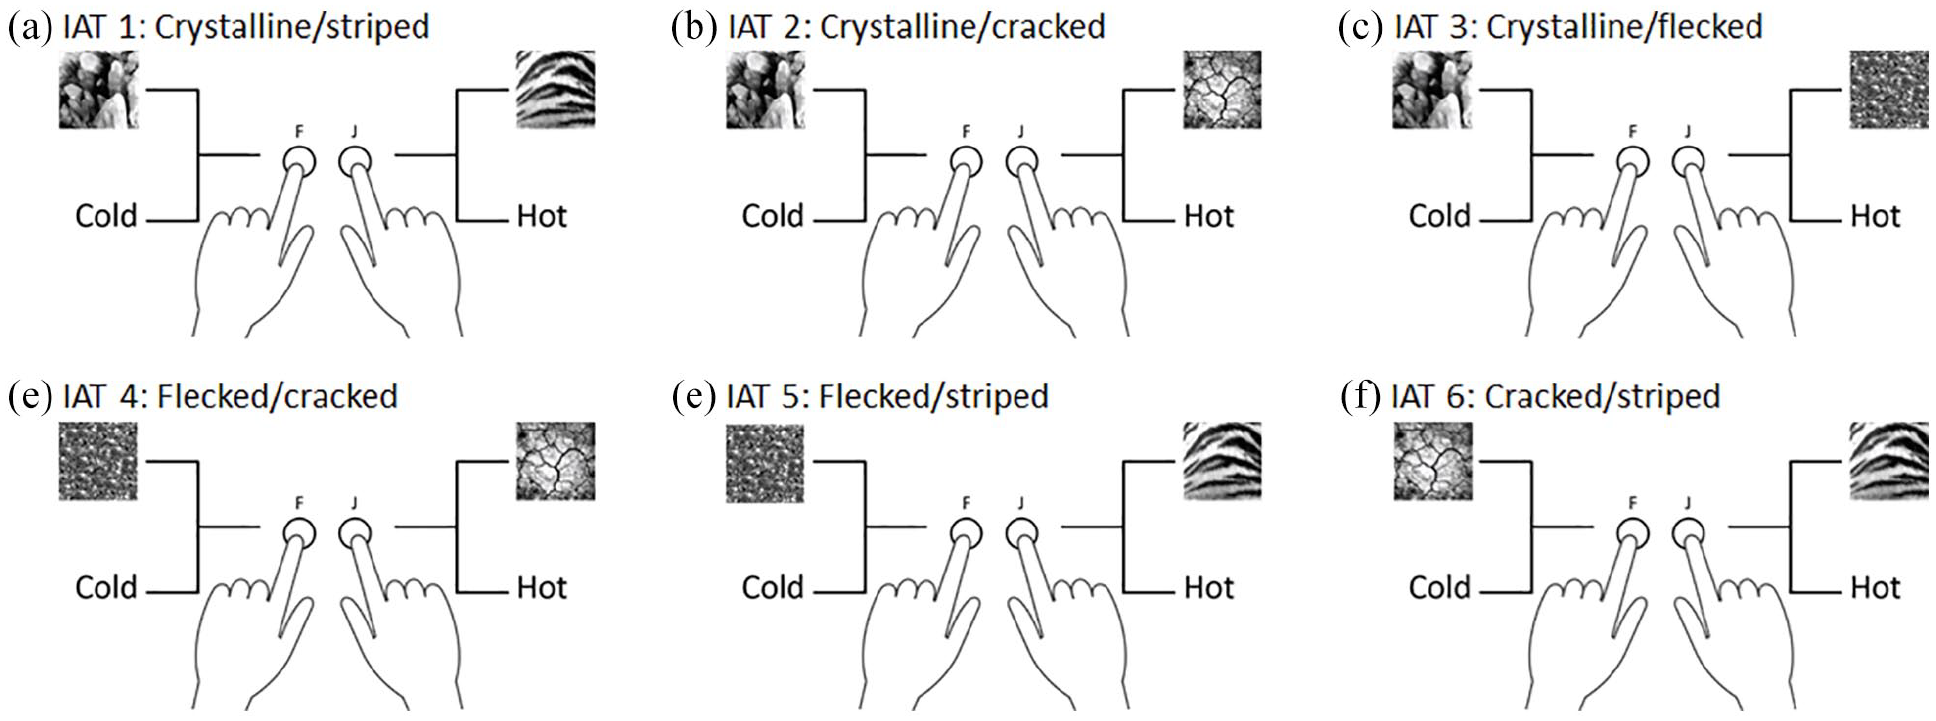
Response mappings of the IATs in Experiment 2.
IAT: implicit association test.
The first column presents the visual textures pairings in each of the IATs. The second column presents the sample size of the different IATs. The third column specifies whether significant differences were expected between the congruent and incongruent mappings in each of the IATs. The last columns present the allocation of visual textures and temperature words assigned to the left and right keys in the congruent and incongruent mappings. Each participant was randomly assigned to only one of the six IATs.
Apparatus and materials
The stimuli consisted of four visual textures and two temperature words (cold and hot). The selection of the visual textures was guided by the results of Experiment 1. We selected the two visual texture categories rated the coldest (crystalline followed by flecked) and the two rated the hottest (striped followed by cracked) as per their mean values in Experiment 1. For the specific stimuli, we selected the images with the lowest (cold) and highest (hot) mean values within each visual texture category. This resulted in six possible combinations comprising the cold versus hot, cold versus cold, and hot versus hot visual textures (Table 3). Contrary to most traditional IATs that pair stimuli with different attributes, we decided to include the combinations with qualitatively similar temperature concepts (cold vs. cold and hot vs. hot), as we aimed to probe the robustness of the associations and test for potential relative compatibility effects with these visual textures.
Design and procedure
The experiment followed a similar design to the one used in Crisinel and Spence (2010). The IAT was programmed and conducted in Gorilla, and the participants completed the experiment online using a desktop or laptop. Gorilla has been proven to be a top performing and accurate platform for online experiments (Anwyl-Irvine et al., 2020; Bridges et al., 2020). Bridges et al. (2020) conducted a large study where they investigated the accuracy and precision of visual and auditory stimulus timing and RTs of several experiment platforms. The authors found that Gorilla presented under 6 ms inter-trial variability in all browsers evaluated (i.e., Firefox, Chrome, Safari, Edge) and sub-millisecond variability in the operating systems Windows and Ubuntu. The experiment comprised seven blocks in which participants were tasked to match either a visual texture or a temperature word based on a specific mapping by pressing one of two keys (i.e., left key “F” and right key “J”). The first two blocks consisted of the single task practice trials in which participants matched a visual texture (first block) and a temperature word (second block). The third and fourth blocks consisted of the combined task experimental trials in which participants matched either a visual texture or a temperature word according to the given mapping. The fifth block consisted of the reversed visual texture single task practice trials. The sixth and seventh blocks consisted of the reversed combined task experimental trials.
The mappings were designed based on the findings of Experiment 1. In the congruent blocks, the cold visual texture (crystalline or flecked) and the word cold were mapped to the same key. In the same way, the hot visual texture (striped or cracked) and the word hot were mapped to the same key in the congruent blocks. In the case of the combinations with visual textures with similar temperature magnitudes, the match was based on the mean values of each visual texture from Experiment 1. For instance, in the cold versus cold combination, the crystalline visual texture was matched to the word cold, and the flecked visual texture was matched to the word hot in the congruent condition as crystalline was rated as being (slightly) colder than flecked in Experiment 1. Similarly, in the hot versus hot combination, striped was matched to the word hot and cracked to the word cold in the congruent condition (see Figure 6). Whether each participant first experienced either the congruent trials (Blocks 3 and 4), or the incongruent ones (Blocks 6 and 7) was randomised. In addition, the response keys assigned to the temperature words were counterbalanced (i.e., left key assigned to the word cold or to the word hot). Following Greenwald et al.’s (2003) improved procedure, all the combined task trials were used in the analysis.
Examples of the mappings shown in the IATs in Experiment 2.
At the beginning, the participants provided their informed written consent and were given general directions. They were instructed to maintain their fixation on the centre of the screen and to match the stimulus presented as quickly and accurately as possible, following a specific mapping, by pressing either the “F” (left) or the “J” (right) key. The mappings were shown to participants before each block of trials. Moreover, during the trials, the stimuli assigned to each key remained on the upper left- and right-hand sides of the screen, respectively. Each trial started with a fixation cross at the centre of the screen for a randomised interval of 500–600 ms. Later, an interstimulus interval of 300–400 ms was presented. Next, the target stimulus (either a visual texture or a temperature word) was presented, and it remained visible until the correct key was pressed. If the incorrect key was pressed, a red “X” was shown in the centre of the screen, and participants needed to press the correct key to continue.
In the single task practice trials (for the visual textures and temperature words), each stimulus was repeated 3 times. Thus, Blocks 1, 2, and 5 consisted of 6 trials each. In the combined task experimental trials, each stimulus was repeated four times in Block 3, eight times in Block 6, and twelve times in Blocks 4 and 7. Hence, Blocks 3, 4, 6, and 7 consisted of 16, 48, 32, and 48 trials, respectively. Therefore, the participants completed a total of 162 experimental trials. The order of the combined blocks (3, 4, 6, 7) was counterbalanced, as well as the allocation of the response keys.
Data analysis
We analysed three key variables from the IATs, namely RTs, D scores, and ERs. To investigate the effect of congruency on RTs in the independent IATs, we used the unaggregated trial-level data, and we fit a generalised linear mixed model (GLMM) with a gamma distribution, specifying the identity link function. In the GLMM corresponding to each IAT, RT was entered as the dependent variable, congruency (congruent vs. incongruent) as fixed effects, and subject ID and stimulus as random effects. The GLMMs were conducted using the glmer function of the {lme4} R package (Bates et al., 2015). We specified the gamma GLMM with untransformed data given its effectiveness in modelling RT data and clear interpretation as suggested by Lo and Andrews (2015). The gamma distribution closely approximates the RTs, which are positively skewed data bounded by 0. Moreover, the mixed-effects model increased the statistical power by allowing the analysis of trial-level data instead of averaging RTs across participants given its ability to model the multilevel structure of the data. Furthermore, the model makes it possible to model the idiosyncratic differences of participants through the random effects. We considered effects greater than two standard deviations (i.e.,|t| > 2) to be significant at the .05 level as suggested by Lo and Andrews (2015). In addition, we conducted individual LRTs for each IAT, comparing null models—consisting only of the random effects—and the full models—including the fixed and random effects. Post hoc analyses with Bonferroni–Holm corrections were then performed using the glht function of the {multcomp} R package (Hothorn et al., 2008).
In addition, we computed D scores for each IAT, which is a widely used method in the analysis of IATs (Chen et al.,2016, 2015; Crisinel & Spence, 2010; Parise & Spence, 2012). The D scores consisted of the mean of the difference in RTs between the initial congruent and incongruent blocks and between the last congruent and incongruent blocks, each divided by their pooled standard deviation. We analysed the D scores using one sample t-tests, and we followed the improved algorithm by Greenwald et al. (2003). More specifically, in the case of D scores, the RTs of the error trials were replaced by the mean RT of the block plus two standard deviations. Hence, the RTs of the correct trials, along with the modified RTs of the incorrect trials were used to compute D scores. The inclusion of ERs with a penalty allows to maintain important information contained in them that increases the validity and reliability of the results, besides increasing the statistical power (Richetin et al., 2015). Similar to Chen et al. (2015), we excluded trials longer than 2,000 ms from the analysis of RTs and D scores. While the exclusion of long RTs was aimed at reducing noise from participants being distracted and not performing the task consciously, the penalty of error trials in the D scores calculation aimed to address conscious errors. In addition, the penalty of error trials only affected the computation of D scores and not the analyses of RTs by themselves.
To analyse the ERs of each IAT, we fit an LMM with congruency (congruent vs. incongruent) as fixed effects factor and subject ID as random effects factor using the lmer function of the {lme4} R package (Bates et al., 2015). To test the significance of congruency, the p-values were computed using Satterthwaite’s approximations. Bonferroni–Holm corrections were then performed using the {lmerTest} R package (Kuznetsova, 2017).
Results
RTs
The descriptive statistics of the RTs are presented in Table 5. The results of the individual GLMMs revealed that incongruency had a significant effect on the RTs of all IATs (Table 6). The likelihood ratio test (LRT) revealed that the effect of congruency was significant in all the combinations (Table 7). Furthermore, the post hoc analyses revealed significant differences in the RTs between the congruent and incongruent blocks of all the IATs (Table 8). As expected, participants responded significantly more rapidly in the congruent conditions compared with the incongruent ones in the crystalline versus striped as well as the crystalline versus cracked combinations. In other words, the participants responded more rapidly when the crystalline visual texture was matched to the word cold and either the cracked or the striped visual texture was matched to the word hot. Somewhat unexpectedly, the post hoc analysis revealed that participants responded more rapidly in the congruent versus incongruent conditions in the IATs combining visual textures of the same qualitative temperature ranges, namely the cold versus cold (crystalline vs. flecked) and hot versus hot (cracked vs. striped) combinations. Finally, the analysis revealed unexpected results in the cold versus hot combinations involving the flecked visual texture (flecked vs. cracked and flecked vs. striped) as the participants responded more rapidly in the incongruent conditions compared with the congruent one. In other words, the participants responded more rapidly when the flecked visual texture was matched with the word hot and compared against either the cracked or the striped visual texture.
Descriptive statistics of RTs and ERs of the IATs in Experiment 2.
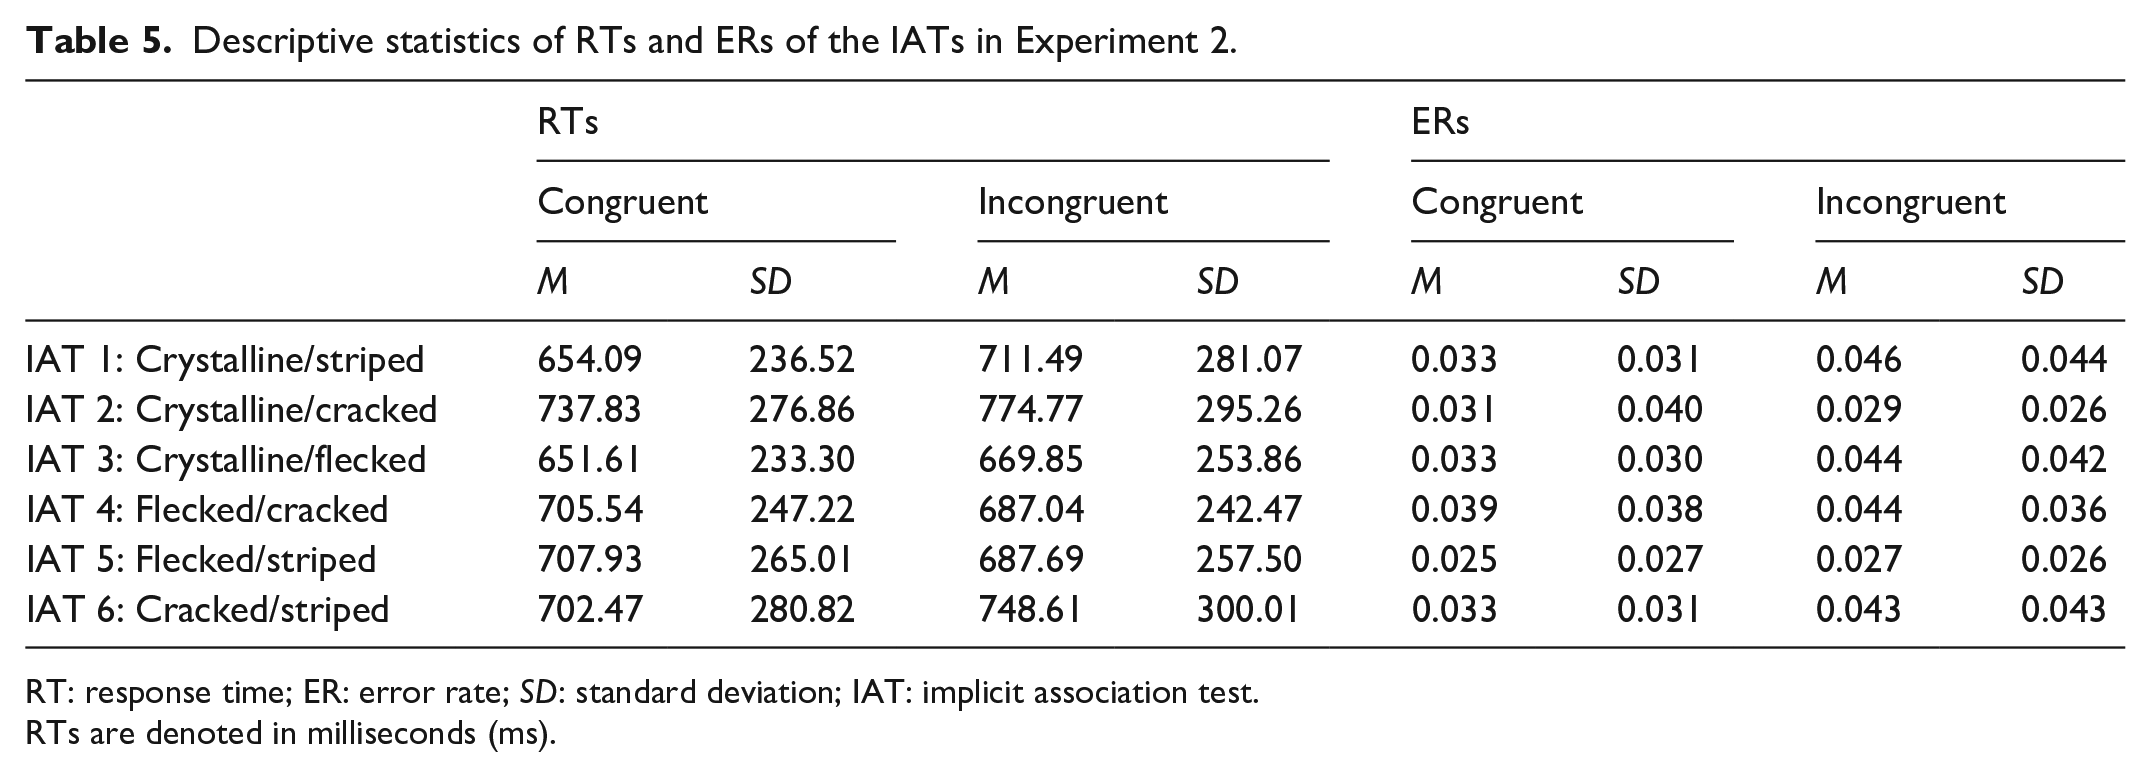
RT: response time; ER: error rate; SD: standard deviation; IAT: implicit association test.
RTs are denoted in milliseconds (ms).
GLMM results on RTs of individual IATs and aggregate data in Experiment 2.

RTs: response times; GLMM: generalised linear mixed model; IATs: implicit association tests.
Each column represents the GLMM run on each individual IAT. The corresponding t-values are presented in parentheses below each coefficient. An asterisk (*) denotes statistically significant coefficients (|t| > 2). RTs are denoted in milliseconds (ms).
LRT results of GLMMs on response times in Experiment 2.
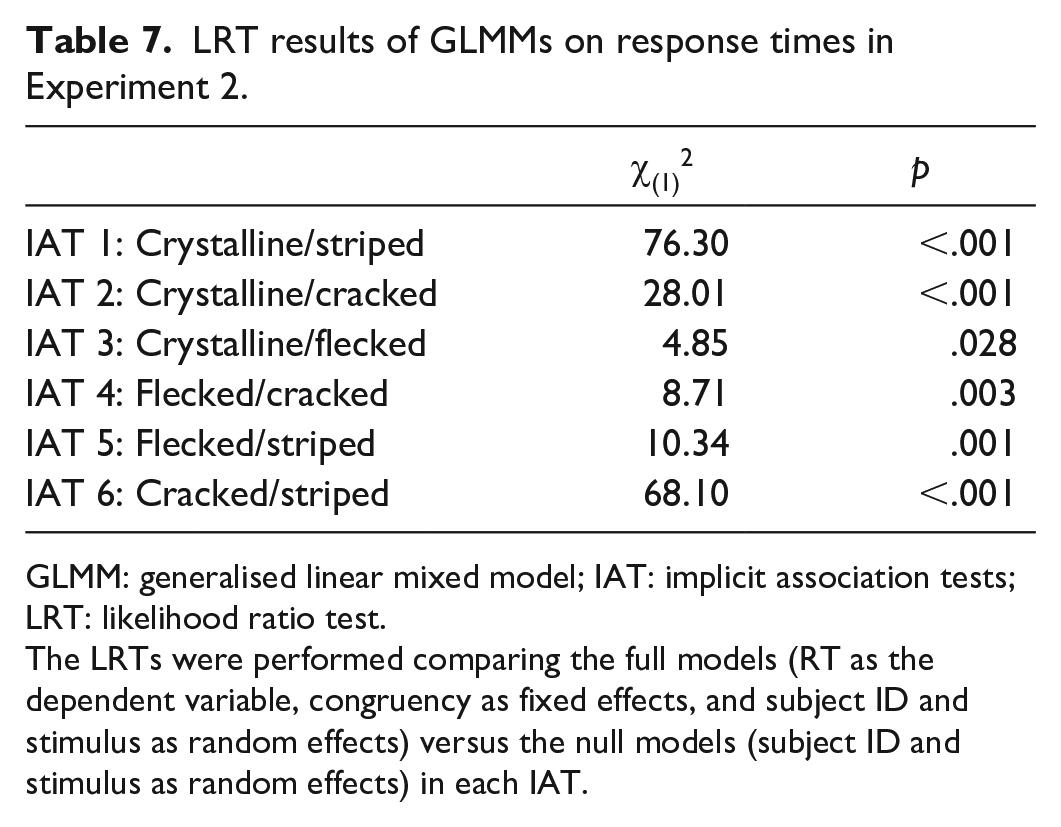
GLMM: generalised linear mixed model; IAT: implicit association tests; LRT: likelihood ratio test.
The LRTs were performed comparing the full models (RT as the dependent variable, congruency as fixed effects, and subject ID and stimulus as random effects) versus the null models (subject ID and stimulus as random effects) in each IAT.
Post hoc tests on RTs of the IATs in Experiment 2.

RTs: response times; SE: standard error; IAT: implicit association tests.
The variable ΔRTcongruent–incongruent denotes the difference between the response times in the congruent versus incongruent conditions. RTs are denoted in milliseconds (ms).
D scores
The analysis of the D scores revealed that the scores of four of the IATs were different from 0, revealing significant associations between visual textures and temperature concepts (Figure 7 shows the distributions of D scores of the six IATs). As expected, participants associated the striped visual texture with the word hot and the crystalline one with the word cold (IAT 1: M = 0.21, SD = 0.48; t39 = 2.80, p = .008). Moreover, as expected, no significant associations were found in the crystalline versus flecked (IAT 3: M = 0.03, SD = 0.54; t41 = 0.37, p = .713). However, unexpectedly, participants associated the cracked visual texture with the word cold when it was paired with striped (IAT 6: M = 0.16, SD = 0.37; t40 = 2.82, p = .008), as well as the flecked visual texture (IAT 4: M = −0.17, SD = 0.48; t40 = −2.27, p = .029). In addition, they associated, the flecked visual texture with the word hot and the striped visual texture with the word cold (IAT 5: M = −0.15, SD = 0.42; t39 = −2.17, p = .036). No significant associations were found in the crystalline versus cracked combination (IAT 2: M = −0.01, SD = 0.55; t42 = −0.07, p = .942).
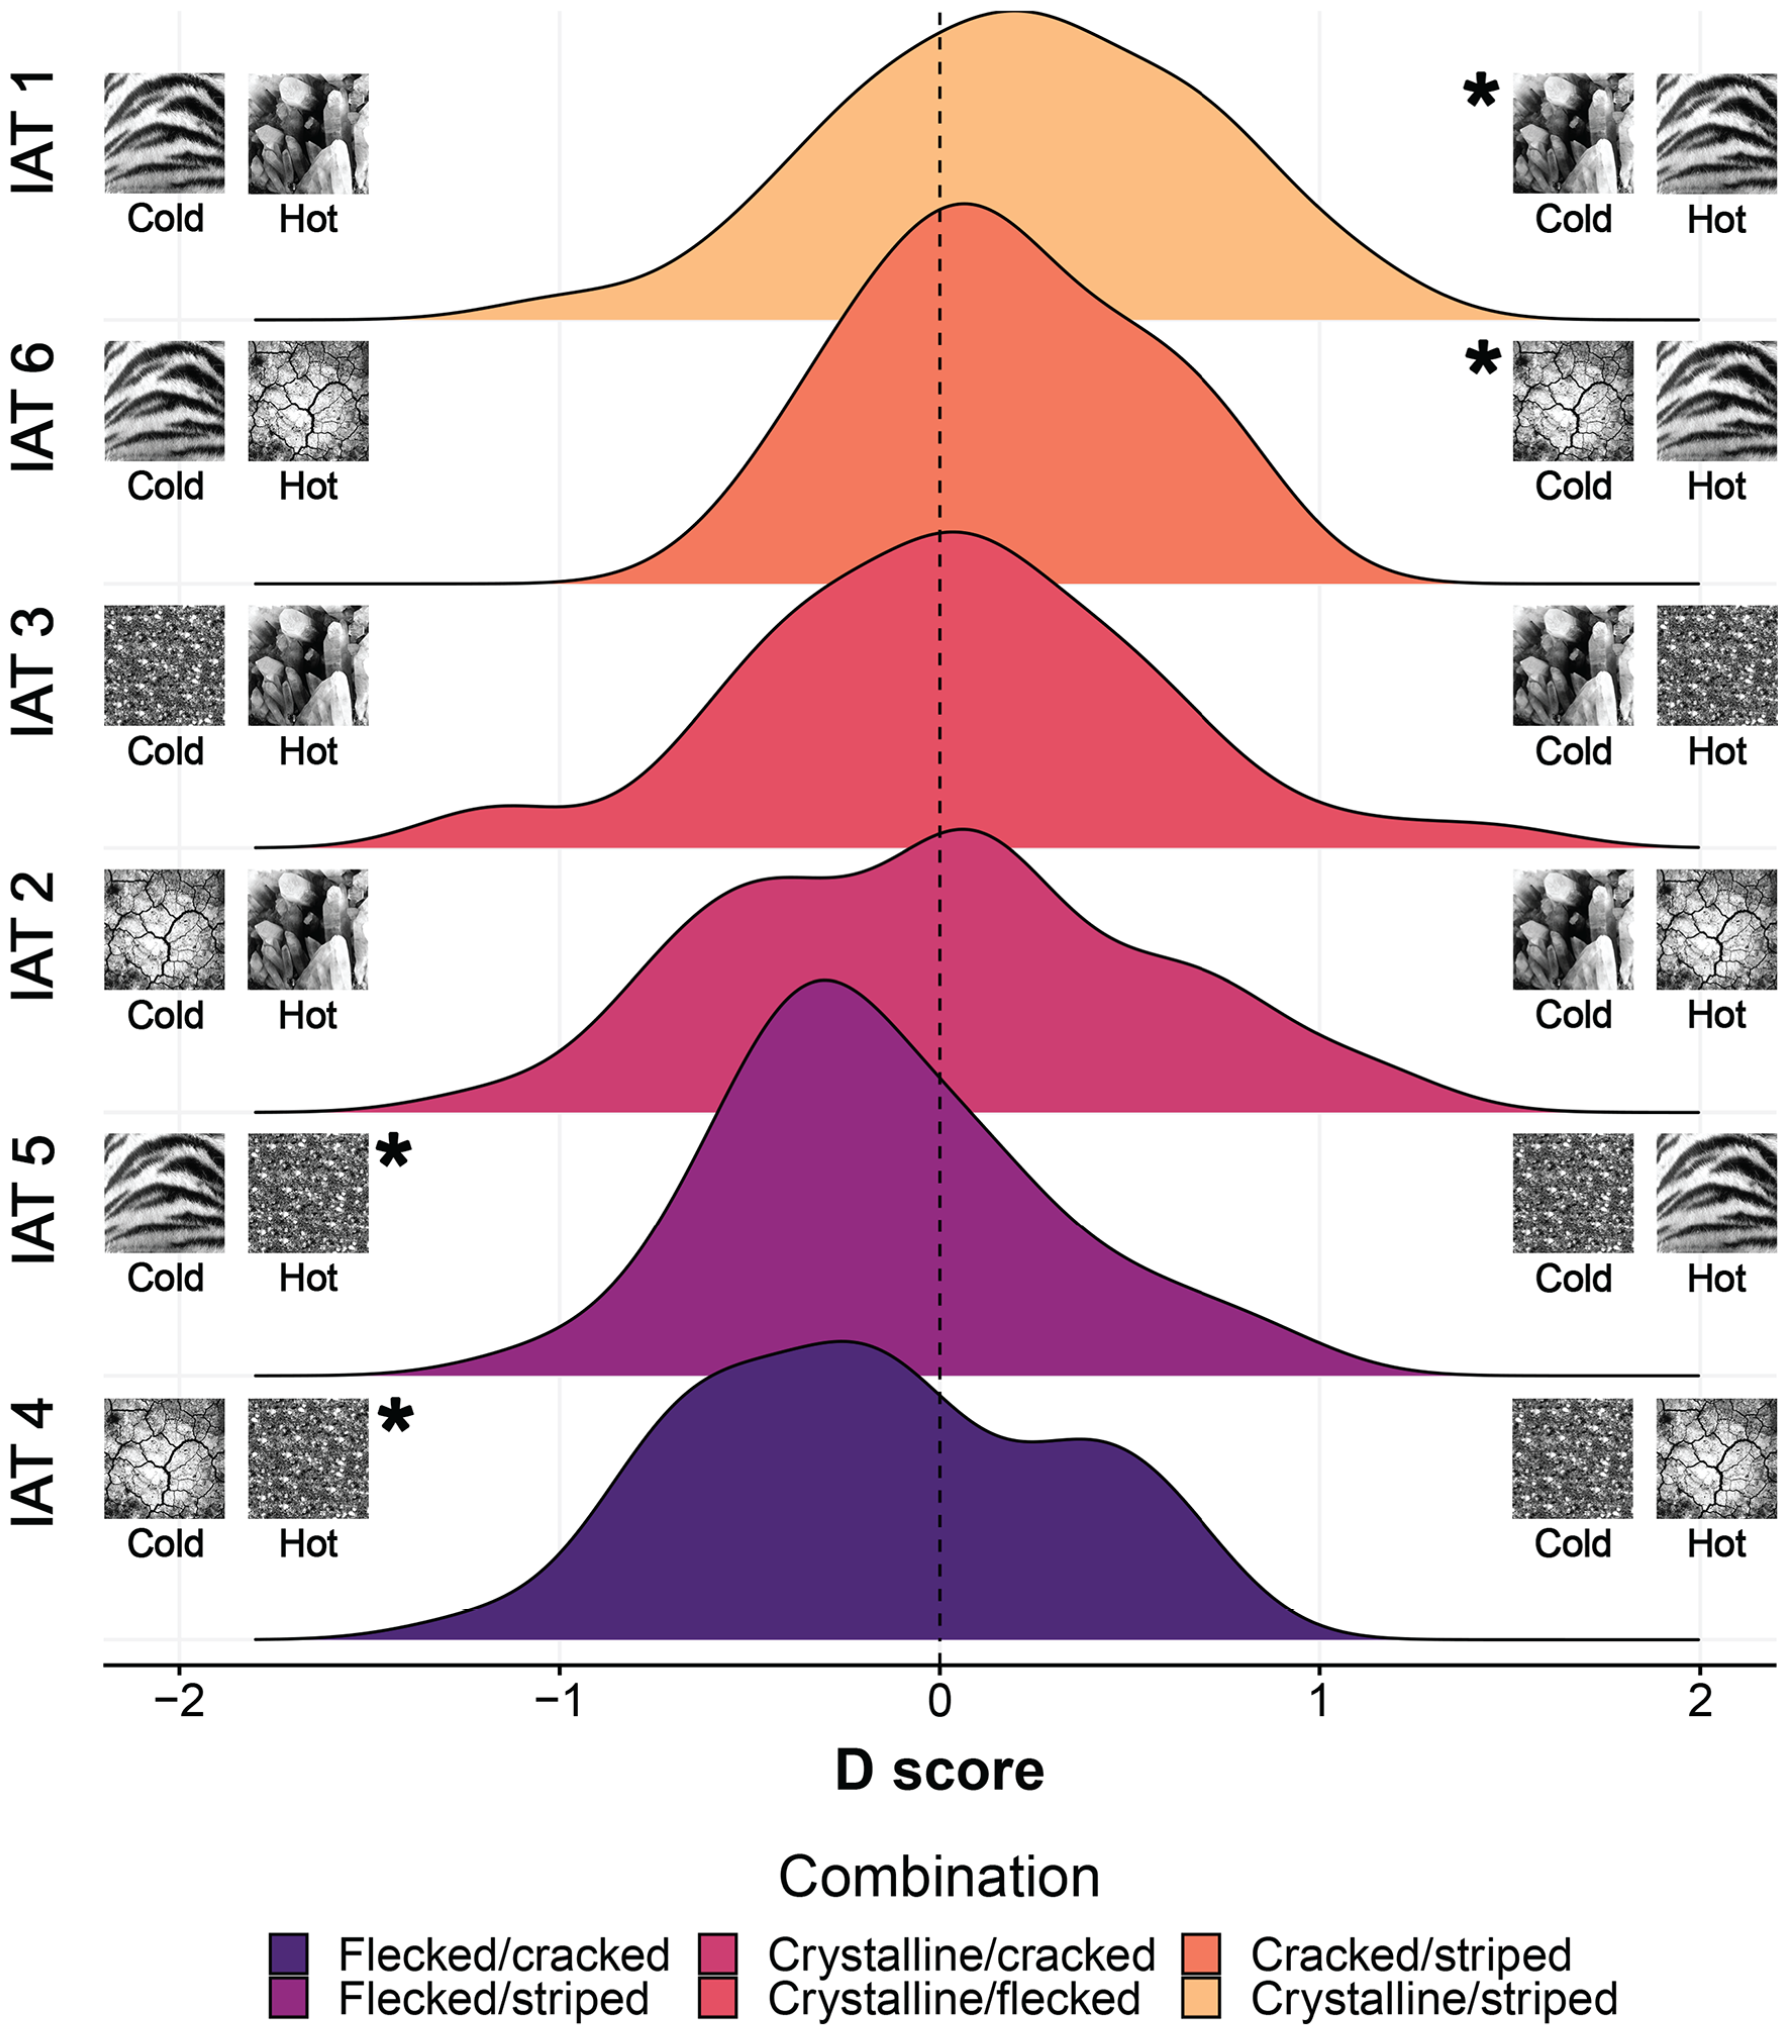
Distribution of D scores for the six IATs in Experiment 2.
ERs
Regarding the ERs, as expected, the analysis revealed a significant effect of incongruency in the crystalline versus striped, IAT 1: F(1,39) = 5.56, p = .023, η p 2 = 0.13. Participants’ ERs were significantly lower in the congruent condition (M = 0.033, SD = 0.031) compared with the incongruent one (M = 0.046, SD = 0.044; t39 = −2.327, p = .025). Somewhat unexpected, incongruency had a significant effect in the cracked versus striped combination, IAT 6: F(1,40) = 4.69, p = .036, η p 2 = 0.11. Participants’ ERs were significantly lower in the congruent condition (M = 0.033, SD = 0.031) compared with the incongruent one (M = 0.043, SD = 0.043; t40 = −2.08, p = .044).
The results of the RT of the different IATs showed significant results in the expected direction only in the crystalline versus striped and the crystalline versus cracked combination, which were composed of the coldest and hottest and the coldest and second hottest visual textures, respectively, according to Experiment 1. In contrast, the results of the combinations of the same temperature magnitudes (cold vs. cold and hot vs. hot) were unexpected. Nevertheless, the direction of these differences seems logical based on the values of the visual textures from Experiment 1, as the crystalline texture was evaluated as colder than the flecked one, and the striped was evaluated as hotter than the cracked one, although these differences were minimal. The results of the combinations including the flecked and the two hot visual textures were puzzling as they were in the opposite direction from what we expected. It is possible that the flecked visual texture was not strongly associated with cold temperatures relative to the striped and cracked ones, or that the latter visual textures were not strongly associated with hot temperatures.
The results of the D scores revealed significant associations in the expected direction only in the crystalline versus striped combination. Nevertheless, this analysis confirmed the results from the RT for the cracked versus striped, flecked versus striped, and flecked versus cracked combinations, whereas no associations were found in the crystalline vs. flecked and crystalline versus cracked combinations. The analysis of the ERs once again supported the results of the RT and D scores and revealed significant lower ERs in the congruent blocks compared with the incongruent ones in the crystalline versus striped and cracked versus striped combinations.
To summarise, the results of Experiment 2 revealed robust relative associations of the crystalline visual texture to the word cold and the striped one to the word hot, which was consistent with our expectations based on the results from Experiment 1. Nevertheless, contrary to our expectations, the flecked visual texture was associated with the word hot when compared with the cracked and striped visual textures. These results seem to suggest that crossmodal associations between visual textures and temperature concepts are relative and context dependent.
Experiment 3
Given that the visual textures studied here are found in everyday life, Experiment 3 was designed to evaluate whether the visual textures evoked specific associations to concrete entities, and to what extent these mappings could influence previously observed crossmodal associations between the visual textures and temperature concepts. Moreover, this experiment was also designed to elucidate whether the associations between visual textures and temperature studied here were to some extent based on semantic congruency. To this end, we selected the relevant visual textures with at least a minimal degree of associations with temperature concepts (significantly different from the midpoint of the scale) from Experiment 1, and we explicitly asked participants to evaluate their temperature associations with the selected visual textures, the extent to which they associated them with specific entities—and asked them to name these entities—and what temperature they considered these entities to normally be at.
Method
Participants
A total of 128 native English speakers (66 females, 62 males), aged 18–54 years (Mage = 31.29 years, SDage = 6.34) took part in the experiment. The experiment was programmed and conducted in Qualtrics (https://www.qualtrics.com/). Participants were recruited from Prolific (https://www.prolific.co/) and received GBP 1.35 in compensation. Based on a within-subjects ANOVA power calculation, we aimed to recruit at least 97 to achieve a statistical power of .8 using an effect size of Cohen’s f = 0.2 with an alpha level of .05. The experiment took approximately 12 min. We removed the data from participants whose time to complete the experiment was two standard deviations above or below the mean of all the participants (n = 4). The final data comprised 124 participants (63 females, 61 males), aged 18–54 years (Mage = 31.31 years, SDage = 6.29).
Apparatus and materials
To narrow the stimuli set to those visual textures that held at least minimal associations to either low- or high-temperature concepts and compare them with the same sample, we selected the visual texture categories from Experiment 1 that were significantly greater or less than the midpoint of the scale (50) as per Bonferroni-corrected Wilcoxon Rank Sum tests. Within each category, we selected the image with the highest (lowest) mean if the category was significantly greater (less) than 50. The final stimuli consisted of 26 visual texture images (Figure A1 in the Online Supplementary Material shows the visual textures selected).
Design and procedure
To reduce spillover effects between temperature associations of the visual textures and potential associations to concrete entities triggered by the visual textures (and their corresponding temperatures), the experiment was divided into two blocks. In the first block, similar to the procedure in Experiment 1, participants evaluated their temperature associations related to each of the visual textures by responding to the question “With what temperature do you associate the visual texture above?” on a VAS from 0 (cold) to 100 (hot).
In the second block, participants evaluated their associations of each of the visual textures with a concrete entity. Participants answered the question, “To what extent do you associate the visual texture above with a specific thing/person/animal?” on a VAS from 0 (Not at all) to 100 (Very much). In addition, they indicated what concrete entity they most associated with each visual texture by responding to the question “Name the single thing/person/animal with which you most strongly associate the visual texture above?.” It is worth noting that in all these questions, participants were explicitly instructed to attend the “visual textures” presented. Finally, participants evaluated the temperature of this entity by responding to the question “What temperature do you consider the thing/person/animal you mentioned [carried over input] to normally be at?” on a VAS from 0 (cold) to 100 (hot). When answering this last question, participants did not see the visual texture in question, but instead they were cued with the previous answer they gave.
Data analysis
First, we computed descriptive statistics on the temperature associations of all the visual textures, as well as on the extent to which participants associated the visual textures with a concrete entity, and the temperature they considered the latter to normally be at. Subsequently, to control for the effect of the associations with a concrete entity and its temperature on the associations between visual textures and temperature, we ran a linear model with temperature rating as dependent variable, visual texture as independent variable, and the interaction between the extent of association with a concrete entity and the temperature of the latter as covariates. Furthermore, we computed the estimated marginal means of the temperature ratings based on this model. Finally, we conducted a word frequency analysis of the things/persons/animals most strongly associated with the hottest and coldest visual textures in the present experiment, as well as the four visual textures for which the word frequency analysis was performed in Experiment 1.
Results
The descriptive statistics showed a similar pattern of temperature associations as Experiment 1 (Table 9). The matted visual texture was rated the hottest, followed by striped, cracked, and waffled; these visual textures had mean values above 55. Similarly, the crystalline visual texture was rated the coldest. Nevertheless, while the flecked visual texture was rated below the midpoint, it was only the 11th coldest visual texture. These results may suggest the presence of relative compatibility effects, as when manipulated within, the stimuli presented may affect how they are evaluated. In addition, the mean values of the extent of associations between the visual textures and temperature were all below 35.
Descriptive statistics in Experiment 3.
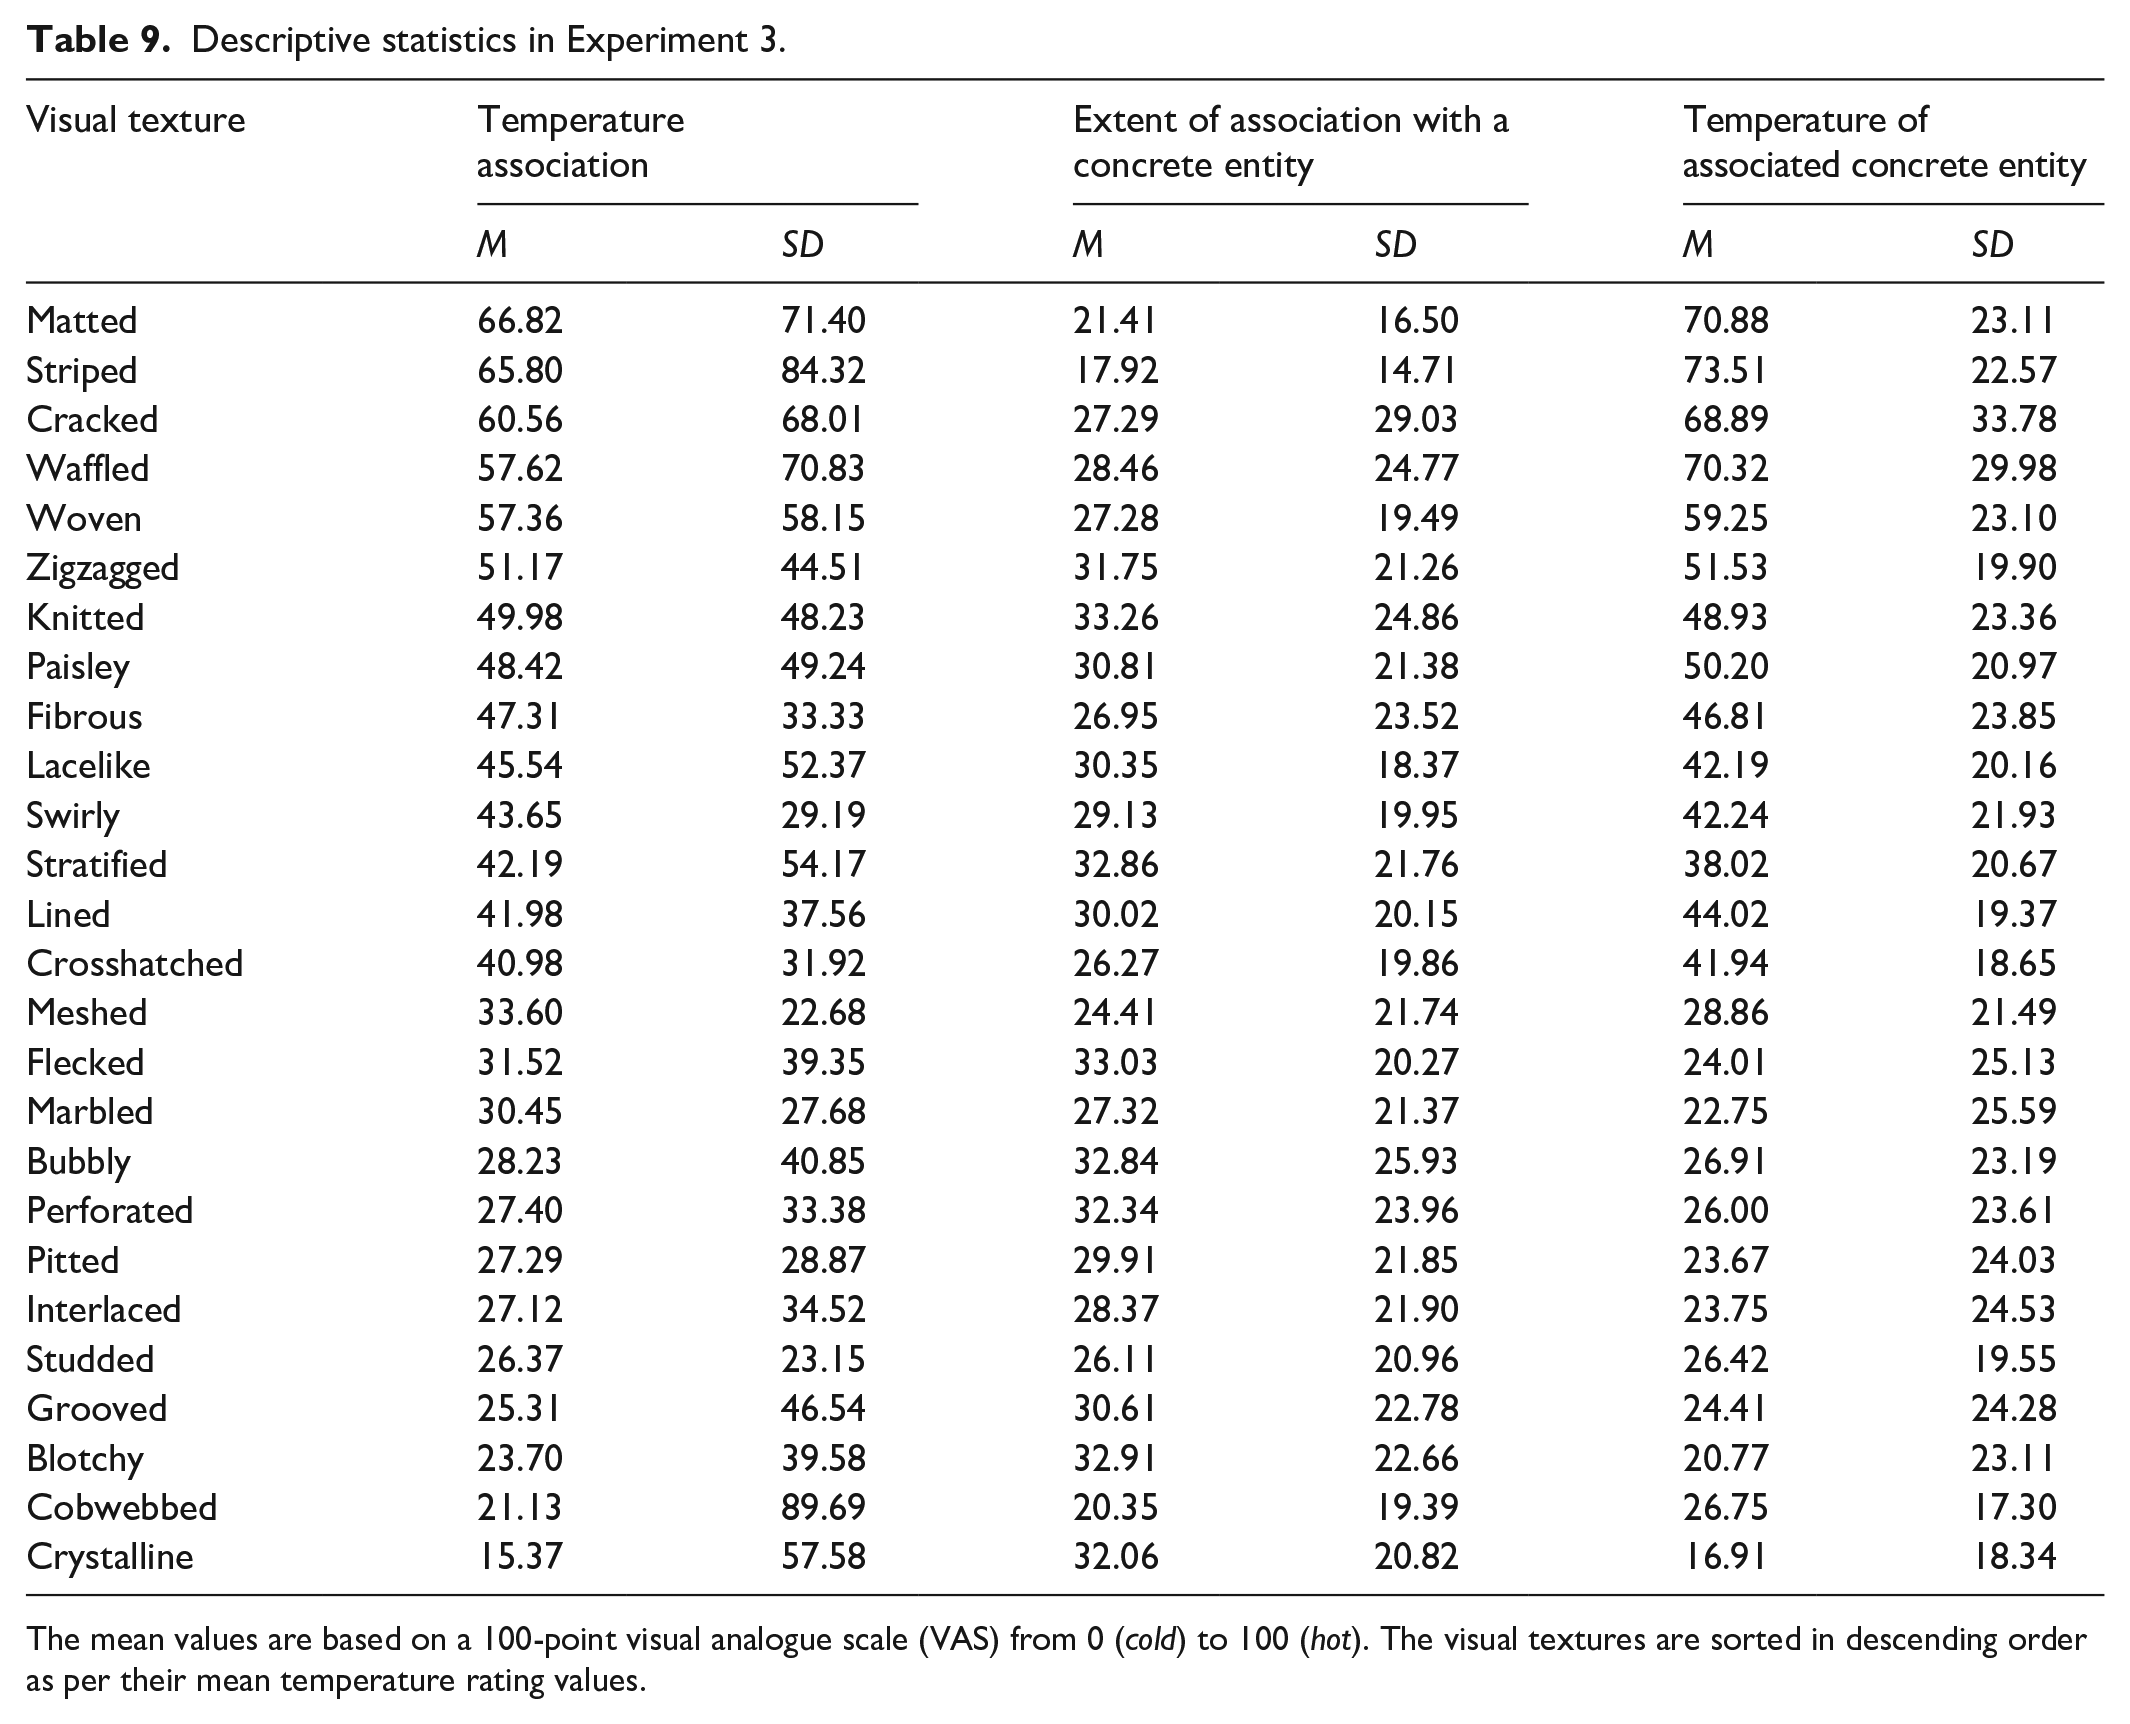
The mean values are based on a 100-point visual analogue scale (VAS) from 0 (cold) to 100 (hot). The visual textures are sorted in descending order as per their mean temperature rating values.
The linear model results revealed a significant main effect of visual texture, F(25, 3077) = 10.22, p < .001, η p 2 = .08. In addition, the results revealed significant effects of the covariates, extent of association with a concrete entity, F(1, 3169) = 37.22, p < .001, η p 2 = .01, the associated entity’s temperature, F(1, 3195) = 86.14, p < .001, η p 2 = .03, and their interaction, F(1, 3158) = 99.00, p < .001, η p 2 = .03. The estimated marginal means resulting from the model (Figure 8) revealed that the visual texture with the highest temperature rating (i.e., matted) was slightly below the midpoint (M = 47.80, 95% CI = [41.80, 53.70]). Nevertheless, the coldest (crystalline; M = 27.10, 95% CI = [21.40, 32.90]) and second coldest (cobwebbed; M = 28.30, 95% CI = [22.40, 34.20]) visual textures were close to the first quartile of the scale (25). Hence, the associations between visual textures and concrete entities influenced the associations of the former with temperature concepts.
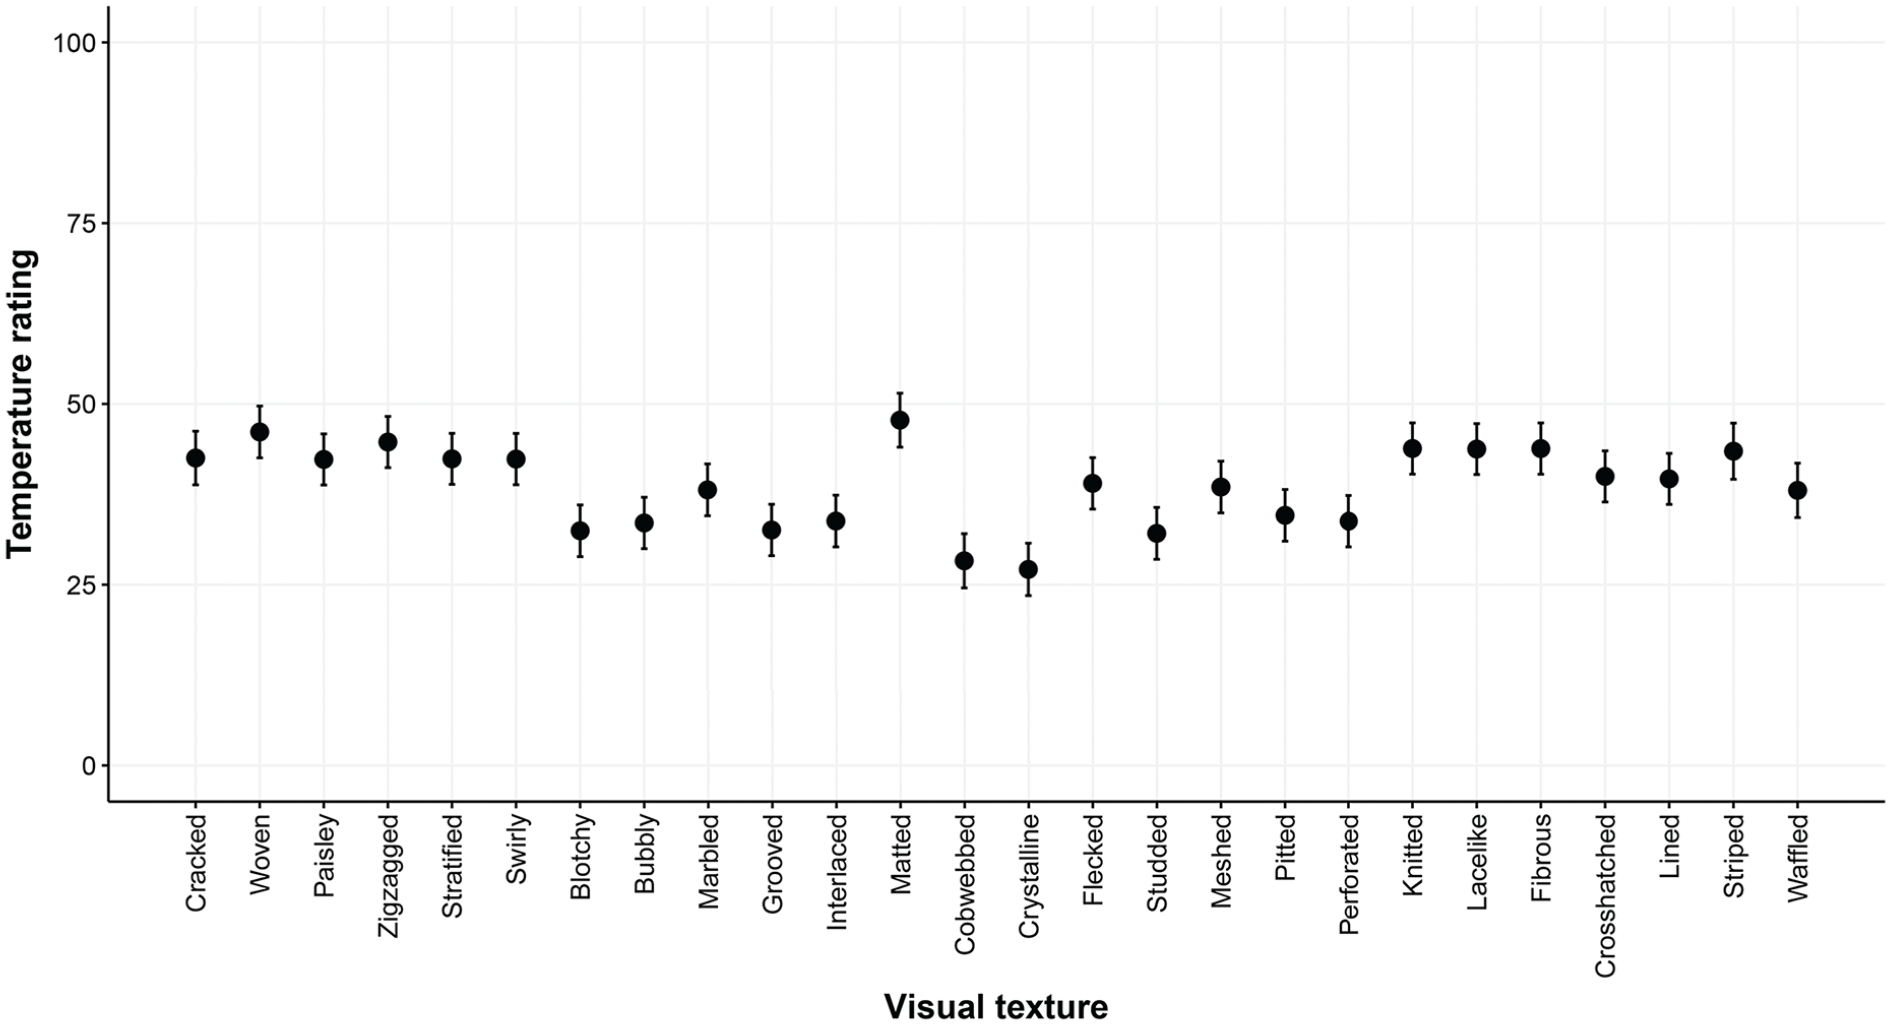
Estimated marginal means from linear model in Experiment 3.
The word frequency analysis revealed that the things, persons, and animals associated with the visual textures in Experiment 3 were largely similar to the words used to describe these visual textures in Experiment 1 (Table 10). The matted visual texture was associated with fur, the striped visual texture was associated with tiger, zebra, and fur; and the cracked visual texture was associated with desert, cracks, and earth. Moreover, the crystalline visual texture was associated with crystals and ice, and the flecked visual texture was associated with granite, stones, and crystals.
Keyword frequencies of the two hottest and coldest visual textures in Experiment 3.
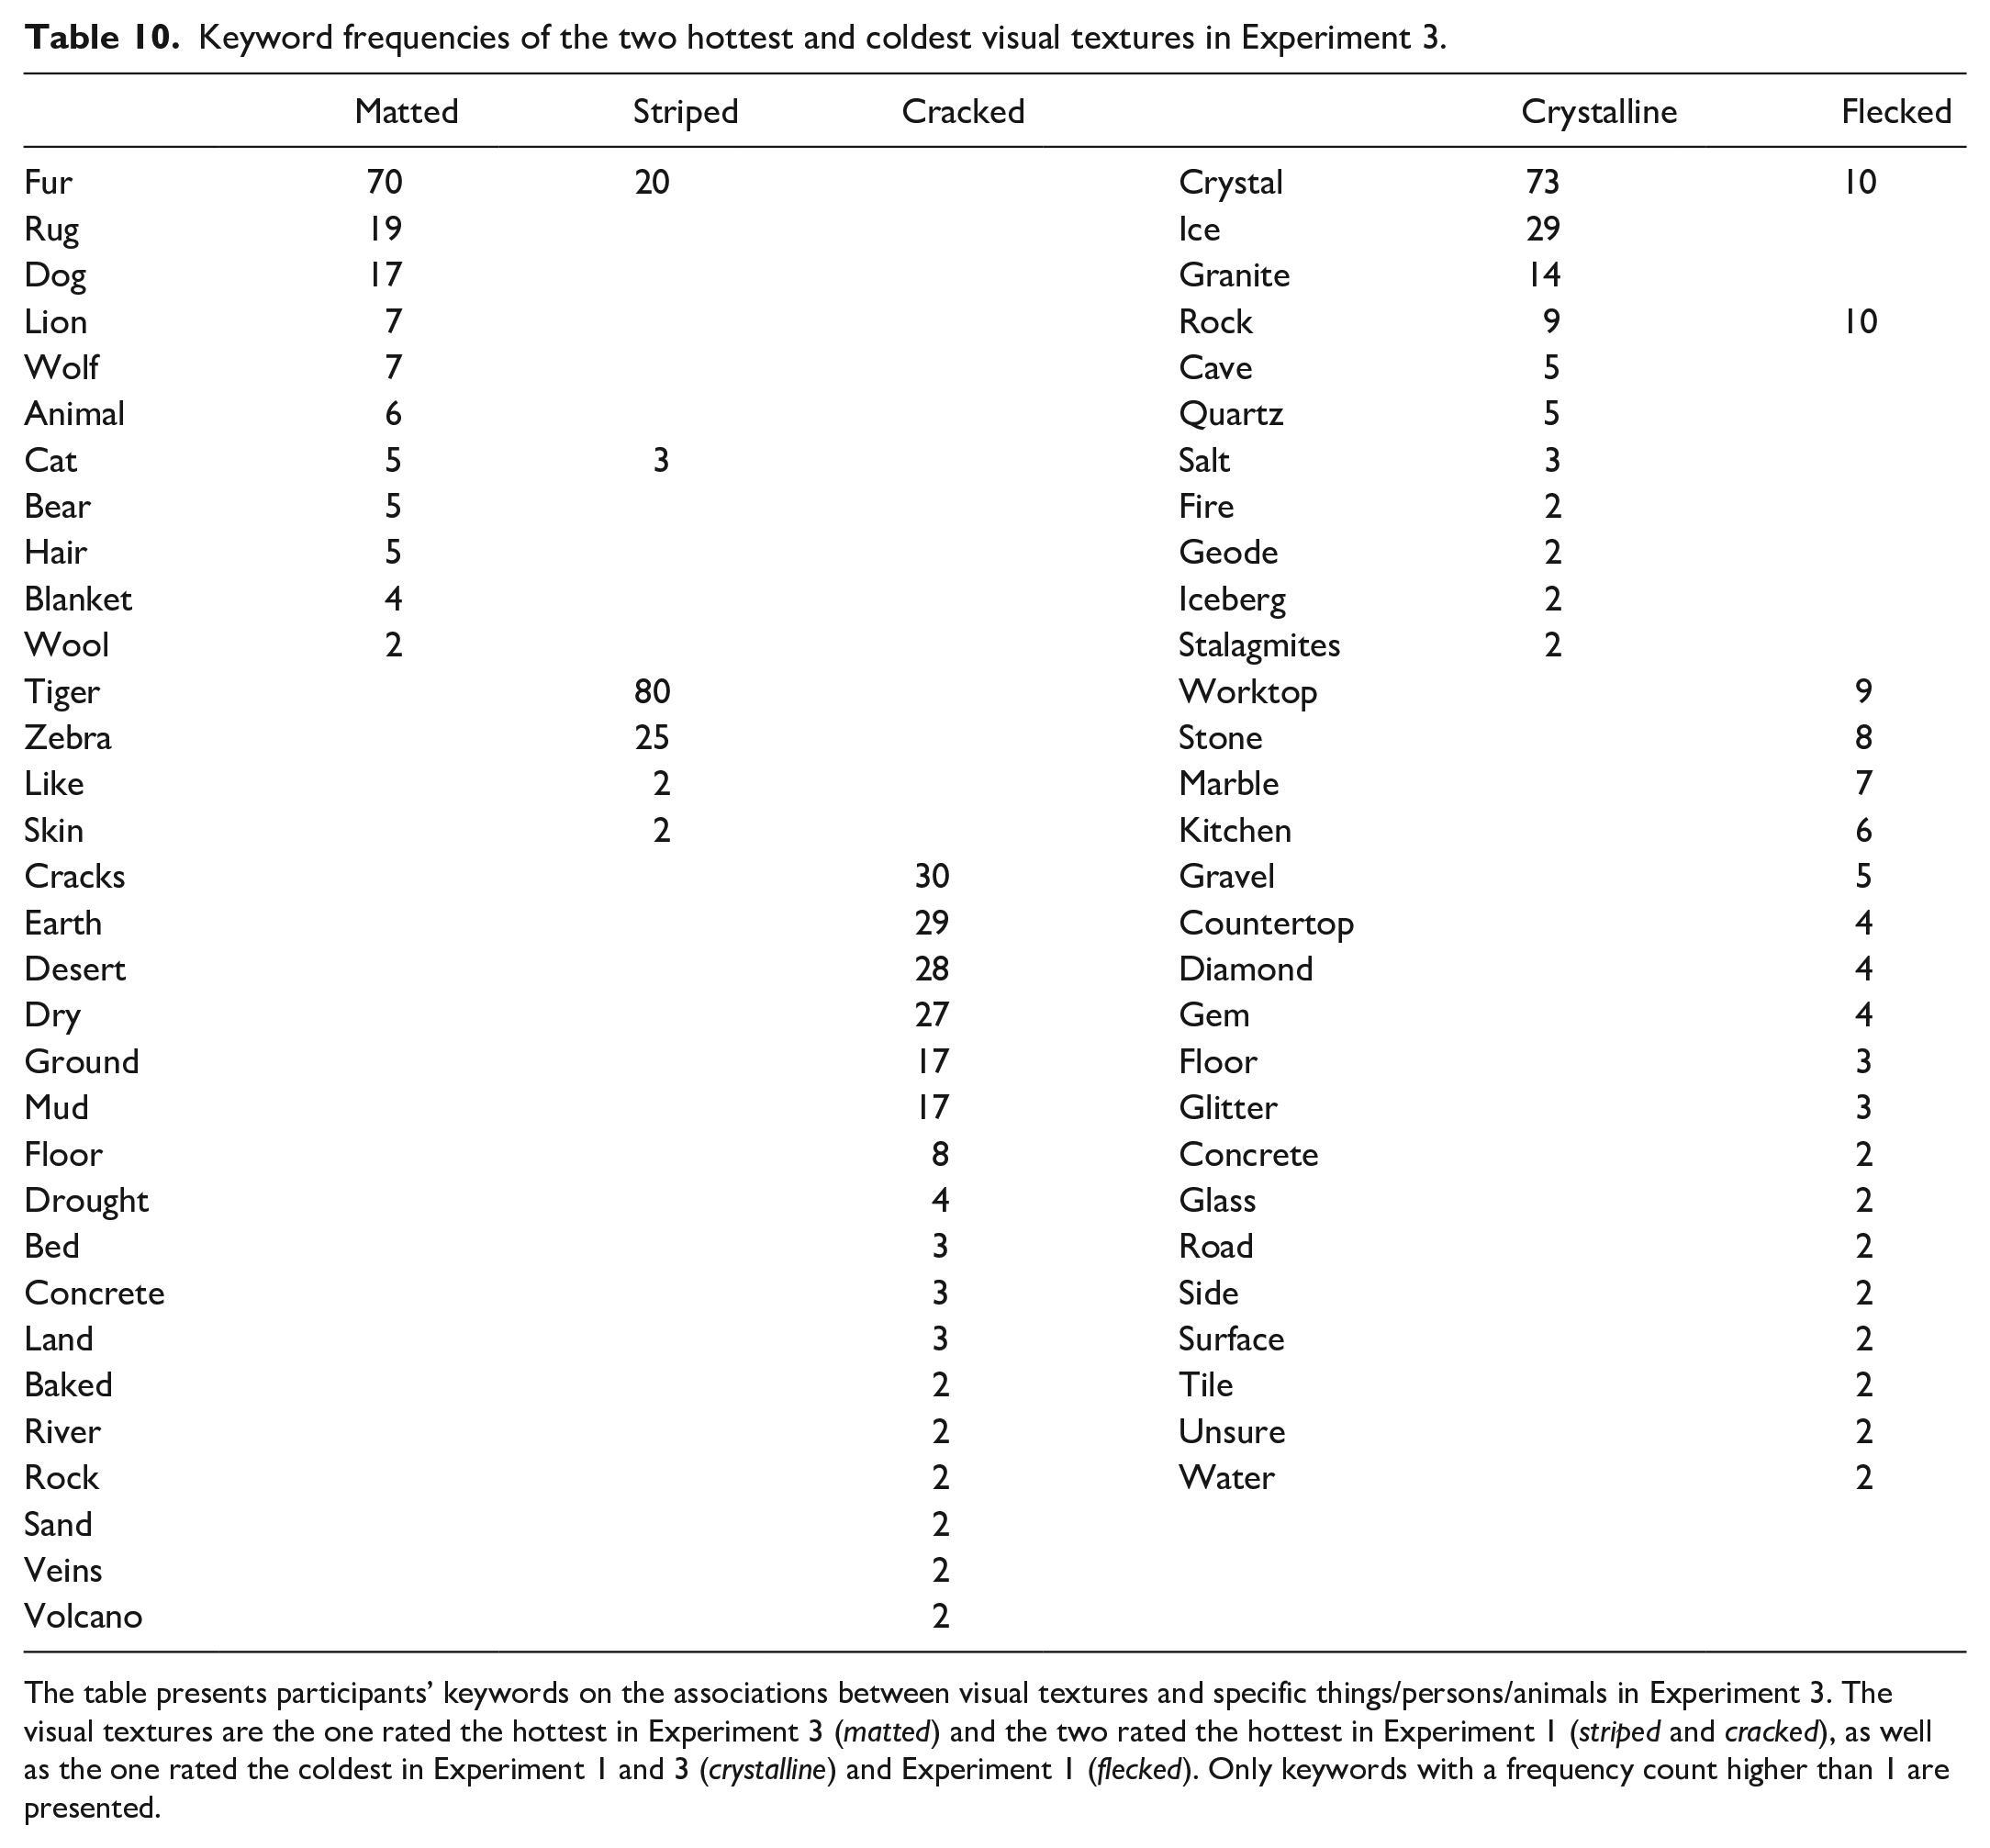
The table presents participants’ keywords on the associations between visual textures and specific things/persons/animals in Experiment 3. The visual textures are the one rated the hottest in Experiment 3 (matted) and the two rated the hottest in Experiment 1 (striped and cracked), as well as the one rated the coldest in Experiment 1 and 3 (crystalline) and Experiment 1 (flecked). Only keywords with a frequency count higher than 1 are presented.
In sum, the results of Experiment 3 revealed that the crossmodal associations between the visual textures and temperature concepts studied here are influenced by indirect mappings to concrete entities triggered by the visual textures and the temperature associated with these mappings. After controlling for these mappings to concrete entities, and the temperature associated with them, the crossmodal associations between the visual textures and temperature concepts became weaker. Nevertheless, multiple visual textures were still associated with low temperatures as evidenced by the estimated marginal means below the midpoint in Figure 8. It is possible that these temperature associations were still significant after controlling for entity associations because the latter ones were vague. Another possibility is that these visual textures contain specific low-level features that give rise to temperature associations. The results of Experiment 3 suggest the existence of relative compatibility effects. Hence the temperature associations of visual textures may depend on the specific stimuli they are compared with.
General discussion
In the present study, we investigated the existence of crossmodal associations between visual textures and temperature concepts through three online experiments. Experiment 1 aimed to uncover explicit crossmodal associations using 43 categories of non-computer-generated visual textures. In Experiment 2, we probed whether the two strongest associations with low and high temperatures could also be found via IATs to assess their automaticity. In Experiment 3, we investigated whether the visual textures studied triggered associations with specific things, persons, or animals and how these influenced temperature associations. Altogether, the results of the study demonstrated that individuals associated certain visual textures with temperature concepts, although some associations were found to be more automatic than others. In addition, these associations were shown to be influenced by mappings to specific entities, suggesting they may be based on semantic congruency.
In particular, the results of Experiment 1 showed that people tended to associate crystalline and flecked visual temperatures with relatively low temperatures. Moreover, people associated striped, cracked, matted, and waffled visual textures with high temperatures. The results of Experiment 2 revealed that crossmodal associations between the crystalline visual texture and the word cold and between the striped visual texture and the word hot were also found via the IATs. However, associations with temperature concepts involving the cracked and flecked visual textures, evaluated via IATs, did not necessarily show the expected pattern based on the associations found earlier with the explicit test. The results of Experiment 3 revealed that the extent to which individuals associate visual textures with concrete entities influenced associations between these visual textures and temperature concepts. This suggests that the crossmodal associations studied here may, in part, come from semantic knowledge about the entities to which the visual textures are mapped, although some associations may come from a structural account based on common neural encoding of stimulus dimensions, such as magnitude. For instance, the association between relatively low temperature and the pitted visual texture may be due to the small indentations in the visual texture, as there may be a relationship between the magnitudes of size and temperature, such that smaller may correlate with colder. Pairs of stimuli (e.g., textures and temperatures) that generally go together are thus congruent and become part of an individual’s multisensory learning (see Barenholtz et al., 2014; Connolly, 2014; Shams & Seitz, 2008). Although we used temperature concepts instead of physical, thermal stimuli in the present study, as Marks (1996) suggested, the correspondences between primary perceptual meanings and secondary linguistic ones are strong, despite not being perfect. It stands to reason that the associations studied here using temperature concepts would yield similar results as if we used the percept, as long as both retain the same connotation. For example, Saluja and Stevenson (2018) found that associations between real tastes and colours are closely matched by associations using colour and taste words. Similarly, Velasco, Woods, et al. (2015) found that people matched shapes with taste and taste concepts in a similar way.
Pathways towards crossmodal associations between visual textures and temperature
Our results may be interpreted from the perspective of the statistical account of crossmodal correspondences based on coupling priors as the Bayesian Decision Theory (Ernst, 2007; Parise et al., 2014; Spence, 2011, 2020c). The correspondences found in the present study may originate from long-term experience and learning, throughout life, that certain materials and material properties co-occur in the environment, and therefore specific textures normally “feel” at certain temperatures (see Barenholtz et al., 2014; Shams & Seitz, 2008). For example, people may have internalised that furry surfaces generally feel warm to the touch. As Komatsu and Goda described, “when we see a sweater made of fine wool, we can perceive that it will be soft and warm, or we can sense that a metal cup will be cold and hard to the touch” (2018, p. 330). A critical consideration stemming from this statistical account of crossmodal correspondences is that they rely on individuals’ exposure and experience with the specific statistical regularities (Spence, 2011). Hence, correspondences between visual textures and temperature may be relatively idiosyncratic and depend, to some extent, on individuals’ knowledge and prior experiences with specific stimuli. Furthermore, this dependency may be even stronger for temperature-based crossmodal associations as temperatures may need to be experienced directly (i.e., via direct skin contact or felt ambient temperature) for individuals to form concrete knowledge, which will affect the potential associations between sensory stimuli. While expectations about surfaces are largely formed through visual information (Kahn, 2017; Sakamoto & Watanabe, 2017; Spence, 2020bb), the thermal behaviour of the materials cannot be assessed visually. Therefore, expectations based on visual information will be highly influenced by the direct tactile experience with the specific stimuli (Wastiels et al., 2012b). For example, while the average person knows that deserts have high temperatures during the day, they may not have a concrete understanding of how hot these temperatures are and how they feel if they have never experienced them first-hand. That being said, most people are also aware that deserts are cold at night, so when presented against the striped visual texture, the cracked visual texture may have generated associations to cold temperatures instead. This suggests that, to some degree, context, the specific stimuli evaluated, and personal experience may influence these associations. Furthermore, it is worth noting that whether the visual textures can be detected by vision or touch or only by vision may also influence associations with temperature concepts. It is possible that those visual textures that can be identified via either the visual or the tactile modality (e.g., cracked) present stronger associations with temperature concepts due to the prior experiences perceiving the physical temperature of the objects they are part of. On the contrary, associations between temperature concepts and visual textures that can only be perceived by vision only (e.g., polka dotted) may be weaker.
It is also possible that some associations are produced by indirect connections with other features (e.g., colour). Indeed, previous research has demonstrated that people tend to associate different properties with textures and colours (Speed et al., 2021). In our experiment, people may associate high temperatures with orange colours and the latter with cracked textures. This points to the transitive property of crossmodal associations (Fields et al., 1984; see also Deroy et al., 2013). Hence, even with no previous personal experience with deserts, individuals may associate cracked visual textures with high temperatures, although the strength of the correspondences generated through this pathway may be weaker.
Besides personal experiences, language may influence the present associations as language may be used to encode statistical regularities (Parise & Spence, 2013). The perceptual information from multiple modalities brought by experiences throughout the development of individuals’ lives is connected and coded into language, which forms a semantic network that incorporates correspondences across the senses. In addition, language is used to describe these experiences (Martino & Marks, 1999, 2001). Therefore, crossmodal associations may stem from both perceptual and verbal stimuli, as they are recoded and retrieved from an existing semantic network, which may differ depending on people’s language. Furthermore, the networks of associations from statistical regularities will depend on the referents to which words are matched, and on the contextual factors in the learning environment (Siegelman, 2019; Zettersten et al., 2018). Thus, potential differences in the referents and contexts in semantic networks may influence associations between visual textures and temperature concepts.
It is also possible that the associations found here are also explained to some degree by other relationships. As Spence (2020b) suggested, four accounts (i.e., statistical, structural, semantic, and affective) may have some complementary (and interrelated) explanatory power in temperature-based crossmodal correspondences. These correspondences may, to some extent, be caused by an affective account, as people may associate textures with emotions based on the feelings different textures trigger (Ball, 2017). These associations coming from underlying emotional matchings may come from perceptual dimensions (Cavanaugh et al., 2016) and semantic ones (Wilkes & Miodownik, 2018; Wilkes et al., 2014). For example, furry textures are associated with happiness (Iosifyan & Korolkova, 2019), so it is possible that furry textures, such as the ones in winter garments, were associated with warm temperatures because people may indirectly map these textures to the warm and cosy feelings these garments produce—besides the physical protection against low temperatures. As Barbosa Escobar et al. (2021) found, warm temperatures are associated with positive valenced emotions. As the results from Experiment 1 here showed, there was a positive correlation between temperature and liking in the striped visual texture. In addition, the cluster of visual texture with lower temperature ratings was liked less than the other two clusters.
The correspondences found in Experiments 1 and 3 were consistent with our overall expectations, based on the co-occurrence of materials and temperatures. Regarding the correspondences with high temperatures, participants seemed to have associated living things with high temperatures, as shown by the associations with the striped and matted visual textures. The striped visual textures showed short fur and animal-looking stripes, and the matted visual textures showed long fur that may have been conjectured to have come from an animal. These results are consistent with Hekkert and Karana (2014) in that materials that come from living beings are considered to be warm as they may carry over associations related to their previous living condition and hence the emission of their own heat. It is worth noticing that these associations may also hold a semantic component. Regarding the correspondences between the cracked visual textures and high temperature, they may come from people’s mappings with deserts and hence hot environments. In addition, the correspondences between the waffled visual textures and high temperatures may be the result of associations with waffles, which are generally consumed warm. With respect to the correspondences with low temperatures, they did not seem to be as strong as the ones with high temperatures. Nevertheless, the participants tended to associate the crystalline and flecked visual textures with low temperatures. The crystalline visual textures seemed to be associated with low temperatures because they resemble ice formations (e.g., icicles, ice cubes) and stones. The association between the flecked visual textures and low temperatures is consistent with the previous literature suggesting that materials with low thermal effusivity are perceived as cold (Obata et al., 2005; Wastiels et al., 2012b). For instance, flecked textures are usually found in stone or granite countertops, which are generally cold to the touch as they can rapidly exchange thermal energy with their environment.
As per the associations studied using the IATs in Experiment 2, the analysis revealed intriguing results as not all the associations were consistent with the first experiment. While the IAT combining the coldest (crystalline) and hottest (striped) visual textures revealed the expected result, the IATs combining the second coldest (flecked) and second hottest (cracked) visual textures yielded—sometimes completely—opposite patterns to what we expected. In particular, when the flecked visual texture was evaluated against the striped and cracked visual textures, the flecked visual texture was associated with the word hot. Moreover, when the cracked visual texture was compared with the striped one, the cracked visual texture was associated with the word cold. These results indicate that there is no perfect match between these associations when measured via explicit tests compared with IATs. In terms of the effect sizes of the associations, the D scores were relatively low, with the highest scores being |0.21| and |0.17| for the crystalline/striped and the cracked/flecked combinations, respectively. Recent studies have found significant D scores of |0.51| and |0.57| in IATs using temperature concepts and emotion adjectives (Barbosa Escobar et al., 2021); |0.26| and |0.38| in IATs using colours and shapes (Chen et al., 2015); and |0.30| in an IAT between sourness and high pitch (Crisinel & Spence, 2009). In addition, non-significant D scores of |0.06|, |0.11|, and |0.21| were found in IATs using colours and shapes (Chen et al., 2016). The differences in magnitudes in IATs seem to support the notion that correspondences lie on a continuum representing different degrees of associations (Parise, 2016). In our study, the low magnitudes of the D scores of the IATs with the crystalline/striped and the cracked/flecked combinations hint at the relatively low strength of these correspondences, which may be tested in future studies (see Velasco, Wan, et al., 2015, for an example of the effects of association strength in colour–flavour pairings). These magnitudes in our results seem to indicate that neither the cracked nor the flecked visual textures may be as strongly associated with high and low temperatures, respectively. The previous literature has also found associations measured with explicit questionnaires that were not found using IATs. For instance, Chen et al. (2016) found significant colour-shape associations (red-circle, yellow-triangle, and blue-square) using explicit questionnaires, but these associations were not present when they were evaluated using individual IATs. Similarly, Sun et al. (2018) found significant correspondences between sound (i.e., pitch, tempo) and colour (i.e., hue, lightness) properties using explicit questionnaires. However, evaluating these associations via a speeded discrimination task did not reveal significant effects.
Automaticity and ambiguity
The unexpected results from the IATs may also be the product of how the crossmodal associations develop in individuals’ minds based on the stimuli and task at hand, which will determine the level of strategizing needed to form the correspondences and influence their automaticity (i.e., showcased rapidly and without effort or explicit intention). For instance, research has shown that scent can influence the perceived material quality of materials (e.g., softness; Demattè et al., 2006). At the outset, given the reliance on visual information to form expectations and make judgements of surfaces and materials—especially of somatosensory properties such as temperature—individuals likely require a high degree of strategic processing to make sense of visual textures and form correspondences. Nevertheless, multiple paths may be formed to arrive at the correspondences. If the correspondence between a visual texture and a temperature concept is formed through a statistical account, people may rely on indirect mappings or comparisons (as the results in Experiment 3 suggest). Hence, individuals’ experience and level of exposure with the mapped material will, to some extent, influence the internalisation of the environmental statistics and, therefore, the automaticity (Spence & Deroy, 2013). In this way, less exposure with the material the visual texture is mapped with would decrease the strength of the correspondence and its level of automaticity. For example, as mentioned before, with the cracked visual texture, most people have never personally experienced desert temperatures. If not given time to think and rationalise associations, as in the IAT, people may not strongly show an association between the cracked visual texture with hot temperatures, or the association may not be as strong as if they had experienced desert temperatures, which could explain the unexpected results in Experiment 2 with the cracked visual texture. On the contrary, if the association is based on common neural encoding (e.g., magnitude, intensity), the association could not just be more automatic given its more direct mapping to a temperature concept, but it could also lead to another direction in the associations, which could have occurred with the flecked visual texture.
The randomness in the flecked visual textures may have led to high levels of ambiguity, rendering its perception and interpretation particularly susceptible to individuals’ previous knowledge and personal experience. Indeed, as Partos et al. (2016) suggested, the perceived meaning of complex and ambiguous images is highly idiosyncratic. Furthermore, it is possible that the randomness of the flecked visual texture led to the formation of an association with temperatures through a structural account, potentially leading to a different direction when measured via different tests. Contrary to the explicit test, it is possible that with the IATs, these correspondences occurred via a structural approach based on the mathematical properties of the image (e.g., pixel intensity, luminance distribution). In this case, the high level of randomness of the image may have triggered associations with high temperatures, as high excitation states lead to high temperatures. Indeed, as Katkov et al. (2015) suggested, systems at high temperatures are disordered, and this property can be communicated through visual textures by manipulating visual parameters, such as luminance. Moreover, as image statistics guide the perception of surface texture quality, other image statistics parameters may be at the core of other crossmodal associations between visual textures and temperature. For instance, given the relationship between surface gloss and warmth perception, together with the positive correlation between the latter and the skewness of luminance found by Motoyoshi et al. (2007), different statistical moments of luminance statistics may play a role in crossmodal associations between visual textures and temperature concepts. In addition, taking from the correspondences found between image statistics (e.g., luminance and redness) and basic tastes found by Motoki et al. (2021) in the context of coffee shops, other image statistics, such as saturation and contrast, may be related to associations between visual textures and temperature. Thus, there may be a conflict between associations when they are measured with explicit questionnaires versus speeded task tests. The former case may require more strategizing and therefore lead to indirect mappings that caused the flecked visual texture to be associated with low temperatures. On the contrary, under the set-up of the IAT, in which time is critical, individuals are less likely to form indirect mappings to specific objects and their properties, so associations arise from structural patterns in the image. In this case, the disordered nature of the flecked visual texture may have been prominent, leading to a correspondence with high temperatures. Therefore, whether the focus is on higher-level versus lower-level features may change the kind of correspondence and direction produced.
Altogether, these results suggest that crossmodal associations between visual textures and temperature do not always present a high degree of automaticity, but instead, some operate at a more strategic level. As Spence and Deroy (2013) suggested, the automaticity of crossmodal correspondences is not a clear-cut topic, and it depends both on the criteria used to define automaticity and how it is measured. Importantly, the degree of automaticity may depend on the type of crossmodal correspondence (i.e., statistical, structural, semantic, affective) and on the specific combination of sensory modalities. Furthermore, it is possible that crossmodal associations between visual textures and temperature concepts rely on both top-down and bottom-up approaches, as suggested by Getz and Kubovy’s (2018) findings in audiovisual crossmodal correspondences. The present results add to the broad body of knowledge and recent findings showing that crossmodal correspondences are not necessarily automatic (Getz and Kubovy, 2018; Getz & Toscano, 2021). As Spence (2020c) pointed out, temperature-based crossmodal correspondences appear to present some, but not all distinctive features of automaticity. It is also worth considering that despite some potential limitations related to the construct the IAT measures (Lebel & Paunonen, 2011), research has shown that it is still one of the best methods to assess automatic judgement (Vianello & Bar-Anan, 2021). Relevant to the present study, the IAT can pick up both explicit and implicit associations, which is why it is often coupled with explicit tests. Here, we first conducted an explicit test, then ran individual IATs using the strongest associations found in the explicit test. We found that, for some, but not all, patterns (e.g., including the striped visual texture), there were consistent temperature associations found via both types of tests. While we cannot conclude whether these associations are implicit, we can say that the associations found via both types of tests are more automatic than those associations which were only found in explicit tests.
Limitations and future directions
Regarding Experiment 1, while we used a relatively large number of non-computer-generated visual textures, the categories of visual textures that can be studied are virtually endless. Hence, other visual texture categories may be more strongly associated with different temperature concepts, which may also depend on context and relative stimuli. In addition, related to Experiment 1, even though we used four different images for each category of visual textures to increase the generalisability of our results and we histogram-equalised all the images, there may have been specific elements in the images, such as differences in angles and luminance, that could have affected the associations. As for Experiment 2, one of the limitations comes from the use of temperature words and not physical temperature, which could have led to semantic effects. People may have had different interpretations of the temperature words. Furthermore, a limitation applicable to both experiments is the heterogeneity of place of residence, cultural background, and personal experiences of the participants, which may have influenced their associations between visual textures and temperature concepts. Although we narrowed down the country of residence to the United Kingdom in Experiment 2, a more granular geographic location may have influenced the associations.
Future research can build on the present study to explore correspondences with other visual textures. The selection of visual textures can be informed by other potential accounts on which crossmodal associations between visual textures and temperature may be based, such as an affective account. For example, exploring correspondences with positively and negatively valenced textures could yield interesting results. Moreover, further studies may use synthetic visual textures—either pattern-based or randomly generated—in which specific visual parameters (e.g., low and high moments of their pixel intensity distribution) are manipulated to explore correspondences with temperatures from a parametric perspective. In addition, the study of image statistics of visual textures presents a rich avenue for future research in experimental psychology, neuroscience, and materials perception. The perception of materials has a crossmodal nature, and as Spence (2020a) suggested, the study of material quality is poised to have implications for established and emerging fields of research such as extended reality (e.g., AR, VR) involving the visual and tactile perception of materials. Given that image statistics are critical for the neural processing of visual textures (Komatsu & Goda, 2018), more in-depth investigation of image statistics (especially higher-order statistics such as skewness and kurtosis) and their potential use to convey somatosensory information represents an untapped potential for future research. Image processing analysis could reveal potential correlations between temperature judgements and higher-order image statistics. For instance, contrast or relative amount of white and black could be related to temperature assessments. For example, Ueda et al. (2020) found that the manipulation of the second moment of the luminance distribution of foods can affect people’s taste and flavour expectations and perception of these foods. Building on these findings, future research could investigate how other image statistics may influence the perception of foodstuffs. In addition, exploring crossmodal associations between visual textures and physical temperature may yield interesting insights.
Further investigation of the possible ways in which the present correspondences are formed would be of great interest for the academic literature. More specifically, given the nature of these correspondences, studies in this area could focus on the role of statistical learning. For instance, building on the work of Ernst (2007), future studies could investigate whether these crossmodal associations may be reversed through training.
From a more applied perspective, understanding the associations found in the present work may allow practitioners to incorporate visual textures to convey or influence temperature perception of products (Imram, 1999) or the environment (Ulusoy & Olguntürk, 2018). For instance, marketers may integrate visual textures in the packaging of foodstuffs to alter the temperature perception of products such as ice cream or thirst-quenching beverages. Visual textures can also be incorporated in design elements in office spaces to alter the temperature perception of the environment and hence comfort. That said, whether crossmodal associations are able to indeed influence perception—and to what extent—is still an open research question.
To conclude, our findings provide evidence of the existence of crossmodal associations between visual textures and temperature concepts, although there are differences depending on how the associations are measured. Importantly, we found that these associations present different levels of automaticity. The present research represents an initial step in the systematic investigation of crossmodal associations between visual textures and temperature concepts. Our findings thus contribute to the growing literature on temperature-based crossmodal associations and add to the discussion on the origin of crossmodal correspondences and the importance of concrete knowledge on the existence of crossmodal associations. Furthermore, the insights derived here add to the discussion on the automaticity of crossmodal correspondences and the role of top-down versus bottom-up approaches.
Supplemental Material
sj-docx-1-qjp-10.1177_17470218221096452 – Supplemental material for Crossmodal associations between visual textures and temperature concepts
Supplemental material, sj-docx-1-qjp-10.1177_17470218221096452 for Crossmodal associations between visual textures and temperature concepts by Francisco Barbosa Escobar, Carlos Velasco, Derek Victor Byrne and Qian Janice Wang in Quarterly Journal of Experimental Psychology
Footnotes
Declaration of conflicting interests
The author(s) declared no potential conflicts of interest with respect to the research, authorship, and/or publication of this article.
Funding
The author(s) disclosed receipt of the following financial support for the research, authorship, and/or publication of this article: This research was supported by a Carlsbergs Foundation Young Researcher Fellowship received by Qian Janice Wang.
Data availability statement
References
Supplementary Material
Please find the following supplemental material available below.
For Open Access articles published under a Creative Commons License, all supplemental material carries the same license as the article it is associated with.
For non-Open Access articles published, all supplemental material carries a non-exclusive license, and permission requests for re-use of supplemental material or any part of supplemental material shall be sent directly to the copyright owner as specified in the copyright notice associated with the article.