



Abstract
Updating spatial representations in visual and auditory working memory relies on common processes, and the modalities should compete for attentional resources. If competition occurs, one type of spatial information is presumably weighted over the other, irrespective of sensory modality. This study used incompatible spatial information conveyed from two different cue modalities to examine relative dominance in memory updating. Participants mentally manoeuvred a designated target in a matrix according to visual or auditory stimuli that were presented simultaneously, to identify a terminal location. Prior to the navigation task, the relative perceptual saliences of the visual cues were manipulated to be equal, superior, or inferior to the auditory cues. The results demonstrate that visual and auditory information competed for attentional resources, such that visual/auditory guidance was impaired by incongruent cues delivered from the other modality. Although visual bias was generally observed in working-memory navigation, stimuli of relatively high salience interfered with or facilitated other stimuli regardless of modality, demonstrating the processing symmetry of spatial updating in visual and auditory spatial working memory. Furthermore, this processing symmetry can be identified during the encoding of sensory inputs into working-memory representations. The results imply that auditory spatial updating is comparable to visual spatial updating in that salient stimuli receive a high priority when selecting inputs and are used when tracking spatial representations.
Introduction
When walking along a street, pedestrians may both hear and see an approaching vehicle. In this example from daily life, people rely on sensory input derived simultaneously from visual and auditory modalities to perceive and localise individual objects. Spatial inputs from these modalities are temporarily encoded into a short-term storage known as working memory (Baddeley, 1992, 2012; Cowan, 1999, 2016; Ricker et al., 2010) and are retrieved from storage to update spatial representations in the service of concurrent behavioural goals (e.g., avoiding the path of a vehicle). Because we can integrate multiple modalities to experience sensory events in everyday life, some research has focused on a multisensory perspective of working memory (e.g., Lehnert & Zimmer, 2008a, 2008b; Martinkauppi et al., 2000; for a review, see Quak et al., 2015) and investigated sensory processes that are specific to visual or auditory spatial features and the interactions of the two modalities in a spatial domain.
Spatial working memory is considered as a type of short-term storage that keeps track of spatial representations and functions as a component akin to a visuospatial sketchpad (Baddeley & Hitch, 1974). To date, evidence supporting theories of spatial working memory (e.g., Alvarez & Cavanagh, 2004; Awh et al., 2007; Kursawe & Zimmer, 2015) have been obtained mainly from studies using visual materials (for reviews, see Luck & Vogel, 2013; Mance & Vogel, 2013). In those studies, spatial working memory was defined as a workspace for visual spatial information (Baddeley & Hitch, 1974; Logie, 2003, 1995, 2011). This memory workspace for spatial representations has been associated with two types of information processing: the non-spatial qualities of visual objects (e.g., colour or shape), and purely spatial information (e.g., sequences of object movements; Logie & Pearson, 1997; Shimi & Logie, 2019). In a core system under attentional control, elements of the latter, which derive from dynamic information such as sequences of movements or route pathways, are retained by mentally repeating the locations stored in working memory (Awh et al., 1998; Awh & Jonides, 2001; Logie, 2011; Smyth & Scholey, 1994).
Although further evidence for theories regarding the maintenance function of auditory spatial information is needed, a general consensus has formed that the auditory system is analogous to the visual system in terms of spatial working memory (e.g., Alain et al., 2008, 2009; Delogu et al., 2012b; Delogu & McMurray, 2019; Kaiser, 2015; Lewald & Ehrenstein, 2001; Vuontela et al., 2003). Thus, auditory input would be subdivided into non-spatial (i.e., what) and spatial (i.e., where) information (e.g., Alain et al., 2009; Delogu et al., 2012a). Consistent with this perspective, some studies of spatial working memory (Lehnert & Zimmer, 2006; Loomis et al., 2012; Maezawa & Kawahara, 2021) have argued that visual and auditory spatial information are maintained and updated in a modality-general subsystem of working memory by recursive reactivation via controlled attention, similar to the attentional rehearsal system of the visuospatial sketchpad (Awh et al., 1998). Thus, extant studies have focused on the overlap of attentional resources across modalities. The accumulated evidence favours the shared perspective of attentional resources (Driver & Spence, 2004; Fougnie et al., 2018; Krumbholz et al., 2009; Lehnert & Zimmer, 2008a, 2008b; Martinkauppi et al., 2000) over the separate perspective (Bushara et al., 1999; Kong et al., 2014; Michalka et al., 2016; Sinnett et al., 2007).
Given this shared perspective of attentional resources in spatial working memory (Lehnert & Zimmer, 2008a; Martinkauppi et al., 2000), we have argued that visual and auditory representations are updated by relying on common processes (Maezawa & Kawahara, 2021). Working-memory representations are updated at minimal cost, regardless of whether this requires switching from the current modality to another modality. Thus, similar to some authors (e.g., Martinkauppi et al., 2000), Maezawa and Kawahara have focused on modality-specific influences on navigation and ruled out this possibility, implying that auditory spatial representation is equivalent to visual spatial representation and is integrated into a modality-general code. Importantly, this modality-general perspective also posits that bimodal stimuli, such as pairs of pictures and sounds appearing in temporal and spatial proximity, should compete for attentional resources in the process of updating working memory. Information prioritisation between the two stimuli is then required (Cocchini et al., 2002; Fougnie et al., 2015). This competition would result in selective interference such that one of the stimuli is interfered with or ignored in favour of the other (Fougnie & Marois, 2009, 2011).
Notably, this prioritisation is characterised by visual dominance (Bertelson & Aschersleben, 1998; Bolognini et al., 2007; McGurk & MacDonald, 1976) although attentional resources are shared in processing representations from different modalities (Spence & Driver, 1997). This asymmetrical perspective has been supported by studies of multimodal attention orientating (Spence & Driver, 1997). Specifically, visual localisation performance was improved when auditory spatial cues appeared at the visual target location, whereas auditory localisation performance was not improved when visual cues appeared. The opposite form of asymmetry has also been reported (Ward, 1994; Ward et al., 2000). This processing asymmetry between visual and auditory representations (Gonzalez-Franco et al., 2017; Lukas et al., 2010; Tomko & Proctor, 2017) may be attributed to differences in the spatial resolution of given audiovisual stimuli (Spence et al., 2004; Ward et al., 2000), as implied by capacity differences indicating that an auditory stimulus places a greater capacity load on working memory than does a visual stimulus during maintenance (Alvarez & Cavanagh, 2004; Fougnie & Marois, 2011). Because of the coarse spatial resolution of auditory perception, the spatial range in which information processing is enhanced by auditory stimuli does not overlap with the range of locations where visual stimuli appear. For instance, an auditory cue does not correspond to a single visual object; it is associated with a group of multiple visual objects, resulting in less validity than visual cues that can form a one-to-one correspondence with a target representation in spatial working memory (Botta et al., 2013, 2011).
Importantly, such processing asymmetry does not reflect absolute dominance of the visual modality. Rather, it reflects the relative salience of the relevant stimulus modalities. This relativity has been shown in the finding that visual dominance is reversed by decreasing the spatial discriminability of visual stimuli (Alais & Burr, 2004). In fact, the dominant modality is determined according to a multisensory integration process of weighting stimuli based on signal reliability, as defined by the probability distributions of the visual and auditory signals (Battaglia et al., 2003). For example, Alais and Burr (2004) found that auditory inputs were preferred over visual inputs in perceptual judgements of audiovisual localisation, although simultaneous visual events needed to be degraded by extensive defocusing. Similar to these findings from perceptual research (Alais & Burr, 2004; Battaglia et al., 2003), spatial dominance of auditory over visual inputs may occur during encoding or retrieval of selective information in spatial working memory. If this is the case, spatial representations should be updated in working memory based on inputs from auditory stimuli with high access to information relevant to a current task.
Thus, the scope of this study comprised the potential for asymmetrical or symmetrical prioritisation of competing visual and auditory information during a spatial update, with a focus on processing dominance when two competing types of spatial information are conveyed simultaneously through different modalities. The experiments employed a mental-pathway task (Cornoldi et al., 1991; Kerr, 1993; Maezawa & Kawahara, 2021) in which participants mentally manoeuvred a target location, according to visual or auditory directional cues, and directed the target to a designated goal location. During this working-memory navigation, visual and auditory directional cues appeared synchronously to indicate different directions. Participants were required to attend to one of the two modalities while ignoring the other. The relative perceptual saliences of the two modalities were manipulated to reverse processing dominance between the two working-memory representations. We predicted that when updating these representations, salient stimuli, irrespective of modality, would receive a high priority (reflected by navigation accuracy).
This study consisted of 12 experiments that involved manipulating the perceptually dominant modality, either vision or audition. Experiments 1A–1C were designed to equalise, reduce by 50%, and increase by 50% the discriminability of visual dot motion (i.e., the number of correct responses in a particular coherence), compared with auditory discriminability. Experiments 2A–2D replicated Experiments 1A–1C but added a condition involving a 23% reduction in visual discriminability compared with auditory discriminability (Experiment 2C). These experiments used the same spatial-updating task to measure the accuracy of working-memory navigation. Experiment 2A was replicated with the implementation of articulatory suppression, thus examining the impact of verbal labelling on navigation. Within an individual experiment, two measurements of updating accuracy were calculated and compared: the percentage of correct responses and the difference between the estimated and actual target location.
Working memory navigation tasks require the updating of spatial information, which involves not only the selection and encoding of new inputs, but also the maintenance, suppression, selection, or replacement of new or old information. Whether the visual or auditory modality is dominant depends on updating processes, as suggested by the finding that the use of spatial information can be biased towards a particular modality (e.g., visual) according to the stage (e.g., encoding; see Lehnert & Zimmer, 2008b). However, because processing symmetry in the visual and auditory modalities occurs in the context of perceptual judgements of audiovisual localisation (Alais & Burr, 2004), selective prioritisation would also consistently occur in working memory updating (Experiments 1 and 2) and encoding tasks. Thus, we examined this consistency using a direction discrimination task; Experiments 3A–3D involved a discrimination task, which was used instead of a working memory task for measurement of discrimination accuracy, and to assess the ability to interpret memory inputs during the early stages of updating processes (e.g., encoding).
Experiment 1A
Before addressing the main question regarding processing symmetry between visual and auditory spatial working memory, we examined the similarity of these memory-updating functions to identify modality-general attentional resources (Maezawa & Kawahara, 2021). Experiment 1A used a mental-pathway task (Cornoldi et al., 1991; Kerr, 1993) in which participants mentally manoeuvred to a target location in response to visual and auditory directional cues that were presented simultaneously. Participants directed their attention to one of the two modalities while ignoring the other. Experiment 1A consisted of two conditions of cue directional congruence, with the to-be-attended visual (or auditory) cues indicating a direction that was either incongruent or congruent with the to-be-ignored auditory (or visual) cues’ direction. Subsequently, we compared the updating-accuracy values in working-memory navigation between these conditions. The concept of selective interference (Cocchini et al., 2002; Fougnie et al., 2015) suggests that two sets of information conveyed from different modalities should compete for attentional resources under the incongruent condition. Thus, navigation accuracy would decrease if processing of the two stimuli employed the same cognitive resources (see also Fougnie & Marois, 2009, 2011). Alternatively, if separate processes for updating spatial representations were employed for each modality, navigation accuracy would not decrease due to the negligible interference effects.
Method
Participants
A total of 30 students recruited from Hokkaido University (16 males; mean age = 21.0 years, range = 18–32 years) participated in Experiment 1A for monetary compensation or course credit. We chose this sample size to match the participant number in our previous study (Maezawa & Kawahara, 2021), which examined the effects of modality on working-memory navigation. All participants had normal or corrected-to-normal visual acuity, and none reported any hearing impairment. The present study (i.e., all experiments) was approved by the Human Research Ethics Committee of Hokkaido University, Japan, and all participants provided written informed consent prior to participation in the experiment.
Visual stimuli
Visual stimuli were displayed against a black background on a 24-in. LCD monitor (100 Hz refresh rate, 1,920 × 1,080 pixels, XL2411T; BenQ). Stimulus presentation was controlled by a Linux-operated PC using MATLAB software (The MathWorks) with Psychophysics Toolbox extensions (Kleiner et al., 2007). The viewing distance was approximately 57 cm. For the mental-pathway task, a white unfilled matrix (24.2° × 24.2°) consisting of 11 × 11 cells was displayed at the centre of the screen. Each cell subtended a visual angle of 2.2° × 2.2°. The initial target location for the working-memory navigation, determined randomly on every trial, was indicated by a red square filling one of the cells (2.2° × 2.2°). The visual directional cues consisted of random-dot displays in coherent motion (Figure 1a). The displays contained 100 white dots, each subtending an angle of 0.03° × 0.03°, presented inside a red rectangular frame (2.8° × 2.8°) at the centre of the monitor. Motion coherence was determined by the percentage of dots (up to 100%) moving in the same direction (i.e., right, left, up, or down). The velocity of all dots was fixed at 21.9°/s.

Visual and auditory directional cues. (a) Visual directional cues were displayed as moving random dots. (b) Auditory directional cues consisting of virtual sounds moving relative to head position. The sound sources travelled a large distance relative to another type of auditory cue shown in the next panel. (c) Auditory directional cues moving a short distance.
Auditory stimuli
Auditory stimuli were presented through AKG K371 headphones (5–40 kHz) at a comfortable listening level (approximately 60 dB); the presentation was controlled by a Linux PC with an audio chipset (Sound BlasterX AE-5; Creative Technology). The auditory directional cues consisted of moving sound sources based on a white Gaussian noise (1,000 ms at 44.1 kHz with 16-bit depth). The cues were generated using MATLAB software. To simulate virtual sound sources for the right, left, up, or down direction, the white noise sound clip was converted into a first-order ambisonics format with SN3D normalisation by implementing an audio plugin for a digital audio workstation (Oculus Spatializer; Oculus VR). By applying a filter of head-related transfer functions using a subset of the HRTF database (Acoustics Research Institute, retrieved from https://www.oeaw.ac.at/en/isf/das-institut/software/hrtf-database), the ambisonics format file was decoded to a virtual sound. The head-related transfer functions were measured at 2.5° spacing within an azimuth angle of ±45°, 5° spacing outside this range, and 5° spacing within the elevation angle.
Figure 1b shows each virtual sound source positioned on the surface of an imagery sphere with a triple-coordinate system in units of 1 m, where the participant’s head is at the centre of the sphere (i.e., the origin of the coordinate system). For the right directional cue, the sound source moved horizontally along a straight line from a left-side point (x = −1 m) to a right-side point (x = 1 m), fixed by the height of the participant’s ears (y = 0 m) and the depth in front of the participant (z = −1 m). For the left directional cue, the source moved horizontally in the direction opposite to the right directional cues (from x = 1 to −1 m). For the up and down directional cues, the horizontal coordinate of the source was fixed at the midline (x = 0 m). The sources moved linearly upward from a position at a height of y = −3 m and a depth of (a front) z = −6 m to a position at a height of y = 2 m and a depth of z = −1 m, or downward from a position at a height of y = 2 m and a depth of z = −1 m to a position at a height of y = −3 m and a depth of z = −6 m. The source took 1 s to move from one end of the coordinates to the other end. To improve participants’ discrimination performance with the auditory directional cues, the sound level was modified depending on the source position on the surface of the sphere. Specifically, for the right and left cues, the level was highest (0 dB) in front of the participant and lowest (−14 dB) at both ends of the horizontal axis. For the up and down cues, the level was at the maximum (0 dB) value at the beginning of the movement and at the minimum at the end of the movement (−28 dB).
Hearing pre-test
Participants completed the three tasks in the following order: hearing pre-test for auditory stimuli, coherence adjustment, and the mental-pathway task. The hearing pre-test aimed to measure participants’ ability to identify the direction of stereophonic sounds. This task consisted of two stages. In the first familiarisation stage, the right, left, up, and down stimuli were presented six times each, in that order. During the auditory presentation, a visual white arrow indicating the direction corresponding to the sound direction was displayed in the centre of the screen. In the second discrimination test stage, participants were required to identify the direction of cues presented in a pseudo-random order. Participants reported the direction of the cue by pressing the “d,” “a,” “w,” or “s” key for the right, left, up, and down directions, respectively. The discrimination task consisted of 12 trials for each direction, for a total of 48 trials. When participants gave an incorrect answer, they received visual feedback on the correct direction, indicated by a white arrow on the screen. We calculated the percentage of correct responses for each participant across directions. The mean accuracy across participants was 96.74% (SD = 3.27).
Coherence adjustment
Motion coherence was determined using the Parameter Estimation by Sequential Testing (PEST) procedure (see Hall, 1974; Taylor & Creelman, 1967) to establish discrimination accuracy for the visual directional cues to be equalised with the auditory discrimination accuracy across the four directions measured by the auditory pre-test. The visual discrimination thresholds were calculated according to the total percentage of correct responses for a particular coherence parameter, such as the percentage of dots moving in the same direction, up to 100%. This coherence adjustment was conducted individually for each participant. The test was based on a direction discrimination task wherein participants indicated the direction of dots’ movement by pressing the “d,” “a,” “w,” or “s” key for the right, left, up, or down directions, respectively. In the PEST procedure, stimulus of the same coherence (“testing level”) was presented repeatedly; the percentage of correct responses was calculated at the given testing level for each trial. If the current correct-response rate deviated from an expected probability of correct responses for that participant, the parameter of visual coherence was increased or decreased in accordance with the step size, beginning at 16% of the dot motion. Specifically, the coherence increased if the measured response rate was lower than the expected probability, while it decreased if the measured response rate was higher than the expected probability. In accordance with the PEST rules (Taylor & Creelman, 1967), the step size (%) was sequentially divided by 2 when the direction of current increasing/decreasing of visual coherence was reversed (i.e., the increasing direction shifted to the decreasing direction, or vice versa). A deviation between the correct response rate and the expected probability was allowed to continue at the current testing level while the mathematical difference of the two probabilities did not exceed a predefined parameter of “deviation limit.” These relationships were formulated as an equation of |Nc − P*Nt| > W, where Nc is the number of correct responses, Nt is the number of trials, P is the expected probability, and W is the deviation limit for changing the testing level. In the present study, the deviation limit W was set at 0.75 for the four-alternative forced choice (Hall, 1974). The initial coherence parameter was set at 40%. The sequence of the pre-test ended when the step size reached 1%. Moreover, if the accuracy of the auditory discrimination measured by the hearing pre-test was 100%, the run ended after 30 consecutive correct responses. We defined the testing level at the end of trials as the estimated coherence that determined the visual discriminability. Before participants undertook the pre-test, 12 practice trials were conducted. The PEST result representing mean coherence across participants was 30.80% (SD = 12.60).
Mental-pathway task
The mental-pathway task was divided into two blocks with respect to the to-be-attended-modality conditions. In the attend–visual block, vision was the to-be-attended modality; participants attended to the visual directional cues while ignoring the auditory stimuli as task-irrelevant navigation cues. Similarly, in the attend–auditory block, participants attended to the auditory directional cues while ignoring the visual directional cues. The order of administration of to-be-attended-modality blocks was counterbalanced across participants. The procedure of the mental-pathway task was modified from a measure used by Maezawa and Kawahara (2021) so that the bimodal stimuli were presented during working-memory navigation (Figure 2).

Schematic example of a trial sequence in Experiment 1.
Each trial began with the presentation of a white fixation cross (0.2° × 0.2°) in the centre of the screen for 1,000 ms. After the fixation cross display, the white unfilled matrix was presented for 5,000 ms. The initial location of the working-memory navigation was indicated by a red square that was pseudo-randomly selected within 121 cells of the matrix. Participants were instructed to memorise the initial location of the navigation. After viewing the initial target location, a blank screen appeared for 1,000 ms, followed by simultaneous presentation of the sequence of visual and auditory directional cues to be attended to or ignored on the screen or through the headphones. In this sequence, each visual and auditory directional cue (one to-be-attended cue and one to-be-ignored cue) was presented for 1,000 ms, with cues separated by a blank screen for 1,000 ms. The sequence consisted of eight presentations of the cue displays. The directions were pseudo-randomly determined for each presentation; thus, they could either differ among cues or point in the same direction. After presentation of the directional cues, the matrix appeared on the screen, without the initial target location, until participants responded. Participants identified the destination of the working-memory navigation by using a mouse to click on the corresponding cell in the matrix.
At the beginning of each to-be-attended-modality block, participants were informed whether the to-be-attended modality would be vision or audition. Trials under the congruent and incongruent directional conditions using the bimodal stimuli were intermixed within each block. Directional congruence was randomly determined for each trial. In the “congruent” trials, the visual and auditory cues (one to-be-attended cue and one to-be-ignored cue) indicated the same direction: to the right, left, up, or down. In the “incongruent” trials, the two cues indicated different directions; thus, the to-be-ignored cues would impair working-memory navigation guided by the to-be-attended cues. To simplify the descriptions, we refer to the “incongruent” and “congruent” trials in the attend–visual and attend–auditory blocks as attend–auditory/visual–incongruent and attend–auditory/visual–congruent trials. Participants were instructed not to use verbal labelling of matrix locations, (such as using row or column numbering or vocalising of the direction of travel) or finger pointing during navigation. In each modality block, participants completed a total of 20 trials consisting of 10 trials under the congruent and 10 trials under the incongruent direction conditions to obtain data for the three tasks (i.e., the hearing-pre-test, coherence-adjustment, and mental-pathway) for testing periods of approximately 60 min in total.
Data analysis
Updating accuracy in the percentage of correct responses
All statistical analyses were conducted using R software (version 4.1.0; 18 May 2021, retrieved from http://www.R-project.org). Correct responses were averaged separately for each block of to-be-attended-modality modes (attend–visual block or attend–auditory block) and the directional congruence of the cues (incongruent or congruent). The mean percentage of correct responses was subjected to a two-way repeated-measures ANOVA that included the two within-subject factors (i.e., attended modality and directional congruence of the cue) with an alpha level of .05. Model assumptions were evaluated by Mauchly’s sphericity test; the degrees of freedom and p-values were corrected by Chi-Muller’s epsilon (з) if the data deviated from sphericity. We reported a generalised eta-squared (ηG2) for estimating effect sizes. Furthermore, we reported simple main effects to resolve the interaction.
Response deviation from actual target location
Calculation of the percentage of correct responses was based on only 10 trials per each condition, as mentioned in the mental-pathway task procedure. This could impair data continuity and only allow measurements in 10% increments. Thus, the reliability of behavioural measures changed depending on the number of task trials (e.g., Enkavi et al., 2019). Because of this concern, we also evaluated updating accuracy in terms of the deviation of a response location from the correct target location. Specifically, task accuracy was measured as the distance in terms of the number of cells between the estimated location (i.e., the response location) and the correct location, using horizontal or vertical movement. For example, if a participant gave a correct response in a trial, the distance was 0. If a participant gave an incorrect response and indicated a cell next to the target in the vertical/horizontal direction, the distance was 1. Figure 3 displays other examples. The mean response deviation in terms of the number of cells was calculated for each condition of the to-be-attended-modality block and the directional congruence of the cues. Therefore, this measurement of deviation allowed us to obtain continuous dependent values suitable for analysis of variance (ANOVA). The data were subjected to the same ANOVA as in the correct-percentage analysis.

Distance between estimated and correct target locations.
Response times
Our primary measures in the mental-pathway task were updating accuracy in terms of the percentage of correct responses and the deviation in responses. Thus, we did not instruct participants to respond quickly to the target destination during the mental-pathway task (i.e., in Experiments 1 and 2). The response-time data in this and subsequent experiments are provided in the online Supplementary Material A as mean values across all trials, including correct and incorrect responses.
Results
Experiment 1A examined whether interference of updating accuracy would occur when two modality navigations were selectively competing. Participants attended to visual directions (attend–visual block) or auditory directions (attend–auditory block) while ignoring incongruent/congruent directions from the opposite modality (auditory in the attend–visual block or visual in the attend–auditory block). The interference effect would be reflected by lower accuracy in the “incongruent” trials of the directional congruence between to-be-attended and to-be-ignored cues, compared with the “congruent” trials. We also focused on whether a modality effect would occur, such that a superior modality could be identified in the updating process. This effect would be reflected in overall high/low performance in specific to-be-attended-modality blocks. The results of simple-effects analysis in Experiment 1A are shown in Table 1.
Summary of simple-effects analysis in Experiment 1.
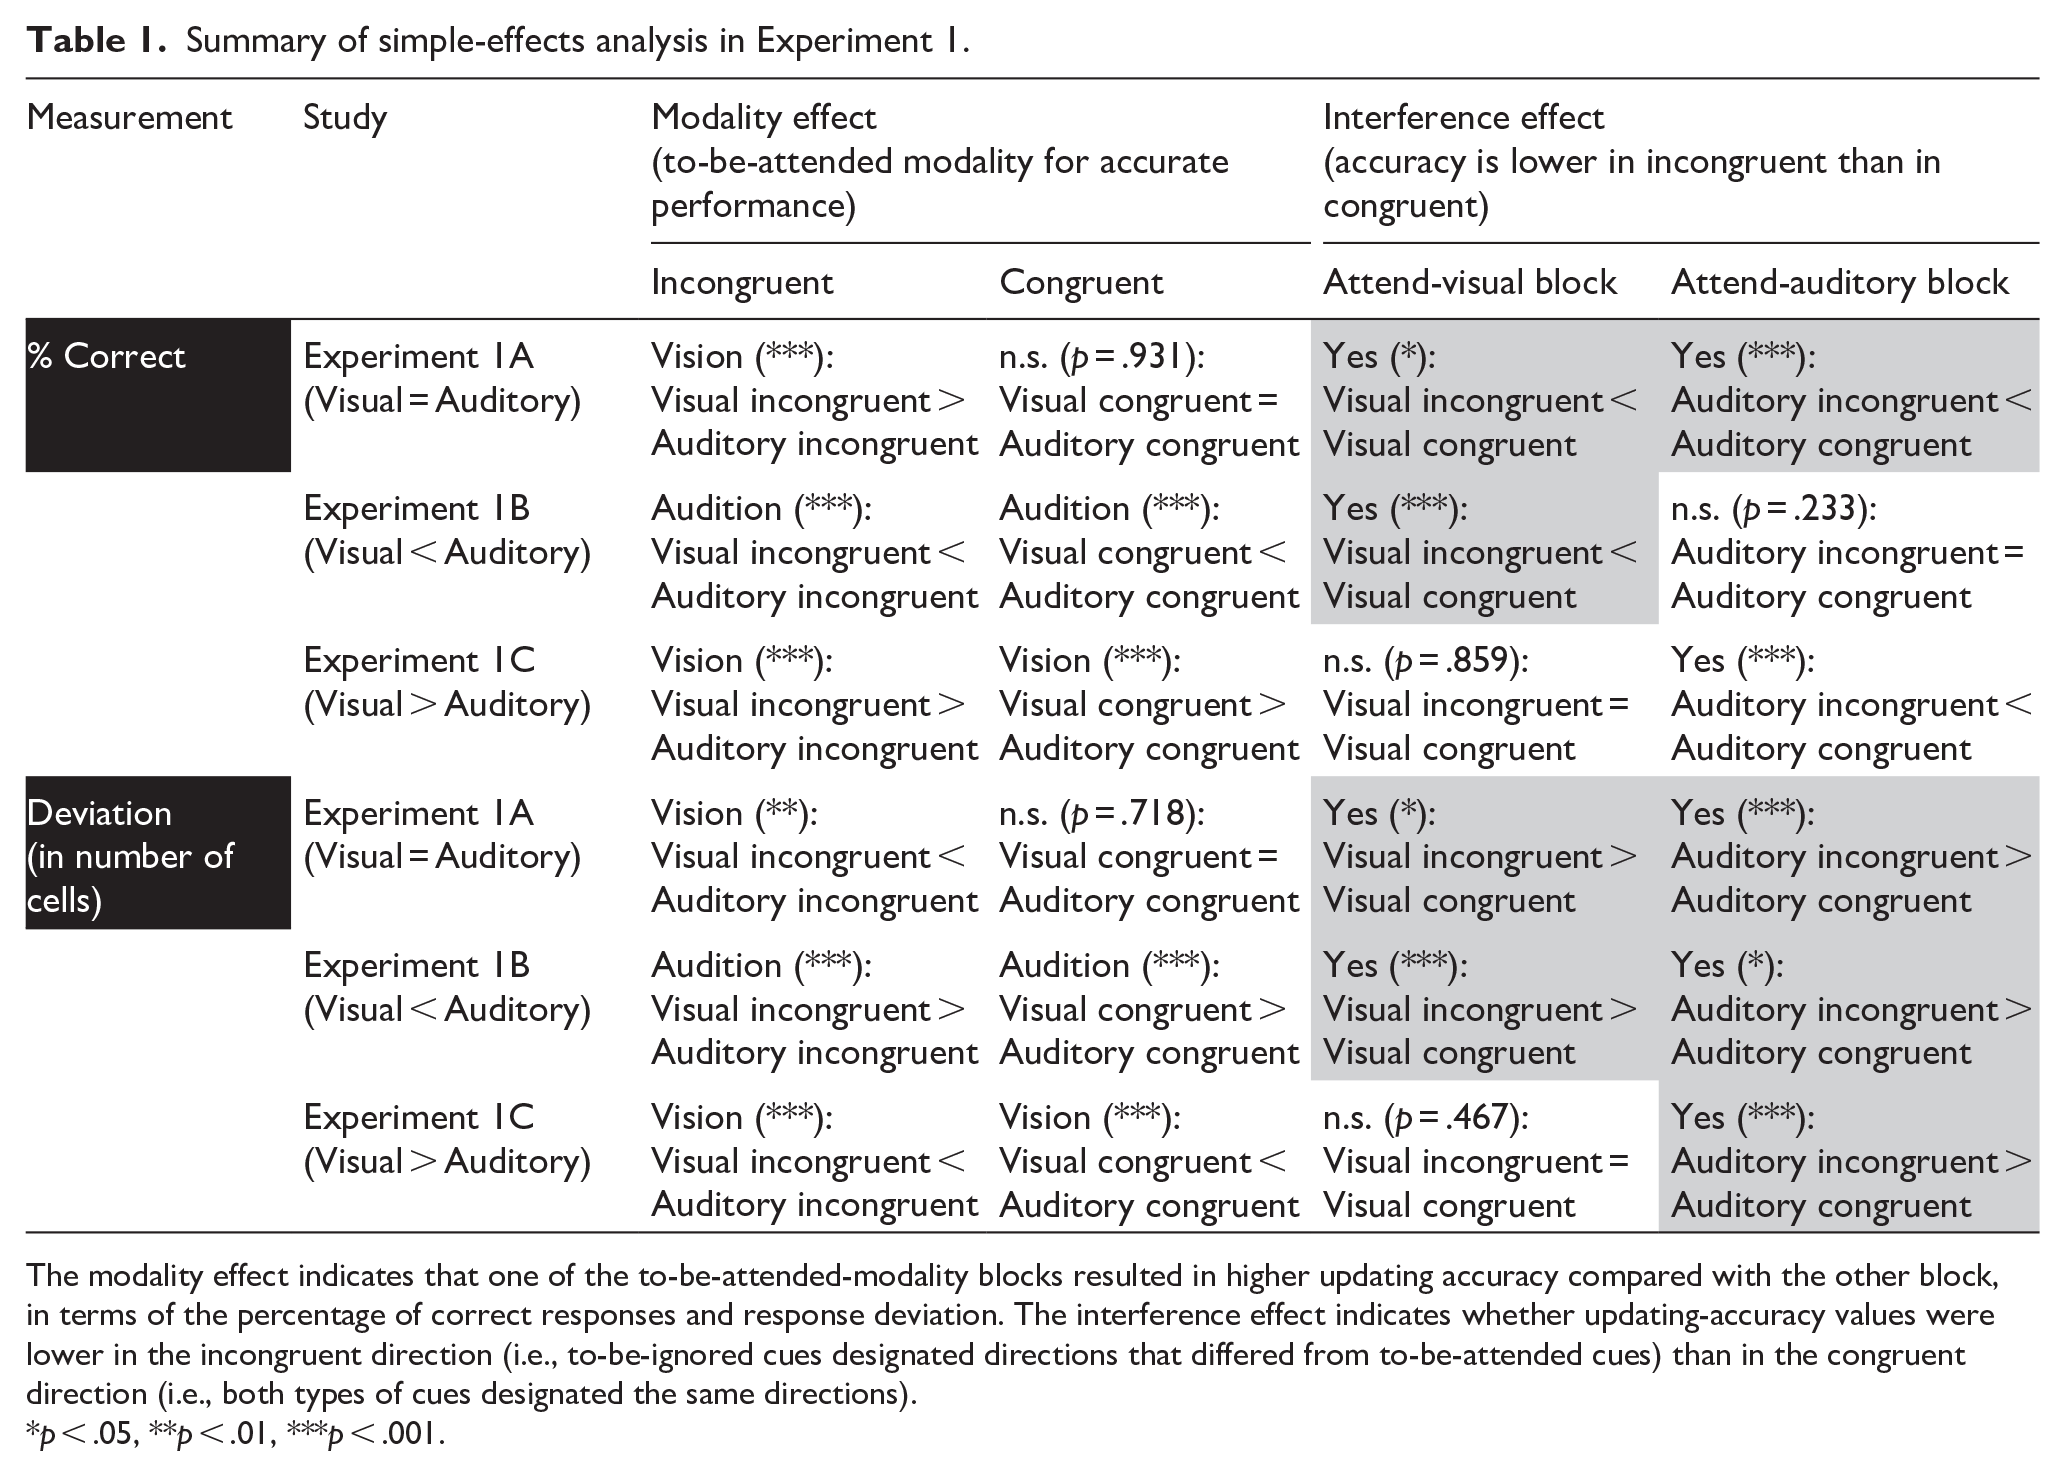
The modality effect indicates that one of the to-be-attended-modality blocks resulted in higher updating accuracy compared with the other block, in terms of the percentage of correct responses and response deviation. The interference effect indicates whether updating-accuracy values were lower in the incongruent direction (i.e., to-be-ignored cues designated directions that differed from to-be-attended cues) than in the congruent direction (i.e., both types of cues designated the same directions).
p < .05, **p < .01, ***p < .001.
The mean percentages of correct responses and response deviations are shown in Figures 4a and 5a. The results reveal that updating-accuracy values were degraded when to-be-attended cues (vision or audition) indicated directions incongruent with to-be-ignored modality cues (audition or vision), compared with when to-be-attended cues indicated directions congruent with the to-be-ignored cues. This interference effect occurred irrespective of the to-be-attended-modality. Details of the ANOVA results, including statistics, are shown in the online Supplementary Material B.

Updating accuracy in terms of the percentage of correct responses in Experiment 1. (a) Updating accuracy when visual discriminability was equal to auditory discriminability (Experiment 1A). (b) Accuracy when visual discriminability was 50% lower than auditory discriminability (Experiment 1B). (c) Accuracy when visual discriminability was 50% greater than auditory discriminability (Experiment 1C).

Updating accuracy in terms of response deviation in Experiment 1. (a) Experiment 1A. (b) Experiment 1B. (c) Experiment 1C.
Discussion
The discriminability of the visual and auditory directional cues was equalised by adjusting coherence prior to the main task of working-memory navigation in Experiment 1A. In this mental-pathway task, participants were required to attend selectively to the visual or auditory directional cues to update an imaginary target location, while simultaneously presented with to-be-ignored-modality cues; the directions of the to-be-ignored-modality cues could be incongruent or congruent with the to-be-attended cues. The results show that updating-accuracy values, in terms of the percentage of correct responses and response deviation from the correct cell location, were lower in the attend–visual/auditory–incongruent trials (i.e., the two cues’ directions were incongruent) than in the attend–visual/auditory–congruent trials (i.e., the two cues’ directions were congruent). Thus, the interference effect, reflected by lower performance in the “incongruent” trials than in the “congruent” trials, was observed irrespective of the attend–visual or attend–auditory block. This interference implies that competition between the two modalities (i.e., the to-be-attended modality and the to-be-ignored modality) occurred during updating of spatial locations. This supports the notion that visual and auditory spatial working memory share common attentional resources (Cocchini et al., 2002; Fougnie et al., 2015), consistent with the similarity of the updating functions (Maezawa & Kawahara, 2021).
Experiment 1A showed weak interference depending on the to-be-attended-modality blocks, reflected by the significant interaction term. Specifically, this effect reflected lower accuracy in the “incongruent” trials, reducing performance more severely in the attend–auditory block than in the attend–visual block, similar to the lower performance in the attend–auditory–incongruent trials than in the attend–visual–incongruent trials (Figures 4a and 5a). Thus, the navigation in a particular to-be-attended-modality block received greater interference from to-be-ignored modality cues, when the to-be-ignored modality was visual. This finding implies that visual representations dominate auditory representations in the spatial-updating processes in working-memory navigation. This visual-dominance phenomenon might have been observed because the updating task in this study was based largely on visual spatial working memory, such that participants were required to update visually presented target locations and visualise their destinations.
However, visual dominance can be weakened or reversed to auditory dominance, depending on the degree of spatial discriminability of the visual relative to the auditory inputs (Alais & Burr, 2004). Such reversal presumably occurs because observers are able to weight one of the memory inputs and selectively extract spatial information from this modality input; in the context of navigation competition, the input with the most available information would be weighted as being a more reliable resource. This prioritising process is ecologically important, in that working-memory representations can be updated without loss of location information by using high-salience stimuli. In contrast, the concept of absolute visual dominance allows the possibility that observers could rely primarily on visual stimuli of low salience, even though such stimuli are spatially disregarded cues in working-memory navigation. The use of noisy visual directional cues would not lead to accurate navigation. Therefore, the main scope of the present findings rejects the possibility of absolute visual dominance during updating of working The subsequent experiments, 1B and 1C, examined whether visual dominance would also occur when the perceptual superiority of visual over auditory discriminability was adjusted or even reversed.
Experiments 1B and 1C
Experiments 1B and 1C examined whether the visual or auditory modality dominated the process of updating spatial representations when two competing types of information (i.e., visual and auditory) were conveyed simultaneously. To this end, we employed the PEST methods to manipulate independently the discrimination thresholds of visual directions in Experiments 1B and 1C so that auditory discriminability exceeded visual discriminability (Experiment 1B) and the reverse (Experiment 1C). The mental-pathway task in Experiments 1B and 1C was identical to the task used in Experiment 1A. Subsequently, we compared the updating accuracy achieved under the condition of selectively attending to the visual directional cues (i.e., the attend–visual block) with that achieved under the condition of attending to the auditory directional cues (i.e., the attend–auditory block). The principle of visual dominance in spatial processing (e.g., Botta et al., 2011, 2013) suggests that participants should rely on visual rather than auditory directional cues during navigation, even when visual discriminability is inferior to the auditory cue. However, it has been hypothesised that this processing asymmetry depends on the relative availability of visual and auditory sensory inputs (Alais & Burr, 2004; Battaglia et al., 2003). Visual dominance would thus be expected when visual stimuli are more readily available than auditory stimuli (i.e., visual discriminability is higher than auditory discriminability). The opposite should be true when auditory stimuli are more readily available than visual stimuli, resulting in more frequent updating of auditory spatial representations relative to visual ones.
Method
Participants
A total of 30 students (17 males; mean age = 20.0 years, range = 18–25 years) participated in Experiment 1B, and a different set of 30 students participated in Experiment 1C (10 males; mean age = 20.0 years, range = 18–25 years). All participants had normal or corrected-to-normal visual acuity, and none reported any hearing impairment.
Visual and auditory stimuli
Table 2 shows a summary of the visual and auditory stimulus conditions, in terms of the relative perceptual superiority of the visual and auditory directional cues, across the experiments. In Experiments 1B and 1C, the apparatus and stimuli were the same as those used in Experiment 1A, except that the auditory directional cues used in Experiment 1C were based on sound sources moving a short distance (Figure 1c). Specifically, these auditory stimuli were modified to shorten the travel distances of the sound sources (auditory short-distance cues) compared with the auditory long-distance cues in Experiments 1A and 1B, so that auditory spatial discriminability was relatively degraded. The sound sources generated white Gaussian noise (1,000 ms). With respect to the right-side direction, the sound source moved horizontally from the centre position (x = 0 m) to a right-side position (x = 0.2 m) at the height of the participant’s ears (y = 0 m) and a depth in front of the participants of z = −1 m. With respect to the left-side direction, the source moved horizontally from the centre to a left-side position (from x = −0.2 m). With respect to the up and down directions, the horizontal coordinates were fixed in front of the participant’s head (x = 0 m). The sources moved vertically upward from a position at a height of y = 0 m and depth z = −2 m to a position at height y = 1 m and depth z = −1 m, or downward from a position at a height of y = 1 m and depth z = −1 m to a position at a height of y = 0 m and depth z = −2 m. It took 1 s for the source to travel from one end of the coordinates to the other. The sound level was constant at the source position.
Summary of the visual- and auditory-stimulus conditions.

PEST: Parameter Estimation by Sequential Testing; SD: standard deviation.
Pre-test and mental pathway tasks
Two pre-tests for listening to auditory cues and coherence adjustment were administered prior to the mental-pathway task in Experiments 1B and 1C. The procedures of these three tasks were almost identical to those used in Experiment 1A. Notably, Experiments 1B and 1C were designed to vary, rather than to equate, visual and auditory discriminability, and visual coherence was adjusted individually for each participant. Specifically, in Experiment 1B, visual discriminability was 50% below auditory discrimination accuracy across four directions previously measured by the hearing pre-test (visual < auditory, see Table 2). Similarly, in Experiment 1C, visual discriminability was 50% above (up to 100%) auditory discrimination accuracy (visual > auditory) for each participant. The visual discriminability adjusted by the PEST procedure was set to avoid falling below 25%, which is the chance level of a four-alternative forced choice. Thus, we did not recruit participants into the study if their accuracy in a hearing pre-test was less than a pre-defined “lower accuracy limit.” 1 For example, the lower limit of the hearing pre-test score was set at 75% in Experiment 1B. If a participant’s score was below this accuracy level (e.g., 50%), the PEST procedure would be required to adjust the visual discriminability to 0% accuracy (i.e., the PEST procedure would establish the visual discriminability of 50% minus 50% in this “visual < auditory” condition). For a similar reason, the lower accuracy limit in Experiment 1C was set at 25%.
The hearing pre-test results showed that the 60 participants who were recruited in the working-memory navigation task exhibited accuracy values higher than the predefined limit. The mean accuracy values across participants were 95.42% (SD = 4.49) in Experiment 1B and 68.54% (SD = 12.15) in Experiment 1C. The minimum accuracy values across participants were 77.08% in Experiment 1B and 45.83% in Experiment 1C. Thus, visual-discrimination performance was never below the level of chance in these experiments. Indeed, the pre-test for coherence adjustment showed mean coherences of 10.20% (SD = 4.92) in Experiment 1B and 40.60% (SD = 6.65) in Experiment 1C across participants.
Data analysis
We calculated the mean updating accuracy for each participant, in terms of the percentage of correct responses and response deviation from the actual target location; we subjected the results to the same ANOVA as in Experiment 1A. We reported simple main effects to resolve the interaction. The response-time data are shown in the online Supplementary Material A.
Results
Table 1 shows the results of simple-effects analysis for Experiments 1B and 1C. In these experiments, we examined which to-be-attended-modality block resulted in higher updating accuracy, in terms of the percentage of correct responses and response deviation. We also examined whether the incongruent directions of the to-be-ignored modality cues interfered with performance while attending to the current modality. The results were expected to identify modality and interference effects, respectively. Details of the individual ANOVA results and statistics are summarised in the online Supplementary Material B.
The mean percentages of correct responses and response deviations are shown in Figures 4 and 5 (Experiment 1B: Figures 4b and 5b; Experiment 1C: Figures 4c and 5c), respectively. The pattern of results in the percentage of correct responses was similar to that in response deviation. For the modality effect, updating-accuracy values were generally higher during performance of the attend–auditory block in Experiment 1B (visual < auditory) and the attend–visual block in Experiment 1C (visual > auditory). We also identified an interference effect, in that accuracy values were degraded in the attend–auditory/visual–incongruent trials compared with the attend–auditory/visual–congruent trials. The interference effect varied across the to-be-attended-modality block, as indicated by the interaction. Specifically, this effect was likely to be weak (on the response deviation) or negligible (on the percentage of correct responses) in the attend–auditory block in Experiment 1B (visual < auditory); it was negligible in the attend–visual block in Experiment 1C (visual > auditory). In contrast, this effect appeared in the attend–visual block in Experiment 1B and in the attend–auditory block in Experiment 1C, in which to-be-ignored modality cues were salient over the opposite modality.
Discussion
In Experiments 1B and 1C, we measured two types of updating accuracy: the percentage of correct responses and the response deviation. The results indicate an analogous pattern. As regards the modality effect, updating-accuracy values were higher in the attend–auditory–incongruent and -congruent trials than in the attend–visual–incongruent and -congruent trials, in Experiment 1B (visual < auditory). In contrast, accuracy values were higher in the attend–visual–incongruent and -congruent trials than in the attend–auditory–incongruent and -congruent trials, in Experiment 1C (visual > auditory). Thus, with respect to overall performance, both visual and auditory dominance were found during working-memory navigation (i.e., the modality effect) when the to-be-attended stimuli (auditory in Experiment 1B, and visual in Experiment 1C) were more readily available than the to-be-ignored stimuli. This finding was consistent with our prediction. Specifically, the reverse pattern of results, shown in Experiments 1B and 1C, resulted from the reversal of relative stimulus salience between vision and audition. In Experiment 1B, working-memory navigation was accurate when following auditory cues whose discriminability was superior to that of visual cues. In Experiment 1C, by contrast, navigation was accurate when using visual cues whose discriminability was superior to the discriminability of auditory cues.
Furthermore, in terms of the interference effect, Experiments 1B and 1C demonstrated that spatial representation was updated in a symmetrical manner with respect to visual and auditory working memory. Specifically, ANOVA indicated that interference, reflected by lower performance in the “incongruent” trials than in the “congruent” trials, was dependent on the to-be-attended-modality block. In Experiment 1B (visual < auditory), accuracy values were lower in the attend–visual–incongruent trials than in the attend–visual–congruent trials, whereas such an effect was negligible (in the percentage of correct responses) or weak (in the response deviation) when comparing performance between attend–auditory–incongruent and attend–auditory–congruent trials. In contrast, in Experiment 1C (visual > auditory), accuracy values were lower in the attend–auditory–incongruent trials than in the attend–auditory–congruent trials; this effect was not replicated when comparing performance between attend–visual–incongruent and attend–visual–congruent trials. Thus, interference occurred when observers attended to less perceptually informative spatial cues (visual in Experiment 1B and auditory in Experiment 1C) while ignoring the other modality cues with high salience. This result implies that the other, task-irrelevant cues from the to-be-ignored visual or auditory modality—with discriminability superior to the discriminability of the to-be-attended modality—interfered with, or facilitated, the working-memory navigation guided by the to-be-attended modality. Therefore, visual–spatial dominance in both the interference and modality effects was symmetrically shifted to auditory–spatial dominance or vice versa, depending on the stimulus salience of vision relative to the stimulus salience of audition. The processing dominance in updating working-memory representations was based on information availability, similar to the multisensory integration strategy of perceptually preferring one input over the other (e.g., Alais & Burr, 2004).
Importantly, because a reference baseline condition was not present, Experiments 1A–1C could not identify whether the interference effect on working-memory navigation found in the incongruent trials was attributable to actual interference with, or facilitation of, the process of updating spatial contents in working memory. For example, performance benefits arise when navigation is involuntarily guided by to-be-ignored-modality cues with high salience that indicate directions congruent with to-be-attended-modality stimulus. Similarly, performance deficits occur when navigation is involuntarily guided by superior cues that indicate directions incongruent with the to-be-attended stimulus. Experiments 2A–2D were designed to replicate Experiments 1A–1C by including baseline measurements of directional congruence between to-be-attended and to-be-ignored cues under a control condition in which working-memory navigation was guided by unimodal presentations of visual or auditory directional cues.
Experiments 2A–2D
Experiments 2A–2D included a control condition of directional congruence between to-be-attended and to-be-ignored cues, wherein a sequence of to-be-attended visual or auditory stimuli were unimodally presented (i.e., to-be-ignored cues were not presented) in the working-memory navigation task. Similar to Experiments 1A–1C, visual discriminability was predetermined to be equal to, 50% lower than, or 50% greater than the auditory discriminability for each participant at the beginning of the experiment. Note that the discriminability of stimuli with low salience varied between Experiments 1B (approximately 45% for vision) and 1C (68.54% for audition). This difference was confounded with the modality, hindering conclusions regarding the effects of modality and interference. Therefore, Experiments 2A–2D included a new condition wherein visual discriminability was adjusted to be 23% lower than auditory discriminability, so that visual directional cues with low salience were identified at approximately 70% accuracy (close to the value of 68.54% in Experiment 1C). Thus, the stimulus salience of the inferior modality (vision for “visual < auditory” condition in Experiment 2C) was comparable to the stimulus salience in the reversal condition (audition for the “visual > auditory” condition in Experiment 2D). Working-memory representation was expected to be updated in a symmetrical manner between these conditions, indicating relative auditory dominance in Experiment 2C and visual dominance in Experiment 2D, with respect to the modality and interference (or facilitation) effects.
In the unimodal trials in which participants attended to only visual or only auditory directions, navigation performance could be evaluated independent of the effects of to-be-ignored cue presentation. Thus, we examined whether high-salience, visual or auditory directions from the competing to-be-ignored modality would involuntarily interfere with, or facilitate, working-memory updating guided by the visual or auditory modality to be attended. Such an interference effect would be reflected by lower updating accuracy in the attend–visual/auditory–incongruent trials than in the attend–visual/auditory unimodal trials. Similarly, the facilitation effect would be reflected by greater accuracy in the attend–visual/auditory–congruent trials than in the attend–visual/auditory-unimodal condition of that modality. We hypothesised that these interference and facilitation effects of to-be-ignored directions would occur when the salient stimuli from the to-be-ignored modality involuntarily directed navigation towards a location that was incongruent or congruent with to-be-attended modality cues.
Method
Participants
In total, 120 students (65 males; mean age = 20.6 years, range = 18–26 years) participated; 30 were randomly assigned to each of the four experiments, 2A–2D. All participants reported normal colour vision, normal or corrected-to-normal visual acuity, and normal hearing ability.
Hearing pre-test and coherence adjustment
Auditory-discrimination and coherence-adjustment pre-tests were conducted prior to the mental-pathway task. The same visual and auditory stimuli used in Experiments 1A–1C were presented to participants. With regard to these auditory stimuli, Experiments 2A–2C used a type of long-distance auditory cue (Figure 1b), and Experiment 2D used short-distance cues (Figure 1c). Participants were required to identify the auditory direction as either right, left, up, or down in the hearing pre-test, using a procedure identical to that used in Experiments 1A–1C. This hearing pre-test revealed mean auditory discrimination-accuracy values of 94.72% (SD = 5.41) in Experiment 2A, 96.94% (SD = 4.16) in Experiment 2B, 96.67% (SD = 4.01) in Experiment 2C, and 71.74% (SD = 9.21) in Experiment 2D. The minimum accuracy values were 79.17% in Experiment 2A, 87.50% in Experiment 2B, 85.42% in Experiment 2C, and 56.25% in Experiment 2D.
The motion coherence of visual random-dot displays was adjusted separately for these four experiments and individually for each participant after measuring auditory discriminability in the hearing pre-test. Specifically, visual discriminability was equal to, 50% lower than, 23% lower than, or 50% higher (up to 100%) than auditory discriminability as follows: Experiment 2A (visual = auditory), 2B (visual < auditory), 2C (visual < auditory), and 2D (visual > auditory), respectively. The PEST results representing mean coherence across participants were 27.47% (SD = 8.25) in Experiment 2A, 10.50% (SD = 5.02) in Experiment 2B, 14.67% (SD = 5.01) in Experiment 2C, and 43.20% (SD = 9.76) in Experiment 2D.
Mental-pathway task
The mental-pathway-task procedure was identical to the procedure used in Experiments 1A–1C, except for the control (unimodal) condition of directional congruence, wherein a sequence of single visual or auditory cues-to-be-attended was unimodally presented on a screen or via headphones without presentation of to-be-ignored cues (Figure 6). Each cue was presented for 1,000 ms and separated from other presentations by a blank screen for 1,000 ms. The sequence consisted of eight presentations of the cue displays. In a particular to-be-attended-modality block (attend–visual block or attend–auditory block), participants completed a total of 30 trials consisting of 10 trials each of the “congruent” direction condition, “incongruent” direction condition, and “unimodal” condition.

Schematic example of a trial sequence in Experiment 2.
Data analysis
We averaged the updating accuracy in each condition, in terms of the percentage of correct responses and the response deviation. These values were subjected to ANOVA and simple-effects analysis. To resolve the interaction, we performed simple-effects analysis and a series of paired sample t-tests, corrected for post hoc multiple comparisons (two-sided) using Holm’s method. The response-time data are shown in the online Supplementary Material A.
Results
Experiments 2A–2D focused on which to-be-attended-modality block would result in higher updating performance; they also examined whether updating accuracy would be interfered with (or facilitated by) incongruent (or congruent) directions of to-be-ignored modality cues while attending to the current modality. The results demonstrate effects of modality and interference (or facilitation), respectively.
Tables 3 (for the percentage of correct responses) and 4 (for response deviation) show the results of simple-effects analysis and multiple comparisons in Experiments 2A–2D. Among these, only Experiment 2C did not reveal a significant interaction in measurements of the percentage of correct responses or response deviation. However, because we aimed to identify whether performance in the attend–visual/auditory block was interfered with or facilitated by to-be-ignored auditory/visual cues, we conducted multiple comparisons separately for the two to-be-attended-modality blocks in Experiment 2C. The summary for Experiment 2C in Tables 3 and 4 is based on the results of this separate analysis, omitting the main-effects results. The individual ANOVA results (including the statistical findings) are shown in the online Supplementary Material C.
Summary of simple-effects and post hoc tests for the percentage of correct responses (Experiment 2).
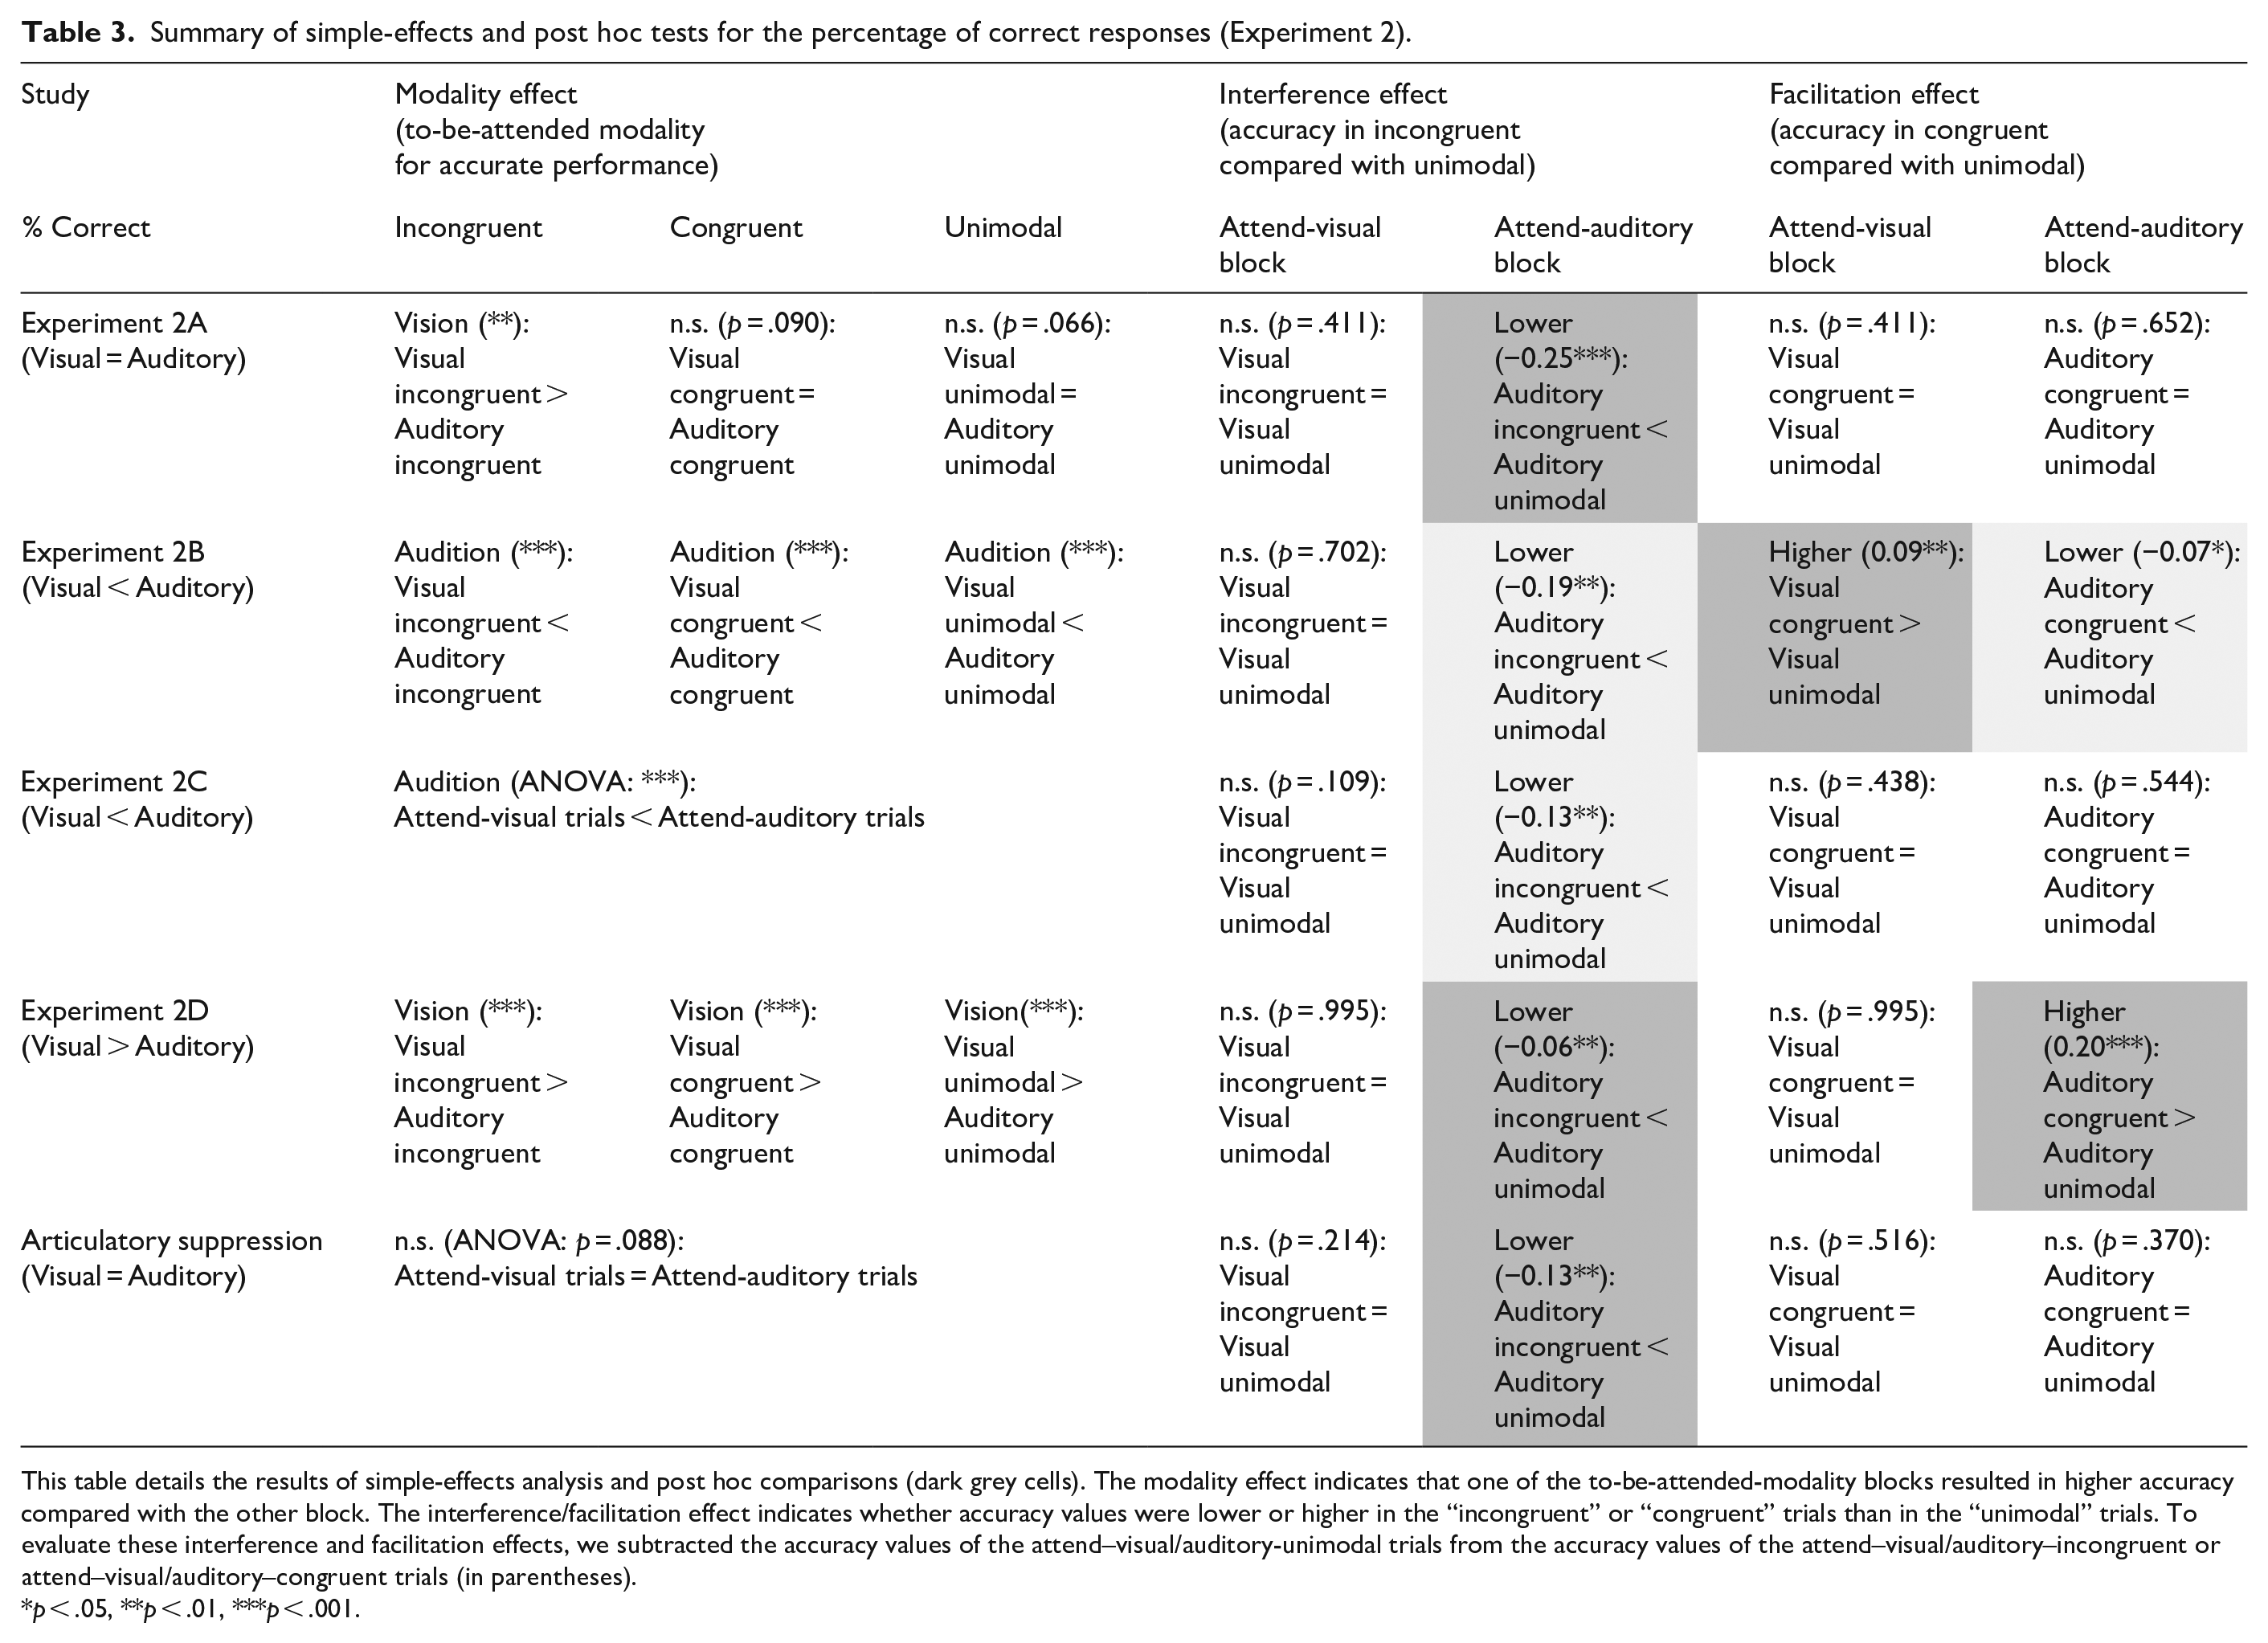
This table details the results of simple-effects analysis and post hoc comparisons (dark grey cells). The modality effect indicates that one of the to-be-attended-modality blocks resulted in higher accuracy compared with the other block. The interference/facilitation effect indicates whether accuracy values were lower or higher in the “incongruent” or “congruent” trials than in the “unimodal” trials. To evaluate these interference and facilitation effects, we subtracted the accuracy values of the attend–visual/auditory-unimodal trials from the accuracy values of the attend–visual/auditory–incongruent or attend–visual/auditory–congruent trials (in parentheses).
p < .05, **p < .01, ***p < .001.
Summary of simple-effects and post hoc tests for response deviation (Experiment 2).
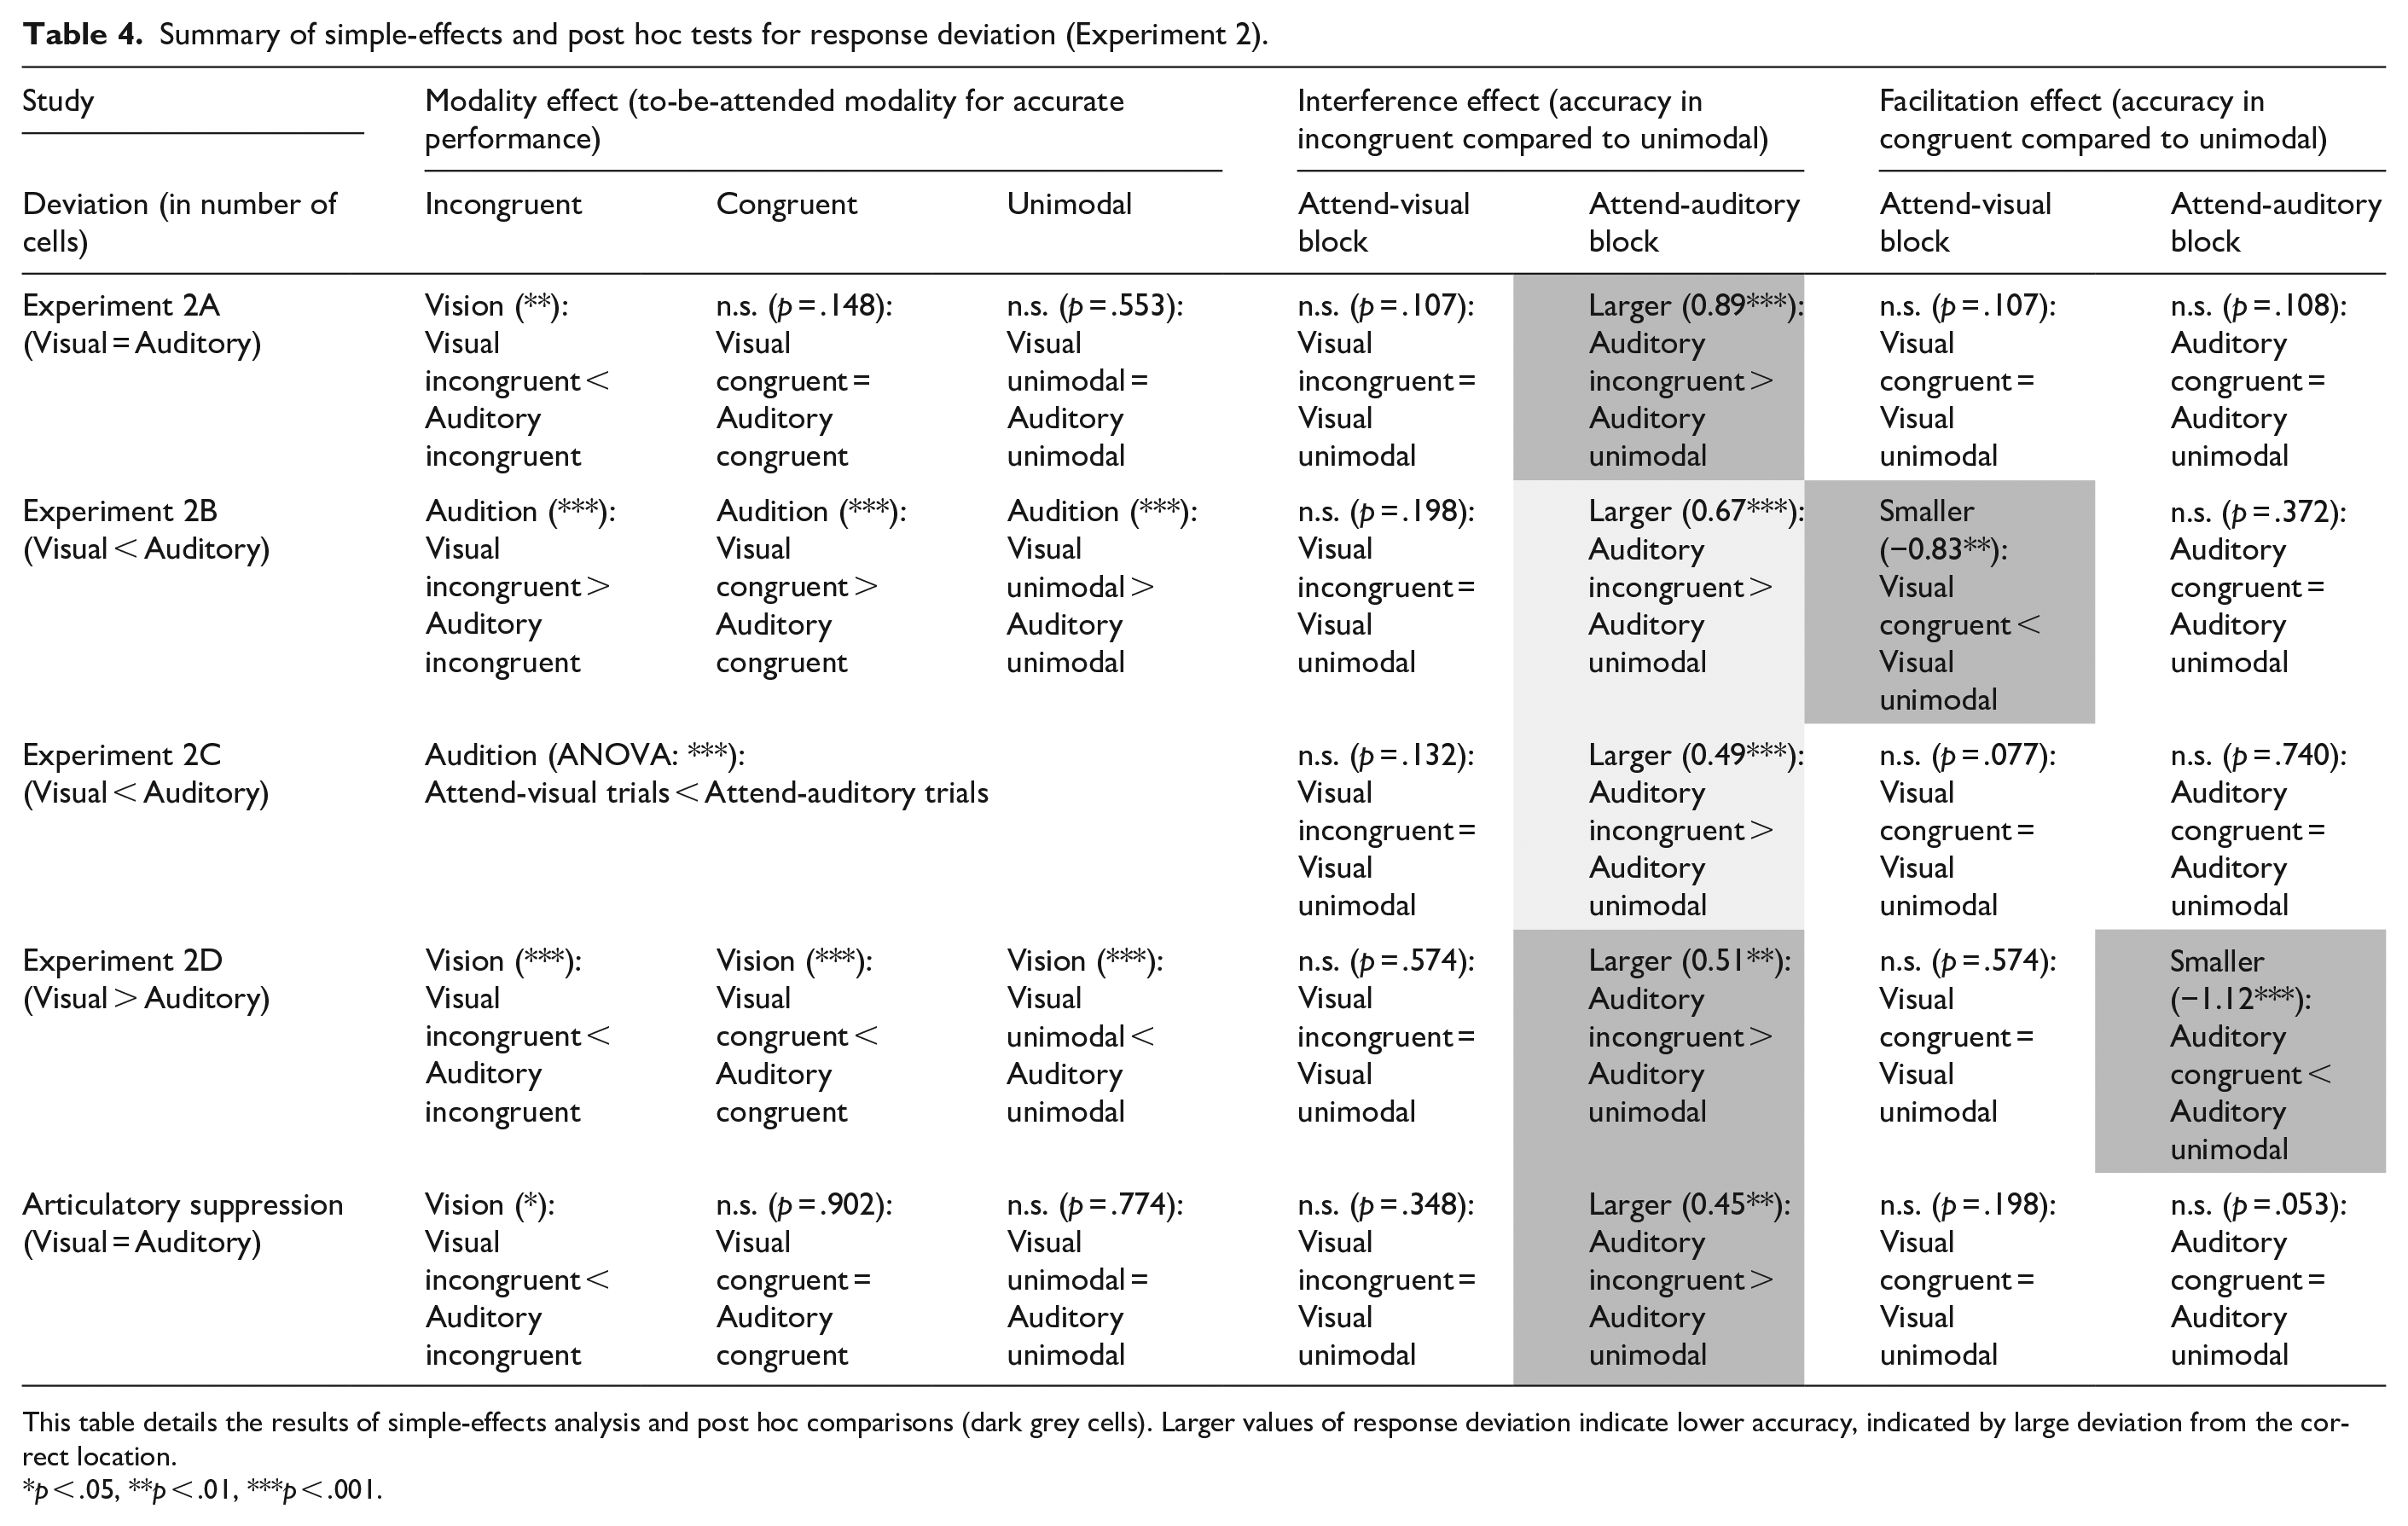
This table details the results of simple-effects analysis and post hoc comparisons (dark grey cells). Larger values of response deviation indicate lower accuracy, indicated by large deviation from the correct location.
p < .05, **p < .01, ***p < .001.
The mean percentages of correct responses and response deviations are displayed in Figures 7 and 8 (Experiment 2A: Figures 7a and 8a; Experiment 2B: Figures 7b and 8b; Experiment 2 C: Figures 7c and 8c; Experiment 2D: Figures 7d and 8d), respectively. The pattern of results for the percentage of correct responses was similar to the pattern of results for response deviation. These results replicated the modality effect observed in Experiment 1, such that the two types of updating accuracy were generally higher in the attend–auditory block in Experiments 2B and 2C (visual < auditory) and higher in the attend–visual block in Experiment 2D (visual > auditory). The modality effect was also partially observed in Experiment 2A (visual = auditory) during the “inconsistent” trials, in agreement with the visual bias observed in Experiment 1A, such that performance was lower in the attend–auditory–incongruent trials than in the attend–visual–incongruent trials.

Updating accuracy in terms of the percentage of correct responses in Experiment 2. (a) Navigation accuracy when visual discriminability was equal to auditory discriminability (Experiment 2A). (b) Accuracy when visual discriminability was 50% lower than auditory discriminability (Experiment 2B). (c) Accuracy when visual discriminability was 23% lower than auditory discriminability (Experiment 2C). (d) Accuracy when visual discriminability was 50% greater than auditory discriminability (Experiment 2D).

Updating accuracy in terms of response deviation in Experiment 2. (a) Experiment 2A. (b) Experiment 2B. (c) Experiment 2C. (d) Experiment 2D. (e) Articulatory suppression.
We also replicated the interference (or facilitation) effect of to-be-ignored directions, such that updating accuracy values (i.e., the percentage of correct responses and response deviation) were degraded in the attend–visual/auditory–incongruent trials, or improved in the attend–visual/auditory–congruent trials, compared with those in the control condition (attend–visual/auditory-unimodal trials). The interference and facilitation effects varied across the to-be-attended-modality block, reflecting an interaction. For instance, they were generally negligible in the attend–visual block in Experiment 2D (visual > auditory), while they appeared in the attend–auditory block. Accordingly, accuracy values were lower in the attend–auditory–incongruent trials, or higher in the attend–auditory–congruent trials, than in the attend–auditory unimodal trials in which to-be-ignored directions (i.e., visual) were salient over to-be-attended directions (i.e., audition).
This “visual > auditory” reversal was also generally present in Experiments 2B and 2C (visual < auditory), but the results were slightly different in the attend–auditory block (light grey cells in Tables 3 and 4). Specifically, Experiments 2B and 2C replicated the results of Experiment 1B, in which accuracy values (in terms of response deviation) were lower in the attend–auditory–incongruent trials than in the attend–auditory–congruent trials. These results reveal that navigation performance was degraded in the attend–auditory–incongruent trials compared with the attend–auditory-unimodal trials based on measurements of the percentage of correct responses and response deviation. Notably, Experiment 2B indicated that the percentage of correct responses decreased in the attend–auditory–congruent trials compared with the attend–auditory-unimodal trials. Thus, the baseline performance, in terms of navigation accuracy in auditory-direction-only trials, was higher than or comparable to performance in the attend–auditory–incongruent and congruent trials in these experiments (visual < auditory). These findings may be the result of a bias towards the use of visual information, although the visual cues were spatially uninformative, as detailed in the “General discussion” section.
In addition to these results in the attend–auditory block, Experiments 2B and 2C indicated interference and facilitation effects of to-be-ignored directions in the attend–visual block; these effects varied across the experiments. Specifically, although Experiment 2B did not indicate an interference effect in the attend–visual block, it did reveal a facilitation effect such that both types of accuracy values (the percentage of correct responses and the response deviation) were higher in the attend–visual–congruent trials than in the attend–visual-unimodal trials. In contrast, ANOVA in Experiment 2C (no interaction term) indicated an interference effect in the “incongruent” trials, or no facilitation effect in the “congruent” trials, based on the results of multiple comparisons with the “unimodal” trials for the main effect of directional congruence. Although these ANOVA results indicate such an interference effect, simple-effects analysis (i.e., separate analysis of the to-be-attended-modality blocks) of Experiment 2C did not reveal measurable interference or facilitation effects in the attend–visual block; accuracy values in both trials of the attend–visual–incongruent and attend–visual–congruent conditions were comparable to those in the attend–visual-unimodal conditions.
An interference effect was also observed in Experiment 2A (visual = auditory), indicating that both types of accuracy were lower in the attend–auditory–incongruent trials than in the attend–auditory-unimodal trials, while a facilitation effect was not observed in this attend–auditory block (attend–auditory–congruent vs. attend–auditory-unimodal). No interference or facilitation effect was observed in the attend–visual block; performance in both trials of the attend–visual–incongruent and attend–visual–congruent conditions was comparable to that in the attend–visual-unimodal trials.
Discussion
Experiment 2A
Similar to Experiment 1A, Experiment 2A was designed to equalise visual and auditory discriminability (visual = auditory). The measurements of the percentage of correct responses and of response deviation both indicated the same pattern of results. The results replicated the interference effect of to-be-ignored visual directions on the accuracy values in the attend–auditory block. Specifically, Experiment 2A compared the accuracy values in the attend–auditory–incongruent trials with those in the attend–auditory-unimodal trials, as a control condition, and revealed degraded performance in the “incongruent” trials. This performance degradation was attributed to actual interference from to-be-ignored visual directions with stimulus salience equal to auditory discriminability. In contrast, no facilitation effect was observed in the attend–auditory block, as demonstrated by comparable performance in the attend–auditory–congruent and attend–auditory-unimodal trials. The same effects of directional congruence (i.e., effect of to-be-ignored auditory directions), in terms of interference and facilitation, were not present in the attend–visual block. This result is consistent with the finding demonstrated in Experiment 1A, in that the interference effect, reflected by lower accuracy values in the “incongruent” trials, degraded accuracy values more severely in the attend–auditory block (by to-be-ignored visual directions) than in the attend–visual block (by to-be-ignored auditory directions). Therefore, visual representations probably dominated updating processes in working memory, regardless of whether visual and auditory discriminability were equal.
Experiment 2B
Similar to Experiment 1B, Experiment 2B was designed to reduce (by 50%) visual discriminability compared with auditory discriminability (visual < auditory). This experiment focused mainly on whether interference and facilitation effects would occur in a particular to-be-attended-modality block. Analyses of both the percentage of correct responses and response deviation yielded similar patterns and replicated the auditory dominance in the modality effect found in Experiment 1B, indicating overall higher accuracy values in the attend–auditory block than in the attend–visual block. Furthermore, in this attend–visual block, accuracy values were higher in the attend–visual–congruent trials than in the attend–visual-unimodal trials, thus reflecting facilitation of navigation (attend–visual directions) by to-be-ignored auditory directions with high stimulus salience. This attend–visual block did not yield the interference effect, as indicated by comparable accuracy values in the attend–visual–incongruent trials and in the attend–visual-unimodal trials. Thus, the effect of directional congruence can be attributed to facilitation by salient to-be-ignored auditory cues. The lack of auditory interference could have been related to a floor effect, because the baseline navigation accuracy in the percentage of correct responses was close to 0%. This possibility was presumably ruled out in Experiment 2C, detailed below, in which baseline navigation accuracy values were higher than in Experiment 2B.
Furthermore, the results unexpectedly showed that accuracy (in terms of the percentage of correct responses) in the attend–auditory block decreased linearly in the following order of trials: attend–auditory-unimodal, attend–auditory–congruent, and attend–auditory–incongruent. Analysis of accuracy in terms of response deviation indicated a similar decrement in accuracy in this attend–auditory block, except in the comparison between “congruent” and “unimodal” trials. Thus, to-be-ignored visual directions with low stimulus salience might have had a negative effect on updating performance when attending to auditory cues, regardless of congruent visual and auditory directions.
Experiment 2C
Experiment 2C was also designed to reduce visual discriminability compared with auditory discriminability (visual < auditory). However, the degree of reduction (23%) was less than that in Experiment 2B. Similar results regarding accuracy were observed in the correct-response and response-deviation analyses. Similar to Experiment 2B, the results showed auditory dominance in the modality effect, such that overall accuracy values were higher in the attend–auditory block than in the attend–visual block. No interaction effect was found in Experiment 2C. Based on multiple comparisons for the main effect of directional congruence, accuracy values were degraded in the “incongruent” trials compared with the “unimodal” trials, reflecting an interference effect. Facilitation was eliminated during navigation; thus, the lower performance in the incongruent trials (compared with the congruent trials in Experiment 1B), such as the attend–auditory-incongruent trials, can be attributed to actual interference. We presume that, as visual reliability increased, as indicated by stimulus salience, the auditory stimuli were used less frequently. Increasing the stimulus salience of visual cues improved baseline accuracy; this potential baseline inflation eliminated the performance difference between the “congruent” and “unimodal” conditions. Notably, this interference effect (of to-be-ignored auditory directions) was not observed in the results of the supplementary multiple comparisons for the attend–visual block. Thus, we assume that this interference was weak but could not be ignored.
Furthermore, Experiment 2C showed that accuracy values (both the percentage of correct responses and response deviation) in the attend–auditory block decreased linearly, similar to Experiment 2B, as indicated by lower accuracy values in the attend–auditory–incongruent trials than in the attend–auditory–congruent or attend–auditory-unimodal trials. Nevertheless, we presume that visual cues with low stimulus salience might impair working-memory navigation when attending to auditory cues.
Experiment 2D
Experiment 2D, similar to Experiment 1C, was designed to increase (by 50%) visual over auditory discriminability (visual > auditory). The results were similar across the two measurements of accuracy based on the percentage of correct responses and response deviation, replicating the results of Experiment 1C: auditory dominance with respect to the modality and interference/facilitation effects, as revealed in Experiments 2B and 2C, shifted to visual dominance. Specifically, the overall updating-accuracy values were higher in the attend–visual block than in the attend–auditory block. The results also replicated the interference effect of to-be-ignored visual directions in this attend–auditory block, such that accuracy values were degraded in the attend–auditory–incongruent trials compared with the attend–auditory-unimodal trials. This attend–auditory block resulted in facilitation of accuracy values in the attend–auditory–congruent trials, as well as interference, compared with the attend–auditory-unimodal trials. Thus, the directional congruence effect can be attributed to both interference and facilitation by salient visual cues. However, we did not observe the same interference and facilitation effects in the attend–visual block.
Effects of a verbal coding strategy
Experiments 2A–2D did not rule out the possibility of a verbal labelling strategy during working-memory navigation; thus, participants were able to use verbal statements as numbers or references to code a target position, rather than spatial imagery. This strategy may have undermined the conclusions regarding modality and interference/facilitation effects, which were demonstrated in Experiments 1 and 2, because of the involvement of verbal working-memory when updating a location. To examine this possibility, we replicated Experiment 2A with the addition of articulatory suppression. Additional participants were recruited in this experiment and their data were analysed, with the exception of two students who failed to follow this suppression during the mental-pathway task (the excluded participants’ data are available at https://doi.org/10.17605/OSF.IO/G26KE). Thus, we recorded the correct or incorrect responses of 30 participants (18 males; mean age = 19.9 years, range = 18–25 years).
The apparatus, stimulus, and procedure were identical to the approach in Experiment 2A (visual = auditory), but participants were required to utter “za” at two second intervals throughout navigation. This vocalisation by a participant was directly confirmed by a listening experimenter, who was located out of sight of the participant. The mean updating-accuracy values, in terms of the percentage of correct responses and response deviation, were calculated for each condition (Figures 7e and 8e). ANOVA revealed modality and interference effects consistent with the findings in Experiment 2A (see Tables 3 and 4, and details in the online Supplementary Material C). Specifically, accuracy values were lower in attend–auditory–incongruent trials than in attend–visual–incongruent trials (i.e., the modality effect), and were lower in attend–auditory–incongruent trials than in attend–auditory-unimodal trials (i.e., the interference effect). This replicability of the results implies that both modality and interference (or facilitation) effects cannot be explained by a verbal labelling effect alone.
Together, the results across Experiments 2A–2D revealed a symmetrical pattern with respect to visual and auditory dominance. Specifically, robust working-memory updating was performed when attending to perceptually salient modality cues of audition (in visual < auditory condition) or vision (in visual > auditory condition) while ignoring the stimuli with low salience, as indicated by the modality effect. Importantly, these salient directional cues from the to-be-ignored modality were employed in working-memory navigation. This finding was supported by the interference and facilitation effects of to-be-ignored-modality cues, similar to Experiment 1, such that the attend–visual–incongruent trials resulted in lower performance than did the attend–visual–congruent trials (in visual < auditory condition), or the attend–auditory–incongruent trials resulted in lower performance than did the attend–auditory–congruent trials (in visual > auditory condition). Thus, directions indicated by to-be-ignored modality cues with high perceptual salience competed or agreed with directions from to-be-attended modality cues, reducing or facilitating updating accuracy, respectively. In these processes, the dominant modality was determined based on stimulus salience relative to the counterpart degraded by noise. Thus, navigation could result in visual over auditory dominance or the reverse, a finding that challenges the notion of absolute processing asymmetry.
Working-memory updating would proceed after sensory inputs such as directional cues were selected and encoded into memory representations. The processing symmetry in visual and auditory working-memory navigation, found in Experiments 1 and 2, has been attributed to input stimulus features such as spatial resolution (Botta et al., 2013; Spence et al., 2004; Ward et al., 2000); accordingly, the aforementioned interference and facilitation would be based on the level of input-encoding processes, with sensory-specific features remaining (e.g., Loomis et al., 2012) in memory input. Thus, in Experiment 3, we examined whether one of two competing information types would be prioritised or weighted over the other in the encoding process during working-memory navigation.
Experiments 3A–3D
Experiments 3A–3D examined whether the processing symmetry in visual and auditory working-memory updating, represented by the modality and interference/facilitation effects of salient to-be-ignored-modality cues, is determined during the encoding of sensory inputs. To this end, these experiments employed a direction-discrimination task in which participants manoeuvred a target location mentally. This task was similar to the mental-pathway task, except that the to-be-attended and to-be-ignored visual or auditory directional cues were presented only once per trial. The task consisted of three directional conditions: incongruent, congruent, and control (unimodal). Specifically, to-be-attended visual (or auditory) and to-be-ignored auditory (or visual) cues appeared and indicated bimodally different (i.e., incongruent) or similar (i.e., congruent) directions, or to-be-attended visual or auditory cues indicated unimodal directions while to-be-ignored cues were not presented. The directional congruence between to-be-attended and to-be-ignored cues varied randomly across trials in the to-be-attended-modality block of vision and audition. Discrimination-accuracy values were expected to be lower in the attend–visual/auditory–incongruent trials and higher in the attend–visual/auditory–congruent trials, compared with those in the attend–visual/auditory-unimodal trials. We predicted that such instances of interference and facilitation would be observed during discriminating and encoding of sensory inputs, consistent with the processing symmetry during the updating of working memory indicated in Experiment 2.
Method
Participants
In total, 120 students (65 males; mean age = 20.6 years, range = 18–26 years) were recruited and randomly assigned to the four experiments (30 participants each). All participants reported normal colour vision, normal or corrected-to-normal visual acuity, and normal hearing ability.
Hearing pre-test and coherence adjustment
Two hearing pre-tests with auditory cues and coherence adjustment were conducted prior to the discrimination task. The apparatus, stimuli, and procedure were identical to those used in Experiments 1 and 2. With regard to the auditory stimuli, Experiments 3A–3C used a set of long-distance cues, and Experiment 3D used short-distance cues. The mean discrimination accuracy values on the hearing pre-test were 95.35% (SD = 5.03) in Experiment 3A, 96.88% (SD = 4.63) in Experiment 3B, 94.03% (SD = 4.70) in Experiment 3C, and 71.88% (SD = 9.72) in Experiment 3D. The minimum accuracy values were 77.08% in Experiment 3A, 81.25% in Experiment 3B, 79.17% in Experiment 3C, and 50.00% in Experiment 3D.
Similar to Experiments 2A–2D, visual discriminability was equal to, 50% lower than, 23% lower than, and 50% higher (up to 100%) than auditory discriminability in Experiments 3A (visual = auditory), 3B (visual < auditory), 3C (visual < auditory), and 3D (visual > auditory), respectively. The PEST results representing mean coherence across participants were 29.33% (SD = 10.15) in Experiment 3A, 10.63% (SD = 4.54) in Experiment 3B, 16.10% (SD = 5.87) in Experiment 3C, and 43.60% (SD = 11.71) in Experiment 3D.
Direction-discrimination task
The same apparatus and stimuli used in Experiments 1 and 2 were employed in a direction-discrimination task. This task primarily entailed replacement of the mental-pathway task with a single-cue presentation (Figure 9). Each trial began with a 1,000 ms presentation of a blank screen with a square red frame (2.8° × 2.8°) in the centre of the monitor. After this blank display, the to-be-attended and to-be-ignored visual or auditory directional cues were presented once, bimodally or unimodally, inside the square frame when visual or via headphones when auditory; they remained until participants responded or until 1,000 ms had elapsed from the cue onset. Participants identified the direction of each cue by pressing the “k,” “h,” “y,” or “m” key for the right, left, up, and down directions, as quickly and accurately as possible. The directional congruence between to-be-attended and to-be-ignored cues (incongruent, congruent, or unimodal [i.e., control]) varied randomly across trials. The to-be-attended modalities of vision or audition varied according to block (i.e., attend–visual or attend–auditory). For each to-be-attended-modality block, participants completed a total of 180 trials consisting of 60 trials under congruent directions, 60 trials under incongruent directions, and 60 trials under the control condition.

Schematic example of a trial sequence in Experiment 3.
Data analysis
Our primary measure was discrimination accuracy based on the percentage of correct responses. Values were averaged for each condition and subjected to the same ANOVA as in Experiments 1 and 2. Post hoc paired t-tests for multiple comparisons were performed using Holm’s method. The mean response times for correct trials were also calculated (Table 5). Trials in which response times deviated by more than 1.5-fold compared with the interquartile range (i.e., the 25th and 75th percentiles) were excluded from analysis; the excluded trials comprised 3.14% of all correct trials.
Summary of response times for visual and auditory discrimination.
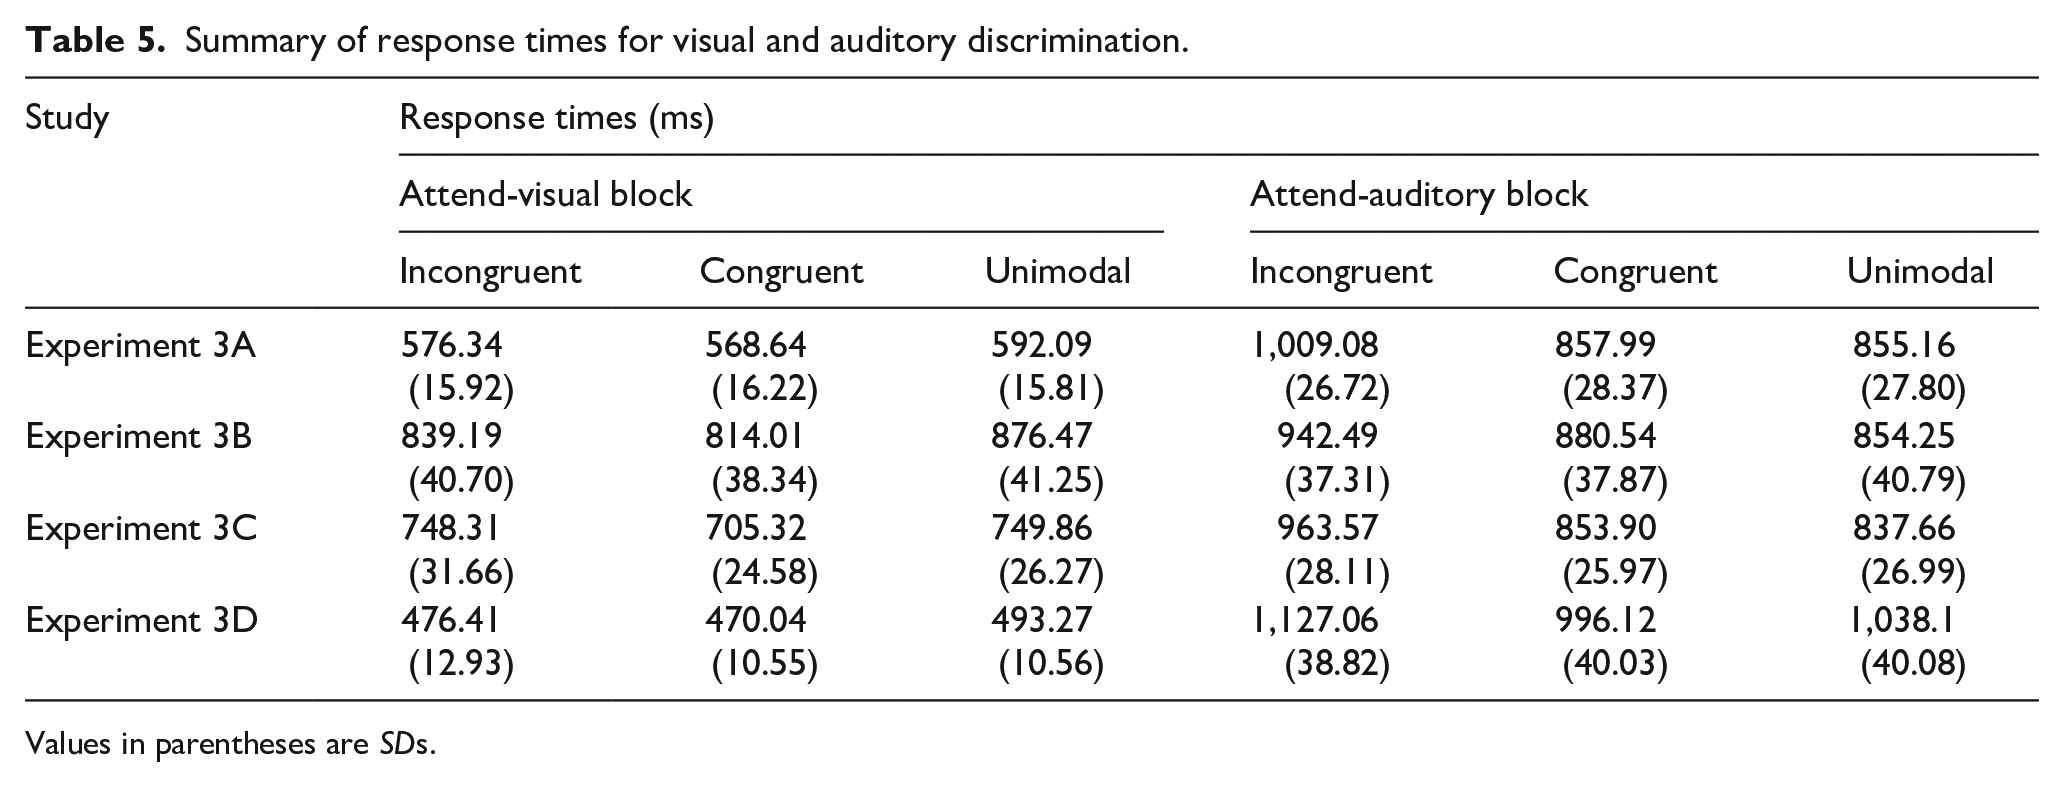
Values in parentheses are SDs.
Results
The results of simple-effects analysis and multiple comparisons are summarised in Table 6. Among these, only Experiment 3C (similar to Experiment 2C) did not reveal a significant interaction in measurements of the percentage of correct responses. In Experiment 3C, we conducted supplementary comparisons for each to-be-attended-modality block. The details of individual ANOVA results (including the statistical findings) are shown in the online Supplementary Material D.
Summary of simple-effects and post hoc tests for Experiment 3.
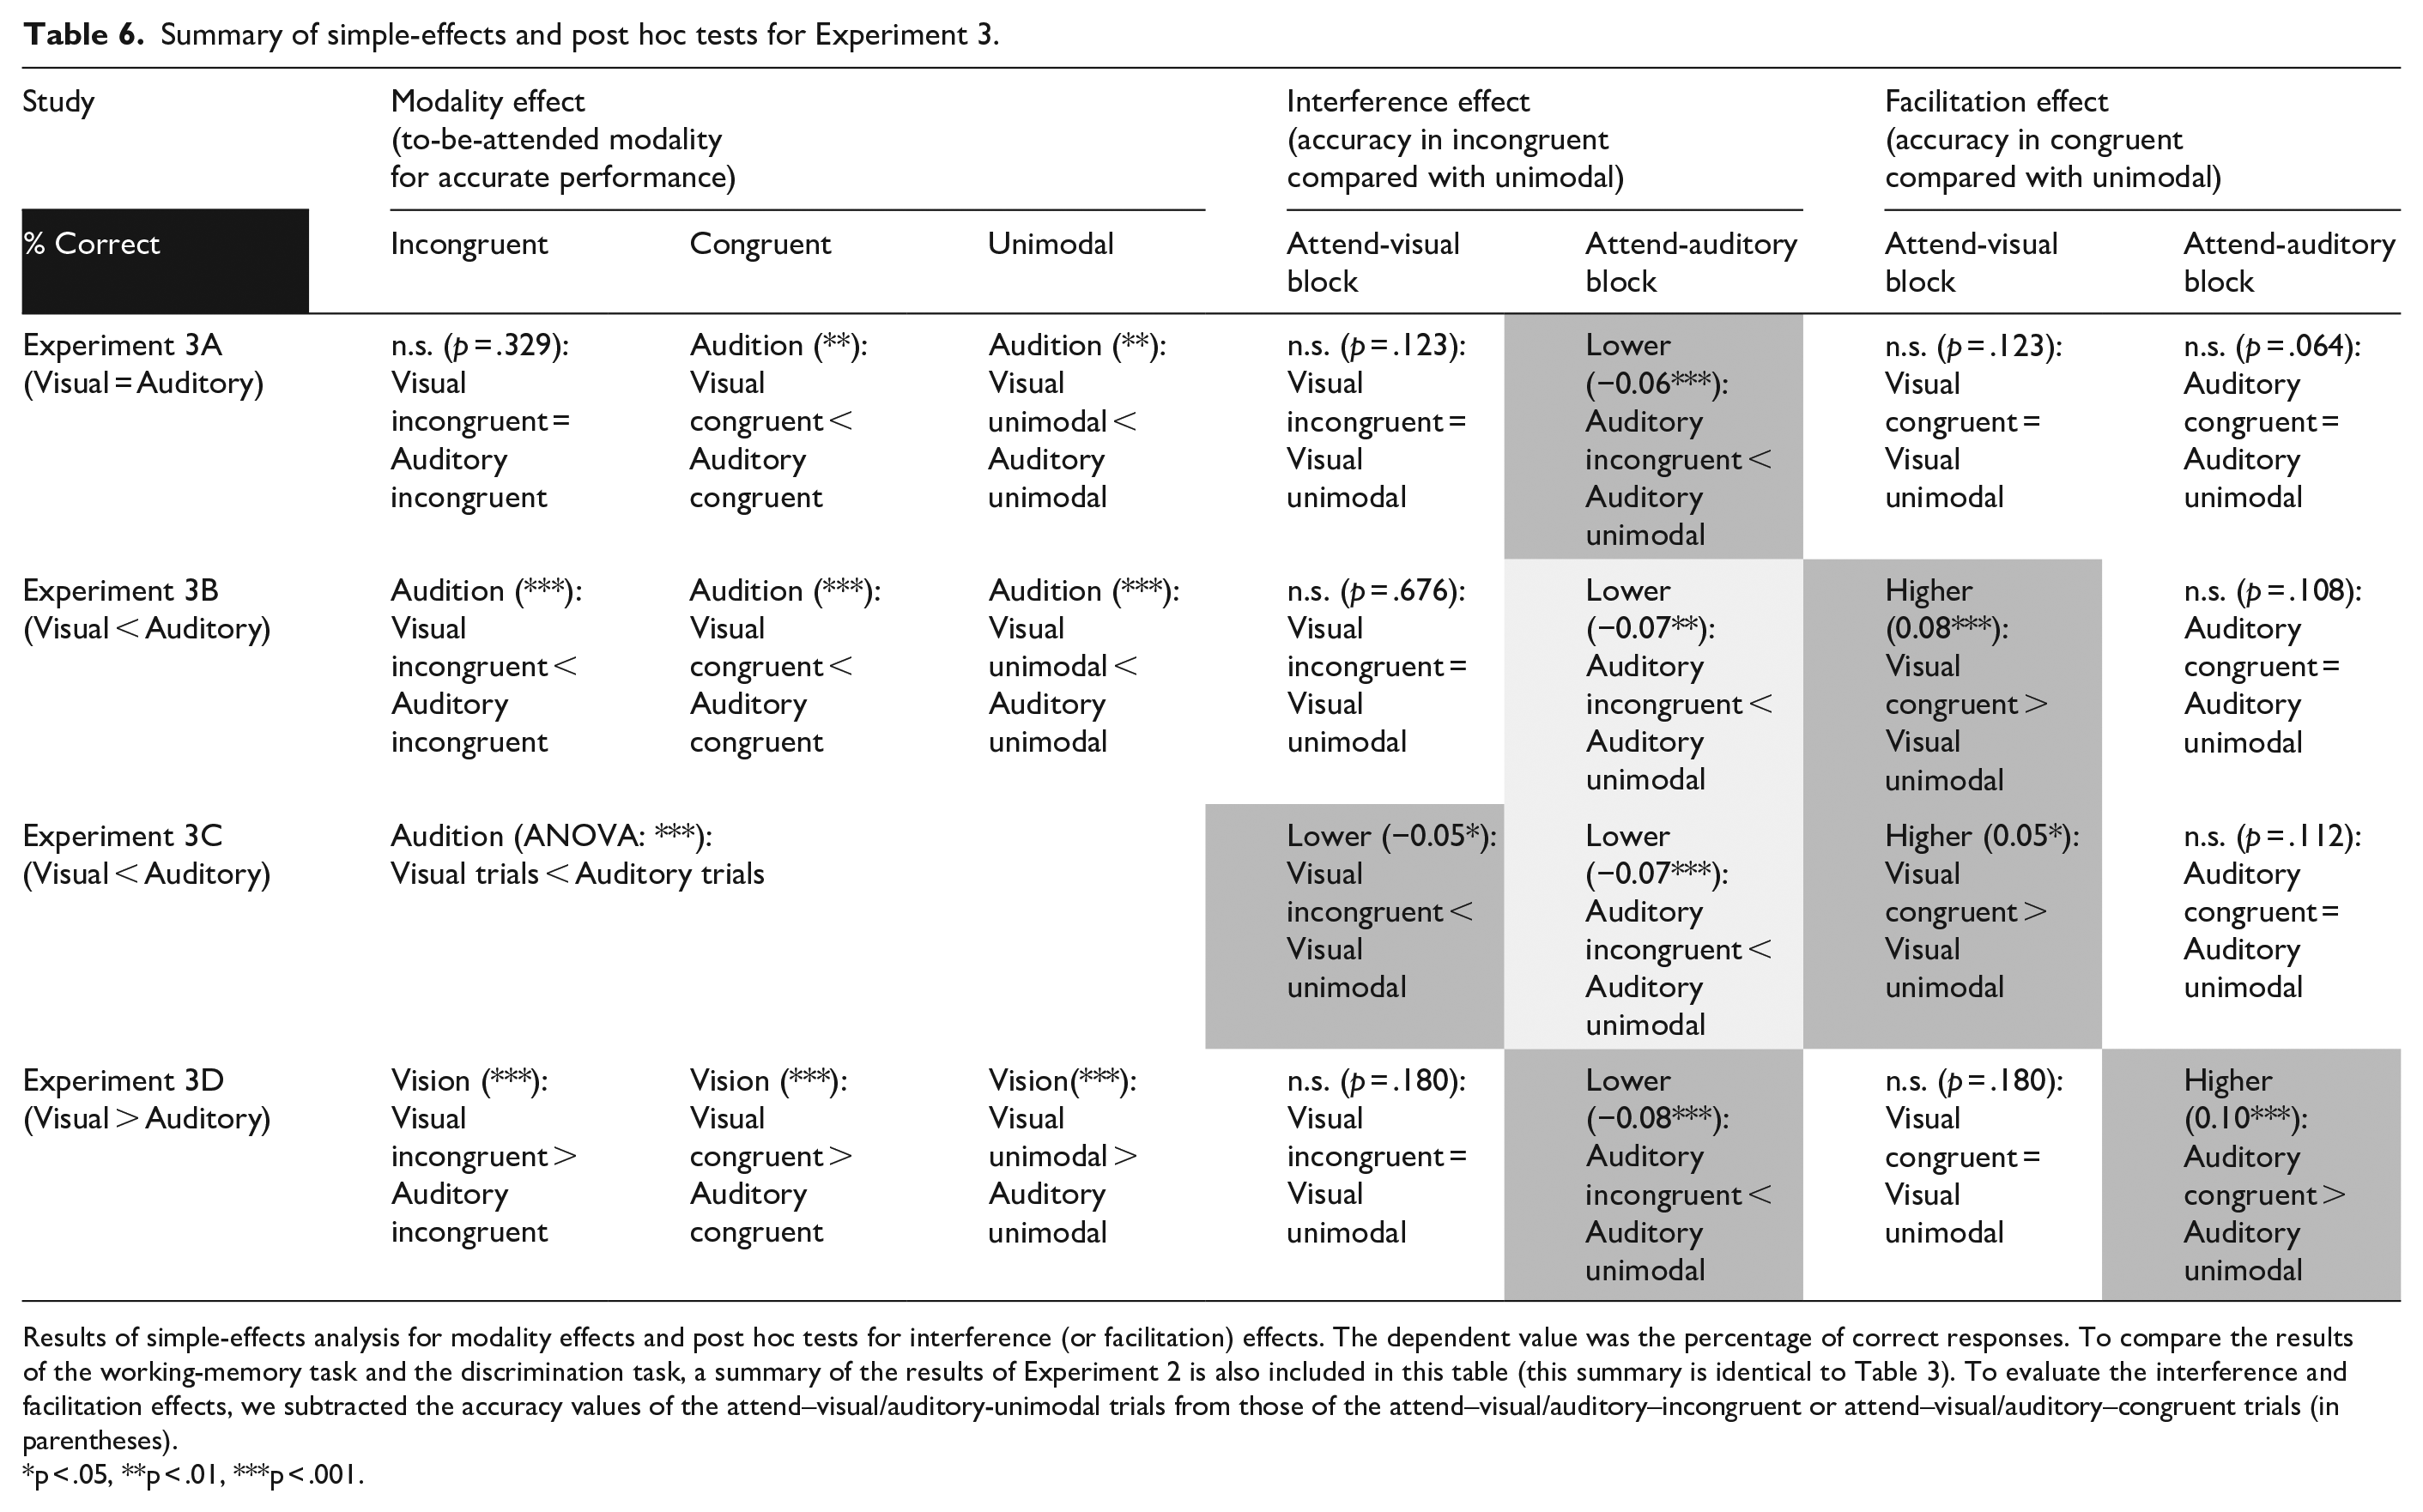
Results of simple-effects analysis for modality effects and post hoc tests for interference (or facilitation) effects. The dependent value was the percentage of correct responses. To compare the results of the working-memory task and the discrimination task, a summary of the results of Experiment 2 is also included in this table (this summary is identical to Table 3). To evaluate the interference and facilitation effects, we subtracted the accuracy values of the attend–visual/auditory-unimodal trials from those of the attend–visual/auditory–incongruent or attend–visual/auditory–congruent trials (in parentheses).
p < .05, **p < .01, ***p < .001.
Similar to Experiment 2, Experiments 3A–3D investigated which to-be-attended-modality block would result in higher discrimination performance (i.e., the modality effect), and whether accuracy would be interfered with or facilitated by incongruent or congruent directions of to-be-ignored modality cues while attending to the current modality (i.e., the interference and facilitation effects). The mean percentages of correct responses are shown in Figure 10 (Experiment 3A: Figure 10a; Experiment 3B: Figure 10b; Experiment 3C: Figure 10c; Experiment 3D: Figure 10d). We found a similar modality effect to that observed in Experiment 2, such that overall discrimination-accuracy values were higher in the attend–auditory block in Experiments 3B and 3C (visual < auditory), while they were higher in the attend–visual block in Experiment 3D (visual > auditory). The modality effect in Experiment 3A was similar to that in Experiment 2A (visual = auditory), except that accuracy values were generally higher in the attend–auditory block than in the attend–visual block, based on comparisons between the attend–auditory–congruent and attend–visual–congruent trials, and between the attend–auditory-unimodal and attend–visual-unimodal trials.
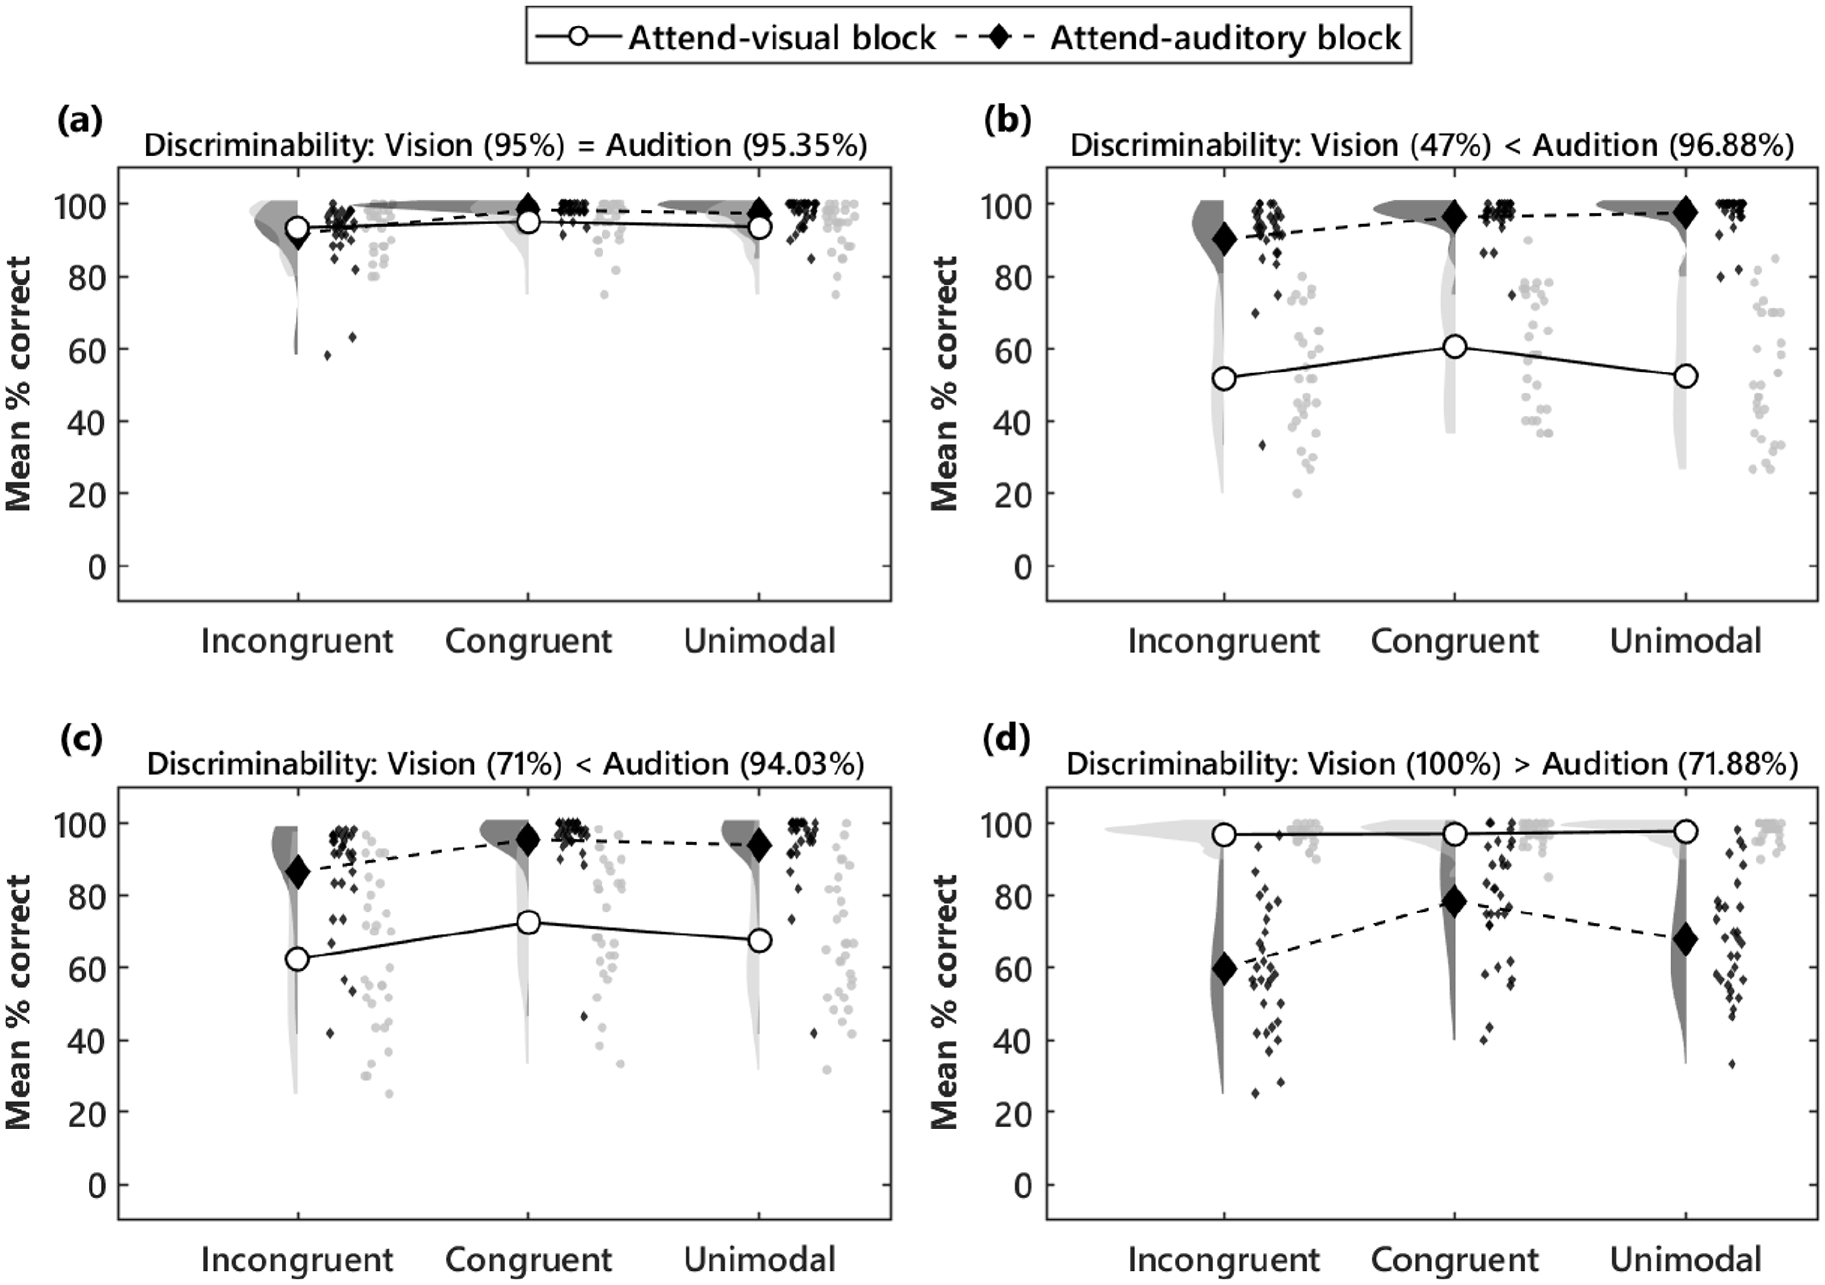
Discrimination accuracy in terms of the percentage of correct responses in Experiment 3. (a) Discrimination accuracy when visual discriminability was equalised with auditory discriminability (Experiment 3A). (b) Accuracy when visual discriminability was 50% lower than auditory discriminability (Experiment 3B). (c) Accuracy when visual discriminability was 23% lower than auditory discriminability (Experiment 3C). (d) Accuracy when visual discriminability was 50% greater than auditory discriminability (Experiment 3D).
We also replicated the interference and facilitation effects of directional incongruence shown in Experiment 2. These effects were dependent on the to-be-attended-modality block. For instance, interference and facilitation were generally ignored in the attend–visual block in Experiment 3D (visual > auditory), whereas the effects were present in the attend–auditory block in this experiment. Specifically, accuracy values were lower in the attend–auditory–incongruent trials and higher in the attend–auditory–congruent trials, compared with the attend–auditory-unimodal trials.
This “visual > auditory” reversal was also generally observed in Experiments 3B and 3C (visual < auditory), but the results were slightly different in the attend–auditory block (light grey cells in Table 6). In Experiments 3B and 3C, accuracy values were lower in the attend–auditory–incongruent trials than in the attend–auditory-unimodal trials, similar to Experiments 2B and 2C. This performance degradation might have been caused by visual bias (see the “General discussion” section).
Furthermore, Experiments 3B and 3C (visual < auditory) replicated the interference and facilitation effects in the attend–visual block, but these effects varied across experiments. Specifically, although Experiment 3B did not show an interference effect (attend–visual–incongruent vs. attend–visual-unimodal), it did reveal a facilitation effect whereby accuracy values were higher in the attend–visual–congruent trials than in the attend–visual-unimodal trials. Experiment 3C indicated both interference and facilitation, whereby accuracy values were decreased in the attend–visual–incongruent trials and increased in the attend–visual–congruent trials, compared with the attend–visual-unimodal trials.
An interference effect was also observed in Experiment 3A (visual = auditory); accuracy values were lower in the attend–auditory–incongruent trials than in the attend–auditory-unimodal trials. The facilitation effect was not observed in this attend–auditory block (attend–auditory–congruent vs. attend–auditory-unimodal). These interference and facilitation effects were not observed in the attend–visual block; thus, the accuracy values in both trials of the attend–visual–incongruent and attend–visual–congruent conditions were comparable to those in the attend–visual-unimodal conditions.
Discussion
Experiment 3A
The results of Experiment 3A (visual = auditory) revealed a pattern similar to the findings of Experiment 2A, except that the attend–auditory block generally exhibited higher accuracy values than did the attend–visual block (i.e., the modality effect). Specifically, except for the “incongruent” trials, accuracy values were higher in the attend–auditory–congruent trials than in the attend–visual–congruent trials; moreover, accuracy values were higher in the attend–auditory-unimodal trials than in the attend–visual-unimodal trials. Nevertheless, the results replicated Experiment 2A, with respect to the interference effect of to-be-ignored visual directions on accuracy values in the attend–auditory block. Thus, accuracy values were lower in the attend–auditory–incongruent trials than in the attend–auditory-unimodal trials. Neither interference nor facilitation was present in the attend–visual block. These results are consistent with the findings of Experiment 2A, which demonstrated the processing dominance of the visual modality in the interference effect during working-memory updating.
Experiment 3B
Similarly, Experiment 3B (visual < auditory) replicated the modality effect in Experiment 2B, such that accuracy values were generally higher in the attend–auditory block than in the attend–visual block. This experiment also demonstrated the facilitation effect (but not the interference effect) of to-be-ignored auditory directions on discrimination accuracy in the attend–visual block, reflected by higher performance in the attend–visual–congruent trials than in the attend–visual-unimodal trials. Unexpectedly, but in agreement with Experiment 2B, accuracy values in the attend–auditory block were also modulated by to-be-ignored visual directions with low stimulus salience. Specifically, interference affected accuracy values in the attend–auditory–incongruent trials compared with the baseline accuracy values (auditory only trials) of the attend–auditory-unimodal trials (light grey cells in Table 6). Thus, to-be-ignored visual cues with low stimulus salience might have had a negative effect on navigation when attending to auditory cues.
Experiment 3C
Experiment 3C (visual < auditory) revealed higher accuracy values in the attend–auditory block than in the attend–visual block (attend–auditory–incongruent vs. attend–visual–incongruent, attend–auditory–congruent vs. attend–visual–congruent, and attend–auditory-unimodal vs. attend–visual-unimodal), demonstrating the modality effect (in agreement with the findings in Experiment 2C). Experiment 3C demonstrated both interference and facilitation effects of to-be-ignored auditory directions on accuracy values in the attend–visual block. Specifically, accuracy values were lower in the attend–visual–incongruent trials than in the attend–visual-unimodal trials, while they were higher in the attend–visual–congruent trials than in the attend–visual-unimodal trials. This implies involuntary guidance of navigation by to-be-ignored auditory directions with high stimulus salience, similar to the other experiments in the same “visual < auditory” condition (e.g., Experiment 3B). These effects of interference and facilitation were probably stronger in Experiment 3C than in other such experiments. Consistent with the findings in Experiment 3B, Experiment 3C revealed a negative impact of to-be-ignored visual directions during navigation when attending to auditory directions. The results indicate lower accuracy values in the attend–auditory–incongruent trials than in the attend–auditory-unimodal trials, similar to the results of Experiment 2C.
Experiment 3D
Finally, Experiment 3D (visual > auditory) replicated the modality and interference (or facilitation) effects shown in Experiment 2D. For the modality effect, accuracy values were generally higher in the attend–visual block than in the attend–auditory block (attend–visual–incongruent vs. attend–auditory–incongruent, attend–visual–congruent vs. attend–auditory–congruent, and attend–visual-unimodal vs. attend–auditory-unimodal). As regards the interference and facilitation effects, accuracy values in the attend–auditory block were modulated by to-be-ignored visual directions with high stimulus salience. Specifically, discrimination was less accurate in the attend–auditory–incongruent trials than in the attend–auditory-unimodal trials, while it was more accurate in the attend–auditory–congruent trials than in the attend–auditory-unimodal trials. The same interference and facilitation effects were generally not observed in the attend–visual block.
In summary, Experiments 3A–3D replicated a symmetrical pattern of results with respect to the visual and auditory dominance observed in Experiment 2. Specifically, Experiments 3A–3D revealed that direction discrimination was performed accurately when attending to perceptually salient modality stimuli of audition (in visual < auditory condition) or vision (in visual > auditory condition) while simultaneously ignoring stimuli with low salience (i.e., the modality effect). Moreover, the results demonstrated a symmetrical pattern of visual and auditory dominance in the interference and facilitation effects. Thus, accuracy values were lower in the attend–visual–incongruent trials than in the attend–visual–congruent trials in the “visual < auditory” condition; conversely, accuracy values were lower in the attend–auditory–incongruent trials than in the attend–auditory–congruent trials in the “visual > auditory” condition. These performance benefits or costs were similar to the findings of Experiment 2, whereby working-memory updating was improved or impaired due to directions indicated by to-be-ignored task-irrelevant cues with high stimulus salience. Based on the similarity of results, we suggest that processing symmetry occurs during the process of encoding sensory inputs into spatial working The observed dominance reflects the perspective that working-memory inputs are selectively employed in updating representations, depending on the relative stimulus availability.
General discussion
This study examined similarities between visual and auditory spatial working memory during representation updating. The results of Experiment 1A imply that visual and auditory spatial navigation competed for attentional resources when different modalities delivered incongruent directional cues (Cocchini et al., 2002; Fougnie et al., 2015). This result is consistent with the notion of modality-general working memory in that visual and auditory updating employed the same attentional resources and functions (Fougnie et al., 2018; Lehnert & Zimmer, 2006; Loomis et al., 2012; Maezawa & Kawahara, 2021; Martinkauppi et al., 2000). When this competition occurs, one type of modality information is prioritised or weighted over the other modality information. Thus, we conducted Experiments 1B and 1C, as well as Experiments 2A–2D, in which the visual-stimulus salience was reduced or increased relative to auditory-stimulus salience. The results demonstrated a modality effect, such that the overall accuracy values were higher when attending to cues with high salience than when attending to cues with low salience. For instance, in the “visual < auditory” condition, the attend–auditory block generally resulted in higher navigation accuracy than did the attend–visual block; this pattern was reversed in the “visual > auditory” condition. Importantly, we also demonstrated interference and facilitation effects of the to-be-ignored modality: when the unattended modality was more discriminable than the to-be-attended modality, the cues continued to influence working-memory updating. In the “visual < auditory” condition, the attend–visual–incongruent trials resulted in degraded navigation performance compared with the attend–visual-unimodal trials; this was caused by automatic interpretation of “incongruent” auditory directions that participants were required to ignore. Similarly, facilitation occurred because of “congruent” auditory directions; this pattern was reversed in the “visual > auditory” condition. Therefore, Experiment 2 demonstrated that readily available memory inputs were involuntarily employed during spatial-updating processes, irrespective of the type of sensory modality (i.e., vision or audition). These effects of modality and interference/facilitation on spatial updating were symmetrical across visual and auditory working-memory navigation. Furthermore, the pattern of the interference effect observed in Experiment 2A was also seen when this experiment was performed with additional articulatory suppression, implying that the present results are not explained by a verbal-labelling-strategy alone. Moreover, processing dominance is determined during the input-encoding processes, in which memory inputs might still retain sensory-specific features (e.g., Loomis et al., 2012), as observed in Experiment 3.
The present study also examined the concept of winner-take-all competition (Battaglia et al., 2003), in which navigation is guided only by the most readily available memory input. This hypothesis would be supported if updating-accuracy values were comparable between the “congruent” trials of the two to-be-attended-modality blocks. For example, in the “visual > auditory” condition (or “visual < auditory” condition), accuracy values in the attend–auditory–congruent trials would be identical to those in the attend–visual–congruent trials because the participants relied on similar directions from the salient modality (i.e., visual direction). However, the results of Experiment 2 are inconsistent with this possibility, because a modality effect was found. Specifically, in the “visual > auditory” condition (e.g., Experiments 1C and 2D), updating-accuracy values were lower in the attend–auditory–congruent trials than in the attend–visual–congruent trials; this pattern was reversed in the “visual < auditory” condition (e.g., Experiments 1B, 2B, and 2C) with lower accuracy values in the attend–visual–congruent trials than in the attend–auditory–congruent trials. Thus, participants probably suppressed task-irrelevant visual/auditory cues and relied on to-be-attended auditory/visual directions during a portion of their successful navigation trials, although the to-be-attended directions were less discriminable than the to-be-ignored directions. Therefore, we assume that both spatial modality cues impaired/facilitated the updating processes of working-memory representations in a non-exclusive manner, regardless of whether they competed for similar attentional resources. These two inputs are likely to be weighted according to perceptual reliability (Alais & Burr, 2004), and the presence of combined information affects the updating process.
With regard to visual dominance, spatial working memory preferentially represents visual object locations over auditory locations due to the high spatial resolution of visual cues (e.g., Botta et al., 2011, 2013; Lehnert & Zimmer, 2006). Consistent with this perspective, the present study demonstrated that visual cues involuntarily dominated in working-memory navigation when visual discriminability was increased relative to auditory discriminability (visual > auditory; Experiments 1C and 2D), causing interference with (and facilitation of) accuracy in the attend–auditory block. Although the visual dominance symmetrically shifted to auditory dominance in the “visual < auditory” condition (Experiments 1B, 2B, and 2C), this visual superiority was maintained despite the equalisation of visual discriminability with auditory discriminability (visual = auditory; Experiments 1A and 2A). Specifically, updating accuracy in the attend–auditory block (i.e., attend–auditory–incongruent trials) showed interference from the visual to-be-ignored directions, while interference from to-be-ignored auditory directions was not replicated; this indicates a weak (Experiment 1A) or negligible effect (Experiment 2A) in the attend–visual blocks. Thus, to-be-ignored visual directions severely interfered with accuracy when attending to the other modality; this interference was greater than the effect of to-be-ignored auditory directions. These findings imply that processing symmetry was characterised by an overall bias towards the use of visual information, despite the instruction to ignore visual directions. This observation under the conditions of equalised discriminability across modalities (i.e., visual = auditory) implies that the reliability of visual stimuli, except for spatial resolution (Alais & Burr, 2004), had to be reduced for prioritisation of auditory processing over visual processing. This visual bias is potentially because the updating of working memory in the present study was based on a visual spatial task, whereby a target location was presented visually and participants were required to visualise the target location rather than using another modality (e.g., audition or haptics). We also noted a quantitative difference between visual and auditory moving stimuli: the visual stimuli consisted of 100 visual dots (with 21.9°/s velocity), whereas the auditory stimuli consisted of one sound source (with 1.0–7.1 m/s velocity). Such quantitative differences in stimuli, other than discriminability, must be adjusted to further examine visual dominance in navigation. However, this visual bias is not incompatible with the notion of processing symmetry; we demonstrated auditory dominance when visual discriminability was decreased relative to auditory discriminability. Importantly, as suggested by findings regarding the perceptual integration of audiovisual location (Battaglia et al., 2003), our results may allow for biases in both the use of visual information and the weighted average of reliability-based information.
In a similar context, we found that the interference and facilitation effects of to-be-ignored auditory directions with high stimulus salience were likely to be weak, compared with such effects of to-be-ignored visual directions: the interference effect was particularly weak. Specifically, in the “visual > auditory” condition (Experiments 2D and 3D), we observed performance degradation in the attend–auditory–incongruent trials, compared with the attend–auditory-unimodal trials, because of the involuntary guidance by to-be-ignored visual incongruent directions; we observed accuracy improvement in the attend–auditory–congruent trials. In contrast, in the “visual < auditory” condition (Experiments 2B, 2C, 3B, and 3C), the same interference and facilitation effects of to-be-ignored auditory directions appeared inconsistently across the experiments. For instance, interference from the to-be-ignored auditory directions was weak (Experiments 2C) or generally negligible (Experiments 2B and 3B), except in Experiment 3C, in which both effects were observed. Conversely, the facilitation effect, indicated by higher performance in the attend–visual–congruent trials than in the attend–visual-unimodal trials, was replicated in Experiments 2B, 3B, and 3C, but not in Experiment 2C. These consistent results and the small auditory-interference effect support a visual bias that implies the presence of greater visual effects, compared with auditory effects.
The visual bias observed under the conditions of equalised visual versus audio discriminability (i.e., visual = auditory, Experiment 3A) was also supported by response-time analyses. Table 5 shows that the unimodal visual cue elicited shorter mean response times than did the unimodal auditory cue (M = 592.09 ms in the attend–visual-unimodal trials and M = 855.16 ms in the attend–auditory-unimodal trials, p < .001). The 276 ms difference in direction discrimination may be inconsistent with modality-specific differences in neural transmission times for detecting visual and auditory stimuli, as Loomis et al. (2012) assumed that a time difference of approximately 26.3 ms can be observed. Rather, the performance favouring visual directions might reflect the relatively high speed of analysing visual directional cues, which implies that the latency required to discriminate directions of auditory distance cues in the present study was probably longer than that for visual direction discrimination (but see Loomis et al., 2012). We further excluded the possibility of stimulus localisability being confounded with the modality specificity of the visual and auditory stimuli by demonstrating that the mean response times (854.25 ms vs. 876.47 ms) for auditory and visual discrimination were comparable (p = .635), even when auditory discriminability was increased over visual discriminability in the visual < auditory condition (Experiment 3B).
Furthermore, experiments containing the “visual < auditory” condition (e.g., Experiments 2B, 2C, 3B, and 3C) implied that updating accuracy in the attend–auditory block could be disrupted by to-be-ignored visual directional cues, regardless of whether auditory discriminability increased (i.e., when to-be-ignored visual cues were less informative). Notably, in terms of the percentage of correct responses, accuracy in Experiment 2B was reduced in the attend–auditory–congruent trials compared with the attend–auditory-unimodal trials; lower performance was also observed in the attend–auditory–incongruent trials, compared with the unimodal trials. These results indicate that to-be-ignored visual cues with less discriminability might involuntarily lead to navigation to incorrect directions, regardless of whether the concurrently presented cues in the attend–auditory block provide congruent or incongruent directions. This phenomenon implies that the visual stimuli provided noisy and thus spatially uncertain cues. Given that participants were involuntarily guided by such visual cues because of potential visual bias towards the use of information in the discrimination of directional cues, navigation accuracy was impaired regardless of whether the directions were congruent with the auditory target directions, compared with the unimodal (only auditory) condition. Thus, the involuntary response to visual guidance led to decreased performance in the attend–auditory block with high stimulus salience in Experiment 2B. We also found that this reduction in updating accuracy in the “congruent” trials, compared with the “unimodal” condition, was eliminated in the response-deviation results of this Experiment 2B, as well as in the results of two measurements (i.e., percentage of correct responses and response deviation) in subsequent experiments (i.e., 2C, 3B, and 3C). In these experiments, performance in the attend–auditory–congruent and attend–auditory-unimodal trials was comparable, although updating-accuracy values were consistently lower in the attend–auditory–incongruent trials than in the unimodal trials. However, we argue that the mechanisms underlying these interference findings were similar: the to-be-ignored visual cues with low stimulus salience caused involuntary guidance and disruption of navigation in the attend–auditory block. The inconsistent findings across these experiments (Experiments 2B vs. other experiments) regarding decreased influence in the “congruent” trials may indicate that this effect is exaggerated when the directions are incongruent, but not when they are congruent. Regardless of whether the visual cues delivered ambiguous information, reliability would be higher in the “congruent” condition. Importantly, Experiment 2B supports this hypothesis, indicating that the percentage of correct responses in the attend–auditory block decreased linearly in the order of the attend–auditory-unimodal, attend–auditory–congruent, and attend–auditory–incongruent trials.
The results demonstrate that spatial navigation was reduced or facilitated by stimuli delivered by the unattended modality during updating of to-be-attended locations (Experiments 1 and 2), whereas the process of selecting the direction of navigation preceded when encoding directional cues into working memory representation (Experiment 3). Accordingly, we argue that the same effects of modality and interference (or facilitation) that occurred during representation updating were replicated in the early stages of the update (e.g., encoding the perceptual inputs into representations). This finding appears to be consistent with the notion that selective prioritisation of memory contents in working memory and sensory input in perception are activated in a similar manner (e.g., Myers et al., 2017; Oberauer, 2019).
This result is notable, because the two tasks involving updating working memory (Experiments 1 and 2) and that involving discriminating directions (Experiment 3) in this study are primarily different with regard to the stages of the spatial update. The paradigm of the direction-discrimination task mainly recruits processes for the selection of task-relevant information that is newly acquired during encoding. However, working-memory navigation is not simply an updating task that involves the selection and encoding of new inputs; it also involves the maintenance of a new-direction input and a current-target location, suppression of an irrelevant direction, selection of an old location, and replacement of the old location with a new location. The present results imply that these two tasks, in which the involvement of updating processes could differ, may recruit a similar process of cue prioritisation; alternatively, the results may indicate that the characteristics of visual or auditory dominance in the initial stage simply persist in the subsequent updating stages. For example, the processes after encoding (e.g., maintenance or updating) were eventually based on the contributions of visual or auditory dominance that were determined during encoding, yielding similar observations across experiments.
Considering that the spatial updating task recruits the processes of encoding and manipulating (e.g., maintaining or replacing) memory contents in a comprehensive manner, incorrect responses are likely to have reflected one or more failures in these relevant updating processes. Importantly, lower navigation performance might have been attributed to incorrect selection of a modality cue, incorrect maintenance of a current target location, or incorrect updating of the location. These types of errors are not distinguishable in the results of the mental-pathway task used here; this is a limitation of this study. However, based on the response-deviation results, these errors were consistently reflected in larger deviations between the estimated location (i.e., the response location) of a participant and the actual target location. Thus, lower accuracy in the correct response rate may have originated from the large response deviation. Further analysis that involves measuring the spatiotemporal characteristics of response deviations may help to identify the stages of working-memory updating at which large navigation errors occur. For example, Maezawa and Kawahara (2021) reported that incorrect responses corresponded to a cell in spatial and temporal proximity to a correct location. That finding implies that participants may have successfully followed the cues and thus maintained a degree of accurate location memory, as indicated by the high discrimination accuracy in Experiment 3A of the present study.
The direction-discrimination task (e.g., the “visual = auditory” condition of Experiment 3A) resulted in high performance, compared with the performance of working-memory navigation in the same condition (e.g., Experiment 2A). Thus, although participants were able to follow and use the directional cues, they failed to identify the final target destination. These are apparently contradictory findings. However, even when the discrimination accuracy for one of the eight directional cues is high (i.e., in a single trial), the theoretical probability of successful identification of all eight consecutive cues is low. For instance, in Experiment 3A, the mean accuracy values of direction-discrimination were 97.50% in the attend–auditory-unimodal trials and 93.67% in the attend–visual-unimodal trials, thereby confirming 81.67% and 59.27% of expected probabilities for all eight consecutive discriminations (values to the eighth power), respectively. Indeed, we observed that the navigation accuracy values in Experiment 2A were lower than the expected probabilities of consecutive discriminations: 54.67% for attendant-auditory-unimodal trials and 46.67% for attendant-visual-unimodal trials. This difference between the expected accuracy (i.e., of consecutive discriminations) and the actual navigation accuracy may reflect an increase in response errors caused by failure to maintain the current position or failure to update positions, in addition to failure to discriminate one modality cue.
Consistent with previous studies of auditory working memory (e.g., Lehnert & Zimmer, 2006; Maezawa & Kawahara, 2021), we focused on modality dependence in the updating function of spatial working memory to clarify the similarities between auditory and visual working memory. Our results indicate processing symmetry, which involved less influence of modality during updating of working memory, except for the overall visual bias mentioned above. This is consistent with the notion that concurrent navigation or tracking is performed without functional differences between auditory and visual modalities (Fougnie et al., 2018; Martinkauppi et al., 2000). For example, the findings in our previous study (Maezawa & Kawahara, 2021) imply that memory contents can be updated without requiring any executive demands to exchange the current manipulated information with new information. This finding was based on an analysis of the percentage of correct responses; however, when we reanalysed the data by measuring the response deviations based on the numbers of cells from the target, the estimation of Bayes factors BF10 in Experiment 3 of the previous study consistently implied no effect of modality on updating performance (BF10 = 0.18, below 0.33). Nevertheless, we cannot ignore the notion of modality-dependent working memory implied by the theories of independent attentional resources across modalities (e.g., Alais et al., 2006; Arrighi et al., 2011). As suggested by the visual bias, updating may be dominated by modality-specific features of visual objects, such as information with high spatial resolution (Lehnert & Zimmer, 2006) or stimulus salience. Lehnert and Zimmer (2008b) suggested that dependence on a particular modality (e.g., vision) occurs at least in the encoding stages of updating. An analogous hypothesis was proposed by Loomis et al. (2012), in which costs for the selection of a target stimulus from a mixture of visual and auditory spatial locations were incurred only during the early stages of spatial-representation monitoring.
Based on modality generality in spatial updating (Maezawa & Kawahara, 2021), models of working memory (e.g., Baddeley & Hitch, 1974; Logie, 2011) can posit the system operating location-based representations by relying on central sources (Fougnie et al., 2018) for tracking spatial information. This working-memory system may utilise attentional resources relevant to postperceptual processing, rather than resources relevant to attention towards perceptual inputs (Chun et al., 2011; Tamber-Rosenau & Marois, 2016). Accordingly, representations in spatial working memory are formed regardless of the auditory or visual modality, similar to a model of visual working memory (Logie, 2011). This spatial system may contribute to retention and reactivation of the path of a target location (Awh et al., 1998; Awh & Jonides, 2001; Logie, 2011; Smyth & Scholey, 1994) with less modality specificity (Maezawa & Kawahara, 2021). The present experiments might have measured updating ability that strongly depends on this central system or a component thereof (Fougnie et al., 2018), resulting in findings consistent with theories that suggest an amodal system of working memory.
In conclusion, the present study demonstrated similarities between visual and auditory spatial working memory in updating spatial representations. The updating task relied on the selection of spatial inputs during and after encoding. The memory inputs were filtered according to their stimulus salience. Stimulus modality was not a critical determinant in updating processes. Working-memory navigation could be optimised by using this prioritising strategy to filter representations from cluttered information. However, navigation benefitted only when the task-relevant stimuli were relatively salient to the counterpart competing stimuli. If the distractor stimuli were more readily available than the task-relevant stimuli, the information conveyed would involuntarily interrupt the updating process. Thus, updating success or failure was due to the dominant representation as a result of the automatic selection of sensory inputs. We suggest that minimising this interference improves online control for manipulating representations, such as tracking visual and auditory cues from an approaching vehicle.
Supplemental Material
sj-docx-1-qjp-10.1177_17470218221103253 – Supplemental material for Processing symmetry between visual and auditory spatial representations in updating working memory
Supplemental material, sj-docx-1-qjp-10.1177_17470218221103253 for Processing symmetry between visual and auditory spatial representations in updating working memory by Tomoki Maezawa and Jun I Kawahara in Quarterly Journal of Experimental Psychology
Footnotes
Declaration of conflicting interests
The author(s) declared no potential conflicts of interest with respect to the research, authorship, and/or publication of this article.
Funding
The author(s) disclosed receipt of the following financial support for the research, authorship, and/or publication of this article: This work was financially supported by a Grant-in-Aid from the Japan Society for the Promotion of Science Fellows (20J20490) to T.M. and a Grants-in-Aid for Scientific Research from the Japan Society for the Promotion of Science (20H0177901) and (20H0178911) to J.I.K. The funders had no role in the study design, data collection and analysis, decision to publish, or preparation of the manuscript.

Data accessibility statement
Notes
References
Supplementary Material
Please find the following supplemental material available below.
For Open Access articles published under a Creative Commons License, all supplemental material carries the same license as the article it is associated with.
For non-Open Access articles published, all supplemental material carries a non-exclusive license, and permission requests for re-use of supplemental material or any part of supplemental material shall be sent directly to the copyright owner as specified in the copyright notice associated with the article.
