



Abstract
Studies have previously demonstrated that different spatial representations may affect the spatial-numerical association of response codes (SNARC) effect for numbers; however, limited studies have assessed the SNARC effect for letters. In this study, event-related potentials (ERPs) were used to measure the influence of two spatial representation modes (ruler and clock) on the SNARC effect. The ruler produced a SNARC-like effect; i.e., the left hand reacted faster than the right to the letters that appeared before N in the alphabet; the right hand reacted faster than the left to the letters that appeared after N, whereas the clock produced a reverse SNARC effect. In addition, the ERP data showed that the SNARC-like effect for letters in both representations induced significant activation in the frontal and parietal regions, indicating that the same brain areas are involved in processing letters and numbers in terms of spatial dimensions. This study further identified the conditions for the SNARC effect and proved that the SNARC effect is attributed to the simultaneous participation of brain regions for sequence and spatial information processing.
Introduction
Numerical processing refers to the mental representation of numbers when the human brain processes information related to numerical cognition (such as counting ability). Dehaene et al. performed a series of experiments on numerical processing (Dehaene et al., 1990, 1993; Dehaene & Mehler, 1992), demonstrating that participants pressed the left button faster than the right button for smaller numbers, while the opposite was true for larger numbers. Dehaene et al. (1993) coined the term “spatial-numerical association of response codes” (SNARC) to describe this phenomenon and considered the human brain to characterise numbers as a mental number line from left to right, with small numbers on the left and large numbers on the right. When the mental spatial position of numbers on this line, referred to as the mental number line, was consistent with the response position, the response was fast; otherwise, the response was slow (Dehaene et al., 1993; Gevers et al., 2003). Podwysocki et al. (2019) believed that the mental number line was a general phenomenon that could be applied to any ordered list. Other studies have examined the relationship between number and space (for a recent review see Guida & Campitelli, 2019). Previous studies assessing the SNARC effect for horizontal orientation representation (Calabria & Rossetti, 2005; Fischer, 2001; Fischer et al., 2003; Gokaydin et al., 2018; Schwarz & Keus, 2004) support the theoretical explanation of a mental number line. A study by Cheung and Lourenco (2016) also confirmed the relationship between the size of a number and the representation of space. Thus, different forms of spatial representations generate different SNARC effects. Accordingly, previous investigators focused on the influence of different spatial representations on the SNARC effect, and three different results were observed: the SNARC effect, the reversed SNARC effect, and the non-SNARC effect. Mourad and Leth-Steensen (2017) proved that the SNARC effect was not significant for both the horizontal and vertical tasks when the imagined array position and the position that needed a response were inconsistent. According to Pan et al. (2019), whether the SNARC effect plays a role depends on the spatial compatibility of the external spatial reference frame and the internal numerical spatial representation reference frame; in the near and far dimensions, the object-based spatial reference frame will show a more significant SNARC effect. Bächtold et al. (1998) not only confirmed the existence of the SNARC effect, but also found a reversed SNARC effect when experimental materials were displayed in a clock formation. These results confirm the influence of spatial representation on the SNARC effect.
However, the explanation for the underlying cause of the SNARC effect remains contentious. When numbers are used as experimental materials, it is impossible to determine whether the effect is caused by their quantity or sequence characteristics. Some investigators have found that sequence information may cause the SNARC effect (Gevers et al., 2003, 2004; Podwysocki et al., 2019; Previtali et al., 2010; Zhu & Wang, 2014). Since a number may contain quantity information, it can also represent a positional relation and sequential order, which appears to indicate the quantity and sequence characteristics of a number to be related directly. Turconi et al. (2006) demonstrated that quantity processing and sequence processing of numbers utilise two discrete processes. Herrera et al. (2008) also used a dual-task paradigm in which participants performed a magnitude comparison task; the results demonstrated that a relationship between the SNARC effects and quantity characteristics of numbers does not necessarily exist. Researchers also found the SNARC effect by using language and character from different countries as experimental materials. Gevers et al. (2005) used English letters; Ding et al. (2010) used Russian letters; Yang and Zhang (2010) used Russian letters; Kopiske et al. (2016) used Chinese numbers; and Zohar-Shai et al. (2017) used Greek letters as experimental materials for relevant studies. Using letters as experimental materials separated the quantity and sequence characteristics, and all relevant results demonstrated the existence of the SNARC effect. Increasingly, studies have supported the notion that SNARC-like effects result from sequence characteristics. However, few related studies have explored SNARC-like effects from different spatial perspectives.
The cognitive neuroscience studies have also given more evidence for the spatial orientation of the SNARC effect, and researchers generally agree that the interaction between numerical and spatial information arises in the parietal lobe, while sequential information activates more of the frontal lobe. Numerous findings suggest that the Bilateral Posterior Superior Parietal System is the neural basis for spatial attentional orienting on the mental number line (Dehaene et al., 2003; Brown et al., 2004; Kesner, 2009). If the parietal lobe is damaged, there are deficits in the processing of both spatial and quantitative information. In the study of sequential information processing mechanism, researchers generally believe that it is related to the prefrontal cortex. A study by Turconi et al. (2004) concluded that sequential judgement tasks activate more of the prefrontal lobe. Other researchers using functional brain imaging techniques have explored results showing that sequential information of stimuli activates more prefrontal cortex, temporal cortex, and parietal cortex than item information of stimuli (whether a particular stimulus is presented in sequential stimuli) and that sequential processing activates more frontal lobes than quantitative processing (Attout et al., 2022; Cabeza, 1997; Konishi et al., 2002; Marshuetz et al., 2000). However, there is a paucity of research on the brain neural mechanisms underlying the SNARC-like effect in different spatial representations of the letter with sequential properties, and the electrophysiological manifestations are not yet clear.
On the neural basis of SNARC effect, researchers have done a lot of explorations from different aspects. Turconi et al. (2004) used electrophysiological indices of event-related potentials (ERPs) and found that the task with letters as stimulus material evoked N1 and N2 components of the bilateral parietal lobe, i.e., early components related to vision, hearing, etc., and components related to cognitive processing such as attention and memory, to investigate the characteristics of electrophysiological processes between number comparison and sequential judgement relations (Hu & Zhang, 2019). For all tasks, the amplitude of P3 component induced by numbers is more significant, that is, it induces unpredictable stimuli related to perceptual processing (Hu & Zhang, 2019), showing a more significant distance effect. Correspondingly, this suggests that even though quantity and order have similar behavioural effects, they are different from those characterising the electrophysiology of parietal and prefrontal cortical time process. The N2 component of frontal lobe and parietal lobe will increase with the distance between numbers (Denes et al., 2004). For example, Han et al. (2017) used ERP technology to investigate the impact of the symbolic similarities and differences between standard number stimuli and comparative number stimuli on the SNARC effect. The results showed that N300 and P300 were induced in the response selection stage, and late positive potential (LPP) was induced in the reflection execution stage.
Previously published studies have primarily discussed the influence of different spatial representations on the SNARC effect from the perspective of behavioural evidence or the symbols that may cause the SNARC effect; however, there is a paucity of relevant studies supported by electrophysiological evidence. Therefore, this study sought to assess the relationship between different spatial representation modes and the SNARC effect for letters, as well as its internal psychological mechanisms. Considering the results of previous studies and the purpose of this study, our hypotheses were as follows: (1) in the ruler representation, upon randomly arranging the target letter on different scales and comparing its sequential order with that of the fixed letters in the alphabet owing to the existence of a SNARC-like effect, the response time for the target letters with spatial positions consistent with their positions in the alphabet will be shorter than that for letters with spatial positions not consistent with their positions in the alphabet; (2) in the clock representation, randomly arranging the target letters on different scales of the clock can produce the reversed SNARC-like effect, that is, the response time for the target letters with the spatial positions consistent with that in the alphabet will be longer than those not consistent with their positions in the alphabet, and (3) letter sequence processing activated the fronto-parietal network, thus corroborating the idea that the SNARC effect was caused by the sequential properties of the material.
Experiment 1: SNARC effect for the letters in the ruler representation
Methods
Participants
In line with previous studies (e.g., Gevers et al., 2006; Keus et al., 2005), 24 undergraduate and graduate students (Dehaene et al., 1993) in Soochow University (12 males and 12 females, aged 19–25 years, average age: 22.50 ± 2.50 years) were recruited and randomly assigned to one of the experiments. All volunteers were right-handed, with normal uncorrected or corrected vision and no history of mental illness. In addition, all volunteers passed the College English Test-4 (CET-4), which is required for all the students in university level in China. In our study, we took advantage of this test and choose the participants who passed CET-4 to ensure that they have the same level of English ability. This experiment was approved by the Ethics Committee of Soochow University and conducted in accordance with the Declaration of Helsinki; the approval number is 20160624. All the participants were financially compensated for their study participation.
Experimental materials and instruments
The experimental materials are represented in Figure 1. The fixation on the central screen appeared as a black “+,” and the stimulus materials were blue target letters, displayed with a black background on the white screen, and a visual angle of 3°20′. The experimental materials consisted of the capital letters B, H, T, and Z and the contrast letter N. The two letters B and H were displayed pseudo-randomly before N in alphabetic order, while T and Z were displayed after N in the same manner. A within-subject design of 2 (response hand: left hand vs right hand) × 2 (alphabetic order: before N vs after N) was adopted in the experiment, and the dependent variable was the response time.
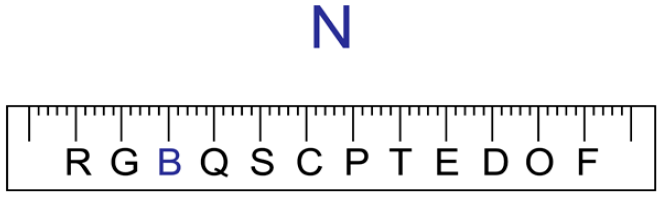
Example of materials in Experiment 1.
Procedure
The procedure was compiled and presented using E-prime 2.0 software (Psychology Software Tools Inc., Pittsburgh, PA). During the experiment, the participants were seated approximately 80 cm from the computer screen; they stared at the centre of the screen and placed their left and right index fingers on the F and J keys of the computer keyboard, respectively. First, a black “+” fixation was presented in the centre of the screen for 600 ms. After the fixation disappeared, random stimuli were presented in the centre of the screen. The participants were asked to compare the order of the capital letter “N” with the highlighted capital letter (B/H/T/Z) in the alphabet and to respond with a keystroke followed by the end of the trial. The experiment was divided into two parts to balance the sequence effect of the experiment and the left and right hands. The stimulus materials in each set of tests were randomly presented. In the first part of the experiment, participants responded by press the left-handed key F for letters that appeared before N in the alphabet, and press the right-handed key J for letters that appeared after N in the alphabet, and vice versa in the second part of the experiment. After the response, the stimulus disappeared. The stimulus also disappeared if the participants did not respond until 2,500 ms. Next, there was a blank screen of 500 ms. Then, the next trial started. For each set of tests, there were 20 trials of exercises before the experiment, and during the exercises, the participants were informed whether they responded correctly or incorrectly. After the exercises, the participants were given a break of 1 min, after which the experiment begun. In the experiment, each of the four stimuli was displayed for 30 times, with 120 trials for each set of tests, and another 120 trials to balance the sequence effect of the left and right hands, which resulted in a total of 280 trials with 20 trials of practice for the whole experiment. In each trial of exercises, the participants would be informed of whether they responded correctly or incorrectly. Participants were asked to respond quickly and correctly.
EEG recording and data processing
In this experiment, the corresponding electrophysiological signals were recorded by means of an EEG acquisition and analysis system from brain products (Gilching, Germany). An Ag/AgCl electrode cap with the international 10–20 extended electrode position system was used. The electrode at the left mastoid process was used for recording, and that at the right mastoid process served as a reference electrode. The mean of the bilateral mastoid processes was used as a reference for off-line data analysis. Two electrodes above and below the right orbit were used for vertical electrooculogram recording, and two electrodes at the outer corner of both sides were used for horizontal electrooculogram recording. The grounding electrode was located between FPz and Fz. The sampling frequency for the EEG signals was 500 Hz, and band-pass filtering was performed at 0.05–100 Hz. The resistance between each electrode and the scalp was under 5 kΩ in the recording EEG. EEG data of 200–1,000 ms were intercepted in the experiment, and the blink artefact was corrected with a regression procedure. Trials with amplitudes other than ±80 μV were excluded before superimposing, and only the correct trials were superimposed. A time-domain analysis method was adopted, with 100–160 ms, 160–280 ms, 280–520 ms, 520–760 ms, and 760–1,000 ms as the time windows based on the time window selection and visual ERP waveform detection of previous investigators. The analysed location was divided into four parts: the prefrontal region (Fp1, Fp2), frontal region (F3, F4), central region (C3, C4), and parietal region (P3, P4). The average electric volt value of the electrodes in the regions was used for analysis.
Results
The average accuracy of the 24 participants was 92.72%. A total of 280 data trials were collected for the experiments, in which the data of four participants with high error rate, and the data of wrong responses of participants, as well as the data outside the mean value ± 3 standard deviations of the correct responses, were removed (Si et al., 2013). Finally, the valid data from 20 participants were retained for further analyses. A Fisher’s one-way analysis of variance (ANOVA) was used to compare the means of multiple groups, and the LSD method was used for post-test analysis (no post-test correction was needed, p = .05) using SPSS 20.0 software (IBM Corp., Armonk, NY) with the Greenhouse–Geisser method for calibration.
Behavioural data results
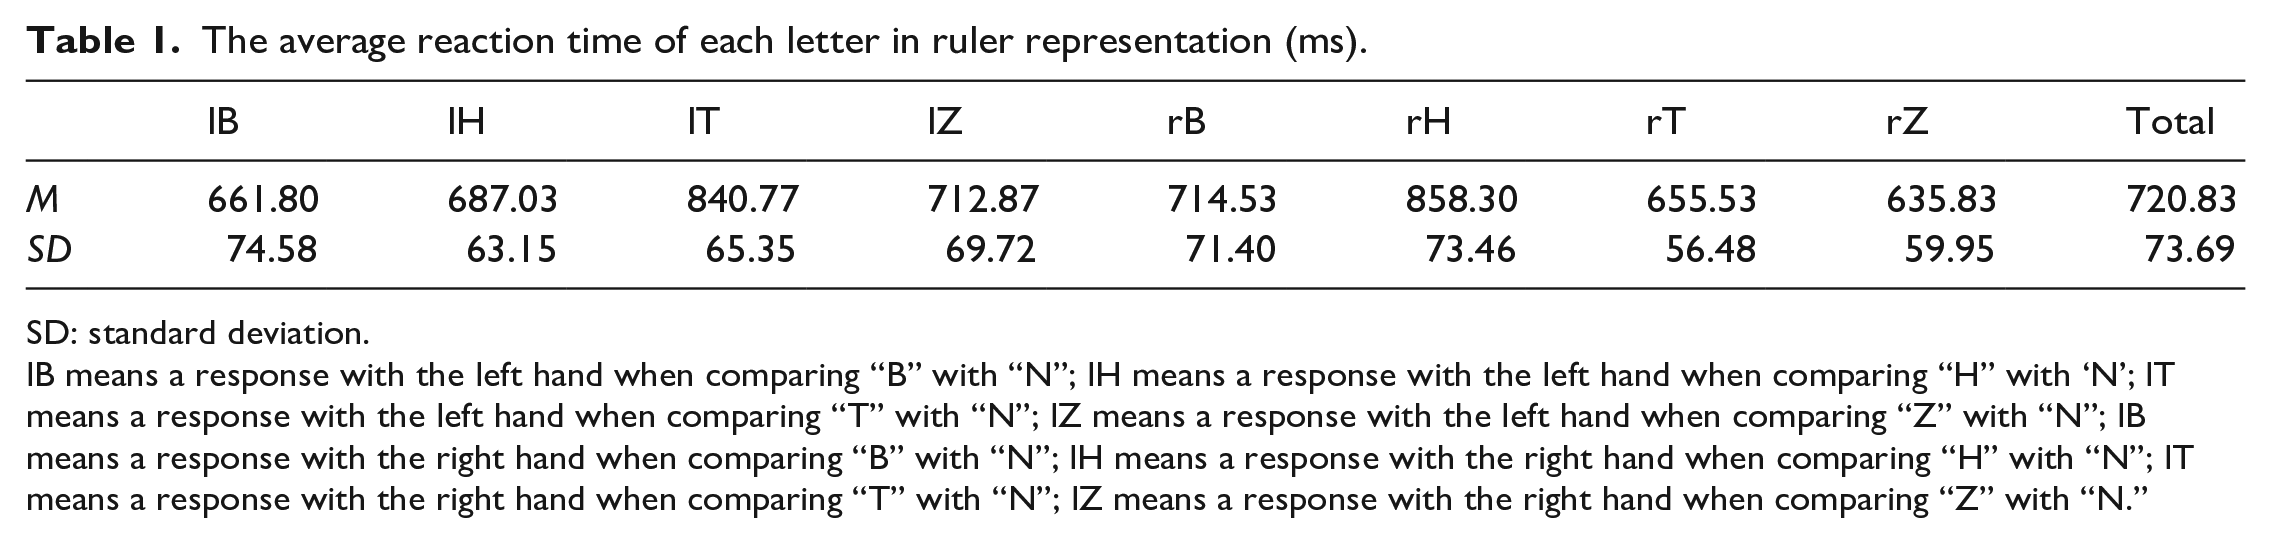
The average response times (dRT) of participants during the ruler representation are represented in Table 1. As shown in Figure 2, the results of ANOVA for repeated measurements of the response hands (left and right hands) × 4 alphabetic orders (B, H, T, and Z) revealed that the main effect of the response hands was not significant, F(1,19) = 1.33, p = .254; however, the main effect of the alphabetic order was significant, F(3,57) = 28.88, p < .001,
The average reaction time of each letter in ruler representation (ms).
SD: standard deviation.
lB means a response with the left hand when comparing “B” with “N”; lH means a response with the left hand when comparing “H” with ‘N’; lT means a response with the left hand when comparing “T” with “N”; lZ means a response with the left hand when comparing “Z” with “N”; lB means a response with the right hand when comparing “B” with “N”; lH means a response with the right hand when comparing “H” with “N”; lT means a response with the right hand when comparing “T” with “N”; lZ means a response with the right hand when comparing “Z” with “N.”
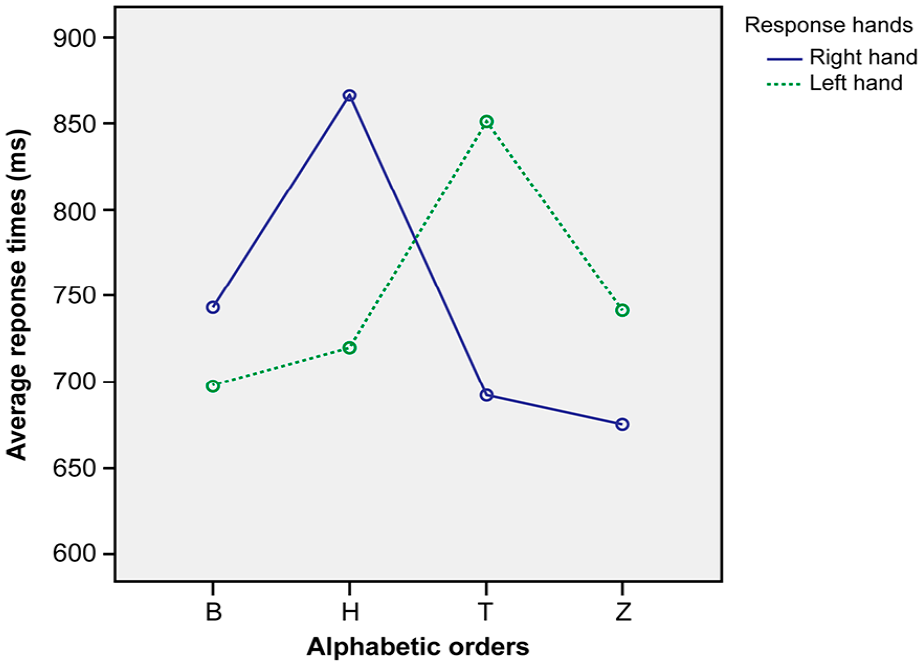
Interaction between the response hand and letter position in the ruler representation. The blue line represents the response hand is right hand, the green line represents the response hand is left hand.
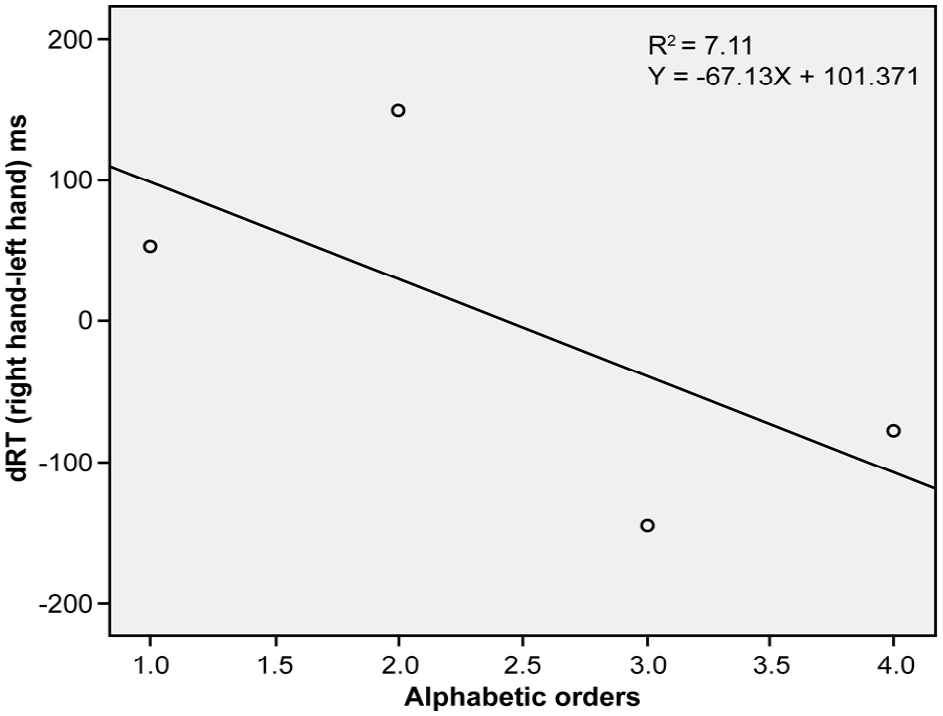
Spatial-numerical association of response codes (SNARC) effect in the ruler representation. The regression equation for these four points is shown in the upper right corner.
ERP data results
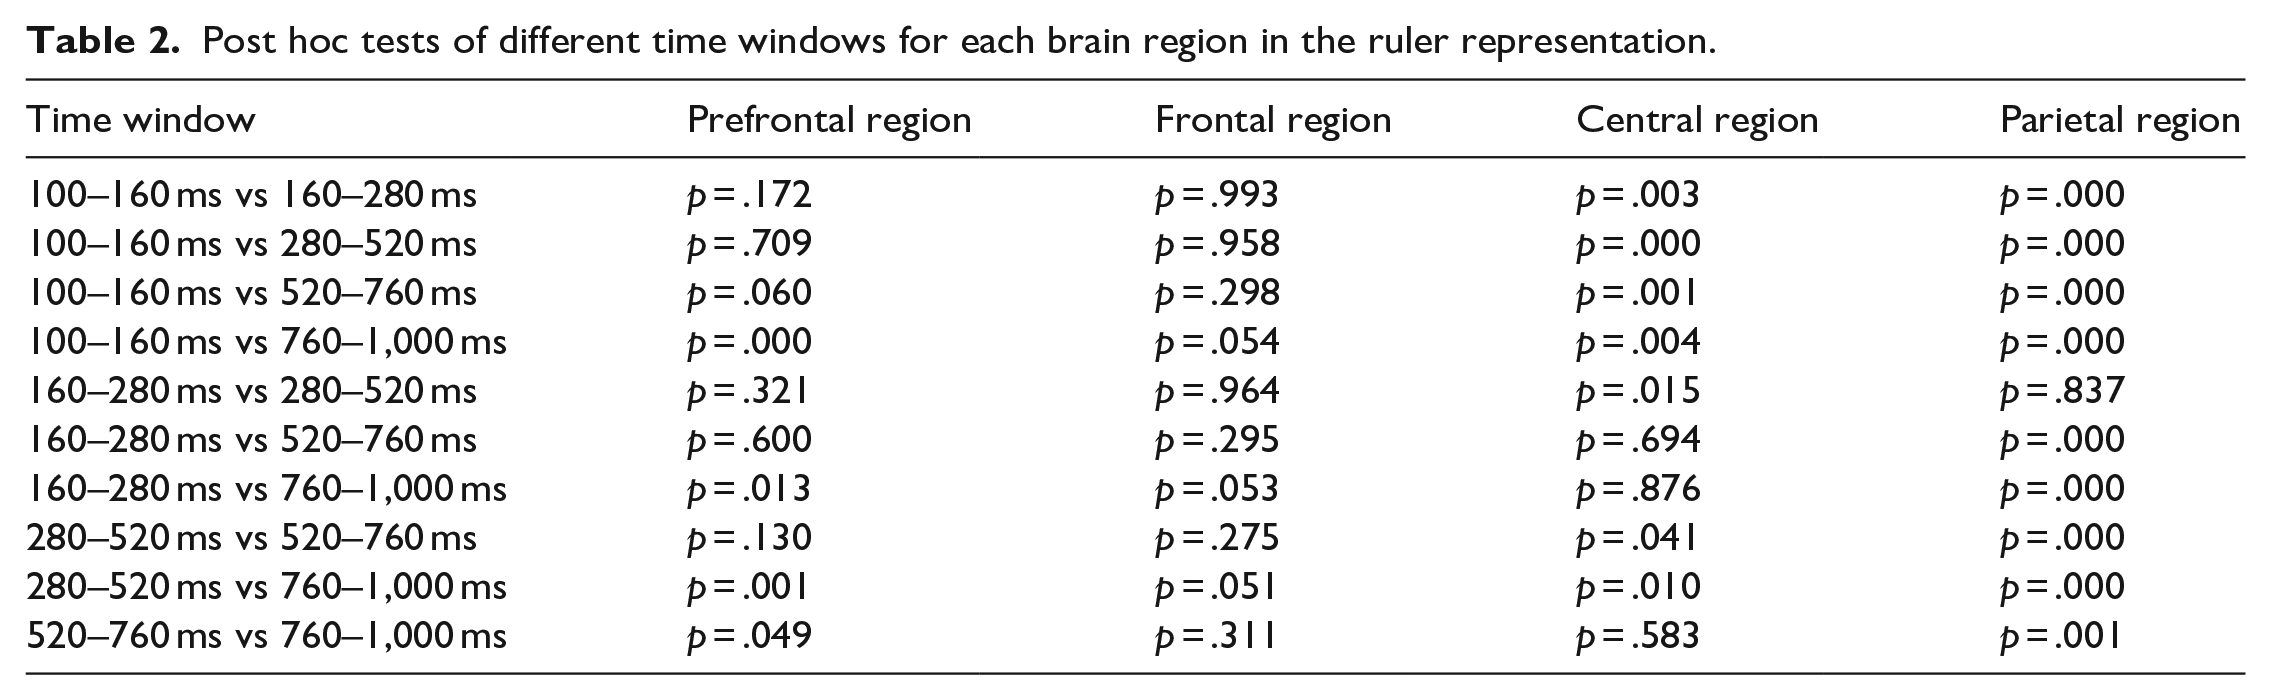
The differences in the distribution levels of the four brain regions across different time windows were analysed. After variance analyses, results revealed significant differences between time windows in the prefrontal region, F(4,195) = 4.664, p = .001,
Post hoc tests of different time windows for each brain region in the ruler representation.
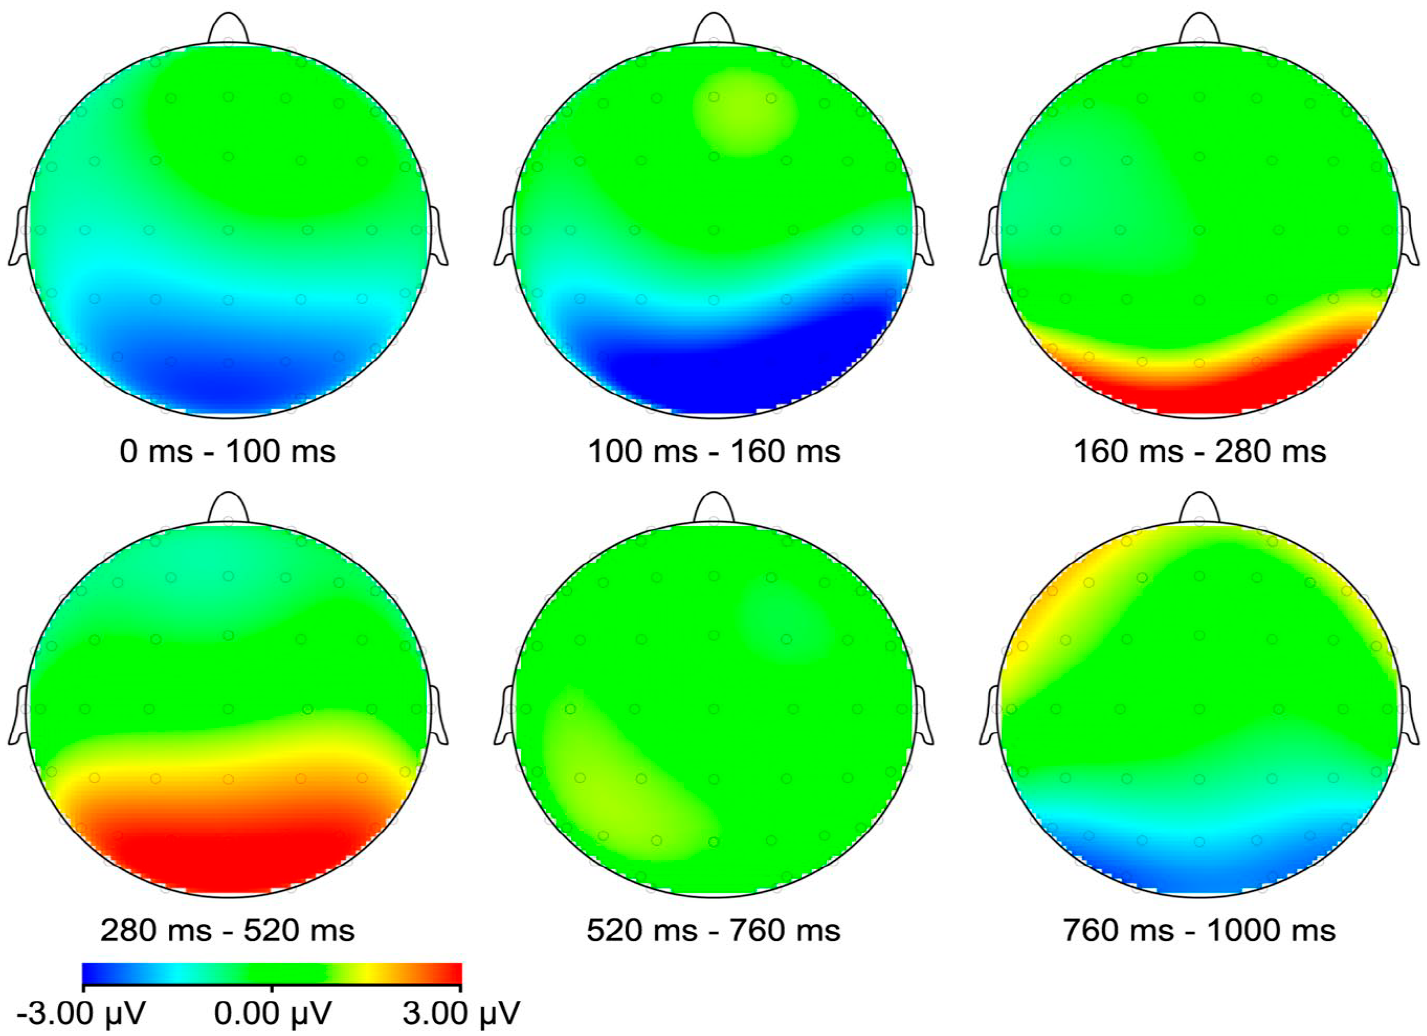
Map of the target letters before N in the ruler representation. The time windows are divided into 100-160 ms, 160-280 ms, 280-520 ms, 520-760 ms and 760-1000 ms.
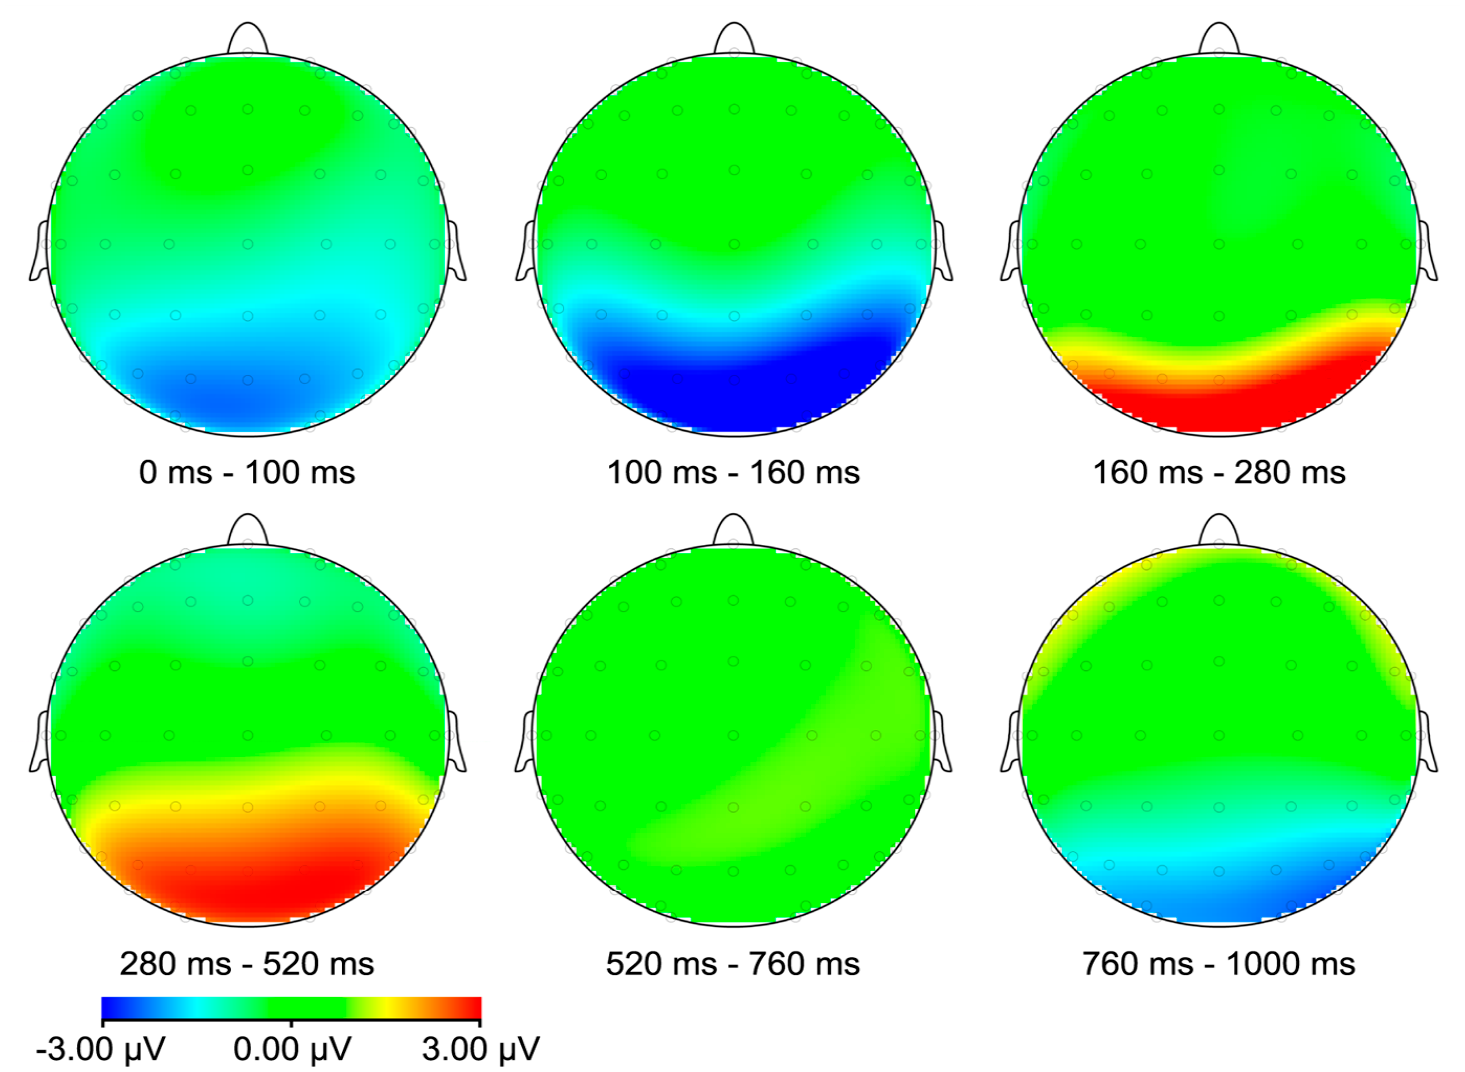
Map of the target letters after N in the ruler representation. The time windows are divided into 100-160 ms, 160-280 ms, 280-520 ms, 520-760 ms and 760-1000 ms.
Experiment 2: SNARC effect for letters in the clock representation
Methods
Participants
Participants were selected in a similar method as in Experiment 1.
Experimental materials and instruments
The experimental materials are shown in Figure 6. The instruments were used in the same way as in Experiment 1.
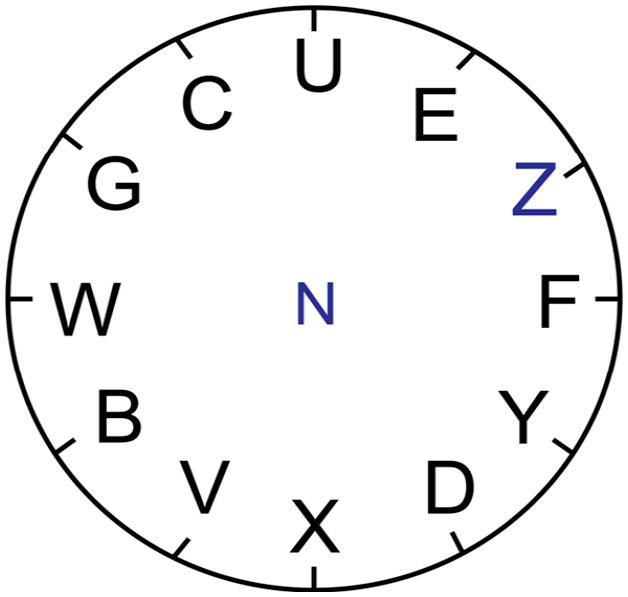
Example of materials in Experiment 2.
Procedure
The procedure was compiled and presented with E-prime 2.0 software. The experiment was also divided into two parts to balance the sequence effect of the experiment and the left and right hands. All the participants completed the first part of the test followed by the second part. The requirements and sequence for the experiment were the same as in Experiment 1. All the materials were presented randomly. Theoretically, the number of key presses and the probability of each letter were generally the same for the left and right hands. The number of experimental trials was also equal, and each practice trial also provided correct or incorrect feedback to the participants. Fast and correct responses are required.
EEG recording and data processing
EEG recording and data processing were performed in the same way as in Experiment 1.
Results
Behavioural data results
The dRT of the participants are represented in Table 3. As shown in Figure 7, the results of the ANOVA for repeated measurements of the response hands (left and right hand) × 4 alphabetic orders (B, H, T, Z) showed that the main effect of the response hands was not significant, F(1,19) = 0.03, p = .86; the main effect of alphabetic order was significant, F(3,57) = 10.10, p = .002,
The average reaction time of each factor level in the clock representation (ms).

SD: standard deviation.
The abbreviations have the same meaning as in Table 1.
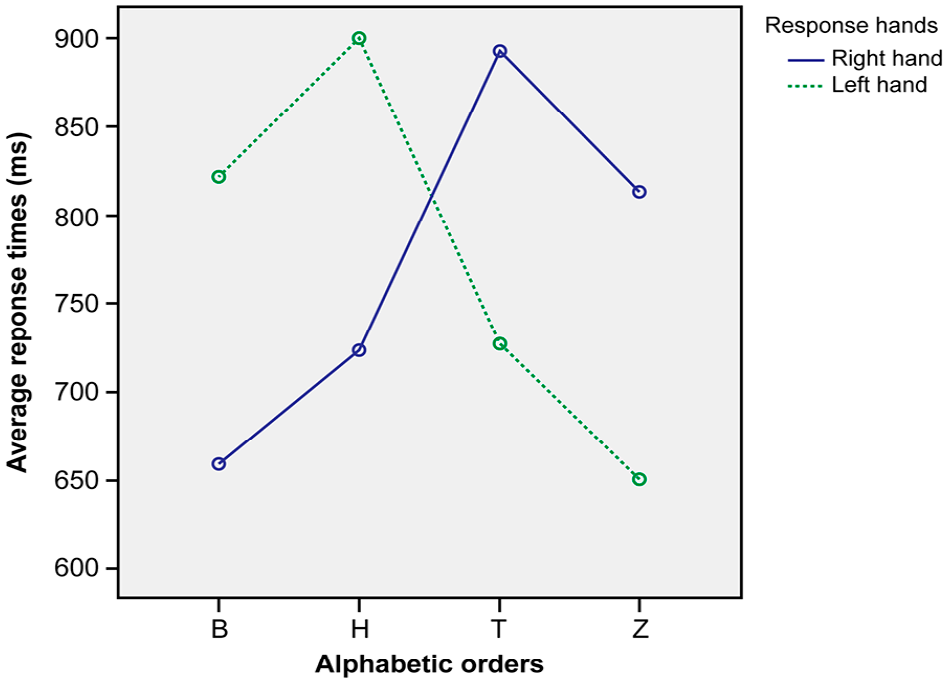
Interaction between the response hand and letter position in the clock representation. The blue line represents the response hand is right hand, the green line represents the response hand is left hand.
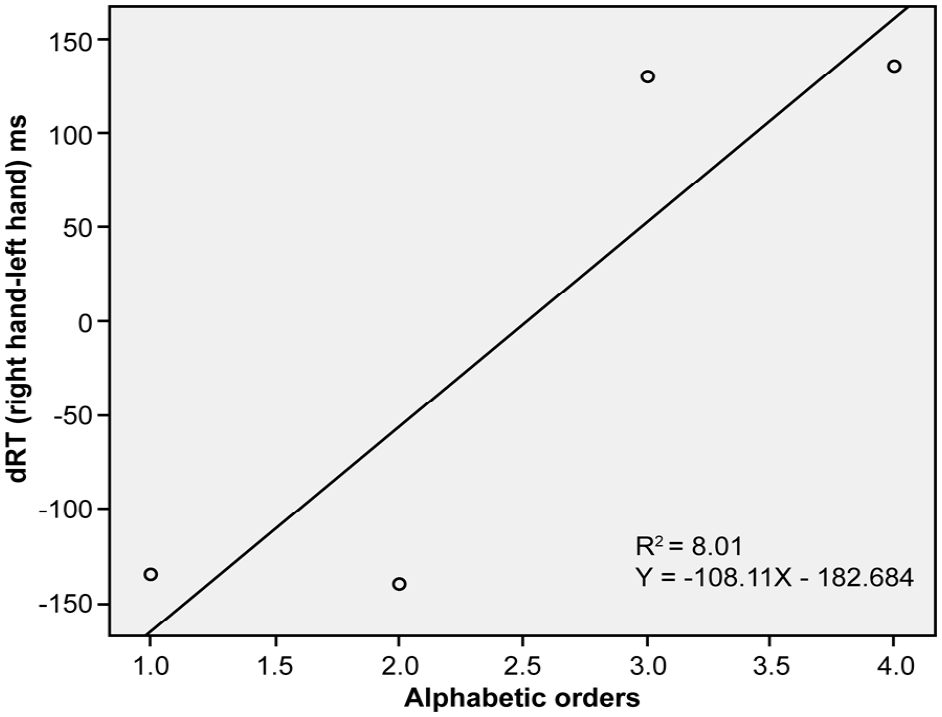
Spatial-numerical association of response codes (SNARC) effect in the clock representation. The regression equations for these four points are shown in the lower right corner.
ERP data results
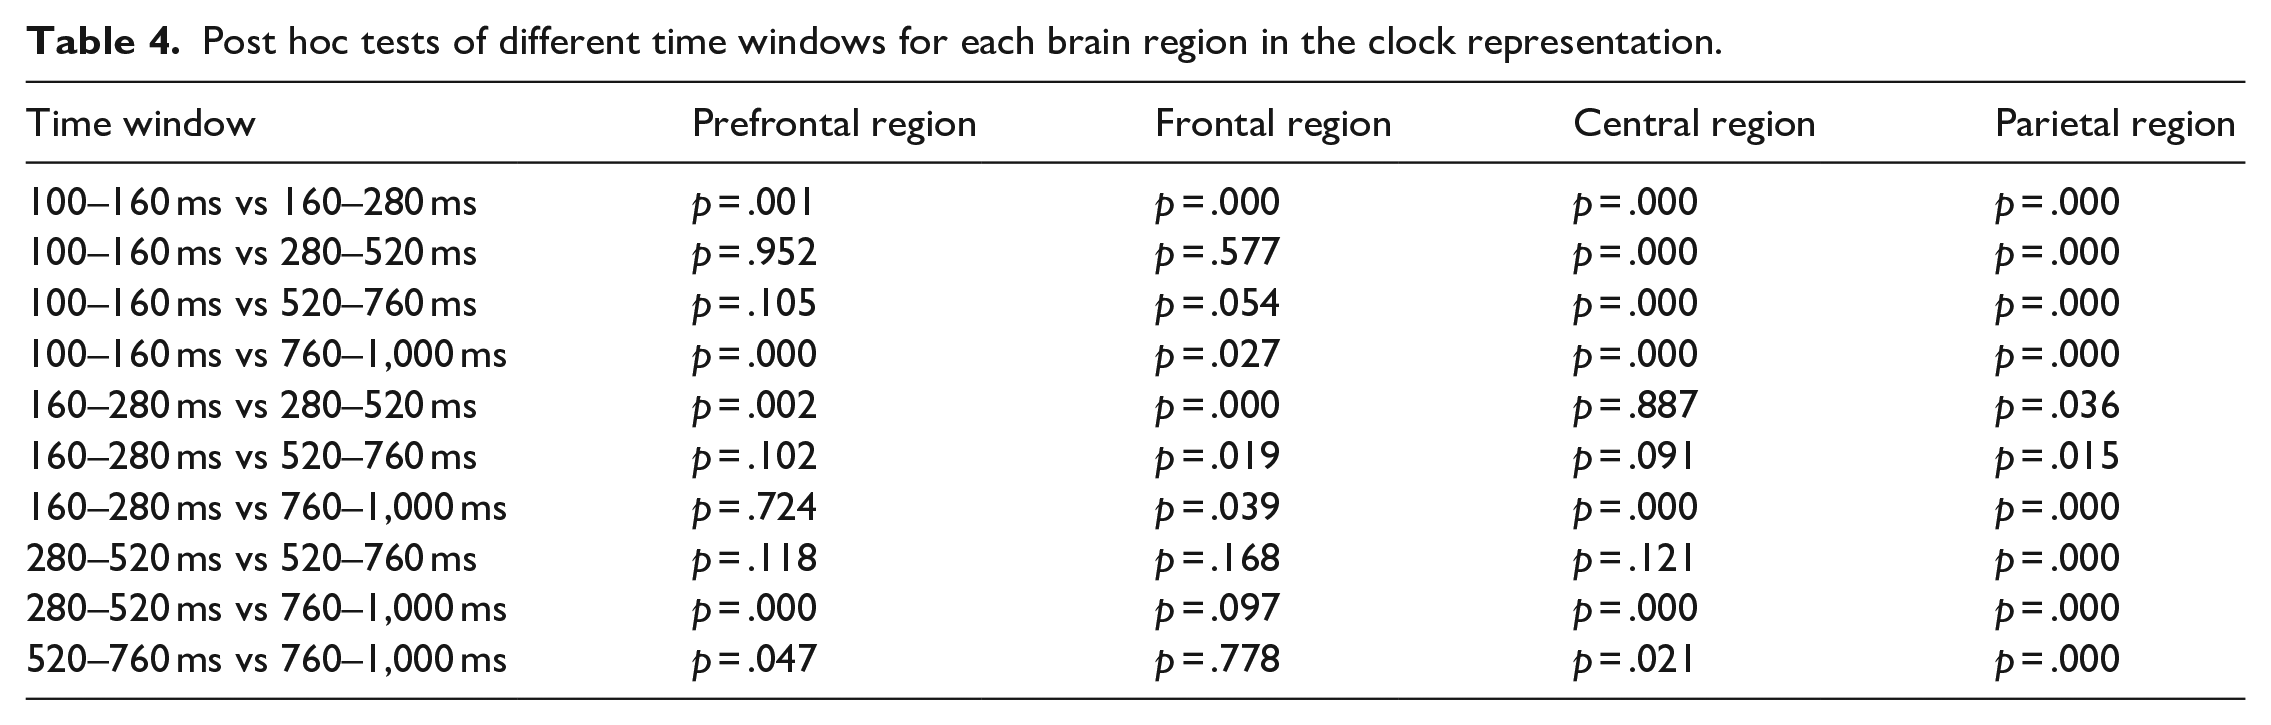
The differences of the distribution levels of the four brain regions in different time windows were analysed. After variance analysis, the results showed significant differences between time windows in the prefrontal region, F(4,195) = 5.886, p < .001,
Post hoc tests of different time windows for each brain region in the clock representation.
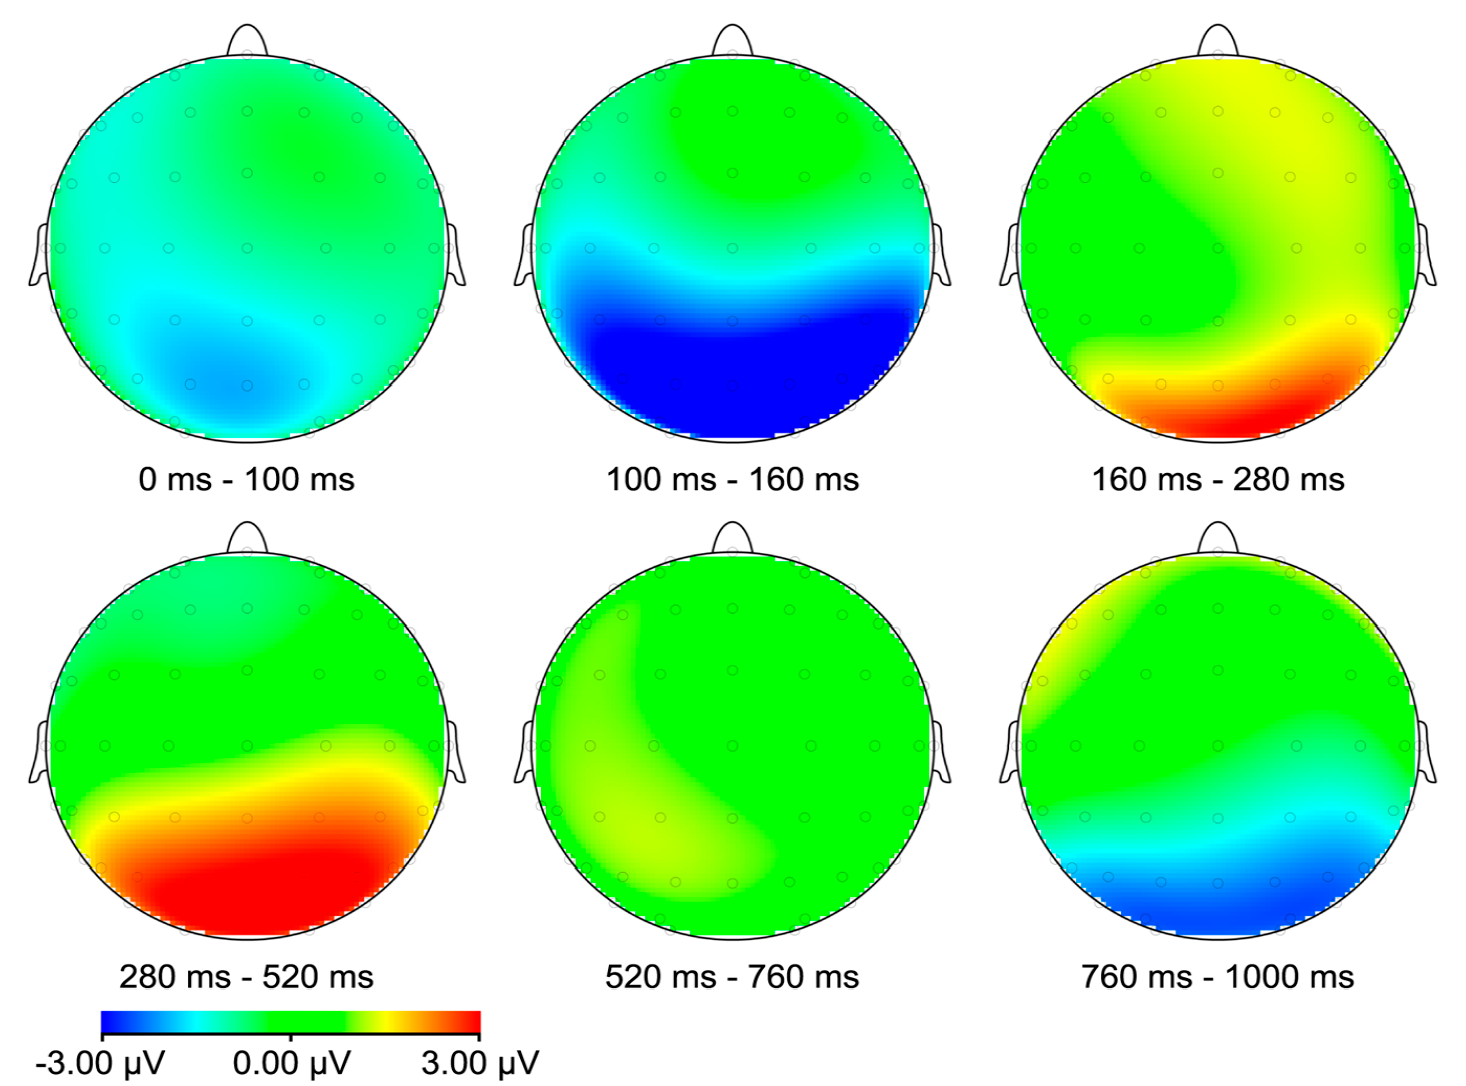
Map of the target letters before N in the clock representation. The time windows are divided into 100-160 ms, 160-280 ms, 280-520 ms, 520-760 ms and 760-1000 ms.
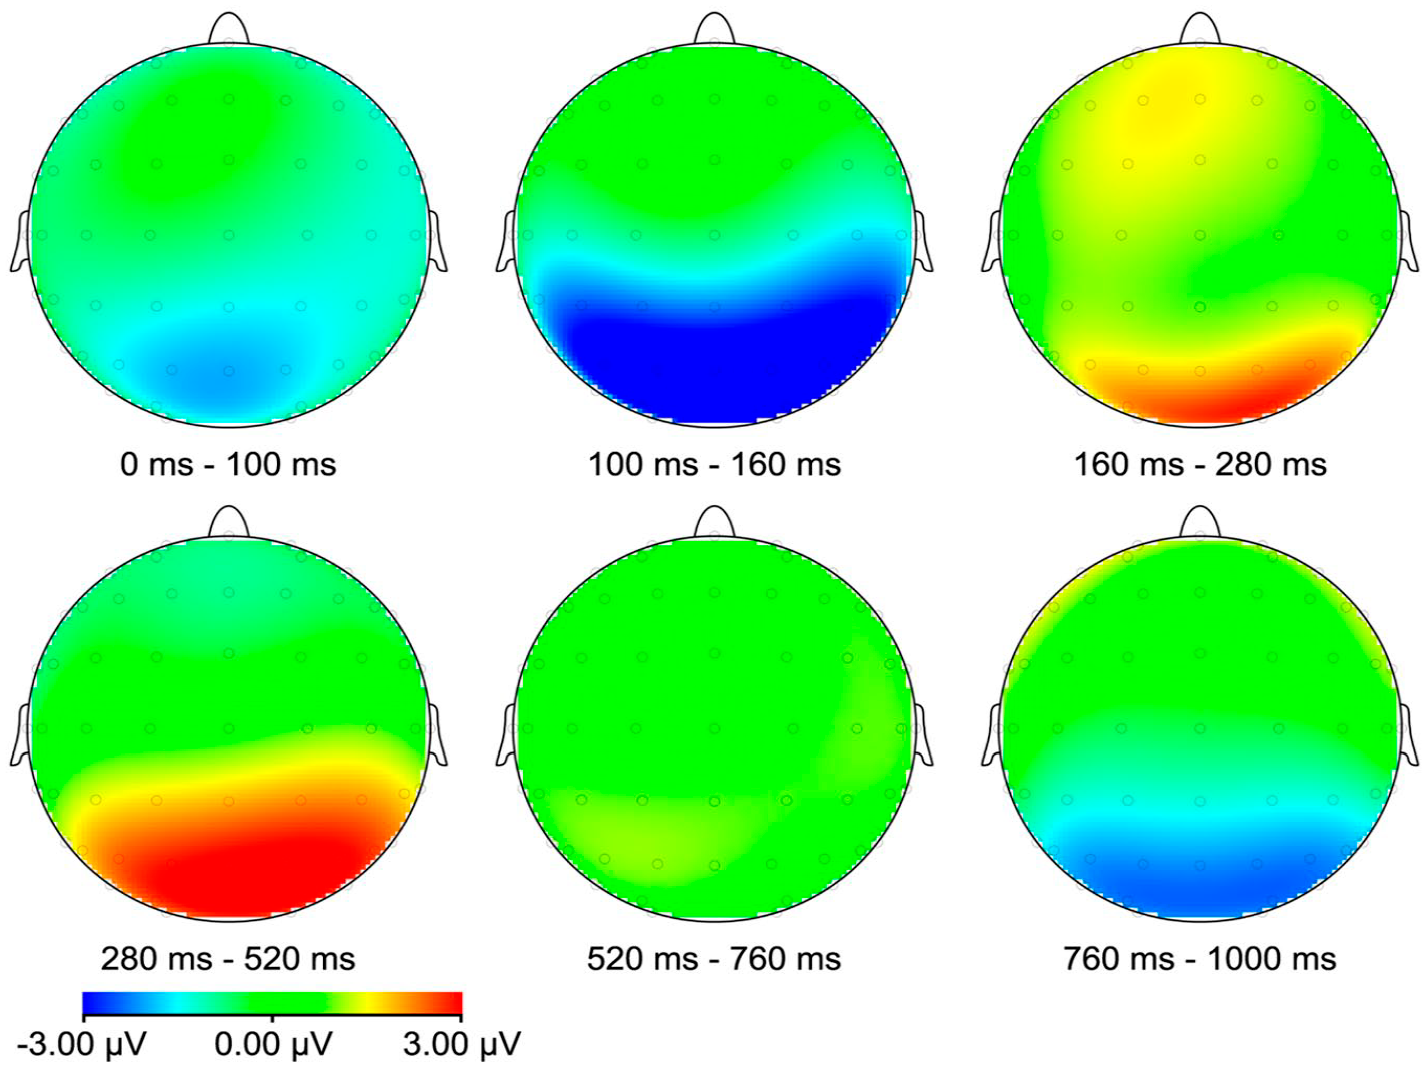
Map of the target letters after N in the clock representation. The time windows are divided into 100-160 ms, 160-280 ms, 280-520 ms, 520-760 ms and 760-1000 ms.
Comparison of the SNARC effects for letters between two spatial representations
Behavioural data results
A comparison of the test results showed that the average response time of Experiment 1 with the ruler representation was 720.83 ms, whereas the average response time of Experiment 2 with the clock representation was 943.73 ms. The paired samples t test for both experiments was significantly different in terms of response time between different spatial representations, t(59) = 74.91, p < .001.
ERP data results
ERP overall mean waveforms graph analysis
A paired samples t test was performed for the average ERP amplitude of the left and right hemispheres for the letters B, H, T, and Z. The results were not significantly different between the left and right hemispheres for T and Z (p = .108).
As revealed in Figure 11, the differences in brain regions can be divided into five-time windows of 100–160 ms, 160–280 ms, 280–520 ms, 520–760 ms, and 760–1,000 ms after the stimulus presentation. At 100–160 ms, 160–280 ms, and 280–520 ms, there were differences in overall mean waveforms between different spatial representations at the central region and the parietal region, at the prefrontal region, frontal region, and parietal region, and at the prefrontal and frontal regions, respectively. At the 520–760 ms, when the target letter sequence was placed before N, the overall mean wave forms of the left prefrontal region, the left frontal region, and the left central region were different, and when after N, the overall mean waveforms of the right frontal region and the right central region were different. At the 760–1,000 ms, when the target letter was located before N, there were differences in the overall mean waveforms of the left prefrontal region, the left frontal region, the left central region, and the parietal region, and when after N, in the overall mean waveforms of the right prefrontal region, the right frontal region, the right central region, and the right parietal region.
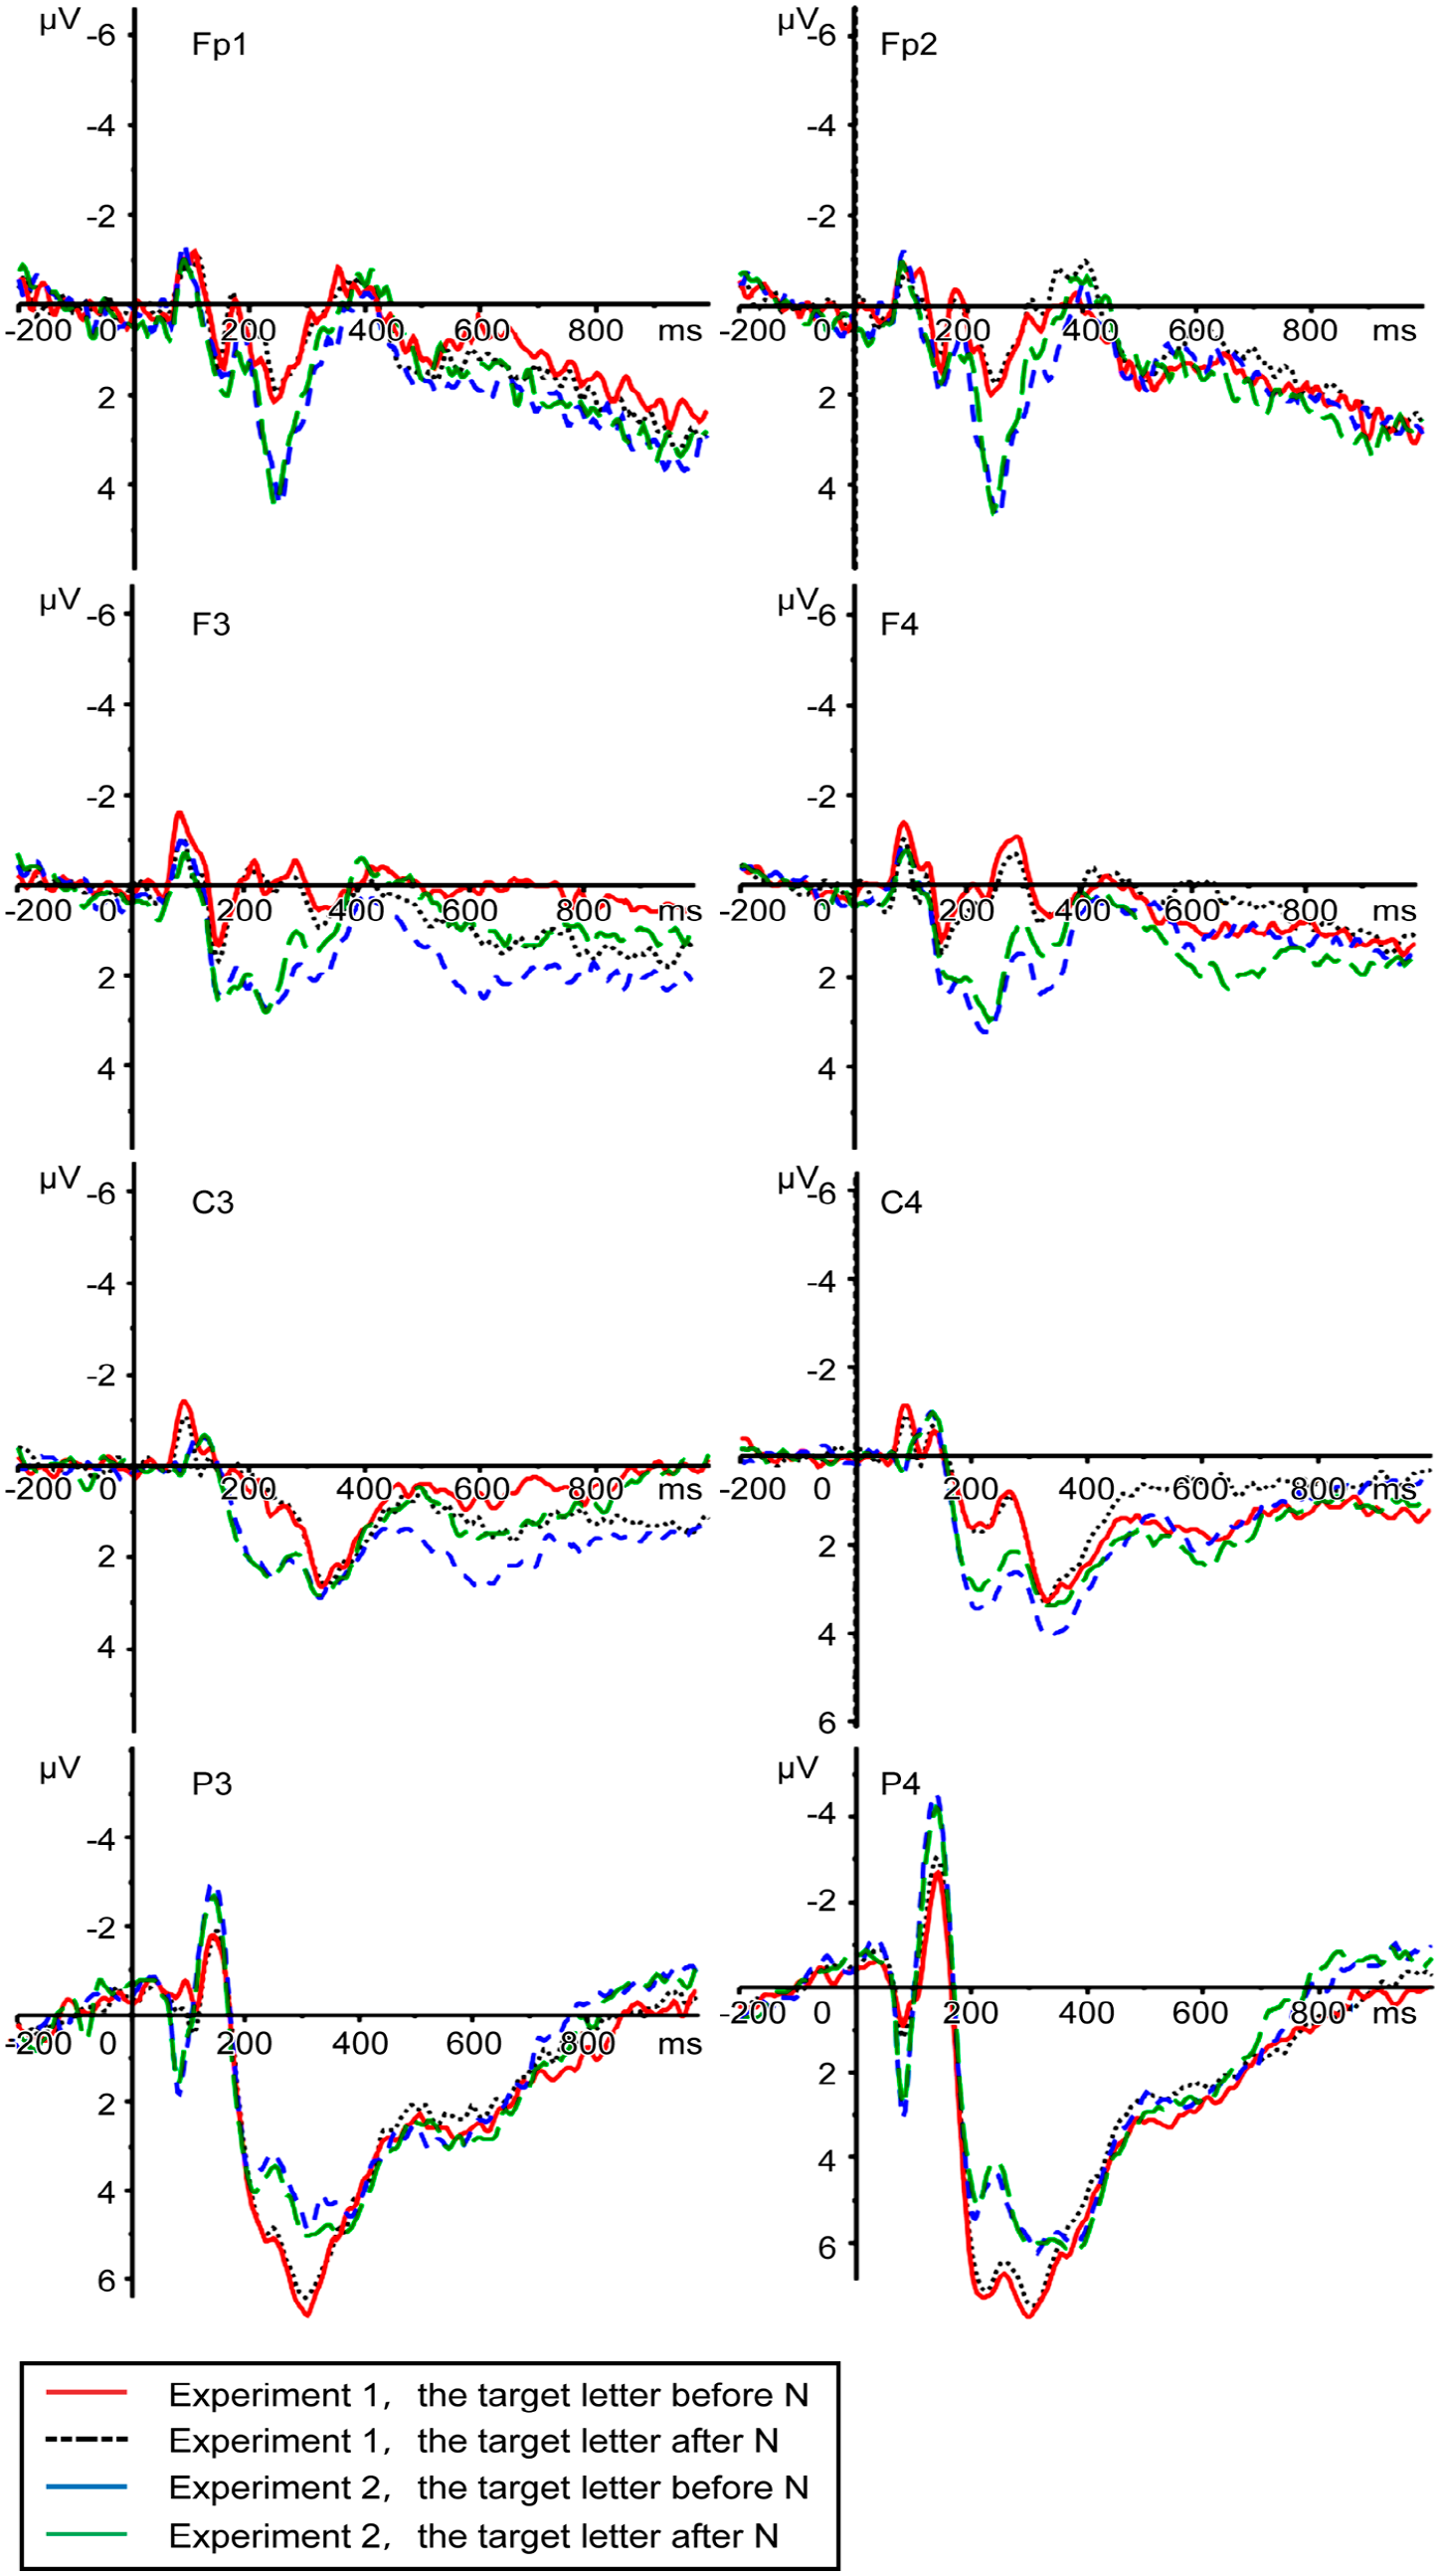
The event-related potential (ERP) overall mean waveforms represented by electrode points under different spatial representations and alphabetic orders. The red line represents the mean waveform of the target letter before N; The black line represents the mean waveform of the target letter after N; The blue line represents the mean waveform of the target letter before N; The green line represents the mean waveform of the target letter after N.
ERP time–frequency diagram analysis
From the comparison of the time–frequency plots (Figure 12), the main differences for the electrodes Fp1, Fp2, F3, F4, C3, C4, P3, and P4 were concentrated around 200 and 500 ms. For the four electrodes C3, C4, P3, and P4, there was no significant difference between the two conditions of the “target stimulus before N” and “target stimulus after N” for about 500 ms; for the four electrodes FP1, FP2, F3, and F4, the difference of approximately 200 ms between the two conditions of the “target stimulus before N” and “target stimulus after N” is mainly reflected in β High-frequency part of the wave (β1 wave: 12–16.75 Hz), and the difference of approximately 500 ms is mainly reflected in β2 low-frequency part of wave (β2 waves: 16.75–40 Hz). Diego et al. (2004) found a significant decrease in the β1 waves when three types of relaxation were performed (e.g., massage and vibration effects); thus, they concluded that β1 EEG was related to the participants’ relaxation. Some scholars have proposed that the β2 brain waves are usually related to cognitive processes and affective processes (Kellert et al., 2011). The significant difference of FP1, FP2, F3, and F4 electrodes is caused by the reaction of the participants to the experimental task, which is consistent with the previous conclusions.
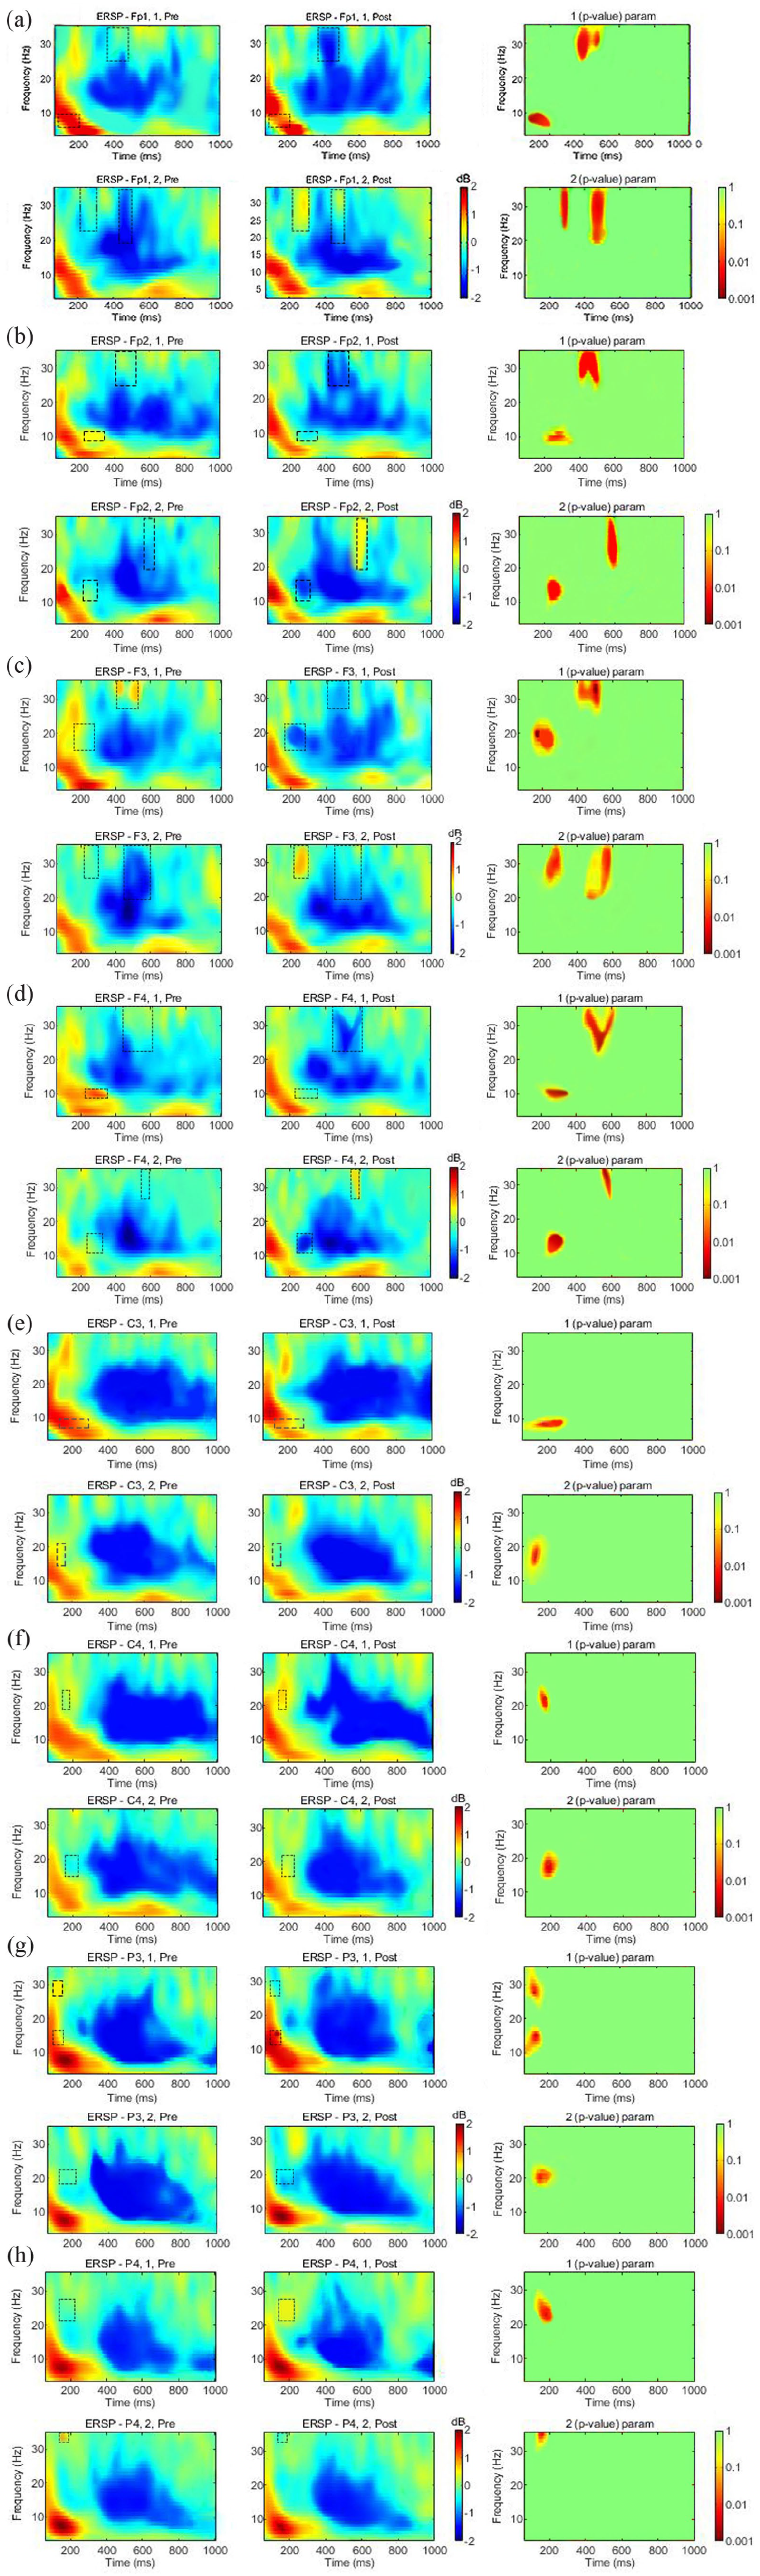
A comparison of the spectral amplitude differences between the before/after N conditions at the Fp1, Fp2, F3, F4, C3, C4, P3, and P4 electrodes. The left column is the untreated time-frequency plot for each electrode with the target letter before N. The middle column is the untreated time-frequency plot for each electrode with the target letter after N. The right column is the treated p-value plot with significant differences between the same electrode before and after N.
Discussion
This study assessed the similarities and differences of the SNARC effects under different spatial representations after excluding the quantitative effect of numbers, using a ruler and a clock as the experimental background and letters as the experimental materials. The results confirmed the previous findings regarding the SNARC effect for letters by indicating that sequential information is the key to the generation of the SNARC effect, while the SNARC effect was reversed with the clock representation, adding new evidence to the influence of spatial presentation on the SNARC effect. Combined with ERP technology, we expand the research scope of SNARC effect, thereby shedding light on the mechanisms underlying the SNARC effect.
In the ruler representation, letters might produce SNARC-like effect
Experiment 1 demonstrated the SNARC effect by showing that the participants’ responses were significantly faster when the target letter sequence position was consistent with the spatial representation comparing with that inconsistent with the spatial representation. Compared with previous research results, the average reaction time of letter SNARC effect is longer than that of number SNARC effect (Dehaene et al., 1993).
The ERP results also revealed the different degrees of activation in the prefrontal, central, and parietal lobes, with maximum activation observed in the parietal region. The experimental results indicated that the SNARC effect is caused by sequence characteristics rather than quantity characteristics. Turconi et al. (2006) hypothesised that the same internal representation mechanism underlies both sequence processing and quantity processing, since the authors found that quantity judgement automatically activated a cognitive process related to sequence tasks. Marshuetz et al. (2000) studied the encoding mechanism of sequence information in working memory and found that sequence tasks tended to activate the parietal and prefrontal lobes, and part of the activated area in the parietal lobe overlapped with areas of the brain involved in numerical processing; therefore, internal representations of quantity information and sequence information may have a common internal mechanism for quantity processing and coding (Marshuetz et al., 2000). However, developmental psychology and neuropsychology studies have revealed that quantity information and sequence information have different processing mechanisms. As for the neural mechanisms of sequence processing, functional magnetic resonance imaging (fMRI) data have shown that the brain regions involved in sequence processing include the prefrontal lobe, motor cortex, parietal lobe, and temporal lobe. Compared with quantity processing, activation in the frontal region was significantly positive (Marshuetz et al., 2000). The authors hypothesise that there is a strong psychological connection between the participants and the sequence of the English letter materials used in the study so that the sequence information of letters might be represented in the brain in a left-to-right mode similar to the mental number line; this spatial feature was automatically activated, producing the SNARC effect. However, in this experiment, an amplitude difference was observed in the frontal lobe, proving that sequence information was a factor influencing the SNARC effect. Ouellet et al. (2010) argued that the reason behind the direction of the mental number line being highly consistent with the direction of reading and writing is attributed to the highly abstract model inside the individual which maximises the consistency of all content and structure. This model might be established through reading and writing habits, and individuals may be influenced by this model when performing internal processing.
In the clock representation, letters might also produce a reversed SNARC-like effect
The results of Experiment 2 were consistent with those of previous studies. Compared with previous studies, the average reaction time of letter SNARC effect is also longer than that of number SNARC effect (Bächtold et al., 1998). When the letters were presented on a clock, the participants experienced a reversed SNARC effect when judging the sequence of letters, with different degrees of activation in the prefrontal, frontal, central, and parietal lobes. Bächtold et al. (1998) introduced the clock pattern into their experiment as a study material and demonstrated the reversed SNARC effect. When spatial representation evoked a psychological representation similar to a clock face in the participants, the direction of SNARC effect is affected by background representation. For Experiment 2, we speculated that a reversed SNARC effect might result in varying degrees of inhibition at the end of the electrical response in the central and parietal regions while verifying previous conclusions. However, the underlying factors are complex, and few relevant studies have been carried out. Therefore, whether this inhibition is due to the reversed SNARC effect according to different EEG data remains unclear.
In studies related to space tasks, brain imaging has previously revealed that the regions activated by numerical tasks and those activated by spatial and positional information processing overlapped substantially (Chochon et al., 1999; Gobel et al., 2001). Moreover, the region activated by numerical tasks was located in the right inferior parietal cortex, which was also revealed to be active in coding tasks related to spatial representation (Colby & Goldberg, 1999). However, few studies have analysed for differences between the two brain hemispheres; thus, there is still no consensus on this. In the present experiment, there was no significant difference according to an ERP analysis of compound stimulation of both brain hemispheres, regardless of the average amplitude of the left and right brain hemispheres for different tasks and alphabetic orders, or the average amplitude of the left and right brain hemispheres for different periods. Different mechanisms for quantity information and sequence information may exist or the factors investigated by other studies might not have been sensitive, which may have obscured the real experimental results. This experiment showed that the SNARC effect exists not only for numbers, but also for alphabetic materials. In addition, it may also exist in other language materials with sequential meaning. Moreover, when the representation of the space in which the letters were located changed, the direction of the SNARC effect also changed, i.e., a reversed SNARC effect similar to reading a numbered clock occurred. The influence of this spatial representation could be explained by differences in the way we read and write. We have reason to believe that the SNARC effect is largely due to changes in our psychological stereotypes caused by our daily reading and writing habits. However, the ERP study demonstrated that even when the SNARC effect occurred, regions of the brain involved in spatial and sequence tasks were activated. In summary, we believe that space and numbers share common brain processing regions (an innate factor) which provide a neural basis for the joint coding of spatial and numerical information; however, the association between spatial and numerical information is influenced more by cultural characteristics and especially literacy habits (acquired factors).
This study has several limitations. First, the effect of different background letter arrangements on the experimental results was not further investigated. In subsequent studies, it could be introduced as a variable for further analysis. Second, this study mainly analysed behavioural findings, and the EEG analysis was somewhat insufficient. Specifically, we did not thoroughly analyse the correlation between the behavioural and neural data. The behavioural part of the study and the EEG part of the study reflect different indicators: the behavioural part reflecting the reaction time, while the EEG reflects the changes in the time course of brain activity after the appearance of SNARC effect. Therefore, their correlation is not strong, with significant correlations only at two electrodes, FP1 and FP2, in the prefrontal region (Experiment 1 reaction time vs latency: r = .511, p = .015; Experiment 2 reaction time vs latency: r = –.483, p = .023). They all reflect the multiple data sources of the study and prove that the prefrontal lobe is closely related to the processing of sequential information such as SNARC-like effects (Schroeder et al., 2017) from different dimensions (behavioural, electrophysiological). Nonetheless, the SNARC effect was found in this study, which supports the influence of spatial representation on the SNARC effect for letters. Recently, numerical processing has also become the subject of neurocognitive studies. Investigators are increasingly focusing on the nature of the SNARC effect and exploring the basic factors underlying the SNARC effect. We believe that through continuous efforts, we can not only elucidate the nature of the SNARC effect and its physiological mechanism, thus effectively improving people’s cognitive efficiency, but also apply the study results to education and research to improve the teaching of mathematics and other disciplines.
Conclusion
Ruler representation produced the SNARC effect, lending support to the existence of the SNARC effect for letters.
The reversed SNARC effect was produced in the clock representation experiment, proving that different representation modes influence the SNARC effect.
Space and numbers, including letters with sequential properties, share common processing regions, namely the prefrontal and parietal lobes.
No significant difference in the degree of activation between the left and right brain hemispheres was found in the ruler and clock representation experiments.
This study further improved our understanding of the conditions for the SNARC effect and proved that the SNARC effect results from the simultaneous participation of brain regions for sequence information processing and spatial information processing.
Footnotes
Declaration of conflicting interests
The author(s) declared no potential conflicts of interest with respect to the research, authorship, and/or publication of this article.
Funding
The author(s) disclosed receipt of the following financial support for the research, authorship, and/or publication of this article: This work was supported by (1) National Science Foundation of China (61877019); (2) Shanghai Philosophy and Social Science Project (2017BYY017); (3) Peak Discipline Construction Project of Education in Shanghai; and (4) Large Instruments Open Foundation at East China Normal University.
