
Abstract
College baseball has grown in popularity over the course of the last few years, as is evidenced by the increased national and regional broadcasts of games on television. For some schools, baseball is the third revenue-generating sport; however, the sport has not received much attention in the academic sports literature. This study seeks to fill the void in the extant literature and examines the rise in expenditures and revenues, and their impact on winning, using a sample of Power Five Conference baseball teams from 2007 to 2014. ANOVA, linear regression and logistic regression were used to find that there is a moderate, positive relationship between expenditures and success. Specifically, expenditures account for 18% of the variance in winning, and a 5% increase in win percentages is evidenced with every additional million-dollar investment in the sport. Additionally, the same investment increases the odds of qualifying for the National Collegiate Athletic Association tournament by 248%, for a Super Regional by 112%, and for the College World Series by 127%. The implications of these findings, as well as recommendations to frame decision-making at the administrative level are included here.
Introduction
Shulman and Bowen 1 had some forethought in anticipating the current landscape of Division I collegiate sports as they wrote, “A school with big-time aspirations and a real chance to reach national championship status in one of the high profile sports has to be ready to ‘spend money to make money’” (p. 233). As Nocera and Strauss 2 note, university budgets have largely benefited from the mass commercialization of college athletics, and of college athletes. Stadium naming rights, corporate sponsorships, and an influx of television revenue have allowed athletic directors and university presidents the opportunity to make new, and often profound, investments in their programs. To this end, Litan et al. 3 hypothesized about the beginning of an “arms race” specific to football and basketball, where the explosion of revenue allowed schools to make capital investments in their programs in order to help recruit and retain the top athletes and coaches.
The majority of those investments, arguably, have been concentrated on revenue producing sports. Hobson and Rich 4 note that 48 of the Power Five conference schools spent $772 million combined on athletic facilities in 2014. This is evidenced in additions and renovations to stadiums, construction of athletic practice facilities, or in academic centers to help attract, retain, engage, and enrich the student-athlete experience. The author’s note that these expenditures have manifested themselves in everything from a 10,830 square-foot video board at Auburn University, a $45 million, 145,000 square-foot training center at the University of Tennessee, a $156 million dollar football facility at the University of Colorado, and a $55 million complex at the University of Clemson complete with a miniature golf course, laser tag, bowling lanes, and a movie theater.
On many college campuses, the third most popular sport outside of football and basketball can be college baseball. This is especially true among many of the Power Five conferences, specifically the Big Twelve, the Southeastern, and the Atlantic Coast Conferences. Historically, Louisiana State University (LSU) has led the nation in baseball attendance, and the top five schools in average attendance for the 2015 season were all from the Southeastern Conference (SEC). 5 The sport has also enjoyed increased exposure and viewership. Foley 6 reported that the 2014 College World Series (CWS) was the most-viewed CWS since 2011, and it produced the highest rated championship game since 2009, drawing over 2.5 million viewers. As the sport continues to grow in popularity, it provides yet another opportunity for the branding and commercialization that has allowed athletic programs to generate billions in revenue.
The commercialization opportunity can be an important factor in the growth and investment in college baseball. New television contracts and a litany of sports stations have left numerous outlets with content windows to fill. Further, the advent of the Big Ten, the SEC, the Pac-12, and the forthcoming ACC Networks, provide conferences with dedicated channels to promote all of their sports. These commercialization opportunities, then, can influence the decision-makers approach to these traditional non-revenue sports. To this end, the theory of institutional logic presented by Southall et al. 7 can help explain how baseball has become one of the newest outlets for the commercialization of amateur sports. They posit that the logical framework of education, which stands as the foundation of the National Collegiate Athletic Association (NCAA), has come to odds with the commercial and branding opportunities afforded through the synergy of athletics and television. As the outlets for exposure and revenue have increased, the logic that served as the founding frame for college athletics has shifted from one of education to one of commercialization. This acts to impel decisions that are aligned with this institutional logic, and manifests itself through the explosion of commercial opportunities presented to college athletics. Baseball, then, would be the newest commercial opportunity, and would exemplify this logic through increased capital investments.
The “arms race” theory presented by Orszag and Orszag 8 is one of the frameworks used to explain the recent surge in spending on college athletics, and the logical theory used by athletic administrators. The arms race theory has largely become one of the more accepted rationales for the capital investments being made across college campuses. In fact, Fort, 9 in presenting his principal-agent theory, cites a litany of examples from the academic literature where the arms race has been the “motivation for research” (p.121). Fort, 9 however, offers an alternative argument to the arms race theory, examining the interplay between university administrators and athletic directors, largely motivated by the goals and outcomes set forth by the athletic department. In his view, university administrators are the “principals” to the “agents” across the various departments on campus, and these principals manage the behavior, performance, and outcomes of these agents through the allocation of resources to accomplish their goals. In Fort’s view, capital spending is less of an arms race and more of a controlled, strategic, and deliberate act, aligned with the principal’s logic and the goals of the university. This stands at strict odds with the arms race theory, and explains a more rational approach to capital allocations.
Despite the growth in popularity, viewership, and the investments made across college campuses, there is a void in research specific to the economics and success factors for the sport. Outside of the Fulks’ reports published by the NCAA, there are few, if any, attempts to examine the revenues and expenditures of the sport, or examine the impact that these have on a team’s success. This research looks to explore the current trends in baseball revenues and expenditures, and quantify the impact of spending on success on the field. The current study will provide insight into the surge in expenditures as it relates to college baseball, and frame the economic arguments for why an investment in baseball may be of interest to colleges and universities across Power Five conferences.
Literature review
Orszag and Orszag 8 define the arms race as “occurring when an increase in spending in School A triggers an increase in spending at School B, which then feeds back into pressure on School A to further raise its own spending” (p.8). As a matter of economics, this definition may be a bit loose, as it should probably have included a condition that the follow-on investments would not be rational when viewed in a vacuum. In any event, their work concluded that there was a possibility that such a race was in its early stages: “the expansion of a stadium at one school within a conference appears to make it more likely that others schools within that same conference will expand the capacity of their stadium” (p.8). Outside of the Orszag and Orszag study, Kahn 10 and Getz and Siegfried 11 also discussed the phenomenon in early work. Tsitsos and Nixon 12 coined the term “star wars” in reference to the race to attract and retain the top coaching talents at individual schools. They note that the war exists “because athletic directors and their institutions feel compelled to spend ‘whatever it takes’ to hire and retain coaches with records or prospects of major success because they will attract the most talented recruits who are the ultimate key to competitive success” (p.71). Alsher 13 reports that the average coach’s salary for football was $1.9 million and $1.2 million for men’s basketball.
The arms race argument is a simple, and often accepted, argument for the economics of college athletics. As one school makes an investment, other programs will be forced to do the same. Frank 14 frames the argument in terms of spending and a need for college programs to participate in the mimetic behavior seen in college sports. Frank’s foundation is on winning and not, perhaps, on the more valued prize of revenue. Winning is a zero-sum game, there can only be one winner, one champion; however, the revenue windfall is not a zero-sum outcome, and given conference revenue distribution, is not necessarily linked with success on the field. In the end, Frank 14 concludes that athletic departments should find greater efficiencies in their spending, and in doing so will still be able to achieve their stated goals and outcomes. Doing so, however, assumes that the only goal for a college athletic department is winning, and while it is an important outcome, arguably, it is not the only necessary outcome. There is a firm reliance on revenue, especially football revenue, to keep other programs competitive. Under that scenario, Frank’s perspective on spending is complicated.
An alternative to the arms race proposed by Orszag and Orszag, and supported by Frank is the principal-agent explanation presented by Fort. 9 Fort describes the relationship between athletic departments and university administrators to be very similar to those between the university and its academic centers. Administrators maintain control, or at least guide the work of the “school of athletics” in a similar manner as it manages the academic (teaching, research, and service) flank of the university. Accordingly, university administrators seek to support the endeavors of the school of athletics, namely the athletic administrator and their goals, and can do so through resource allocation and budgets. The athletic director and his/her agents are then evaluated on the goals achieved in accordance to these resources. Therefore, where the Fort argument differs from the Orszag and Orszag and Frank arguments, which present spending as an out-of-control race to gain a competitive advantage, is that Fort illustrates spending as an in-control, strategic allocation of university budgets. At core is the question of whether the investment is rational or not. For Orszag and Orszag, the implication is that spending has a negative expected return on investment, but for Fort, the baseline assumption is that investment, at least from an ex ante perspective, is likely to yield a positive return in the sense of generating net benefits in excess of the cost to generate them. Here, Fort argues that athletic administrators have made a conscious decision, understanding the autonomy of athletic directors, and the goals of the department, to support the outcomes and objectives presented by the “school of athletics”. Carried further, spending can be influenced by the goals and outcomes of each school’s competitive cohort, where schools in a conference make investments in a particular objective, which will then influence the decision of an institution to do the same. In either scenario, however, spending is a conscious act made by the principal actors of a university system to achieve goals whose benefits outweigh their costs and not a runaway free-for-all as described through the arms race argument. In such a world, the tendency for investment to correlate by conference may simply be the result of a given conference having more opportunities for positive returns than other conferences.
Patterns in foreign direct investments made by large corporations can also shed light on the patterns of spending in college sports. The balance of competition between oligopolies often shifts as they try to gain first mover advantages in different international markets, and many of those flows represent a strategic rivalry between firms. Knickerbocker 15 examined this relationship and explained the interdependence of major industries across various markets. He surmised that as one organization made a strategic decision, their main rivals would follow with a mimetic or imitative behavior in order to maintain a strategic balance of competition. As one organization cut prices, their rivals would be forced to do the same; as one organization expanded into a foreign market, their rivals would be forced to do the same. In the end, this mimetic behavior would establish multipoint competition, where rivals compete across various markets with a portfolio of goods or services. Seen in this light, what might be an arms race can just easily be seen as a core driver of the general welfare results of the standard competitive model.
Knickerbocker’s theory can be carried into college sports, and the explosion in revenues, arguably, can help to explain this multipoint competition. Economic theory can explain this mimetic behavior, as rivals move to keep their peers in check to ensure that one does not gain a substantial advantage over another in various markets. Similarly, we may see clusters of investment because revenue opportunities also tend to cluster by conference, given the increasing importance of conference-negotiated, shared-revenue TV contracts and the like. Applied to collegiate athletics, these new revenue streams have allowed athletic departments to invest more heavily in all of their sports, and in some cases this results in a first-mover or competitive advantage over their peers, but with those peers also being provided the resources to make similar investments, often from the same shared stream. As outlined below, this can specifically be seen across the various conference cohorts. As one program makes a commitment to new spending, it inherently establishes a new benchmark for their peers; thus, other schools may feel compelled to match these movements in order to remain competitive. Similarly, as one program makes a commitment to better compensate their coaching staff, other schools would be compelled to match that commitment in order to keep pace with their rivals. In this scenario, as shared revenue becomes available to one conference school to fund this growth, it simultaneously becomes available to all. As a theory, this provides an alternative to the arms race argument proposed by Orszag and Orszag, and helps explain the patterns of investments across the collegiate landscape.
Frank 14 posits “…any given athletic director knows that his schools odds of having a winning program will go up if it spends a little more than its rivals on coaches and recruiting” (p.10). The most visible evidence of spending is found in football. NCAA rules prohibit the paying of players; thus, many athletic departments have taken to enhancing the collegiate experience in order to help attract and retain some of the best athletic prospects to their schools. Piper 16 reports that Utah will spend $13.5 million for a new video board and technology enhancements, South Carolina will break ground on a new $50 million football operations facility, 17 and Purdue plans a new $60 million “football performance complex”. 18 The University of Southern California plans for a $270 million renovation to the LA Memorial Coliseum, 19 and the University of Notre Dame is also a year into renovating Notre Dame Stadium. The Campus Crossroads project has an estimated cost of $400 million and will add seating capacity, video boards, and classrooms to the stadium. 20 These investments are not limited to the Division I Football Bowl Subdivision (FBS) level. Liberty University, which participates at the Football Championship Series (FCS) level, is building a new football indoor practice facility as part of the school’s $500 million campus rebuilding project, 21 and East Tennessee State University broke ground on their new $26 million football stadium in hopes to use the facility for the 2017 season. 22
Basketball has also evidenced the impact of this escalation in spending. The University of Mississippi recently opened a new $96.5 million arena to host basketball, volleyball, and academic events. 23 The addition at Mississippi follows Auburn’s new Auburn Arena, which opened in 2011 at a cost of $86 million. 24 The University of Cincinnati Board of Trustees recently approved an $85 million renovation project to Fifth Third Arena. 25 West Virginia will also update their West Virginia University (WVU) Coliseum for the 2016–2017 season, setting aside $15 million for locker rooms and new training facilities. 26 There will also be a new $27.5 million dollar facility at Providence College, 27 $72 million in renovations to Schollmaier Arena at Texas Christian University (TCU), 28 as well as a $35 million renovation of Reynolds Coliseum at North Carolina State. 29
Spending creates a further opportunity to push brand and institutional awareness. 30 It also evokes a level of passion and love for a university. Beyer and Hannah 31 may help frame this acceleration in spending, as sports play a vital role in the cultural fabric of an institution. The authors point to the important role that history and, perhaps nostalgia, play in the story that a university tells. There are powerful stories that are passed from generation to generation that lead to legacy applicants at universities. Spending on these sports, then, is necessary to ensure the preservation of that history and an embodiment for future generations. Along those same lines, athletic success has been linked to increased alumni and donor giving, and to an increase in applications to a university.32–37
While the acceleration in spending on football and basketball has been well chronicled, the capital investments in baseball have only now started to surface, and the characteristics of this spending very much follow the mimetic patterns anticipated where rivals compete in multiple markets. To this end, Rogers 38 suggests that a facility “arms race” in baseball has officially begun, and he posits that it is most visible in the SEC. LSU ($36 million) and South Carolina ($35.6 million) have both built new baseball stadiums, while Mississippi, Georgia, Texas A&M, and Vanderbilt have all renovated their existing facilities. The recruiting success that these facilities have brought to their respective programs has also prompted Alabama to undertake a $42.6 million project to update their stadium and add other practice facilities. 38 These capital investments, however, are not just limited to the SEC. TCU has announced a new $7.5 million update to Lupton Stadium, and Virginia will begin a $12 million upgrade to Davenport Field. 38
These moves are also not limited to warm-weather schools. Penn State kick-started the facilities race in the Big Ten in opening Medlar Field in 2006. The 5400-seat stadium came with a $31 million price tag. 39 Purdue recently completed a $21 million renovation to Alexander Field, complete with a new locker room, meeting lounge, indoor batting cages, and new dugouts, 40 and Northwestern has undertaken a $15 million project, which includes new locker rooms and a new grandstand. 38 Michigan also completed a $10 million renovation to their Wilpon Baseball Complex in 2008, 41 and the University of Minnesota built a new a $7.2 million home for the Gophers in 2013. 42
West Virginia, following a move to the Big 12, recently opened a new $25 million stadium. In opening the new stadium, WVU Athletics Director Shane Lyons all but pointed to the impact of the arms race on gaining a competitive advantage, “…this takes us to the next step in competing for Big 12 Championships and National Championships. With this great facility, we’ll be able to do that without question. Also, it’s the next step in showing our commitment to college baseball”. 43 Vanderbilt recently announced plans to build a new $12 million baseball facility, largely after their head coach Tim Corbin said it was time to upgrade the facility that was built in 2006 because they had “outgrown” it. 44 It probably helped Corbin’s cause that the Commodores were coming off the program’s first CWS Championship.
This new commitment to what is largely considered a non-revenue sport may come as a result of a shift in the economic proposition across many college campuses. With it, there may be evidence of a shift in the values and goals that drive many of the Olympic and non-revenue generating sports. Southall et al. 7 present the theory of institutional logics as a means of understanding the NCAA’s, and perhaps as an extension, each individual university’s approach to the presentation of sports, and sporting events, to the general public. Organizations, they posit, are driven by their internal frameworks, and these frameworks will guide decision-making and strategic planning. The NCAA, they suggest, must contend, and balance the educational proposition that is at the very core of what they represent, and the commercial proposition that drives revenue and sustains the operational approach to the underlying business model. While these two logic intentions can co-exist, they can be seen at odds with the stated mission of collegiate athletics and amateurism, Equally, as with all other business, eventually one fundamental logic will prevail. To test their theory, Southall et al. 7 and Southall and Nagel 45 studied a sample of NCAA broadcasts from both the NCAA men’s and women’s basketball tournament and concluded that while the two logics may be present, the most dominant, and prevalent one espoused during the tournaments was the commercial logic. As this logic becomes more dominant, then, it stands to reason that universities will seek opportunities to continue their commercial stance and find ways to brand all of their sports. While the most evident branding opportunities are with the NCAA Basketball Tournament(s) and the College Football Playoff, Southall et al. 46 and Cooper and Weight 47 outline how this shift may impact traditional non-revenue Olympic sports. In their study, they note a difference in values (institutional logics) between the revenue (football and basketball) and non-revenue (Olympic) sports, where commercial values drive the revenue producing sports and traditional educational values influence the latter. This difference in value systems, however, may be the product of demand and not a desire to promote the more traditional NCAA model of the “student-athlete”. Beyer and Hannah 31 and Trail and Chelladurai 48 pose that the value system of the stakeholders largely influences the decisions and goals of an athletic department. However, those values may be strongly influenced by the availability of a commercial outlet for some of these non-revenue sports. As those commercial opportunities shift, the institutional logic applied begins to shift as well.
To that end, Etheridge 49 reports that in 2009 there were only 10 nationally televised regular season college baseball games. That number has grown since then, with 12 airing in 2010, 18 in 2011 and 2012. In 2013 the number of national games grew to 27, and there were more than 80 in 2015. The majority of these games are televised on the ESPN family of networks, and largely feature teams from the SEC. Etheridge further notes that ESPN recently launched “Bases Loaded” which offers whip-around coverage of games much like the NFL Red Zone does for NFL football Sunday games. The Big Ten Network will also televise over 360 regular season baseball and softball games, as well as the entire Big Ten Baseball Tournament in 2016. 50 A growing number of games for the Big 12 and the ACC are also available on regional networks and are available to stream using the ESPN3 application. The shift in televising college baseball can be attributed to the television contracts negotiated by specific conferences. The advent of conference-specific networks also impacts the availability of non-revenue sport programming. ESPN 51 reported that in the SEC Network would all them to broadcast 45 football games, hundreds of men’s and women’s basketball games, 45 baseball games, and an undetermined number of other events from the 17 other sports. Thus, while it can be hypothesized that college baseball is more popular than before, television contracts have also left many more hours of content to fill, and the exposure afforded to Olympic sports has greatly increased.
The evolution of the availability of these broadcasts helps to frame a potential shift in the value system deployed by university administrators. Simply, as the opportunities for further branding and commercialization have presented themselves, athletic directors have responded by making a more earnest investment in their respective programs. A traditional value system, perhaps driven by graduation rates, opportunities for athlete participation, or compliance with Title IX, has been replaced with a more success or even revenue-oriented narrative. This success can provide an additional revenue inlet for athletic departments as partners seize advertising space for more eyes in the stadium and on national television. It can be fair to assert that an investment in Olympic sports, outside of the necessary operational and grant-in-aid obligations, had not been a priority across many university campuses. As one school invests in their program, and tips in the scales of competition, other schools are pressured to do the same in order to remain competitive. At issue, then, is the value and outcome of these newly found outflows.
As Frank 14 notes, “…the gains from bidding higher turn out to be self-canceling when everyone does it. The result is often an expenditure arms race with no apparent limit” (p. 10). Research as to the impact that these investments have on winning, however, has been limited in scope and depth. Litan et al. 3 found no significant relationship between expenditures and football winning percentages using a cohort from 1993 to 2001. Similarly, Orszag and Orszag 8 concluded that an increase in expenditures had no significant impact on winning for their study that examined football teams from 1993 to 2003. Orszag and Isreal 52 reported a small, positive relationship between expenditures and football. Their findings conclude that teams could experience a 1.8% increase in their overall win percentage for every $1 million increase in expenditures. This also increased the likelihood of finishing the season in the Top 25 by 5%. Lawrence et al. 53 and Jones 54 examined National Association of Collegiate Directors of Athletics (NACDA) Director’s Cup scores and how they were impacted by athletic expenditures. These two studies broadened the success definition, and included total expenditures and other institutional variables. Lawrence et al. did not report a significant relationship between spending and the NACDA standings for Division I, II, or III; however, they were able to report a strong correlation among National Association for Intercollegiate Athletics (NAIA) schools. Jones provided some evidence of a correlation between spending and success on the field. His research noted that teams that had an increase in spending gained more significant returns on those investments on the field. While these more broad NACDA studies include baseball outcomes, there has been no effort to quantify this relationship specific to the sport.
To summarize, the effect, and to some extent, the impact, of spending has been well chronicled in the revenue-producing sports of football and basketball. Given the financial windfall from television contracts and the new College Football Playoffs, athletic departments appear to be in search of nuanced ways to invest in their athletic programs. Orszag and Orszag propose that novel revenue streams have allowed for the proliferation of an “arms race” where teams are looking to outbid and outdo one another in an effort to gain a competitive and sustained advantage. Frank 14 defended and expanded upon the arms race theory; however, while he views winning as a zero-sum game, the potential drivers of departmental success are not always limited to goals on the field. Athletic departments may seek to be profitable or raise capital to make other sports more competitive. As such, and as evidenced through television, apparel, and licensing agreements, revenue is not a zero-sum game, and those investments can have a major impact on the magnitude of their return. Fort 9 provides an alternative to the arms race, framed largely by economic theory, where spending is not a race to exceed one’s rivals; rather, it is a product of a shared ideology among university administrators who purposefully deploy a strategy that makes them more competitive. In this sense, spending is not an out-of-control phenomenon; rather, it represents the institutional logic employed by administrators and the observed correlation in spending among peers may simply represent a correlation in peer schools’ investment opportunities. Only recently have these investments begun to manifest in spending on the Olympic sports. As Southall et al. 46 and Cooper and Weight 47 note, the value system for these non-revenue sports has been different for these two dichotomous entities within the athletic system. Still, with the growth and expansion of commercial opportunities, as well as the possibility of generating revenues for other programs, there is anecdotal evidence to support the hypothesis that baseball has started to experience a windfall of spending, especially across the Power Five conferences. As the relationship between expenditures and winning has been limited to football and to the Director’s Cup Challenge, this study seeks to explore the trends in revenue and expenditures for Division I Power Five baseball programs, quantify the impact that these expenditures have on winning, and determine if the baseball “arms race” as described by Rogers 38 has been incited. Specifically, the study seeks to answer the following research questions:
Among NCAA Division I Power Five institutions, what is the relationship between revenues, operating expenditures, and total expenditures across time, conference affiliation, and participation in the NCAA Baseball Tournament?
Is there a relationship between changes in athletic expenditures and overall winning percentage among NCAA Division I Power Five institutions?
Among NCAA Division I Power Five institutions that participate in baseball, what is the impact of additional baseball expenditures on the likelihood of participating in the various levels of the NCAA Baseball Tournament?
The goal of this study is to help inform and provide examples of the rise in spending and commercialization of baseball, and quantify the impact, if any, that it may have on winning. The results of this study can be used by athletic directors to inform their financial decisions, across all levels of the NCAA, as a test of Shulman and Bowen’s 1 hypothesis of the impact of expenditures on success on the field, which can then result in greater exposure and an added revenue source for both the athletic department and the university.
Methodology
Institutional affiliation, revenue, and expenditure data were collected through the US Department of Education Equality in Athletics Disclosure Act (EADA) data set for 2007 to the most recent available data of 2014. The sample consists of 512 teams across the now Power Five (Big Ten, Big 12, ACC, SEC, and the Pac-12) that participate in NCAA Division I baseball. The Big East was considered an Automatic Qualifying Conferences (AQC) as part of the Bowl Championship Series (BCS), and they were the recipients of greater inflows of cash as a result of their inclusion as an AQC. As this study consists of years where the Power Five structure did not exist, the Big East is included for the years in which it was considered part of the BCS equation. Each team was coded with the conference for which the participated in for each given year. After the most recent conference shuffling, some of the Big East schools now participate in one of the Power Five leagues. This is true for Louisville, Pittsburgh, and Notre Dame, now part of the ACC, and West Virginia, who is now part of the Big 12. Conference realignment also led to Texas A&M and Missouri moving from the Big 12 to the SEC, Nebraska leaving the Big 12 for the Big Ten, Texas Christian joining the Big 12, Utah joining the Pac-12, and Maryland leaving the ACC for the Big Ten. Maryland, however, participated in the ACC through the length of this study. These changes in affiliation were accounted for in the coding of each team and their respective conference per year. Those AQC schools that are no longer part of a Power Five conference were controlled for by keeping them in the sample for only the years they were represented in those particular conferences (Connecticut, Cincinnati, and South Florida, to name a few were included in this cohort).
The EADA data set was used to secure total baseball revenue, total baseball operating expenses, and total baseball expenses. According to the Fulks’ 55 NCAA Division I Report, operating expenditures can include: equipment, uniforms, supplies, fundraising expenditures, game expenses, medical expenses, membership dues, sports camps, any expenditures related to spirit groups, facilities maintenance and rental, indirect institutional support, and an “other” category. Total expenses include but is not limited to: grants-in-aid, guarantees and options, university paid salaries and benefits, severance pay, team travel, recruiting, as well as some portions of the operating expenditures listed above. Revenues are defined as: total ticket sales, NCAA and conference distributions, guarantees and options, concessions, programs, broadcast rights, royalties and advertising, sports campus, and a broader miscellaneous category. A separate variable “percentage of expenditures” was created which calculated the percentage of total departmental expenditures for which baseball represented.
Conference and overall winning percentages were gathered from a combination of the NCAA and D1BASEBALL.com site. These were confirmed through the ESPN site and the respective university athletic site when appropriate. Information about the NCAA Baseball Tournament, its 64 participants in a Regional, the 16 participants in a Super Regional, and the eight participants in the CWS were taken from a combination of the NCAA Championships site, the CWS site, and various news stories and box scores from the respective years. A dichotomous variable was created for schools that participated in an NCAA Regional versus those that did not, for those teams that reached the Super Regional versus those that did not, and for teams that reached the CWS versus those that did not.
Descriptive statistics were used to address research question one. Additionally, ANOVA and the Games-Howell post-hoc test were used to examine if there were significant differences in revenues, operating expenditures, and total expenditures across each year of the study and across conference affiliation. The Games-Howell post-hoc test was used to detect significant differences among the multilevel factors. Games-Howell was selected as it does not assume equal variances, is appropriate when the assumption of homogeneity of variance is violated, and is recognized as a robust measure when the assumptions of ANOVA are violated.56–58 A t-test was employed to determine the differences according to NCAA Regional, Super Regional, and CWS participation as this was coded as a dichotomous variable.
Linear regression and a series of logistic regression were used to explore the relationship between total expenses and on-field success, as noted in questions two and three. After testing the assumptions of regression, simple linear regression was used to explore the relationship between win percentage and expenditures. Logistic regression was utilized to further explore the impact of expenditures on post-season qualification and success. Each of the three dichotomous outcomes was used against total expenditures to test how an increase in expenditures increased the likelihood of achieving one of the three outcomes.
Limitations
As noted in the research questions above, this study focused only on NCAA Division I Power five colleges and universities. As Caro 59 notes, there has been a “chasm” in revenue production between the now Power Five and the Group of Five schools that compete at the Division I FBS level. Power Five schools have more money to invest in their programs, and have traditionally made those investments across their revenue sports. The authors hypothesize that if there is a relationship between spending and winning, it will be evidenced among those programs that have greater access to revenue and have made significant investments in their program, and arguably, also have the greatest opportunities for positive returns on their investments. Further, these schools have led the spending in the sport as noted above, constituting the majority of programs making capital investments in baseball. While this study does not diminish the accomplishments of Dallas Baptist, Bethune-Cookman, Long Beach State, or other Group of Five, and sometime Division II programs who play up to Division I in baseball; rather, the purpose here is to examine the impact of the investments of these additional revenue streams, which have been largely limited to these Power Five groups. Further, Power Five programs appear to operate in a dichotomous manner. Examination of the data set showed that there are programs that have made a concentrated effort in funding their baseball programs, and there are those that have not. This Power Five dichotomy helps to explore the expenditure relationship, without negatively skewing the expenditure data from smaller schools that do not have the assets to make comparable investments. Inclusion of those schools would potentially underestimate the explained variance and parameter estimates.
Efforts have been taken to ensure the accuracy of the data and the statistical outcomes reported in this study. Baseball expenditures are self-reported by the institutions to the EADA; therefore, if there are any inaccuracies in the reporting of the data, it could impact the outcomes of the analysis. There have been calls that question the validity and reliability of the data set, and calls to use the USA Today data set, at least for football, which is created through a survey sent out to individual institutions. Jones, 54 however, noted in the reporting of his study that there exists a strong correlation between the information provided through the EADA data set and the one used by the USA Today. Further, the results of regression analysis where both data sets were used separately showed that there were not significant differences in the results to impact the findings of the study.
Moreover, the EADA data set often follows the NCAA’s “agreed upon procedures” for data reporting; however, schools do not always follow these procedures. In the absence of a better data set, it is assumed here that all schools have followed the agreed upon procedures in the reporting of their expenditure data. Further, the EADA data set often does not capture investments made in facility updates or upgrades. This can severely limit the amounts reflected in total expenditures.
Results
Mean revenues, operating expenditures, and total expenditures from 2007 to 2014 for Power Five Conference Baseball Programs.
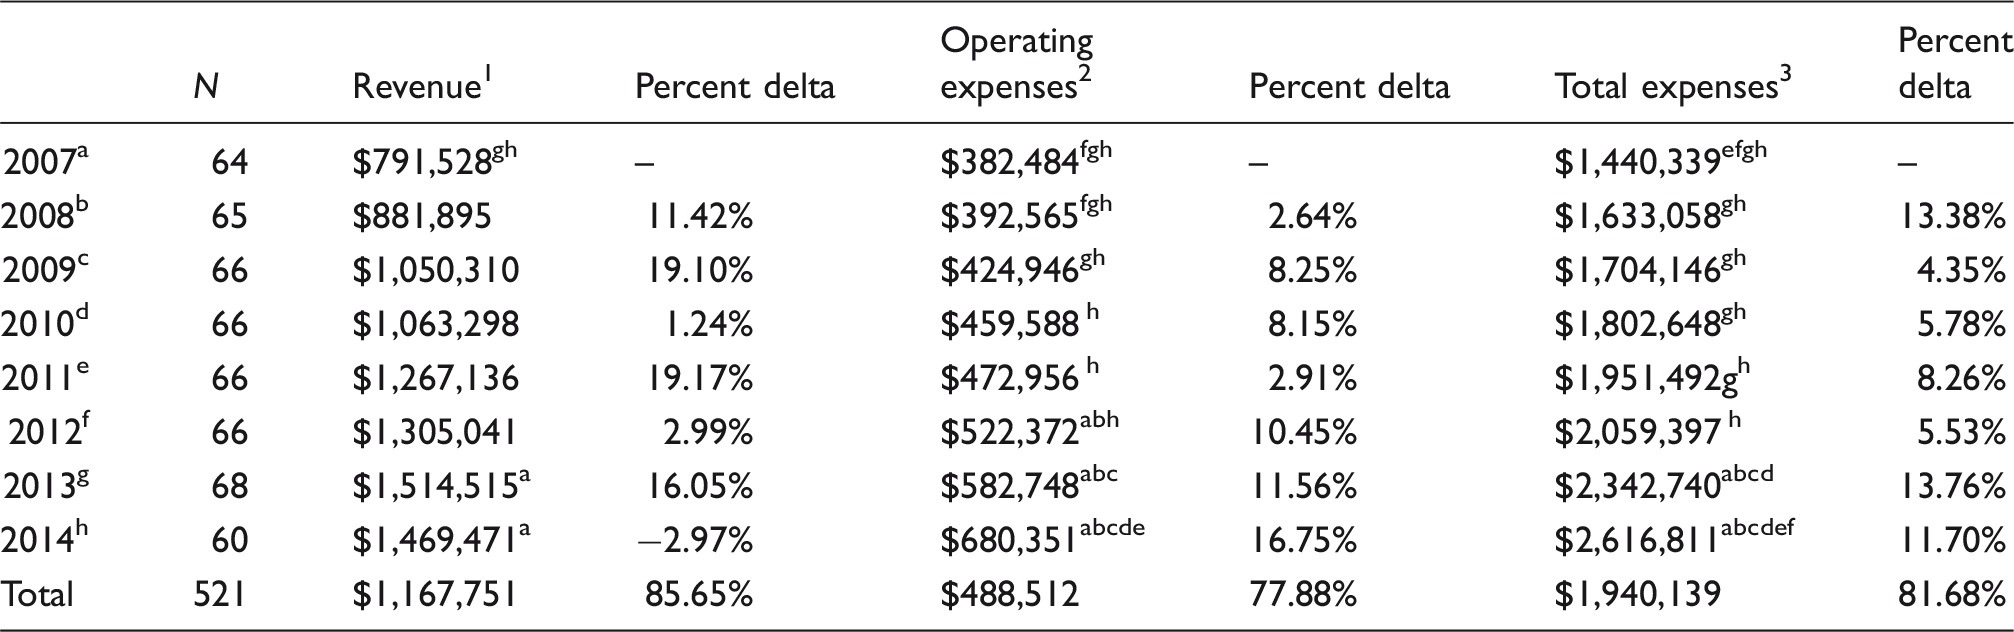
ANOVA results: 1F = 2.881, p < 0.001; 2F = 11.659, p < 0.001; 3F = 10.738, p < 0.001. a–hRepresent a statistically significant difference between those two variables. For example the Revenue value for 2007 was statistically different from 2013 and 2014.
Mean revenues, operating expenditures, and total expenditures from 2007 to 2014 for Power Five Conference Baseball Programs by conference.
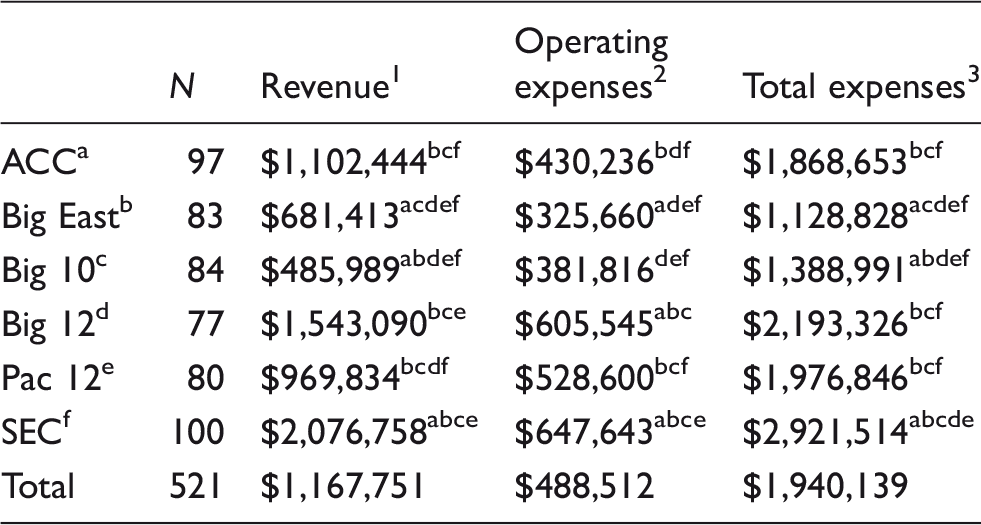
ANOVA results: 1F = 23.651, p < 0.001; 2F = 28.644, p < 0.001; 3F = 55.426, p < 0.001.
After examining the revenue and spending results, a decision was made to explore the percent value of baseball revenue and expenditures and revenues across the various conferences and years. Initially each of the major sports was examined to determine the mean percentage of the total expenditure budget they account for. Baseball (2.79%) ranked fourth behind football (26.53%), men’s basketball (10.17%) and women’s basketball (4.84%) in mean total percent of overall athletic department budget. Mean revenue percentage data indicates that although dollar values have mostly increased since 2007 (Table 1), the mean percentage for which that revenue accounts for has largely remained the same, and average 1.7% over the period of the study. The SEC also accounted for the largest percentage of total revenue, generating 2.6% of total athletic revenue over the course of the study.
Mean percent of men's expenditures and total expenditures for baseball from 2007 to 2014.

Mean revenue and expenditure differences between schools participation in the NCAA tournament, a Super Regional, and the CWS from 2007 to 2014.
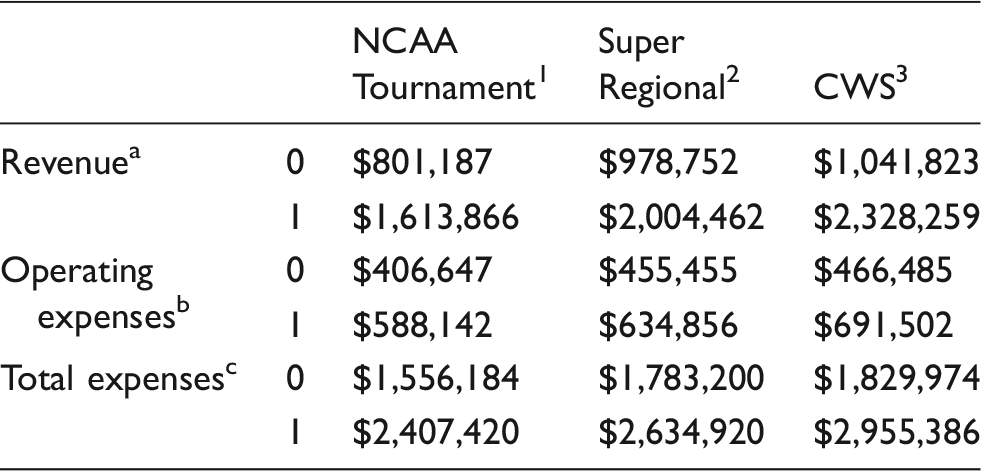
Note: Participation is noted with a value of 1.
t-test results: 1at = −7.263, p < 0.001; 1bt = −8.495, p < 0.001; 1ct = −10.225, p < 0.001; 2at = −5.201, p < 0.001; 2bt = −5.981, p < 0.001; 2ct = −6.488, p < 0.001; 3at = −4.175, p < 0.001; 3bt = −5.461, p < 0.001; 3ct = −5.612, p < 0.001.
Teams that qualified for the NCAA tournament spent nearly a million dollars more on average than those that did not. The spread of that difference remains the same for the Super Regional and CWS groups. The greatest differences are found in revenue production. Teams that made the NCAA Tournament generated more than double the revenue of their peers. This difference is amplified at the deeper levels of a post-season run. This is an important connection between success and revenue given that schools that participate in the baseball post-season do not earn any revenue from the post-season appearance. 60
Regression results for operating and total expenses on overall win percentage for 2007 to 2014.

Expenditures in millions.
The results for total baseball expenditures indicate a more moderate relationship with overall win percentage. This model indicates that the coefficient of determination was 0.175, indicating that total baseball expenditures accounted for 18% of the total variance in overall winning percentage. The beta coefficient indicates that each additional million-dollar investment in total baseball expenditures related to a 5% increase in overall winning percentage.
Regression results for total baseball expenditures on out of conference win percentage for 2007 to 2014.
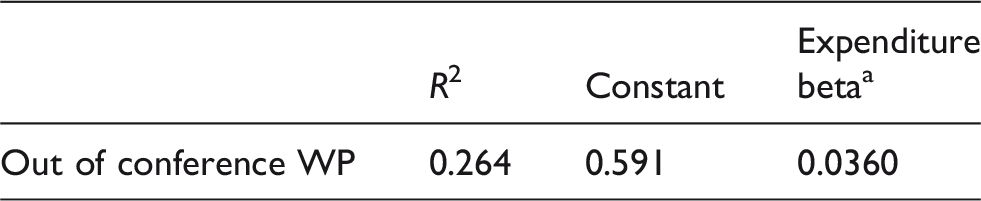
Expenditures in millions.
Regression results for total baseball expenditures on overall win percentage when controlling for conference affiliation for 2007 to 2014.
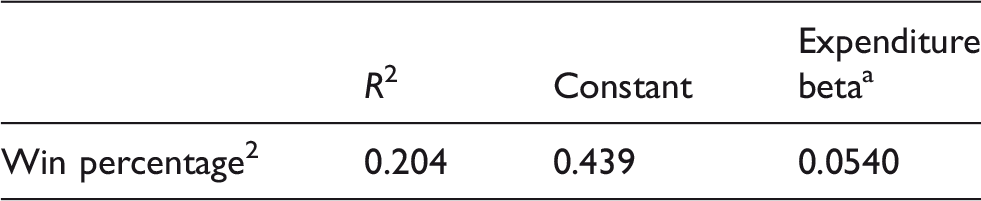
Expenditures in millions.
Coefficients for logistic regression models for operating expenditures and total expenditures and post-season play.

Odds ratios for total expenditures and post-season play.

OR: odds ratio; CI: confidence interval.
Total expenditures and the odds of post-season play.
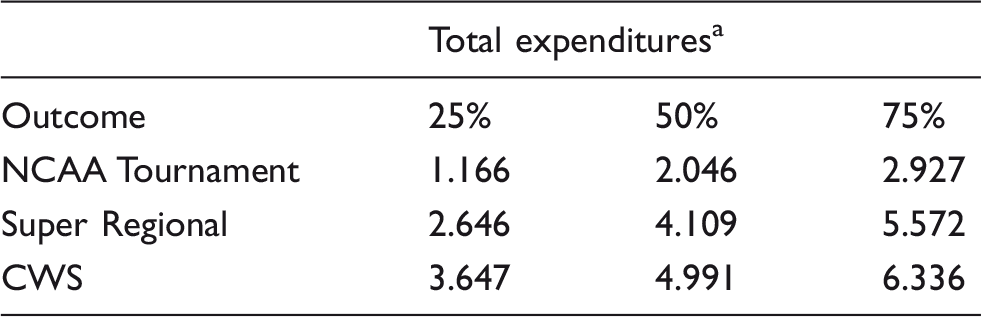
Expenditures are represented in millions of dollars.
Discussion
Frank 14 posited, “…any given athletic director knows that his schools odds of having a winning program will go up if it spends a little more than its rivals on coaches and recruiting” (p. 10). Where Frank failed to ask was whether the odds of making money will go up as well. The goal for this study is to examine the impact of increased baseball expenditures on success on the field and, to a limited degree, on the profit and loss statement, and test the theories of spending presented in the literature. While there is an abundance of anecdotal evidence to hypothesize that spending in baseball has increased, there was a void in the academic literature in quantifying the rate and impact of these investments.
The first question this paper sought to answer was, what is the relationship between revenues, operating expenditures, and total expenditures across time, conference affiliation, and participation in the NCAA Baseball Tournament? Total baseball expenditures, as reported to the Department of Education, increased by nearly 82% over the period of this study. Equally, generated revenues (as defined by the NCAA) increased by nearly 86% in the same time frame. Average revenue for 2014, the most recent year in the study was nearly $1.5 million, which was slightly (3%) down from a study peak in 2013. Mean total baseball expenditures steadily increased to a study high of $2.7 million in 2014. The standard deviations of those mean revenue and expenditure values also grew, pointing to an almost bimodal pattern in spending across the Power Five conferences. LSU recorded six of the top 10 greatest total expenditures, maxing out in 2013 with an investment of $7.8 million, which was 14% of the total spent on men’s sports and nearly 7% of total athletic department expenditures. As previously reported, the SEC averaged nearly $3 million in total expenditures over the course of the study. These expenditures are framed by the fact that 14 of the top 20 investments were made by schools in the SEC.
On balance, however, the mean percentages of revenue and expenditures indicate that these increases do not represent a significant difference in the percent total they account for across men’s team expenses and overall department expenses. The mean percent spent on baseball as a measure of total men’s sport expenditures rose from 6.2% in 2007 to 6.6% in 2014. Equally, the mean percent spent on baseball as a percentage of total athletic department expenditures grew from 2.7% to 3% over the same time period. As indicated in the results section, neither of these measures are statistically significant. Given these results, it can be concluded that dollar amounts rose over the period of the study, as more revenue was made available to athletic departments. This finding would support the revenue theory of costs presented by Bowen. 61 According to Bowen, and evidenced here, as revenues rise, there is a corresponding increase in expenditures to ensure that they are always equal to revenues. Hoffer et al. 62 examined the trends in athletic spending and presented two different expenditure models for testing. In presenting their “dynamic non-price competition” model, they make the argument for how an arms race impacts the prestige of a program, forcing their rivals to act in kind, or risk looking less prestigious when compared to their rival. In applying this model to a sport context, decision makers would need to identify the sport(s) that give them the greatest opportunity to gain in prestige, and increase the funding for that sport in order to gain an advantage over their rivals. This would then boost the overall perception of the athletic department. Assuming Bowen’s revenue theory of costs holds in this dynamic non-price competition model, then the increase in spending in one sport would need to come at the detriment of another. Thus, athletic decision makers would need to prioritize their spending allotments, and assign a greater percentage of their budgets to those sports in which they seek to gain an advantage. Exploration of the data illustrates the increase in budgets (as a percent of total budget) in football and men’s basketball, as well as small changes in other Olympic sports. As evidenced here, however, the allotments for baseball as a percentage of total budget and as a percentage of total men’s athletics budget have increased at a non-significant pace. For the arms race to be present in baseball, a significant increase in the percentage of expenditures would be expected across the baseball landscape. Conferences do commit differing percentages of their budgets to the sport, in some cases prioritizing baseball at the conference level. Overall, however, the value of those percentages has remained the same. The study can conclude that there is a distinctive level of commitment across the various conferences to the sport; however, there is no evidence to support that these expenditures have surpassed reasonable budget expectations from year to year.
The literature illustrates the historical investments that teams in the SEC have made in their programs. Almost every one of the schools in the SEC has made an investment in their baseball facilities, with the new facilities at LSU and Ole Miss mentioned earlier. While these investments may appear to have sparked the very cycle that Orszag and Orszag 8 defined as the arms race, it is important to consider if these investments are spurred by spending that is out of control, or a more disciplined and strategic investment made in accordance to the principal-agent theory. There is little doubt that the pressures to renovate, improve, or expand baseball facilities in hopes of gaining an advantage over conference foes is very strong. Mean percentages of baseball expenditures, however, have remained nearly constant. It is difficult, then, to confirm the arms race as hypothesized by Orszag and Orszag 8 or by Rogers, 38 as an ‘arms race’ would show increases in percentages across all Power Five programs. The caveat to this conclusion, however, is that the total baseball expenditures as reported to the Department of Education often do not capture investments in infrastructure projects. Still, it is difficult to conclude that the commitment to baseball facility upgrades noted in the literature is the result of an arms race that has spending out of control.
Economic theory presented by Knickerbocker, 15 specifically the mimetic actions necessitated by rivals competing in multiple markets, or the Fort 9 principal-agent theory may present better alternatives to this spending. The Knickerbocker theory of multipoint competition can be seen as valid in that conference foes are impelled to spend more money on a sport as their rivals increase their spending. This would hold true for any business engaged in a similar competitive arena. For the theory to fit, it is important to include revenue-generation in the end equation for athletic programs. This is where Fort’s theory would further explain the evolution of spending on baseball. As university agents understand the impact of successful athletic programs, either for commercial exposure or as an extension of their academic mission, they empower their athletic principals with greater autonomy and resources necessary to differentiate and improve their athletic programs. Still, this is a calculated and strategic endeavor that allows them to gain an advantage over their rivals. Rising revenues across the major sports allows for greater spending on traditional revenue-neutral or revenue-negative sports as the losses can be absorbed by football or basketball revenue.
The commercial relationship, and the ability to generate greater revenue for a university, cannot be ignored. The institutional logic theory presented by Southall et al. 7 sheds light on how commercial opportunities may reshape the institutional logic employed by university administrators. Simply, as more commercial opportunities arise, it is prudent for athletic departments to take advantage of them. Given the capital investments noted in the literature, it is difficult not to support the findings of Southall et al. 46 and Cooper and Weight, 47 in that, historically, the value system for non-revenue sports may have been different, and is now changing. The espoused values of intercollegiate amateur athletics has always focused on the value of the education provided to participating athletes. This is especially true for non-revenue Olympic sports. Still, it would be imprudent not to consider the impact of branding, exposure, and revenue brought through athletics on the university. As television, licensing, and apparel contracts have boomed, athletic administrators have greater flexibility and reach in pursuing their athletic missions. Where capital resources may have limited investments in Olympic sports, the Power Five conferences are an example of how seemingly endless sources of revenue can reshape the institutional logic employed by university and athletic agents. Olympic sports can now be another commercial, branding, and potentially revenue-positive opportunity; thus, the traditional academic logic employed by administrators can be ceded to the commercial interests of the business model. Simply, there are now more commercial opportunities, and baseball has allowed for yet another branding source for athletic departments.
Institutional logic theory, then, may help to frame the principal-agent theory espoused by Fort. 9 As programs generate more revenue, the need to invest in other revenue-generating streams becomes apparent. Given the spending restrictions placed on athletic agents, many are starting to turn to Olympic sports to gain a competitive advantage over their peers, and generate more capital. Athletic agents, spurred by the influx of football revenue, appear to have made a strategic decision to invest in college baseball. Then, as other agents witnessed the impact this investment could have on revenue, branding, and commercialization, they have started to follow suit. This behavior is difficult to categorize as an arms race because the investments appear to be a calculated expansion of a branding initiative, fueled by the opportunity to reach more fans, impact academic and athletic recruits, and ultimately generate greater wealth.
This study also seeks to understand the relationship between changes in athletic expenditures and overall winning percentage among NCAA Division I Power Five institutions. The results of regression analyses indicate a marginal relationship between spending and winning in college baseball. The results indicate that spending accounts for 20% of the variability in winning, when controlling for conference affiliation. There is a stronger relationship between spending and out of conference win percentage, as spending accounts for 26% of the variability in that variable. Every additional million-dollar investment impacts overall win percentage by only 5%. While the impact of additional expenses on win percentage can be seen as negligible, winning percentages are important, and winning even 15% more games can have an impact on post-season aspirations. Over the span of the study, teams that qualified for the NCAA Tournament won 66% of their games, compared to 49% for those that did not. Thus the impact of this spending cannot be ignored.
Concomitantly, there is enough variability in winning percentage to hypothesize about some of the other drivers of success. Ultimately, as in many other sports, the greatest driver of success will be recruiting. 63 This variability can be accounted for by a rich history of winning, or by a more contemporary commitment to the sport, that helps draw recruits to a particular program. The impact of coaching cannot be underestimated, nor can the program’s track record for creating Major League prospects. These will all influence a recruit’s decision about which school to attend. A coach’s relationship with local high school baseball coaches or with the amateur traveling baseball coach can also influence recruiting, thus impacting winning. A geographical argument can also be made in accounting for the variability in win percentage. Many northern schools are placed at a disadvantage due to longer winters, where they must open the first few weeks of the season on Southern or West Coast road trips while their home climates moderate. Location, then, can also account for the variability in win percentage.
This study further set out to understand the impact of additional baseball expenditures on the likelihood of participating in the various levels of the NCAA Baseball Tournament. Playing in the post-season has a significant impact on revenues and expenditures. Revenues more than doubled for teams that participated in the Tournament, a Super Regional, and the CWS, respectively. Expenses, conversely, were nearly a $1 million more at each respective level, in effect proving Shulman and Bowen’s 1 hypothesis that in order to make money, a school does indeed need to spend money. These results were an early indication of the strong relationship between spending and winning on the field. To this end, the results of this study expand on the findings of Orszag and Israel, 52 Lawrence et al. 53 and Jones, 54 all of whom reported small, positive relationships between expenditures and their respective measures of on-field success. The results of this study indicate that there is a positive relationship between operating expenditures, total expenditures, and winning.
There are potential avenues for which this information could serve athletic directors. On the one hand, investing in the game-day atmosphere and maintaining clean and up-to-date facilities, could drive up home attendance. This is an example of the kind of investment that is not subject to the zero-sum economics of the arms race theory; every school can increase attendance without putting other schools’ attendance at risk. In contrast, while improved attendance can be parlayed into a home field advantage and prove to be a recruiting advantage for athletes who enjoy playing in front of larger crowds, the net benefits may be a wash if all schools experience the same effect. To date in baseball, there is enough variation in investment that the rich do appear to be gaining. This competitive advantage could help in attracting better non-conference opponents and potentially increase the number of televised home games. In addition to the recruiting advantage, these expenditures could increase the prestige of the program, drive merchandise sales, and appeal to corporate sponsors, all of which would create or synergize avenues of revenue. In the end, these could all help win more games, and improve within-conference parity.
The results here then help to underscore the increased spending discussed in the literature, and frame the importance of a conference-wide investment in their respective programs. The logistic regression results should be the most eye opening for college athletic administrators to consider. Those results indicate that for every million-dollar investment, the odds of qualifying for the post-season surge by 248%, the odds of playing in a Super Regional increase by 112%, and the odds of qualifying for the CWS rise by 127%. These odds compound with each additional million-dollar investment. For athletic directors, this points to the profound effect that additional, and marginal when compared to football expenditures, investments in their programs can make. The probability tables further illustrate how expenditures impact the odds of a particular post-season outcome. For a Power Five conference team to have a 50% chance of making the Tournament, it must spend roughly $2.4 million. For athletic directors, this paints a picture of how quickly they can boost their chances of post-season play. These expenditures can manifest themselves through greater assistant coach salaries, a larger recruiting budget, an investment in facilities, or an investment in nutrition, sports medicine, and practice technology, to name a few. The revenue impact of post-season play should be diminished as teams that participated in the post-season generated more than double the amount of revenue of those schools that did not. If the institutional logic has changed for many athletic agents, the results here should compel their argument for additional resources and funding.
Given the varied impact evidenced in regression analysis across conferences, these results should synergize administrative efforts to better understand their budgets and find opportunities to make sound investments in program-specific areas. This could mean, perhaps, an indoor practice facility for a team in the Midwest, a new strength and conditioning initiative, or an investment in aging facilities. In the end, the return on the investment could potentially lead to another source of revenue generation on campus. The results here indicate that schools do not need to make a sizeable investment to influence on-field success. While this success may not open the program to the same revenue streams that are afforded to football and basketball, it can provide a powerful branding outlet that can build the commercial value, and overall wealth, of the program.
Conclusions and future research
Rogers 38 noted that the arms race in college baseball was less of a race and more of a sprint to gain a first-mover advantage, and observed that as revenues rose there would be a greater focus on making significant investments in the sport. The results here indicate that while expenditures and revenues have both grown over time, the mean percent of total revenues and expenditures for which they account have remained stable. Given the statistical outcomes of this study, and the varying economic and institutional logic theories presented, it is difficult to conclude that an arms race has taken over the sport. Rather, the results tend to support Bowen’s revenue theory of cost in that the increase in spending appears to be an outcome of the increased levels of revenue, and one that follows a strategic, calculated pattern as presented by Fort’s principal/agent theory. As more money has been available, and the commercial and branding opportunities have changed, athletic agents have greater flexibility, resources, and autonomy to extend the prestige and reach of their athletic programs, usually in an effort to generate greater profit.
Athletic administrators certainly understand that spending matters in college baseball, and the impact of even a small investment in the sport can be significant. The results here indicate that each additional million-dollar investment can increase winning percentage by five percent; moreover, it has an astounding impact on the odds of participating in the post-season. Still, this should not provide carte blanche to spend frivolously on the sport; rather, athletic directors must understand the nuances of their programs, and deploy mechanisms to learn more about the success factors inherent in their programs and, if Knickerbocker’s theory holds, the success factors for their rivals. In short, the competitive advantage for a particular program in a specific conference will always be distinctive, and those success factors will manifest themselves differently across each region and even climate of the country, though as conference-shared revenue sources become increasingly important, future homogeneity of investment within each conference should be expected.
This study is an attempt to build a foundation towards understanding the success factors for college baseball, and to further quantify the impact of spending on collegiate athletics. To this end, spending accounts for 18% of the variance in win percentage, and an additional million-dollar expenditure can produce a 5% increase in a teams win percentage. We also lean in favor of a principal-agent model, which argues against the blanket condemnation of spending growth as a wasteful arms race. This model is limited by its inclusion of only the Power Five Conference teams, and the identification of other success factors for college baseball programs. Future research should expand on these models to identify the variables that discern successful programs, coaches, recruiting classes, and facilities. The literature, and athletic decision makers, would also benefit from a statistical autopsy to determine which game-play metrics account for greater levels of success. It is also worth exploring the relationship and impact of recruiting, to understand if region of the country or conference affiliation have an impact on building a successful program. Further, it would be important to consider a potential lagged effect of spending on winning, as year-to-year expenses may have a cumulative effect on a future season. There should also be an examination of the socio-cultural assertions that make baseball different from other Olympic sports. Finally, the differences in spending and revenue should be quantified across all levels of competition, using a data set that is independent of the EADA, to test the outcomes of this present study across all levels of the NCAA.
Footnotes
Acknowledgments
The authors wish to thank Andy Schwartz and Dr Joseph Cooper for their expertise and feedback through this review process.
Declaration of Conflicting Interests
The author(s) declared no potential conflicts of interest with respect to the research, authorship, and/or publication of this article.
Funding
The author(s) received no financial support for the research, authorship, and/or publication of this article.