



Abstract
We examined a static jump test's relationship with back squat strength in collegiate athletes. Forty-one (n = 41) young (aged 20.8 ± 2.4 years), healthy volunteers reported estimated back squat one-repetition maximums and completed a static jump protocol. The static jump protocol included five loading conditions, and jump height was estimated via flight time from portable contact mats. Loading conditions for males (n = 19) included 0 kg (polyvinylchloride pipe), 20.42 kg, 43.10 kg, 61.25 kg, and 83.94 kg whereas females (n = 22) used 0 kg, 12.70 kg, 20.42 kg, 29.49 kg, and 43.10 kg. Relationships between back squat one-repetition maximums, jump height, ratio (jump height/system mass) at each loading condition, mean jump height and ratio across loading conditions, change in jump height and ratio per condition (ΔJH, ΔRatio), and performance slope (slope of best fit line for system mass vs. jump height) were evaluated. Amongst all subjects, large (r > 0.70), statistically significant correlations were found between back squat one-repetition maximums and jump height for the two lightest loading conditions, mean jump height, and performance slope. However, relationships varied by sex with mean jump height demonstrating the greatest consistency in both males and females. Mean jump height may be the most practical variable from this static jump protocol for monitoring training adaptations, particularly in relatively homogenous female collegiate athlete populations.
Introduction
Relative to collegiate strength/power sport performance, monitoring training progression is imperative. Successful monitoring allows for (1) prevention of unnecessary fatigue during different phases of training plans and competitive seasons, (2) timely training adjustments promoting optimal adaptations and performance preparations (e.g. peaking), and (3) an objective means to evaluate the efficacy of training, recovery, and coaching interventions.1–10 Logically, the ability to predict and “post-dict” 10 various responses to training and, ultimately, competition performance is invaluable for strength and conditioning professionals and sport coaches.
Due to its contribution to explosive movements, lower extremity strength has emerged as a particular focus of testing in the practical setting. 11 Currently, the back squat one-repetition maximum (1RM) is considered the gold standard for measuring maximum strength in lower extremity musculature. 11 Thus, back squat 1RM testing can be utilized throughout the macrocyle of training, when appropriate, to yield insight into lower extremity strength adaptation. In addition to 1RM testing, forms of jump testing can provide additional information regarding the efficacy of the training plan pertaining to lower extremity strength and power while mitigating the prevalence of 1RM testing. Two forms of vertical jump testing, the countermovement jump (CMJ) and static jump (SJ), have gained popularity for athlete monitoring and testing. 12 Of the two, CMJ testing is the more common form among high-level coaches surveyed though no consensus existed among coaches as to what vertical jump testing methods and output variables were most meaningful.13–16 While CMJ is more commonly used in monitoring, some SJ variables, based on recent findings, may be able to provide better insight into lower extremity strength and fatigue monitoring. 13
Stone et al.15,17–26 investigated relationships between self-reported back squat 1RM and power output during CMJ and SJ with loads ranging from 10% to 100% of 1RM. In that study, SJ peak power was shown to correlate more strongly with back squat 1RM (r = 0.75–0.94) than CMJ (r = 0.60–0.88). Moreover, others have also reported stronger correlations between variables of SJ and measures of strength and explosiveness compared to CMJ. 27 Indeed, Carlock et al. reported that unweighted SJ height was more strongly correlated, albeit only slightly, with back squat 1RM than CMJ height (r = 0.58 vs. 0.52 for SJ and CMJ, respectively).18,20,28 Additionally, an investigation by Haff et al. examined unweighted SJ and CMJ tests and demonstrated stronger correlations between SJ peak force and isometric rate of force development, and isometric peak force in the isometric mid-thigh pull compared to CMJ peak force. Similarly, they found that SJ jump height (JH) was more strongly related to mid-thigh pull outcomes than CMJ JH. 18
The reported correlations between SJ and measures of strength and explosiveness suggest that SJ variables may have large shared variance with, and thus high probability of inferring changes in, strength and explosiveness. To our knowledge, no studies have investigated a specific SJ protocol for use as a monitoring tool for lower extremity strength in collegiate strength/power athletes. While Stone et al. used 10 loading conditions up to 100% of 1RM, this does not appear to be a practical approach for large numbers of athletes, particularly over time. On the other hand, some other studies used unweighted SJ. 19 However, there is a concern that the unweighted SJ does not reflect squat 1RM to the same degree as loaded conditions because of the lower forces in the unweighted condition. Importantly, the number of trials must be sufficient to adequately test athletes (e.g. force, power curves, etc.) under a variety of loading conditions, while also avoiding unduly time consumption and overly fatiguing athletes which could interfere with subsequent trials or sport activities. Due to the lack of consensus on an optimal number of loading conditions to adequately infer an athlete's approximate change in squat strength, unweighted and an additional four weighted conditions were deemed reasonable and chosen to examine the practicality and adequacy of this protocol to infer approximate changes in squat strength. Therefore, the purpose of this study was to examine relationships between JH related variables from a novel SJ protocol and estimated squat 1RM as a first step towards using SJ as a monitoring tool for lower extremity strength.
Methods
Ethical approval
All procedures described herein were approved by the Institutional Review Board (IRB) of East Tennessee State University and conformed to the standards set by the latest revision of the Declaration of Helsinki. Written informed consent was obtained from all participants prior to their participation in this study. Finally, all participant results have been anonymized and participant identities cannot be recognized in this manuscript in any way.
Participants
Forty-one (n = 41) young, healthy subjects (aged 20.8 ± 2.4 years, height: 1.74 ± 0.09 m, mass: 80.0 ± 13.4 kg) with no history of major musculoskeletal injuries participated in this cross-sectional study. Of the 41 participants, 19 (n = 19) were males (aged: 21.8 ± 2.9 years, height: 1.80 ± 0.08 m, mass: 85.2 ± 10.1 kg) and 22 (n = 22) were females (aged: 19.9 ± 1.5 years, height: 1.69 ± 0.07 m, mass: 75.5 ± 14.5 kg). Thirty of the subjects (73%) were competitive Division 1 strength/power athletes or had completed their competitive career within the last year prior to testing. Notably, all female subjects were Division 1 collegiate softball players. Of the male subjects, eight (42%) were Division 1 collegiate track and field athletes while the other eleven (58%) consisted of seven members of the university ROTC chapter and four graduate or undergraduate students in the university weightlifting club. Importantly, all male subjects reported ≥2 years of structured resistance training experience, many of which provided training logs to verify this assertion.
Squat strength estimates
Back squat strength was based on training data and checked against participant self-reported estimates of 1RM. This method of estimation of 1RM was used due to the athletes' limited time to complete 1RM testing. 21 In addition to absolute values (Sq-ABS), a relative back squat 1RM to body mass ratio (Sq-BM) was also calculated for comparison.
Protocol procedures
Subjects were instructed to (and reported 100% compliance) refrain from vigorous physical activity for 48 h prior to testing. Subjects were first measured on an electronic scale and stadiometer for body mass and height measurements, respectively. Thereafter, subjects, in groups of two, completed a warm-up protocol and the SJ protocol described herein. A warm-up protocol consisted of 25 jumping jacks followed by one practice jump at 50%, 75%, and 100% of perceived maximum effort. All warm-up jumps were performed holding a polyvinylchloride (PVC) pipe placed just below the C7 vertebrae. Subjects were given up to 30 s of rest between the warm-up trials. Subjects were instructed during the warm-up to descend to a 90° knee angle which was measured via a hand-held goniometer and visually checked in each proceeding jump trial thereafter. 27
All weighted SJs were completed within a squat rack containing safety bars. Subjects were instructed to place the barbell used in the actual testing session in the same location as the PVC pipe in the warm-up throughout the SJ protocol, typically referred to as the “high-bar” position. If the investigators or subject felt spotters were needed during any trials, spotters were also placed at each end of the barbell. Similar to aforementioned investigations, subjects were instructed to assume the “ready position” after un-racking the barbell, at the 90° knee angle. Thereafter, a “3-2-1-jump” command was given and the subjects jumped without arm swing.15,18–20,27,28 JHs were recorded via the JustJump® contact mat (Probotics, Huntsville, AL). The JustJump® system has been shown to afford sufficient validity and reliability to estimate JH.15,18,20 The mat was attached to a hand-held computer that recorded flight time and estimated JH.
System masses.
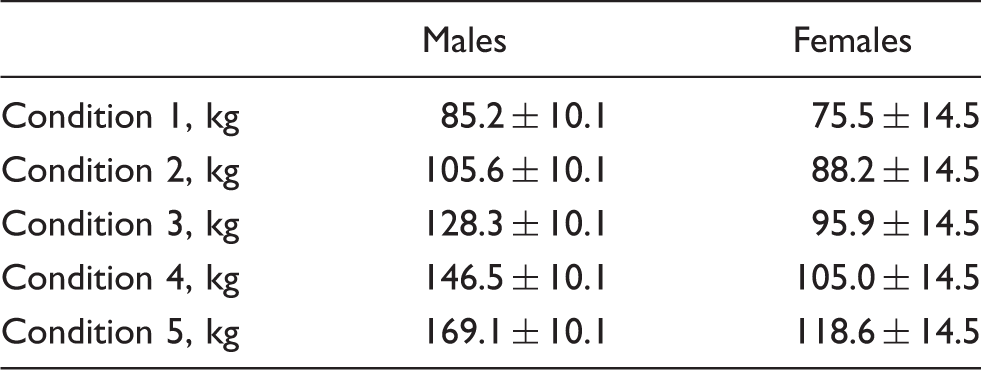
Note: Values are expressed as mean ± standard deviation. System mass was calculated as the sum of the resistive load for each respective condition and subject body mass.
Variable calculations
Summary of examined variables.

JH: jump height; Perf. slope: performance slope.
Statistical analyses
Intraclass correlation coefficients (ICCs) and coefficients of variation (CV) were calculated for the primary outcome variable of JH for each condition using the guidelines and spreadsheet provided by Hopkins.27,33 To more accurately reflect reliability of consecutive SJ trials, ICCs and CVs were calculated using the first two trials, independent of requirements for additional trials. IBM SPSS Statistical Software (Version 17, IBM, Armonk, NY) was used to evaluate the correlations between Sq-ABS and Sq-BM, and JH-associated variables and were classified according to Hopkins, 34 as: trivial (<0.10), small (0.10–0.29), medium (0.30–0.49), large (0.50–0.69), very large (0.70–0.89), nearly perfect (0.90–0.99), and perfect (1.00). To account for the number of comparisons, for all correlations an alpha level of 0.01 was required for statistical significance. Data are reported as mean ± standard deviation and, where appropriate, mean with the 95% confidence interval around the mean [lower limit, upper limit].
Results
Subject estimates of absolute and relative back squat 1RM
Estimated back squat 1RM group means for males were 141.3 ± 32.0 kg and 1.7 ± 0.3 for Sq-ABS and Sq-BM, respectively. For females, group means for back squat 1RM were 71.6 ± 19.6 kg and 1.0 ± 0.3 for Sq-ABS and Sq-BM, respectively. The four external loads used in the SJ protocol corresponded to the following percentages of Sq-ABS: 15.1 ± 3.1% and 18.9 ± 4.7% for condition 2, 31.8 ± 6.5% and 30.4 ± 7.5% for condition 3, 45.2 ± 9.2% and 43.9 ± 10.8% for condition 4, and 62.0 ± 12.6% and 64.2 ± 15.8% for condition 5 for males and females, respectively.
Reliability of repeated JH measures
ICCs across all SJ conditions ranged from 0.98 to 0.99 (overall mean, 0.99 [0.98, 0.99]) and 0.94–0.98 (overall mean, 0.96 [0.93, 0.98]) for JH measures in males and females, respectively. Across all SJ conditions (i.e., overall), CVs were 2.7% [2.3%, 3.3%] and 3.7% [3.2%, 4.4%]. Notably, all consecutive trials for all SJ conditions in males met the requirement of being within 3 cm of one another. In females, 9% (n = 2) of subjects required a third trial in one of the SJ conditions 1–4, whereas 23% (n = 5) of subjects required a third trial in SJ condition 5. However, a fourth trial was not necessary in any of these female subjects.
Change in JH and related variables associated with the SJ protocol
Jump heights (JH) and Ratio by condition.

Note: Values are expressed as mean ± standard deviation. Ratio was calculated as JH/system mass (SM) for each condition.
Association of back squat 1RM estimates with JH variables derived from the SJ protocol
Correlation coefficients (r) between Sq-ABS and Sq-BM 1RM, and variables related to JH derived from the SJ protocol for all subjects are presented in Figure 1. All correlations were statistically significant (P < 0.01) except for Ratio3 through Ratio5 relative to Sq-BM and Ratio2 through Ratio5 and mean Ratio relative to Sq-ABS. As can be appreciated from Figure 1, JH variables derived from the SJ protocol were all more strongly associated with Sq-BM than Sq-ABS. A very large correlation was observed between JH1 (r = 0.78 [0.62, 0.88]), JH2 (r = 0.79 [0.65. 0.87], ΔJH5-1 (r = −0.73 [−0.85, −0.54]), MeanJH (r = 0.75 [0.57, 0.86]), and performance slope (r = 0.81 [0.67, 0.89] for the overall cohort of subjects. Based on (1) the prevalence of unweighted JH (i.e., JH1 in this protocol) as a variable used in SJ testing, (2) the fact that mean JH and performance slope were representative of the protocol as a whole, and (3) the magnitude of correlations between these variables and Sq-BM, we chose to further explore the associations between JH1, mean JH, performance slope, and Sq-BM 1RM within sexes. Error bars are indicative of the 95% confidence interval for the correlation coefficient [upper and lower limits]. Closed circles and closed triangles illustrate statistically significant (P < 0.01) Pearson correlations. Calculation correlation coefficients. and/or formulas for variables are in Table 2.
Association between jump height (JH) variables derived from a static jump (SJ) protocol and estimates of absolute (Sq-ABS) and relative (Sq-BM) back squat one-repetition maximums. Correlation coefficients for JH variables associated with Sq-ABS and Sq-BM are represented by grey triangles and black circles, respectively.
Figure 2 illustrates the overall, as well as by group (i.e., by sex), correlations of Sq-BM 1RM with JH1, mean JH, and performance slope. For JH1, mean JH, and performance slope when evaluated by sex, very large, significant correlations were still evident in the female-only data (Figure 2(b), (d), (f)). However, significant correlations were not observed for the male-only data ((P > 0.01) Figure 2(b), (d), (f)). Moreover, only mean JH association with Sq-BM 1RM approached a large correlation (r=0.496) in the male subjects (Figure 2(d)). For panels (a), (c), and (e), data from all subjects are presented with analysis of the associations between Sq-BM and JH from condition 1 of the SJ protocol (JH1; Panel (a)), mean JH (average of JH for all 5 SJ protocol conditions; Panel (c)), and performance slope (slope of best fit line for JH vs. SM for all 5 SJ protocol conditions; Panel (e)). For Panels (b), (d), and (f), data show evaluations of the associations between Sq-BM and JH1, mean JH, and performance slope by sex, respectively, and are superimposed to illustrate the difference between sexes (open square represent female participants and closed squares represent male participants). Overall, n = 41: females, n = 22 and males, n = 19.
Scatterplots and lines of best fit illustrating the overall and by sex associations between jump height (JH) variables derived from a static jump (SJ) protocol and estimates of relative Sq-BM. The correlation coefficient (r), coefficient of determination (R2) and P value for Pearson correlations is presented in each panel.
Discussion
The purpose of this investigation was to examine the relationship between estimated back squat 1RM strength and variables derived from a SJ protocol considering its potential as a monitoring tool for approximating changes in strength and power. While exploratory in nature, the major findings of this investigation were: (1) overall sufficient reliability of measures of JH, (2) stronger associations between JH variables derived from a SJ protocol with estimated relative back squat 1RM (Sq-BM) compared to absolute back squat 1RM (Sq-ABS), (3) stronger associations between JH variables derived from a SJ protocol amongst female subjects compared to male subjects, and (4) a suggestion that mean JH from this SJ protocol may be the strongest predictor of back squat 1RM changes when considering inter-subject variability.
The investigated protocol produced JH measures that appear sufficiently reliable as revealed by observed ICC and CV values. As noted previously, the within condition difference in JH was allowed to be ±3 cm (1.18 in.) to reduce the number of trials necessary to estimate a JH for each condition. However, in an effort to more clearly determine reliability of consecutive JH measures, the first two trials for each condition were used for the calculation of ICC and CV values. Previous studies investigating unweighted and weighted SJs have reported reliability measures.18–27 For example, Kraska et al. reported ICC of 0.96–0.99 for SJ JH in unweighted and weighted conditions18,27 while Moir et al. reported a CV ranging from 2.1% to 2.6% for unweighted and weighted SJ JH. 20 Moreover, others have reported CV values of 4.3–6.3% in SJ JH. 36 In the present study, we observed ICC values ranging from 0.94 to 0.99 and CV values ranging from 2.1% to 5.3% for all conditions. Thus, execution of this novel SJ protocol would seem to agree with the strong reliability of JH measures previously reported in the literature.
Relative squat strength produced stronger correlation coefficients with nearly all calculated variables compared to Sq-ABS. Several authors have reported similar findings between relative measures of strength and other mechanical measures.37,38 Indeed, Haff et al. reported similar findings that a ratio of peak force to body mass in the isometric mid-thigh pull was better correlated to SJ height than absolute peak force (r = 0.75 vs. −0.16 and r = 0.63 vs. −0.37) in six elite women weightlifters.18,20,27,28 Furthermore, Kraska et al. reported slightly stronger correlation coefficients between SJ height at 0 kg and allometrically scaled peak force in isometric mid-thigh pull (r = 0.47) compared to absolute peak force (r=0.40). 28 Hence, variables from a SJ protocol in general appear to be better correlated to relative squat strength and are likely more useful in monitoring an athlete's training in this manner than absolute squat 1RM.
Correlation coefficients between select JH variables derived from the SJ protocol were stronger in the female subjects than those observed in males. Potential reasons for the apparent discrepancy between groups (i.e., sex) observed in the present study may be related to, but not limited to, the following: (1) subject population heterogeneity, (2) sex differences, (3) non-linear associations between JH variables and back squat 1RM, and (4) differences in SM used in the SJ protocol between sexes. A likely contributor to the difference in magnitude of correlation coefficients between males and females may be an artifact of the investigated subject pools (subject population heterogeneity). Indeed, the female subject pool consisted solely of competitive Division 1 softball players while the male data set consisted of a variety of different strength/power collegiate athletes as well as some not considered to be competitive collegiate athletes. Moreover, it is plausible that male subjects with greater back squat 1RMs had greater training ages and more experience with explosive exercise. Indeed, others have reported that subjects with more explosive resistance training experience and greater levels of maximum strength at the time of testing performed superiorly to weaker subjects in jump tests. 20 Finally, heterogeneity in the prevalence of concurrent training (e.g., aerobic) may have contributed to variability observed as concurrent training has been reported to compromise strength and explosive training adaptations in addition to muscle hypertrophy.20,39 In the present study, we did not control for training history or fatigue level and this should be explored in future investigations.
In addition to subject population heterogeneity, Laffaye et al. (2014) noted differences in force–time variables between males and females when athletes competing in different sports were individually analyzed for correlations suggesting that there may be significantly different associations between back squat 1RM and JH variables between sexes. 41 Furthermore, as was observed with the performance slope variable derived from the SJ protocol (Figure 2(f)), some JH variables may demonstrate a non-linear relationship with back squat 1RM. Finally, although SM per condition varied by sex, each weighted condition's external load produced nearly the same percentages of absolute squat 1RM for males and females. Thus, the difference in the loads used between males and females is less likely to explain the discrepancy in the strength of correlations between sexes. However, further investigation is warranted to elucidate the relative contribution, if any, of these factors on associations of JH variables derived from a SJ protocol with back squat 1RM as the present study was not sufficiently designed (or powered) to do so.
This investigation sought variables that could be used with high confidence to monitor changes in squat strength. Certain variables emerged that demonstrated very strong correlations with Sq-BM 1RM that warrant consideration. Unweighted JH (i.e., JH1), mean JH, and performance slope all yielded very strong, significant correlations with Sq-BM 1RM estimates for the overall data set, as well as in female subjects (r > 0.70 and P < 0.0001 for overall and female only data sets). In males, mean JH yielded the strongest correlation (r = 0.498), but did not reach statistical significance (P = 0.03) according to the critical alpha value utilized herein. Although mean JH correlation with Sq-BM approached significance, the relatively weak R2 value (0.25) would suggest that mean JH may not be an effective variable for monitoring changes in males. However, this should be interpreted within the context of this investigation which, admittedly, is flawed with respect to the heterogeneity aspects of the subject populations. Thus, it is reasonable to suggest that mean JH may be among the best JH variables derived from an SJ protocol for monitoring athletes, but further research in specific male populations is warranted.
In practical settings, our findings imply a better probability of successfully inferring changes in an athlete's Sq-BM 1RM using the observed JH variables with very strong correlations (JH1, mean JH, performance slope) in female athletes. Specifically, JH1 and mean JH yield the highest confidence given the more linear relationship between JH values and Sq-BM 1RM. For performance slope, although there is a very strong association with Sq-BM 1RM amongst females, the overall data set suggests that there may be a non-linear relationship. Thus, future studies should be conducted in which the Sq-BM 1RM amongst females incorporates a larger range to alleviate these concerns. Finally, given the current data set, the authors cannot confidently recommend the use of JH variables derived from this SJ protocol in male athletes until further research is conducted.
In conclusion, the present study demonstrates the high reliability of measures of JH and a stronger association between JH variables derived from an SJ protocol with relative back squat 1RM compared to absolute 1RM. Additionally, there may be potential for use of unweighted JH and mean JH from this SJ protocol in the monitoring of lower body strength/power in a relatively homogeneous populations of female athletes. However, further investigations are needed including, but not limited to, examination of the utility of the JH variables for monitoring changes during a training period. Given the potential time and effort saving value of a SJ protocol for monitoring athletes, such future investigations are warranted.
Footnotes
Acknowledgments
The authors wish to thank all of the participants for the generous donation of their time and efforts. This research was conducted at the Department of Exercise and Sport Science, East Tennessee State University, USA.
Declaration of Conflicting Interests
The author(s) declared no potential conflicts of interest with respect to the research, authorship, and/or publication of this article.
Funding
The author(s) received no financial support for the research, authorship, and/or publication of this article.