



Abstract
Conceptualized by youth soccer players, parents, and coaches, the fun integration theory’s FUN MAPS identify 11 fun-factors and 81 fun-determinants. The purpose of this study was to conduct a secondary analysis of those data to explore the extent to which the parents (responsible for supporting) and the coaches (tasked with delivering soccer programs) perceived importance of the factors and determinants were congruent with the players’ self-reported importance. We produced pattern-match displays and go-zone displays, which are innovative, visual representations of group comparisons that are unique to concept-mapping methods, to determine the overall consensus between the groups, in addition to identifying exact points of agreement and disagreement. Results indicated congruence between parents and players was extraordinarily high (r = 0.89–0.93) and significantly more congruent than coaches and players (r = 0.75–0.84). Results also indicated consensus was significantly lower among adolescent players and coaches (r = 0.66–0.71) compared to younger players and coaches (r = 0.77–0.90). Disparities in the perceived importance of specific fun-factors and fun-determinants between groups are discussed. In addition, transformative learning theory is introduced as an immersive approach to developing fun schemas consistent with the youth athletes' fun ethos that will enable coaches to be athlete-centric when creating fun, positive sport experiences for youth.
Introduction
Youth sport programs are recommended as child-centered physical activities.1,2 Yet, in the adult-driven, day-to-day operation of organized athletics, children’s voices are rarely central to the delivery of sport programs.3,4 Indeed, there is an absence of rigorous, systematic, scientific studies that represent children’s voices5,6 from which youth sport stakeholders can seek evidence-informed guidance when promoting positive sport experiences for youth. An area that is in need of further scientific study within the scope of positive experiences is fun. 7 Importantly, fun is the primary determinant of young athletes’ sport commitment and their sustained involvement in childhood and through their adolescence.8,9 Yet, a athlete-centered reference for intentionally and systematically promoting fun did not exist until recently. Well-established theories for understanding children’s sport participation motives such as self-determination theory, achievement goal theory, and others are encapsulated in the fun integration theory’s FUN MAPS, a novel, stakeholder-derived framework for understanding the multidimensional complexity of fun within youth sport.7,10
The fun integration theory’s FUN MAPS
The fun integration theory’s FUN MAPS 10 were developed from concept mapping, a type of translational research methodology that produces concept maps on a specific issue of interest. 11 It involved engaging youth sport stakeholders as key informants by building consensus and understanding of all the things that make playing organized team sports fun for players. Key informants included girl and boy soccer players, aged 8–19 years playing in recreational and travel programs from a mid-Atlantic metropolitan area of the United States, along with parents and coaches. For context, recreational programs in the United States customarily provide their players with one practice and one game per week, and the central emphasis of these programs is inclusive participation (P. Shaw, Virginia Youth Soccer Association, Coaching Education Director, personal communication, February 13, 2018). Therefore, regardless of skill level, players in recreational programs play at least 50% of every game. However, travel programs are more competitive, requiring them to try-out; and, if selected, they will practice three to five times per week and play one to two games per week. According to Shaw, in the mid-Atlantic metropolitan area in which the participants of this concept-mapping study were recruited and their data collected, travel coaches typically hold more advanced coaching licenses, have more coaching experience, and are generally paid, earning as much as $5,000–$12,000 USD per team each season, whereas recreational coaches are, for the most part, unpaid, with fewer years of coaching experience and coaching education.
In the development of the FUN MAPS, the players, parents, and coaches were first asked to generate as many statements (ideas) as they could by completing the focus prompt, “One thing that makes playing sports fun for players is….” Although these participants were recruited from soccer programs, 75.5% of the player participants reported involvement in other sports, either in the past or in the present. 10 In an effort to ensure that statements were generalizable across as many sports as possible, players were instructed to complete the focus prompt in a way that broadly represented their participation across all of their varied, team-based sport experiences. The content of their statements were analyzed through idea synthesis in which redundant ideas were combined into a single statement and complex statements that included several ideas were apportioned so that each idea became a single, simplified statement. This resulted in 81 unique statements considered determinants of fun in organized, team-based sports. Second, to understand how the fun-determinants were inter-related, the soccer players, parents, and coaches sorted them into piles and named each pile. Third, they rated the importance of each determinant relative to all of the others. Multidimensional scaling and cluster analysis were applied to the sorting and rating data generated, resulting in the data being represented in the form of three-dimensional concept maps. These maps, collectively called the FUN MAPS, display the 81 determinants grouped into the following 11 fun-factors (listed alphabetically) and were the basis for the fun integration theory: Games, Game Time Support, Learning and Improving, Mental Bonuses, Positive Coaching, Positive Team Dynamics, Practices, Swag, Team Friendships, Team Rituals, and Trying Hard. 10 According to the theory, accumulated immediate behavioral-actions (the fun-determinants) derived from contextual, internal, social, and external sources (the fun-factors) coalesce to create the affective experience of fun.
The youth athletes' fun ethos
Among the fun-factors, regardless of sex, age, and level of play, the player participants generally rated the 11 fun-factors by three distinct tiers of importance. 12 Listed in the order of most to least importance, specifically, Trying Hard, Positive Team Dynamics, and Positive Coaching were of primary importance; Learning and Improving, Games, Practices, Team Friendships, Mental Bonuses, and Game Time Support were of secondary importance; and Team Rituals and Swag were of tertiary importance. These findings, coined the youth athletes' fun ethos, are a reflection of their collective prioritization of the importance of all 11 fun-factors. The uniformity of these soccer players’ fun values is also seen at the more specific fun-determinant level. Girl and boy players responded similarly for ∼93% of the 81 determinants; younger and older players responded similarly for ∼96% of the determinants; and finally, recreational and travel players responded similarly for ∼94% of the determinants. Clearly, these players reported the importance of the fun-determinants, and thus factors were remarkably consistent across various participant demographics.
Even so, players are but one stakeholder within the broader youth sport setting, and though they are the primary consumers, they also generally possess the least amount of control over the cultural norms, practices, and general operation of the programs they participate in. 6 Thus, the social climate generated by adults most significantly influences the sport experiences of children. 13 Parents, in particular, are an incredibly powerful influence in their children's sport settings 14 and reportedly see themselves as consumers of enduring involvement in their children's sport participation.15–16 Meaning, parents have long-term interest in the athletic program(s) they have financially invested in for their children to play and compete. For parents, coaches are the most visible representatives of the parents’ investment because they are responsible for providing sport-specific instruction in consonance with the objectives of the athletic program. 15 Therefore, coaches play a key role in the development of young athletes and influence the overall quality of their sport experiences.17,18 Consequently, a natural line of inquiry is the extent to which the importance of the 11 factors and 81 determinants, as reported by the adults responsible for supporting (parents) and delivering (coaches) programs, is congruent with athletes' self-reported importance (i.e. the youth athletes' fun ethos). Respectively, we conducted a secondary analysis of the fun integration theory’s FUN MAPS to determine the degree of consensus among youth soccer parents and players, as well as youth soccer coaches and players, in order to identify aspects of fun that may warrant educational and skill-based interventions that would position adult stakeholders to provide their players with soccer experiences consistent with their fun values. If, in fact, programs intended to be child-centered activities are indeed, ideally, it stands to reason that parents and coaches’ perceptions of what is fun for their athletes will be congruent with the fun values.
Method
Participants
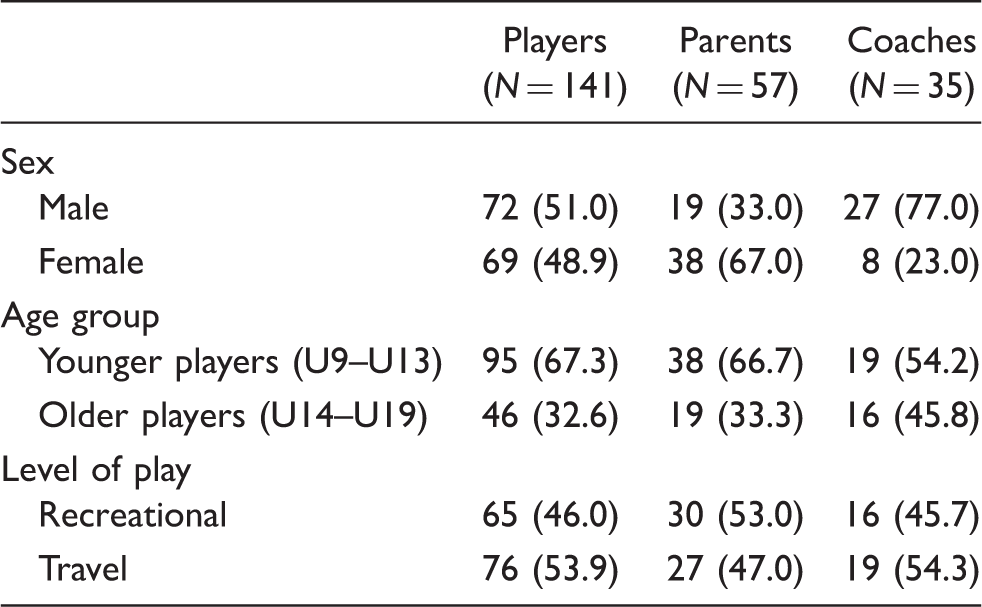
Participant demographics reported as N (%).
Procedure and data analysis
The George Washington University Institutional Review Board for the Protection of Human Subjects approved this study. A concept-mapping program (Concept Systems® Global MAX) was used to generate pattern-match and go-zone displays for group comparisons. SPSS version 23.0 was used for further tests of group differences.
Pattern-match displays
A pattern-match display is a ladder graph, in which the relative minimum and maximum mean rating values, from a scale of 1 (not as important) to 5 (extremely important), for any two comparison groups (e.g. girls and boys) anchor the ends of the vertical axes, and the 11 “rungs” represent the mean rating for each of the 11 fun-factors. The more horizontal the rung, the higher the level of agreement there is between groups (see Figures 1 and 2 as examples).
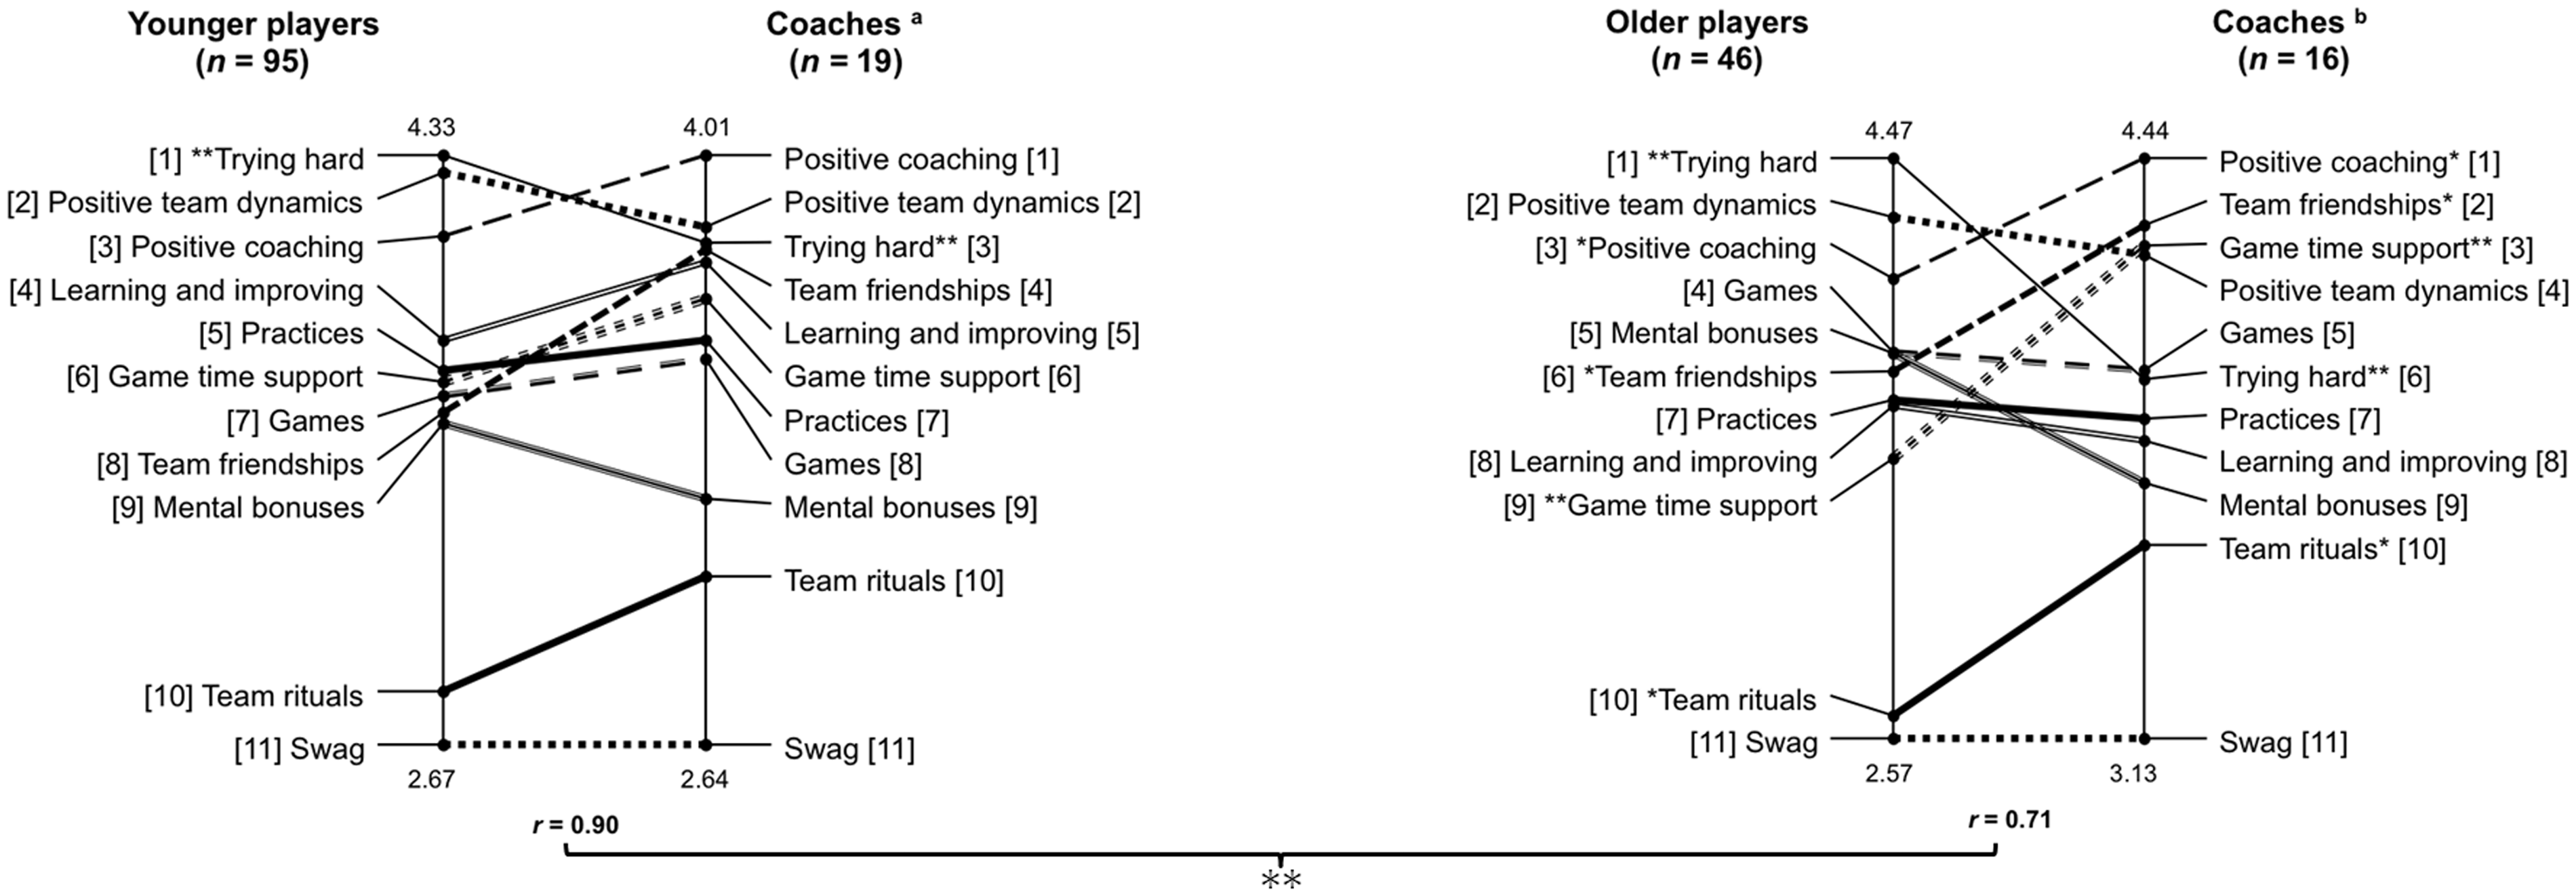
Pattern match display comparing players’ reported importance of the 11 fun-factors to adults’ perceptions of importance; numbers in brackets denote the rank order of importance from most important [1] to least important [11]. Pattern match displays comparing players’ reported importance of the 11 fun-factors to coaches, stratified by age numbers in brackets denote the rank order of importance from most important [1] to least important [11].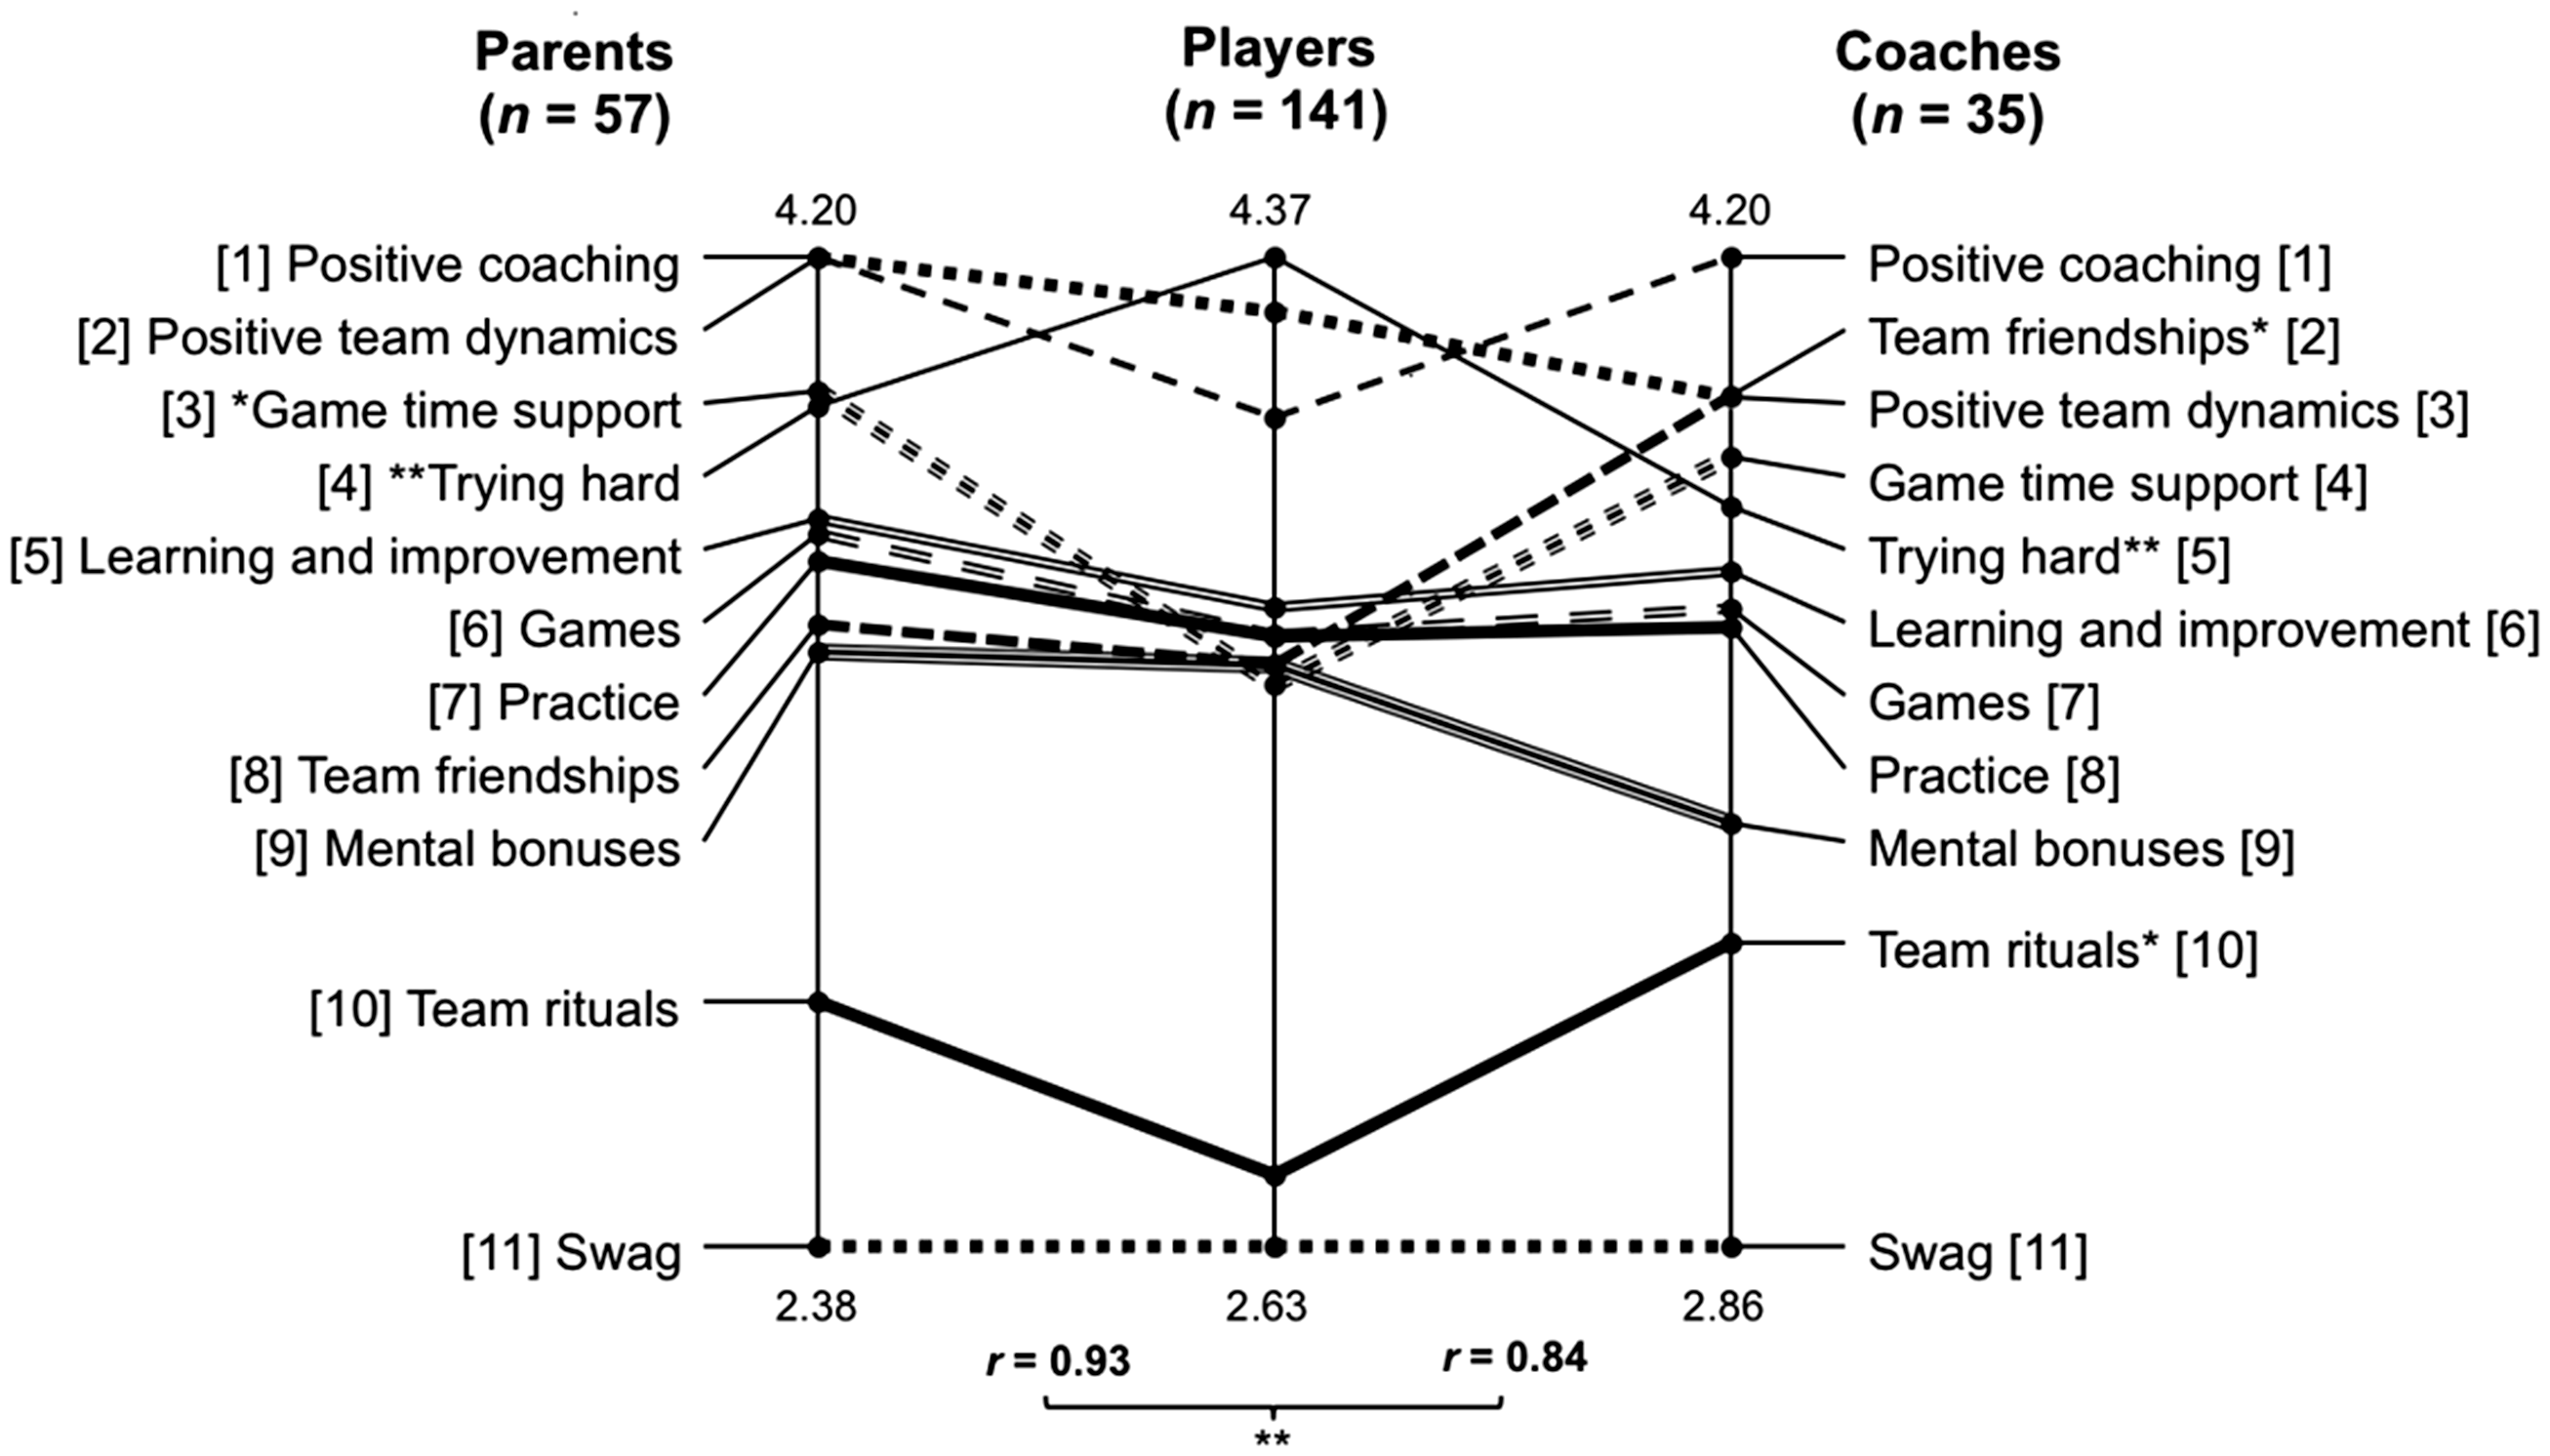
Six pattern-match displays were produced to assess between-group consensus among parents and players and among coaches and players, who were further stratified by age (e.g. younger players were U9–U13 and compared to coaches of U9–U13 teams; older players were U14–U19 and compared to coaches of U14–U19 teams) to discern possible age-related effects based on the developmental model of sport participation.19,20 Mann–Whitney U tests were run to identify which of the fun-factors (i.e. Positive Team Dynamics, Trying Hard, Positive Coaching, Learning and Improving, Game Time Support, Games, Practices, Team Friendships, Mental Bonuses, Team Rituals, and Swag) importance significantly differed between comparison groups. This non-parametric approach was applied, in part, to account for the relatively small and unbalanced samples sizes, in addition to the fact that the data were conceptualized as a discrete outcome and not continuous. The Fisher r-to-z transformation was used to determine whether consensus between parents and players, as measured by the pattern-match display’s Pearson product–moment correlation coefficient, was significantly different from the correlation observed between coaches and players. Coefficients closer to r = 1.0 denote greater congruence (agreement) between the two comparison groups. In addition, the Fisher r-to-z transformation was used to determine whether the correlation coefficient obtained from comparing younger players and coaches was significantly different from the coefficient obtained from comparing older players and coaches.
Go-zone displays
Go-zone displays are bivariate graphs that can compare groups to one another across the specific 81 fun-determinants (see Figure 3 as an example). To illustrate, imagine a go-zone display comparing girl players to boy players. Girls appear on the x-axis and boys along the y-axis. For both groups, the mean rating value for each of the 81 fun-determinants is plotted in the graph. At the x- and y-axes, a line at the mean rating value for all 81 fun-determinants splits the graph into four distinct quadrants. Any one of the four quadrants can be designated a “go-zone,” based on information of interest. For example, if the objective was to identify the fun-determinants rated above average in importance by girls and boys, the quadrant in the upper right corner of the graph would be designated the “go-zone.” In this instance, those fun-determinants would be of great interest for a coach of a co-ed team because that information serves as directional indicators for how to maximize fun across all of the coach’s players, regardless of sex. Fun-determinants that were rated in the bottom left corner of the graph identify for the coach those determinants rated below average for girl players and boy players, and determinants within the other two quadrants identify those rated above average by one group and below average by the other. Thus, each quadrant provides unique and practical information about the fun-determinants contained within. In essence, go-zone displays allow a coach to make more informed decisions about how to allocate resources and plan activities that best meet the players’ sport needs.
Go-zone displays comparing players’ reported Importance of the 11 fun-factors to coaches, stratified by age.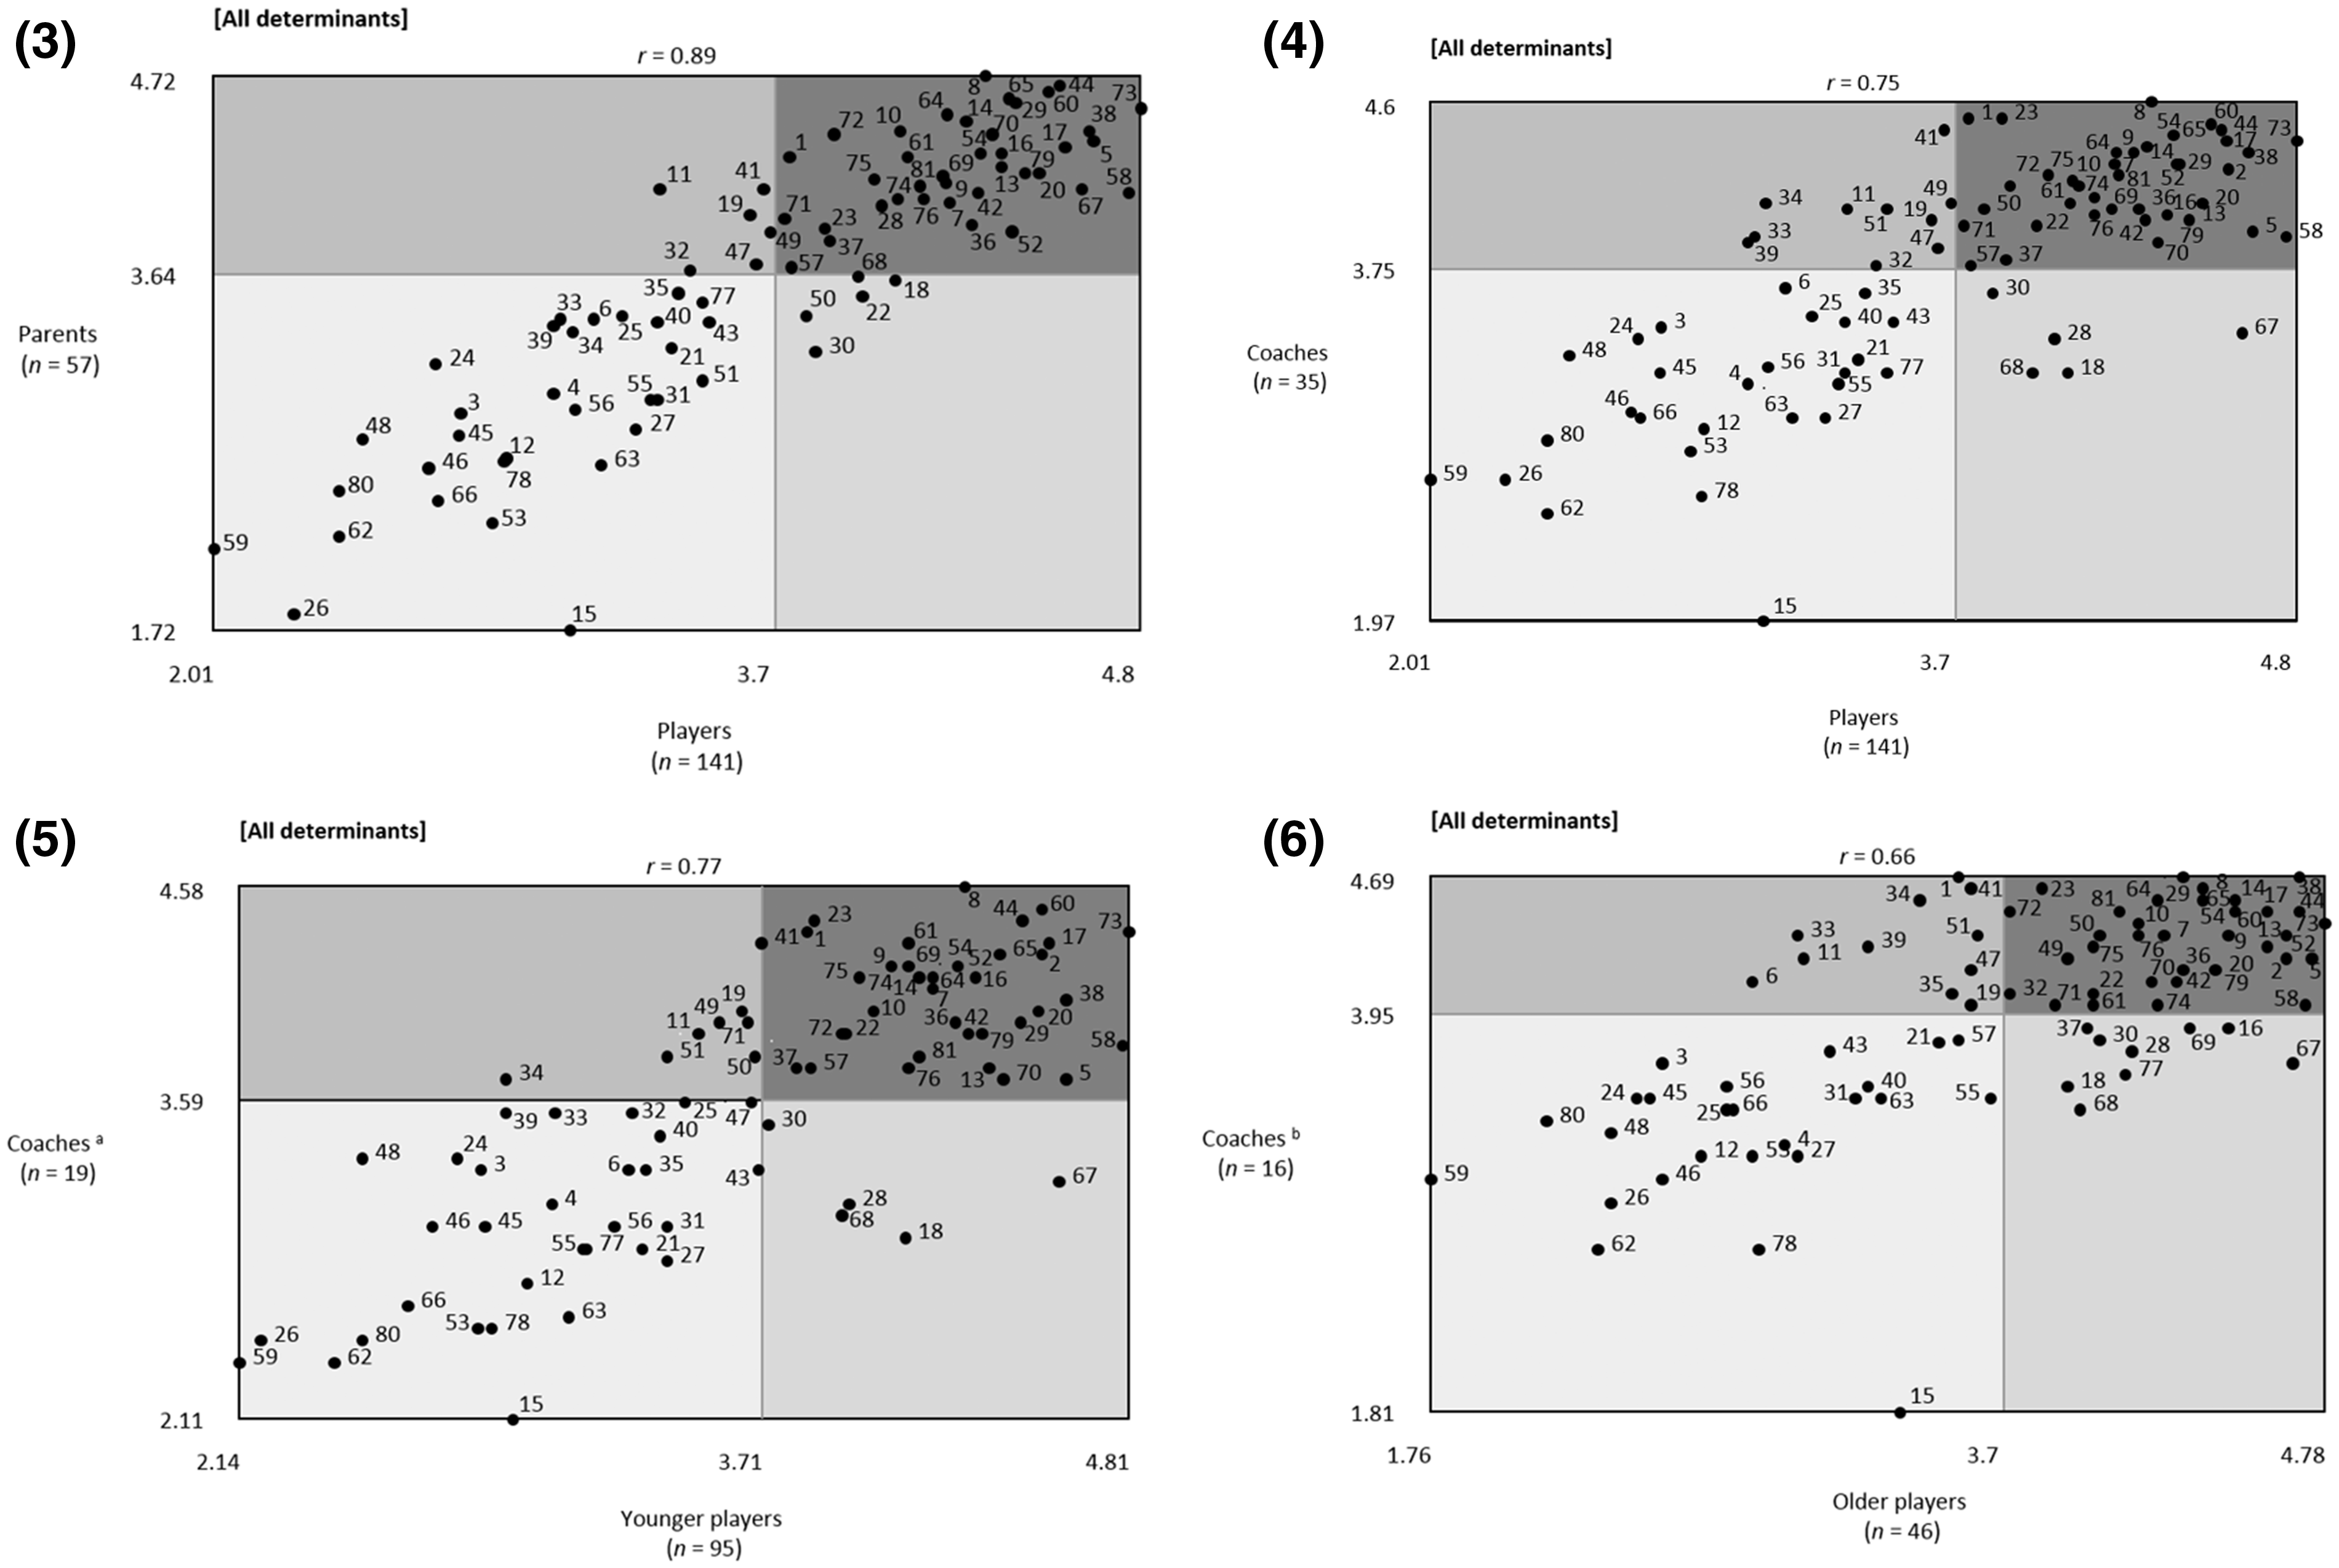
Four go-zone displays were produced to evaluate the overall association of the perceived importance of the 81 fun-determinants between parents and players, coaches, and players as well as coaches and players stratified by age (i.e. younger players were U9–U13 and compared to coaches of U9–U13 teams; older players were U14–U19 and compared to coaches of U14–U19 teams). Similar to pattern-match displays, the overall association or relationship of the perceived importance between two comparison groups is measured by the Pearson product–moment correlation coefficient. For the purposes of this study, the “go-zones” included the upper left and lower right quadrants of the go-zone displays, because these quadrants highlighted those determinants reported above the mean for importance by one group and below the mean by the other group, thereby identifying determinants of disparate importance. Mann–Whitney U tests were used to identify which of the 81 fun-determinants groups significantly differed in their reported rating of importance. To avoid the likelihood of inflating Type 1 error, a Bonferroni correction was applied for the go-zone graphs as well as the pattern-match analyses; therefore, statistical significance was set at p ≤ 0.013 (0.05/4 = 0.013). Lastly, the effect size of difference for fun-determinants that differed significantly between groups was calculated by r = Z/√N and interpreted using the following parameters: 0.1 a small effect, 0.3 a medium effect, and 0.5 a large effect.21–23
Results
Pattern-match displays
When comparing the mean importance rating for the 11 fun-factors, the degree of consensus between parents and players was quite high (r = 0.93; significant differences were observed for Game Time Support [p = 0.005] and Trying Hard [p ≤ 0.0001]), and examination of possible age-related effects yielded the same degree of consensus between parents and younger players (r = 0.93) and parents and older players (r = 0.93). Therefore, for parsimony, the pattern-match display using the total sample of parents and players is reported (see Figure 1). In addition to the high consensus observed between parents and players, consensus was also relatively high between coaches and players (r = 0.84; significant differences were only observed for Team Friendships [p = 0.004], Trying Hard [p ≤ 0.0001], and Team Rituals [p = 0.006]). Interestingly though, when compared to one another, the consensus observed was significantly lower (Z = 4.19, p ≤ 0.001) between coaches and players than between parents and players (see Figure 1). Furthermore, the degree of consensus for coaches and younger players (r = 0.90; significant difference observed for Trying Hard [p ≤ 0.0001]) was significantly greater (Z = 3.63, p ≤ 0.001) than the consensus indicated among coaches and older players (r = 0.71; significant differences were observed for Trying Hard [p ≤ 0.0001], Positive Coaching [p = 0.006], Game Time Support [p ≤ 0.0001], Team Friendships [p = 0.013], and Team Rituals [p = 0.002]; see Figure 2).
Go-zone displays
Parents and players
Parent–player comparisons of significant differences within the go-zone displays.
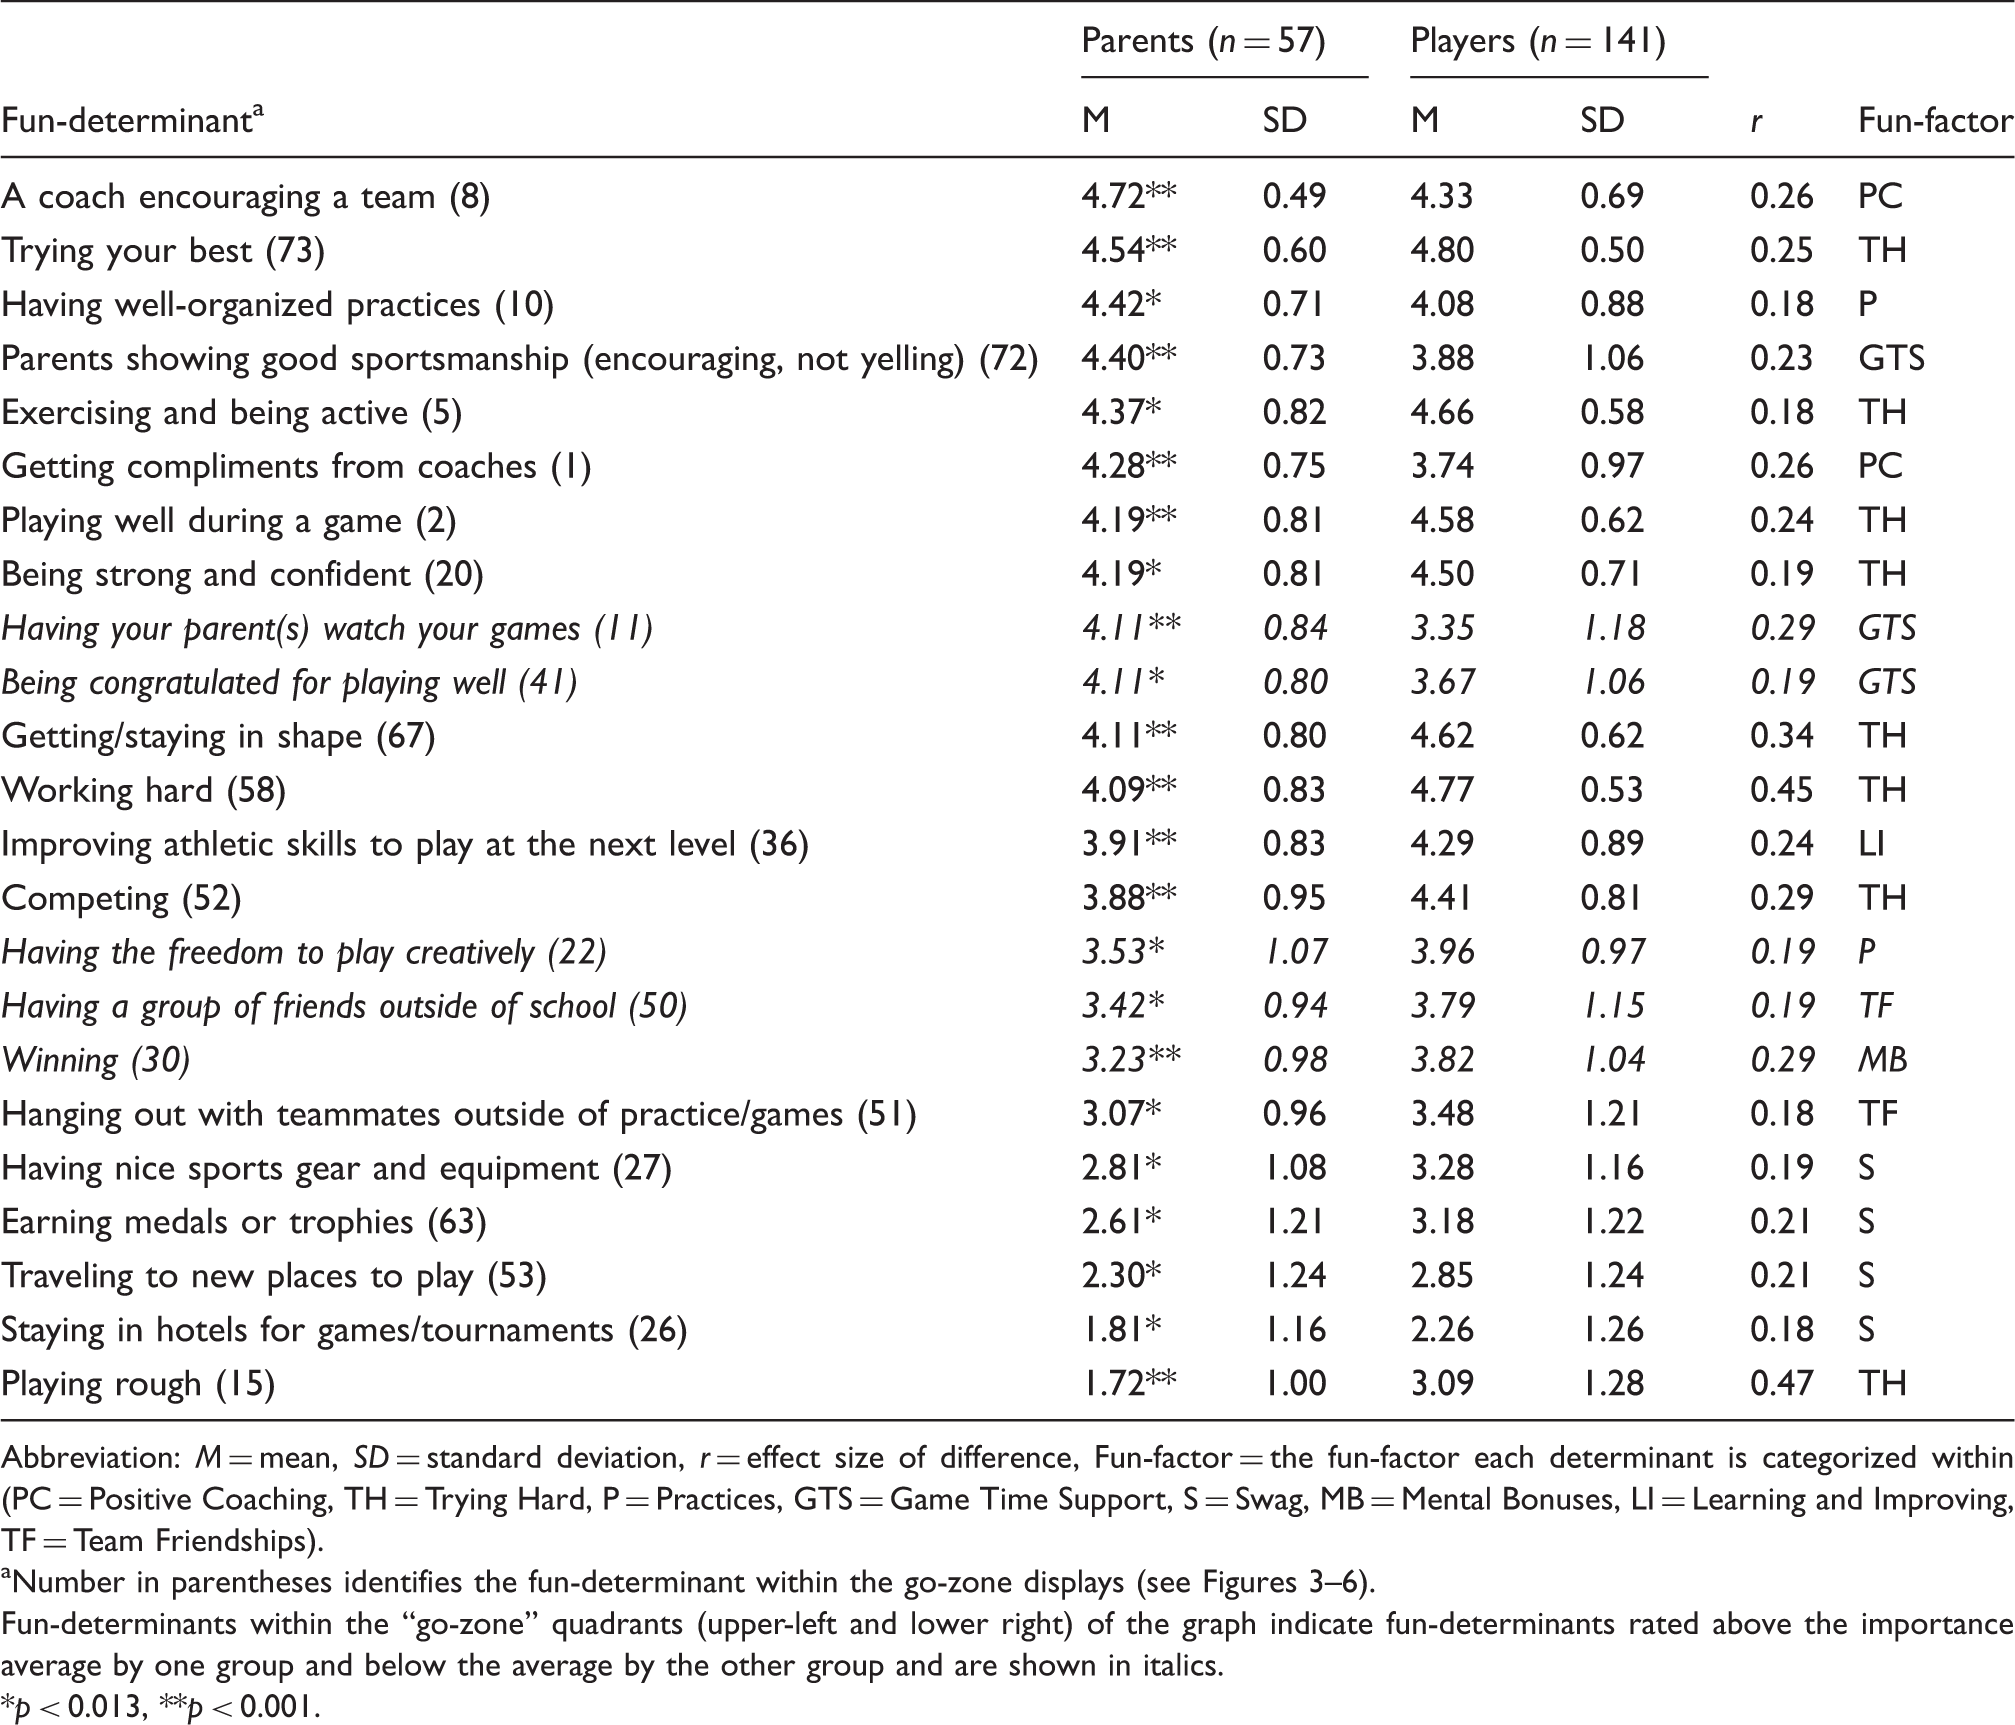
Abbreviation: M = mean, SD = standard deviation, r = effect size of difference, Fun-factor = the fun-factor each determinant is categorized within (PC = Positive Coaching, TH = Trying Hard, P = Practices, GTS = Game Time Support, S = Swag, MB = Mental Bonuses, LI = Learning and Improving, TF = Team Friendships).
Number in parentheses identifies the fun-determinant within the go-zone displays (see Figures 3–6).
Fun-determinants within the “go-zone” quadrants (upper-left and lower right) of the graph indicate fun-determinants rated above the importance average by one group and below the average by the other group and are shown in italics.
p < 0.013, **p < 0.001.
Coach–player comparisons of significant differences within go-zone displays.
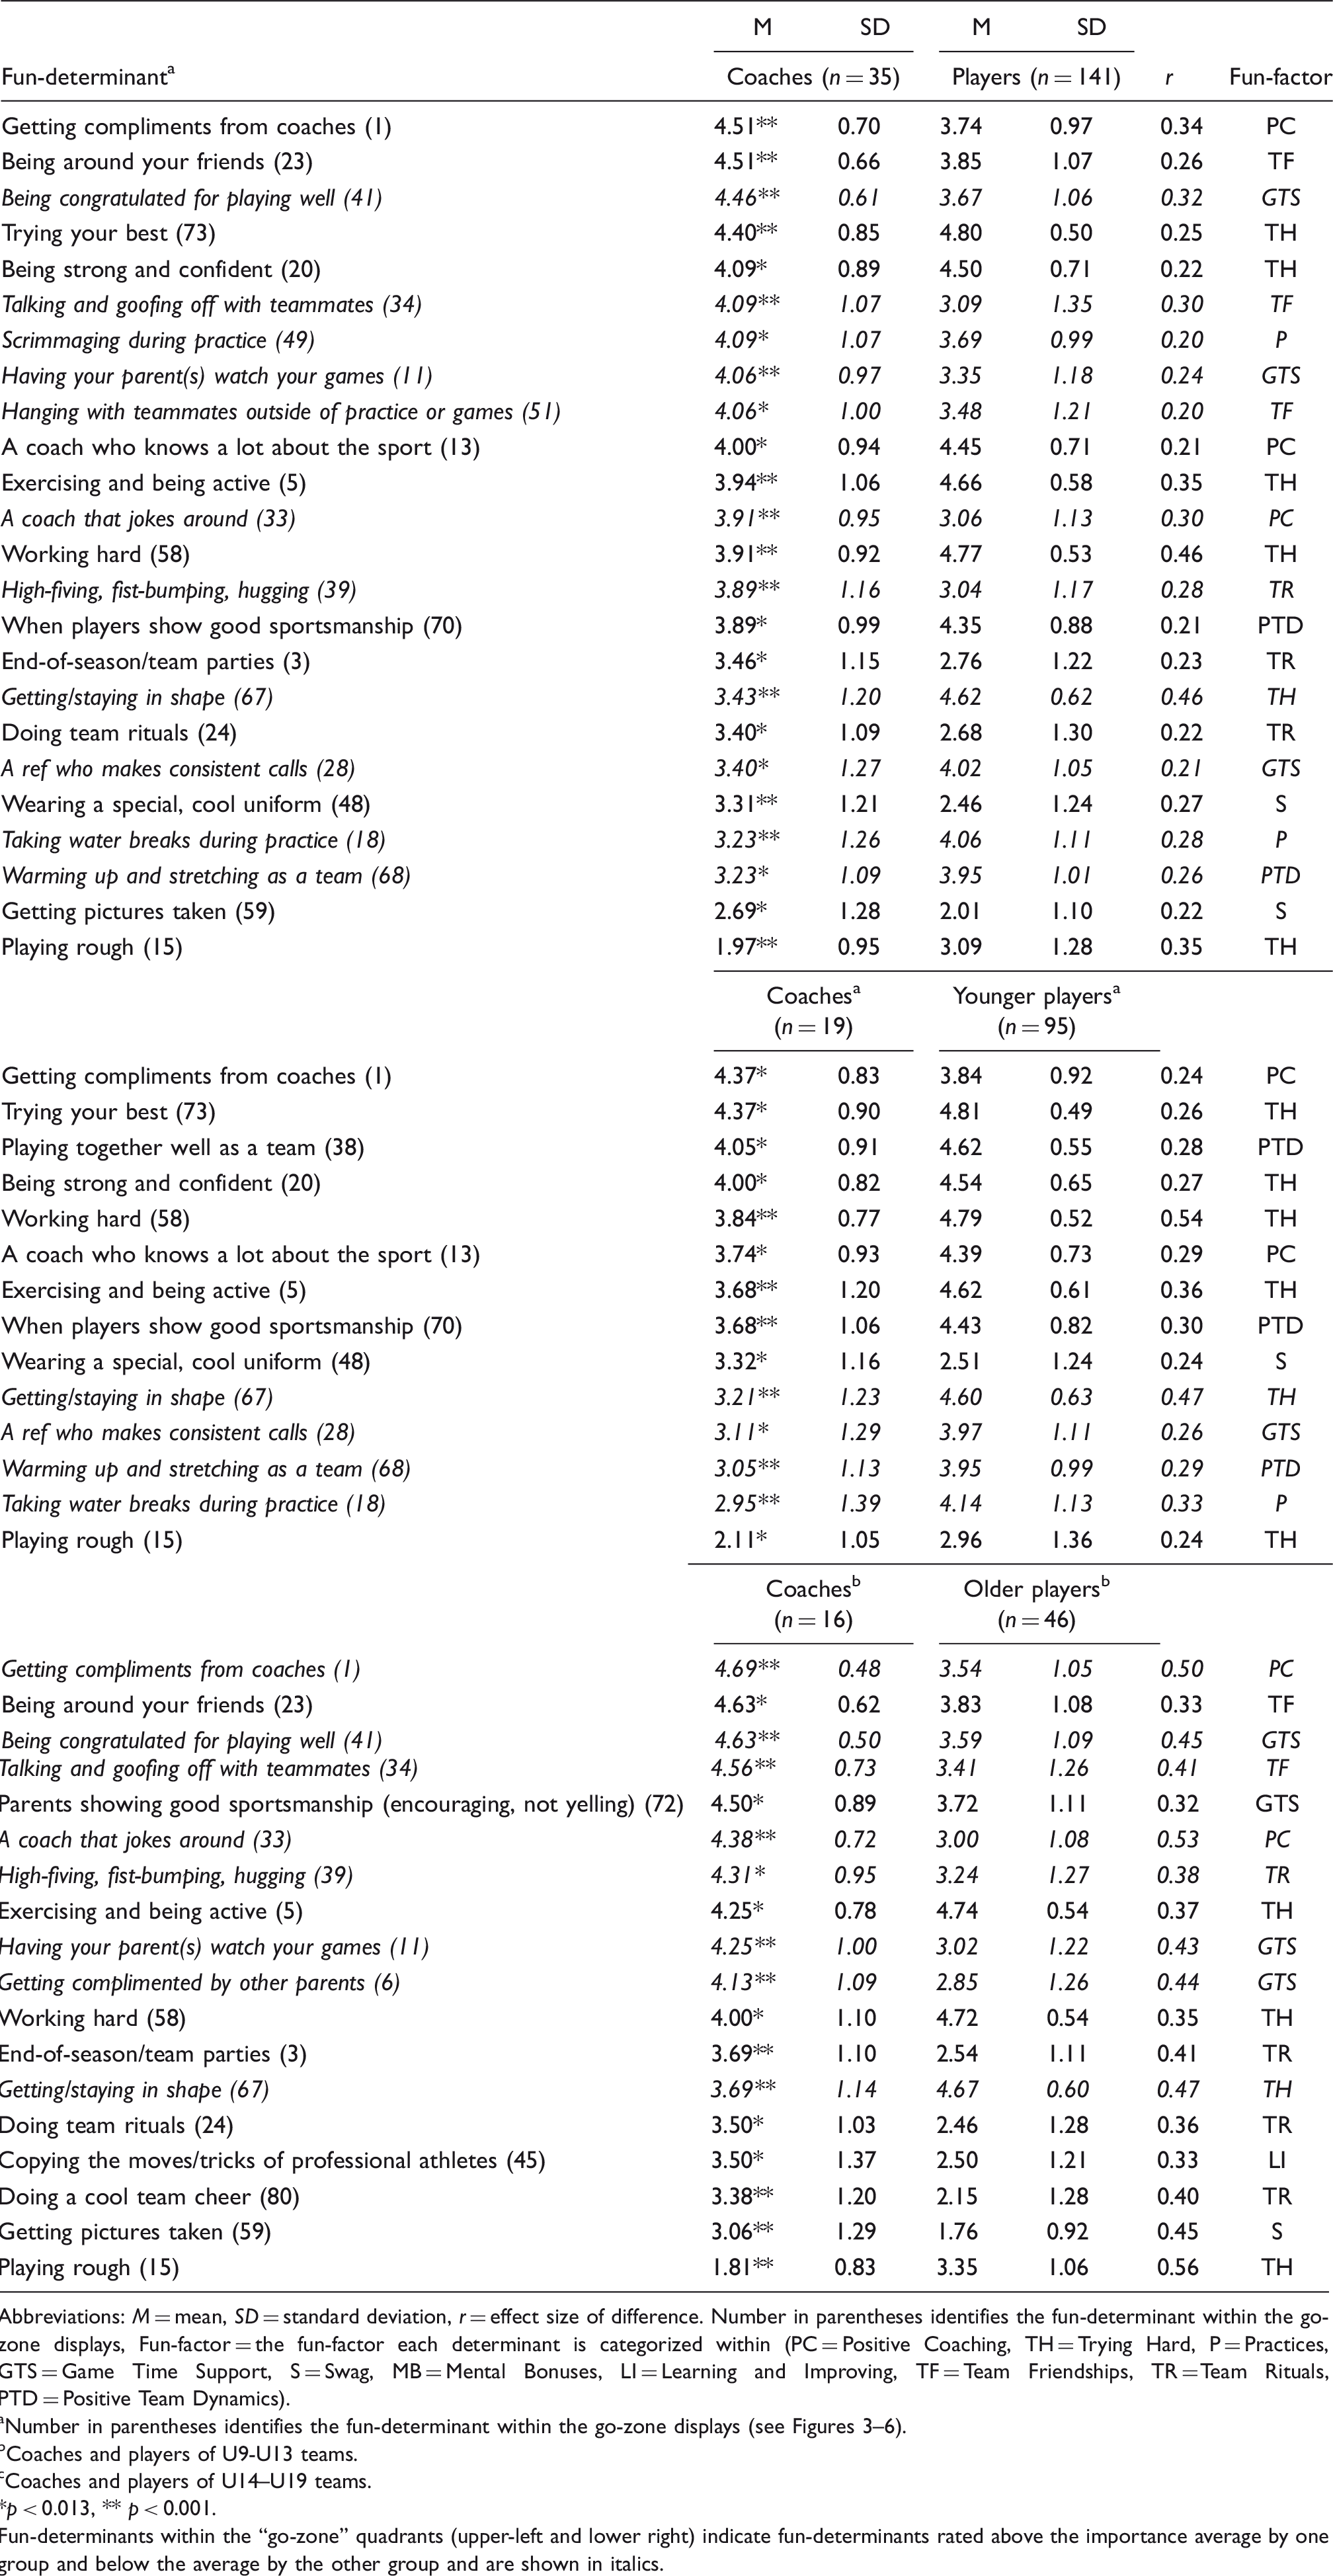
Abbreviations: M = mean, SD = standard deviation, r = effect size of difference. Number in parentheses identifies the fun-determinant within the go-zone displays, Fun-factor = the fun-factor each determinant is categorized within (PC = Positive Coaching, TH = Trying Hard, P = Practices, GTS = Game Time Support, S = Swag, MB = Mental Bonuses, LI = Learning and Improving, TF = Team Friendships, TR = Team Rituals, PTD = Positive Team Dynamics).
Number in parentheses identifies the fun-determinant within the go-zone displays (see Figures 3–6). bCoaches and players of U9-U13 teams.
Coaches and players of U14–U19 teams.
p < 0.013, ** p < 0.001.
Fun-determinants within the “go-zone” quadrants (upper-left and lower right) indicate fun-determinants rated above the importance average by one group and below the average by the other group and are shown in italics.
Coaches and players
The go-zone comparison of coaches and players displayed in Figure 4 exhibits a lower consensus (r = 0.75) than that between players and parents (r = 0.89). When independently comparing the 81 fun-determinants’ mean importance values reported, 24 significant differences were observed (see Table 3) with small to medium effect sizes of difference (r = 0.20–0.46), of which 4 were observed in the upper left go-zone (rated above average in importance among coaches and below average by players) and 4 in the bottom right go-zone (rated below average by coaches and above average by players; see Table 3).
Younger players
When comparing younger players and coaches (see Figure 5), a slightly higher consensus was observed (r = 0.77). Younger players and coaches differed significantly in their reported importance of 14 of the 81 fun-determinants, ranging from small to large effect sizes of difference (r = 0.24–0.54), of which 4 were observed in the bottom right go-zone (rated below average by coaches and above average by younger players; see Table 3).
Older players
Lastly, when comparing older players to coaches (see Figure 6), a much lower consensus (r = 0.66) was observed. Older players and coaches differed significantly in their reported importance of 18 of the 81 fun-determinants, ranging from medium to large effect sizes of difference (r = 0.32–0.56), of which 7 were observed in the upper left go-zone and 1 in the bottom right go-zone (see Table 3).
Discussion
Most often, adults’ frame of reference for sports is derived from their beliefs, values, perspectives, and own youth experiences, or through the lens by which they have become acculturated as an adult to youth sport values and norms.24,25 Therefore, we sought to examine parents and coaches’ perceived understanding of what is most important to players having fun and how those perceptions compare to players. Specifically, we examined youth soccer parents and coaches’ prioritization of the importance of the fun integration theory’s 11 fun-factors and 81 fun-determinants and their congruence with the youth athletes' fun ethos. Congruence was highest among parents and players; however, among coaches and players, there were discernable differences. Interestingly, congruence was relatively higher among younger soccer players and coaches than it was compared to adolescent soccer players and coaches. We discuss these findings, in addition to exploring ways in which youth sport educators can use transformative learning theory to lead positive reform, particularly among coaches, that is athlete-centered and fun.
High congruence among parents and players
Through daily interactions and reinforcement of their children’s behavior, parents are known to be the first and most significant socializing agents in the sport environment, 14 passing on their perspectives to their children.11,26 This may, in part, explain the generally high degree of congruence observed between parents and players’ comparative prioritization of the fun-factors. Of note, parents rated the fun-determinants germane to coaching behaviors and thereby the fun-factor Positive Coaching of greatest importance followed second by Positive Team Dynamics. The rank order of these findings is not unexpected because coaches are responsible for the athletic development of children and thus play a key role in the quality of young athletes’ sport experiences.17,18 Furthermore, parents perceive children’s overall experiences to be highly influenced by both the coach17–29 and by their children’s teammates.30,31 Interestingly, though, Game Time Support, defined by determinants such as parent(s) watching your games, people cheering, and being congratulated by parents for playing well, was ranked third by parents and only ninth overall by all players, or more precisely, ninth by older players and sixth by younger players. Plausibly, parents’ responses may have been influenced by a cognitive bias, known as illusory superiority,32,33 which resulted in the overvaluation of the fun-determinants germane to their role.
From registering their children to play each season, coordinating sport-related travel, to providing uniforms and equipment to informational and emotional support, the financial resources, time, and volunteer labor necessitated of parents is considerable.34,35 Given the level of dedicated commitment to their children’s sport participation, it is not entirely unexpected that parents would place relatively high importance on their own role in the quality of their children’s sport experience, particularly that which is positive (i.e. fun). In fact, parents are often viewed as architects of their children’s success, 36 and therefore, the more they perceive they are a contributing factor to their children’s success, in this case fun, the more moral worth and superiority they may feel. 37 Interestingly, though, the results of this study did not indicate that parents overestimated the importance of the fun-determinant winning, when compared to players. This finding was surprising given that parents have been identified in the literature as a source of performance pressure for children38–40 and to emphasize winning;41–44 although, the extent to which this perception exists could possibly be attributable more to anecdotal, popular media coverage45–48 than it has yet to be substantiated in the literature.49–51 The findings of this study may indicate that parents recognize, on the whole, that there is much more to their children’s fun, positive sport experiences than merely the outcome of a game (winning); or, perchance parents responded in a socially desirable way by minimizing the importance of winning.
Lower congruence among coaches and players
Of note, the high congruence observed among younger players and their coaches, along with the lower congruence among adolescent players and coaches, is consistent with and support what are known about fun and its relationship to youth sport participants’ retention and attrition. It is well established that youth sport dropout rates accelerate as children age. In fact, fun is the primary determinant of why children continue to play, and its absence, comparatively, is also the main reason children give for dropping out.52–54 Presumably then, young athletes experience more fun at earlier ages and less fun at older ages. The findings of this study, however, are unique in that they are the first to identify precise factors and thus determinants for which discordance between players and coaches exist with regard to fun.
The coaches of younger players, for example, generally mirrored the prioritization of the youth athletes' fun ethos within one or two rankings of each of the fun-factors, except for Team Friendships (e.g. being around friends, hanging with teammates outside of practice or games, and goofing around with teammates), ranked fourth among coaches and eighth among younger players. Similar rank-order disparity was also observed among coaches and older players. Specifically, Team Friendships was ranked second by coaches and sixth by older players. Interestingly, coaches’ perceptions of the importance of Team Friendships, which they rated above Positive Team Dynamics (e.g. playing well together, supporting teammates, showing good sportsmanship), place more importance on “who” their players are engaged with (on and off the field), rather than “what” their players are doing (on the field). For the players in this study, determinants of Positive Team Dynamics among their teammates are essential, primary components of having fun on the practice and game fields and are conceivably foundational to building toward Team Friendships.
However, adults’ schema for what constitutes fun is likely more intuitively and strongly associated with the determinants of Team Friendships more than it is to Positive Team Dynamics, defined by performance-related, cooperative, and supportive behavioral-determinants among teammates on the field. 7 These types of illusory correlations between two things can lead to predictable biases; 55 in this case, a stronger bond perceived between fun and Team Friendships, and to a lesser extent, fun and Positive Team Dynamics. For instance, in adult discussions of children’s sport needs, it is very common for “fun” and “being around friends” to be paired together. In this way, the associative bond between fun and friends becomes stronger through colloquial conversations, though Team Friendships is but one of 11 fun-factors, of which Positive Team Dynamics ranks among the most important. In fact, both younger and older players’ perceptions of more task-oriented fun-factors, such as Trying Hard, Positive Coaching, and Learning and Improving ranked above Team Friendships. That said, the findings of this study do not suggest that Team Friendships are not important to having fun; in fact, they are. However, players’ fun priorities are understood more wholly, relative to one another, when examined in the full context of the FUN MAPS 11 fun-factors and 81 fun-determinants.
Trying Hard (ranked sixth by coaches and first by players), Mental Bonuses (e.g. a positive attitude, winning, stress-relief, ignoring the score; ranked ninth by coaches and fifth by players), and Game Time Support (ranked third by coaches and ninth by players) were also factors in which rank-order disparity was observed between coaches and older players. These findings offer insight into the fun-factors and thus determinants clearly holding greater or lesser value for players than may be realized by coaches. This is significant because coaches’ efforts to make fun a focal point will, of course, be influenced by their personal beliefs and perceptions. 56 Resolving perceptual disparities between coaches and players will be key to cultivating a culture of fun that meets players’ fun needs within their sport experiences. Transformative learning theory offers youth sport educators (i.e. coaching education directors, sport psychology scientists and practitioners, league administrators, and so on) a framework for the perspective transformation of coaches, and parents too, through active, engaged learning of the fun integration theory’s FUN MAPS and its application in sport settings.
Transforming the fun culture
Transformative learning theory is a higher level approach to adult learning that positions educators as cultural architects57,58 with the charge of leading positive reform among key stakeholders. Simply described, transformative learning theory proposes a process of perspective transformation. People’s current assumptions are challenged, and through phases of constructive discourse and communication with others, an openness of perspective evolves within them, and the capacity to transform their perspective begins, which eventually leads them to make meaningful, intentional behavioral changes. 59
Transformative learning theory would suggest that when coaches are faced with a drastically different approach toward coaching (a disorienting dilemma), they would either reject it completely or begin to open their frame of reference to potentially make sense of it. 24 Youth sport educators can facilitate the transformation of soccer coaches’ perspective of fun, first by promoting critical reflection of the coaches own early athletic experiences having fun playing sports, and then paralleling those with the 81 fun-determinants and 11 fun-factors, in addition to challenging false assumptions of fun (e.g. see Ref. 7 and 12 for further review of fun fallacies). This would then help guide coaches in their development of a new schema for fun that is synonymous with what is currently known about soccer players’ requisite fun needs (i.e. the athletes’ fun ethos). In this way, the coaches’ expertise 60 is expanded, having acquired knowledge of the full range of fun-promoting actions and behaviors, in the context of skill development and competitive play in youth sport. Also, connecting coaches with other coaches, as mentors, that have successfully transformed their own perspectives of fun, and thus altered their coaching practices, can be significant in leveraging positive role models who have answered the call for coaches to “…privilege young people’s voices in the formation, operation, and adaptation of games, sports, and activities.” (p. 202) 24 Furthermore, helping coaches and parents identify ways to implement the many determinants of fun can be profoundly advantageous in bridging the science of what is currently known about fun with intentional, deliberate practice meant to maximize player outcomes. Creating opportunities to observe coaches on the field and provide them with constructive feedback and encouragement to promote their fun-efficacy will also advance coaches’ transformational growth and success in delivering humanistic, athlete-centered programs that are fun and consistent with “…engineering a youth sport structure that focuses on the elements of sport that children value.” (p. 11) 3 Effective coaches will be those who are able to successfully apply their knowledge of fun, in specific sport settings, to maximize player outcomes; and, those who are able to demonstrate such coaching effectiveness, over time, can be considered expert (fun) coaches. 60
Conclusion
Designing play and practice activities that are fun for athletes is one of the 10 recommended evidence-based youth sport policies. 3 Our use of illustrative pattern-match displays and go-zone displays is an innovative methodological approach to comparing the voices of soccer players about that which is chiefly responsible for their continued participation to those of the adults who are responsible for constructing their experiences. It stands to reason that if coaches, who are ultimately responsible for the delivery of sport programs43,61 intentionally provide programming that are overall more congruent with their players’ fun needs, and parents commit to facilitating fun for their child(ren) on the field via Game Time Support,55,62 along with supportive experiences away from the field, such as constructive, encouraging post-game talk on the car ride home, 63 players will have healthier, more positive experiences, and will thusly be more likely to continue to stay active and involved in sports. 64 The results of this study further our knowledge of specific fun-factors within youth soccer on which divergence of perceptions is most evident in adolescence that, in effect, deepens our understanding of fun-determinants on which adults, who exert considerable influence on youth’s experiences,43,65 can better meet players’ fun needs.
Notwithstanding these findings, the overall high congruence observed between parents and players, and also between coaches and younger players, is very encouraging; and, although the degree of congruence between coaches and older players was the lowest, at the most discrete level, only 18 of the 81 fun-determinants were significantly different. Meaning, 77.78% of the determinant comparisons between coaches and older players were similar. Overall, it is worth spotlighting that there were generally more similarities in the perceived importance of the fun-factors and determinants across the player, parent, and coach comparisons than differences. Thus, the findings of this study would suggest that parents’ and coaches’ relative understanding of children’s fun priorities are worth applauding. However, the extent to which their cognitive understanding translates to overt, actionable behaviors that promote fun on the field remains to be studied, as declining participation trends in team sports 66 would suggest that one aspect to retaining children’s participation in health-promoting sport activities is higher quality, more fun experiences.
Limitations and future directions
This study was possible given its secondary analysis approach to the data provided by the youth soccer players, parents, and coaches whose individual contributions to the original concept mapping study collectively conceptualized the determinants and factors composing the FUN MAPS. Thus, an inherent limitation is that its findings are entirely circumscribed to youth soccer participants from a mid-Atlantic region of the United States. Furthermore, the parent (largely female) and coach (largely male) samples within this study, though representative of those sexes that tend to be more likely to voluntarily participate in research studies67–69 and hold coaching roles, 70 may have impacted the study findings, leading to a greater degree of congruence observed among the comparison groups. Unfortunately, given the relatively small sample of parents and coaches in this study, we were underpowered to conduct sex comparisons, respectively.
To test this study’s findings, with larger samples, in other team-based sports (beyond soccer), across diverse regions of the United States, and internationally across the globe, using concept and mapping methods would be incredibly resource-heavy and time-intensive. Fortunately, the maps generated from concept and mapping studies naturally lend to the development of a measurement tool(s). 71 Essentially, the determinants and factors from the FUN MAPS become the tool’s items and scales. Opportunely, the 81 fun-determinants that were originally brainstormed and became the basis of the FUN MAPS were done so in a manner intended to be representative of youth’s experience across numerous team-based sports. 10 This would, therefore, be of great advantage with respect to validity when developing, refining, and testing a fun tool across sports. A tool such as this, after proving to be psychometrically sound, quick to administer and complete, and easily used in field settings, would be an important and needed advancement in this area of research, particularly in the evaluation and monitoring of the quality of youth’s sport experiences. In addition to a self-report player tool, the development of tools measuring coaches’ perceptions of their team’s fun experiences, and parents’ perceptions of their children’s experiences, would be an important advancement in the triangulation of the chief determinant responsible for children’s continued participation in sport—that is, fun. Furthermore, the value of the fun integration theory’s FUN MAPS, as an applied framework for youth sport programs and player outcomes (i.e. enhanced performance, personal development, and sustained participation), must be tested using carefully designed, rigorous, randomized controlled trials of intervention that will require precise measures of fun that are valid and reliable.
Lastly, future research may consider concept mapping what is fun for coaches with respect to coaching and what constitutes a generally positive experience as a coach involved in organized youth sports. After all, in addition to players, coaches are key stakeholders in the youth sport landscape and players, whether recreational or competitive, are dependent on coaches for their athletic development. Perhaps a coach’s FUN MAP, particularly for volunteer coaches, would be helpful in providing direction and insight into their experiences that could assist leagues and clubs in enhancing a coach’s experience, thereby keeping these coaches engaged in their programs. Indeed, of great value to the fun integration theory’s FUN MAPS, and any other map conceptualized through future research, is the stakeholder-derived manner in which the maps are developed and their capacity to turn science into action.
Footnotes
Acknowledgements
We are very grateful to the participating players, parents, and coaches for their significant contributions to this important research. A special thank you to Graduate Assistants, Lauren Beckley and Ciera Jones of The George Washington University, and to undergraduate research intern, Devon Mann of Occidental College, for their very careful, conscientious assistance in the preparation of the tables and figures for this paper. Thank you to Jennifer R. Hurst, Ed.D. of Truman State University and to Brandonn S. Harris, Ph.D. of Georgia Southern University for their comments on an earlier draft of this paper. Finally, thank you to the reviewers for their helpful comments.
Declaration of Conflicting Interests
The author(s) declared the following potential conflicts of interest with respect to the research, authorship, and/or publication of this article: The content is solely the responsibility of the authors and does not necessarily represent the official views of the NIH.
Funding
The author(s) disclosed receipt of the following financial support for the research, authorship, and/or publication of this article: The research reported in this publication was supported by funding awarded to Amanda J. Visek from (a) the National Institute of Nursing Research (NINR) of the National Institutes of Health (NIH) under Award Number K01NR012770, cost shared by The George Washington University's Office of the Vice President for Research and Milken Institute School of Public Health; and (b) the NIH National Center for Advancing Translational Sciences under Award Numbers UL1TR001876 and KL2TR001877.