




Abstract
Research is limited as to whether Functional Movement Screen scores relate to non-contact injury risk in rugby league players. This cohort study investigates whether the Functional Movement Screen score predicts non-contact injuries in elite adolescent rugby league players. Australian adolescent rugby league players (n = 52; mean age 16.0 ± 1.0 years) from one club participated in this study. Functional Movement Screen scores, height, and mass were collected at the beginning of the preseason. Training, match exposure, and injury incidence data (non-contact match and training injuries with three levels of severity) were recorded for each individual athlete throughout the season. Linear and logistic regression analyses were conducted to investigate the association between Functional Movement Screen score (continuous score, ≤ 14 or > 14, and three subscores) and injury risk, whilst controlling for exposure time. The mean Functional Movement Screen score for the sample was 13.4 (95% CI: 11.0–14.0). A total of 72 non-contact injuries were recorded (incidence rate: 18.7 per 1000 exposure hours; 95% CI: 11.6–24.8). There were no statistically significant associations between non-contact injury and Functional Movement Screen score for any of the analyses conducted. Our results suggest that the Functional Movement Screen does not reflect non-contact injury risk in elite adolescent rugby league players. Further research should investigate whether a more sport-specific movement screen in the preseason can more effectively predict injury risk in this population.
Introduction
Rugby league is an international contact sport in which players require highly developed speed and agility, muscular strength and power, and aerobic capacity. 1 Several studies have documented the incidence of injuries in rugby league with the majority of injuries occurring in the match environment and injury rates typically increasing as the competition level increases.2–5 Rugby league injuries are associated with significant health and financial costs and are suggested to impact negatively on team performance.6–8 Therefore, it is important to minimize the incidence of injuries, where possible, throughout a rugby league season.
Injury rates at the junior level of competition have been shown to range from 13.69 to 129.210 injuries per 1000 h, with recent studies reporting that between 43,5 and 52,11 players are unavailable due to injury each week at an academy and sub-elite level, respectively. Most of these injuries occur in association with tackling, although a considerable proportion of injuries occur in non-contact activities.4,5 Non-contact, soft tissue injuries are thought to have modifiable risk factors and, as such, may be preventable. 12 In rugby league, several risk factors for injury have been proposed, including playing position,5,13 body mass, 14 previous injury, 14 training load,15–17 skill level speed, 18 fitness, strength, and power. 19 Despite this research, successful interventions to reduce injury rates in these young players are yet to be identified.
One assessment tool that has not been studied extensively in rugby league, but has been proposed to predict injury risk in other contact sports, such as American Football,20,21 is the Functional Movement Screen (FMS). The FMS is a simple and easy to administer screen used to assess the functional movement competency of an individual.22,23 Although initial results from one study demonstrated a strong association between FMS score and injury risk, 21 a recent systematic review with meta-analysis questioned this association. 24 There is currently limited research on the FMS relating to injury risk in junior and adolescent athletes,25,26 despite adolescent athletes demonstrating lower FMS scores, 27 and FMS scores being shown to change with level of maturation. 27 Recently, Fuller et al. 28 reported a high prevalence of dysfunctional, asymmetrical, and painful movements in adolescent Australian Football players. 28 Further, Chalmers et al. found that the presence of ≥ 2 asymmetries on the FMS was associated with injury, defined as > 1 week time loss, in Australian Football players, 29 although a follow up study by Chalmers et al. was not able to reproduce these results. 30
To date, the association between FMS and injury risk has not been investigated in an adolescent rugby league population. Further, no previous studies investigating the relationship between FMS and injury risk have quantified or controlled for exposure time among participants, despite exposure time being an established risk factor for injury in sport. 31 If the FMS does predict non-contact injury in rugby league players, it may be recommended for use in conjunction with other screening tools 32 and established risk factor assessments 14 to develop a more comprehensive approach to pre-participation screening. Therefore, the aim of this study was to investigate the ability of the FMS to predict non-contact injuries in elite adolescent rugby league players while controlling for training and competition exposure. It is our hypothesis that lower FMS scores will be associated with increased incidence of non-contact injuries.
Methods
Study design
FMS testing was conducted at the beginning of the preseason in November 2012. Injury and exposure data were collected from November 2012 to May 2013 encompassing the preseason lasting 11 weeks and the regular competition season lasting nine weeks. Regression models were used to investigate associations between FMS score and injuries.
Participants
Elite adolescent rugby league players registered with the one professional rugby league club participated in this study. Players competed in the New South Wales Junior Rugby League (NSWJRL) competition in one of two teams, defined by the age of the players, as either under 16 (n = 23) or under 18 years (n = 29). Players were excluded from the study if they sustained an injury during or immediately preceding preseason testing. The institution’s Human Research Ethics Committee approved this study.
FMS screening
The FMS is composed of seven tests, which are the deep squat (DS), hurdle step (HS), in-line lunge (ILL), shoulder mobility (SM), active straight leg raise (ASLR), trunk stability push up (TSPU), and rotary stability (RS), as well as three clearance tests that specifically screen for pain.23,33,34 Each movement is scored from 0 to 3 giving a maximum score of 21.23,34 The FMS has been shown to be a reliable tool among clinicians demonstrating acceptable inter-rater and intra-rater reliability in rugby league players when scored in real time, regardless of the level of experience.35,36 Two members of the club’s strength and conditioning staff conducted FMS testing immediately prior to training at the beginning of the preseason. The lead researcher oversaw all FMS tests to ensure screening protocols were consistent with the standards outlined by the FMS. 33 Both testers had completed the level one course of the Functional Movement Systems™ certification program (http://www.functionalmovement.com/certification/fms_certification) and had over 12 months experience conducting FMS screens.
Exposure data
Training and playing exposure were determined according to each individual player’s participation in training and games throughout the season. Players trained two nights per week for two hours per session throughout the preseason and playing season. Of these two-hour training sessions, 45 min were dedicated to supervised strength and power training in the gym, and the remaining time was spent on the field with coaches and completing running-based conditioning work. Players competed in two trial games and nine round games throughout the season. In addition to the regular season, the under-16 team completed in one finals game. Games were of 60-min duration for the under-16 team and 70-min duration for the under-18 team.
To measure training exposure, the duration of each training session was recorded by coaching staff and player attendance at training was recorded as either: (1) full exposure, (2) amended training, or (3) absent. 31 Any player who was not able to fully participate in the prescribed training activities was recorded as having attended an amended training session. Amended training sessions were deemed to be associated with significantly less injury risk and therefore were not included in the total training exposure hours. Individual exposure was calculated by multiplying the duration of each full session attended by the number of sessions attended. Playing exposure was measured using the “athlete participation” method, whereby exposure was recorded as either: (1) full exposure or (2) absent. 37 Individual exposure time was calculated by multiplying the number of sessions attended by the duration of each session.
Injury data
All injuries were assessed by the team physiotherapist (post-graduate sports physiotherapist) and recorded in an injury database by the team rehabilitation coordinator. The team physiotherapist determined all return-to-play protocols in conjunction with the club sports physician. Both the physiotherapist and club sports physician were blinded to FMS scores. No consideration was given to players’ FMS scores in planning training throughout the season. To allow comparisons with previous studies, injury definitions were consistent with a recent rugby league consensus statement authored by King et al. 38 An injury was broadly defined as any pain or disability that occurred during participation in a rugby league match or training activity that was sustained by a player, irrespective of the need for match or training time loss or for first aid or medical attention. 38 Injuries were then categorized according to the amount of time lost from training and/or competition as either no time loss, > 1 day time loss, or > 1 week time loss to allow comparison of injuries of different severities.
The > 1 day time loss injury definition was used to include injuries that caused missed training but not necessarily a missed game; the > 1 week time loss injury definition was used to include injuries that were more severe and resulted in at least one missed game during the playing season. These categories have been used recently in studies of the FMS in adolescent athletes.29,30 Importantly, a distinction was made between contact and non-contact injury mechanisms according to the definitions outlined by King et al. 38 Overall injury incidence (incidence = (injuries per hours exposed) × 1000) was defined as the total injury incidence across all severity levels (no time loss, time loss > 1 day, and time loss > 1 week). Only non-contact injury data were used in the analysis.
Sample size
A sample size calculation was carried out a priori 39 based on the normative FMS data published by Schneiders et al. 40 Assumptions included an equal ratio of injured to non-injured players with FMS scores within each group (injured or non-injured) being normally distributed with a standard deviation of two. 40 Assuming that a clinically relevant difference in the mean scores between groups is 2, we would require at least 22 players per group to reject the null hypothesis that there is no association between FMS score and injury risk with a power level of 0.90 and a type 1 error probability of 0.05. Thus, 55 players were targeted for recruitment to allow for 20% dropout rate.
Data analysis
Descriptive statistics were calculated for player characteristics, FMS score, FMS sub score, and exposure data. Data were checked for normality prior to analyses, and non-parametric statistics reported where appropriate. FMS scores were analyzed as a continuous (0–21) and categorical score (≤14 or > 14), as Kiesel et al. 21 showed that this categorization of FMS score was more sensitive and specific for detecting players at increased risk of injury. FMS scores were also analyzed according to the sub scores as outlined by Portas et al. 27 Total FMS scores (out of 21), as well as movement sub scores including the DS, HS, and ILL tests (out of 9), a flexibility score including the SM and ASLR tests (out of 6), and a stability sub score including the TSPU and RS tests (out of 6) were investigated. The movement, stability, and flexibility sub scores have been shown to change with maturation level 27 and may relate to injury in adolescent athletes. Further, no previous study has included these FMS sub scores in an injury prediction model to investigate whether changes in FMS sub scores relate to injury in adolescent athletes. To investigate relationships between FMS score and injury, separate binary logistic regression models for each injury severity category (no time loss, > 1 day time loss, and > 1 week time loss) were performed with “injury” as the dependent variable. For each of these regression models, the independent variables were FMS continuous score (1–21) and exposure data. These analyses were repeated using the FMS categorical score (≤14 or > 14) and the FMS sub scores (movement, stability, and flexibility) as the independent FMS variable, while also including exposure.
Results
Participant characteristics
Fifty-seven players competing in the NSWJRL junior representative competitions were eligible to participate in the study; five players were excluded due to being absent or injured during FMS testing, therefore data were obtained on 52 players (mean age: 16.0 ± 1.0 years). The average FMS score for the squad was 13.4 (95% CI: 11.0–14.0), and the average exposure was 95.0 (SD: 24.6) hours per player. Table 1 provides descriptive statistics for player characteristics including player height, weight, BMI, FMS scores and exposure to matches, and training for injured and non-injured players included in the study (defined as > 1 week time loss). Table 2 reports average scores for FMS tests for non-injured players (i.e. no contact injuries) and for the three categories of non-contact injured players (all injuries, > 1 day time loss, and > 1 week time loss). Figure 1 presents the logistic regression analyses of the relationships between non-contact injury incidence (defined as all non-contact injuries, i.e. no time loss, > 1 day time loss, and > 1 week time loss) and exposure data (Figure 1a) and FMS score (Figure 1b).
(a) Scatterplot of non-contact injury (R2 = 0.045) incidence in relation to total exposure (hours) in elite adolescent rugby league players aged 16–18 years. (b) Scatterplot of non-contact injury incidence (R2 = 0.331) in relation to FMS score in elite adolescent rugby league players over one competitive season. Characteristics of players (n = 52), FMS scores, and total exposure to matches and training. Data are mean (SD) or counts. Mean (SD) of scores for each Functional Movement Screen (FMS) test for non-injured players and for different injury severity categories for non-contact injuries.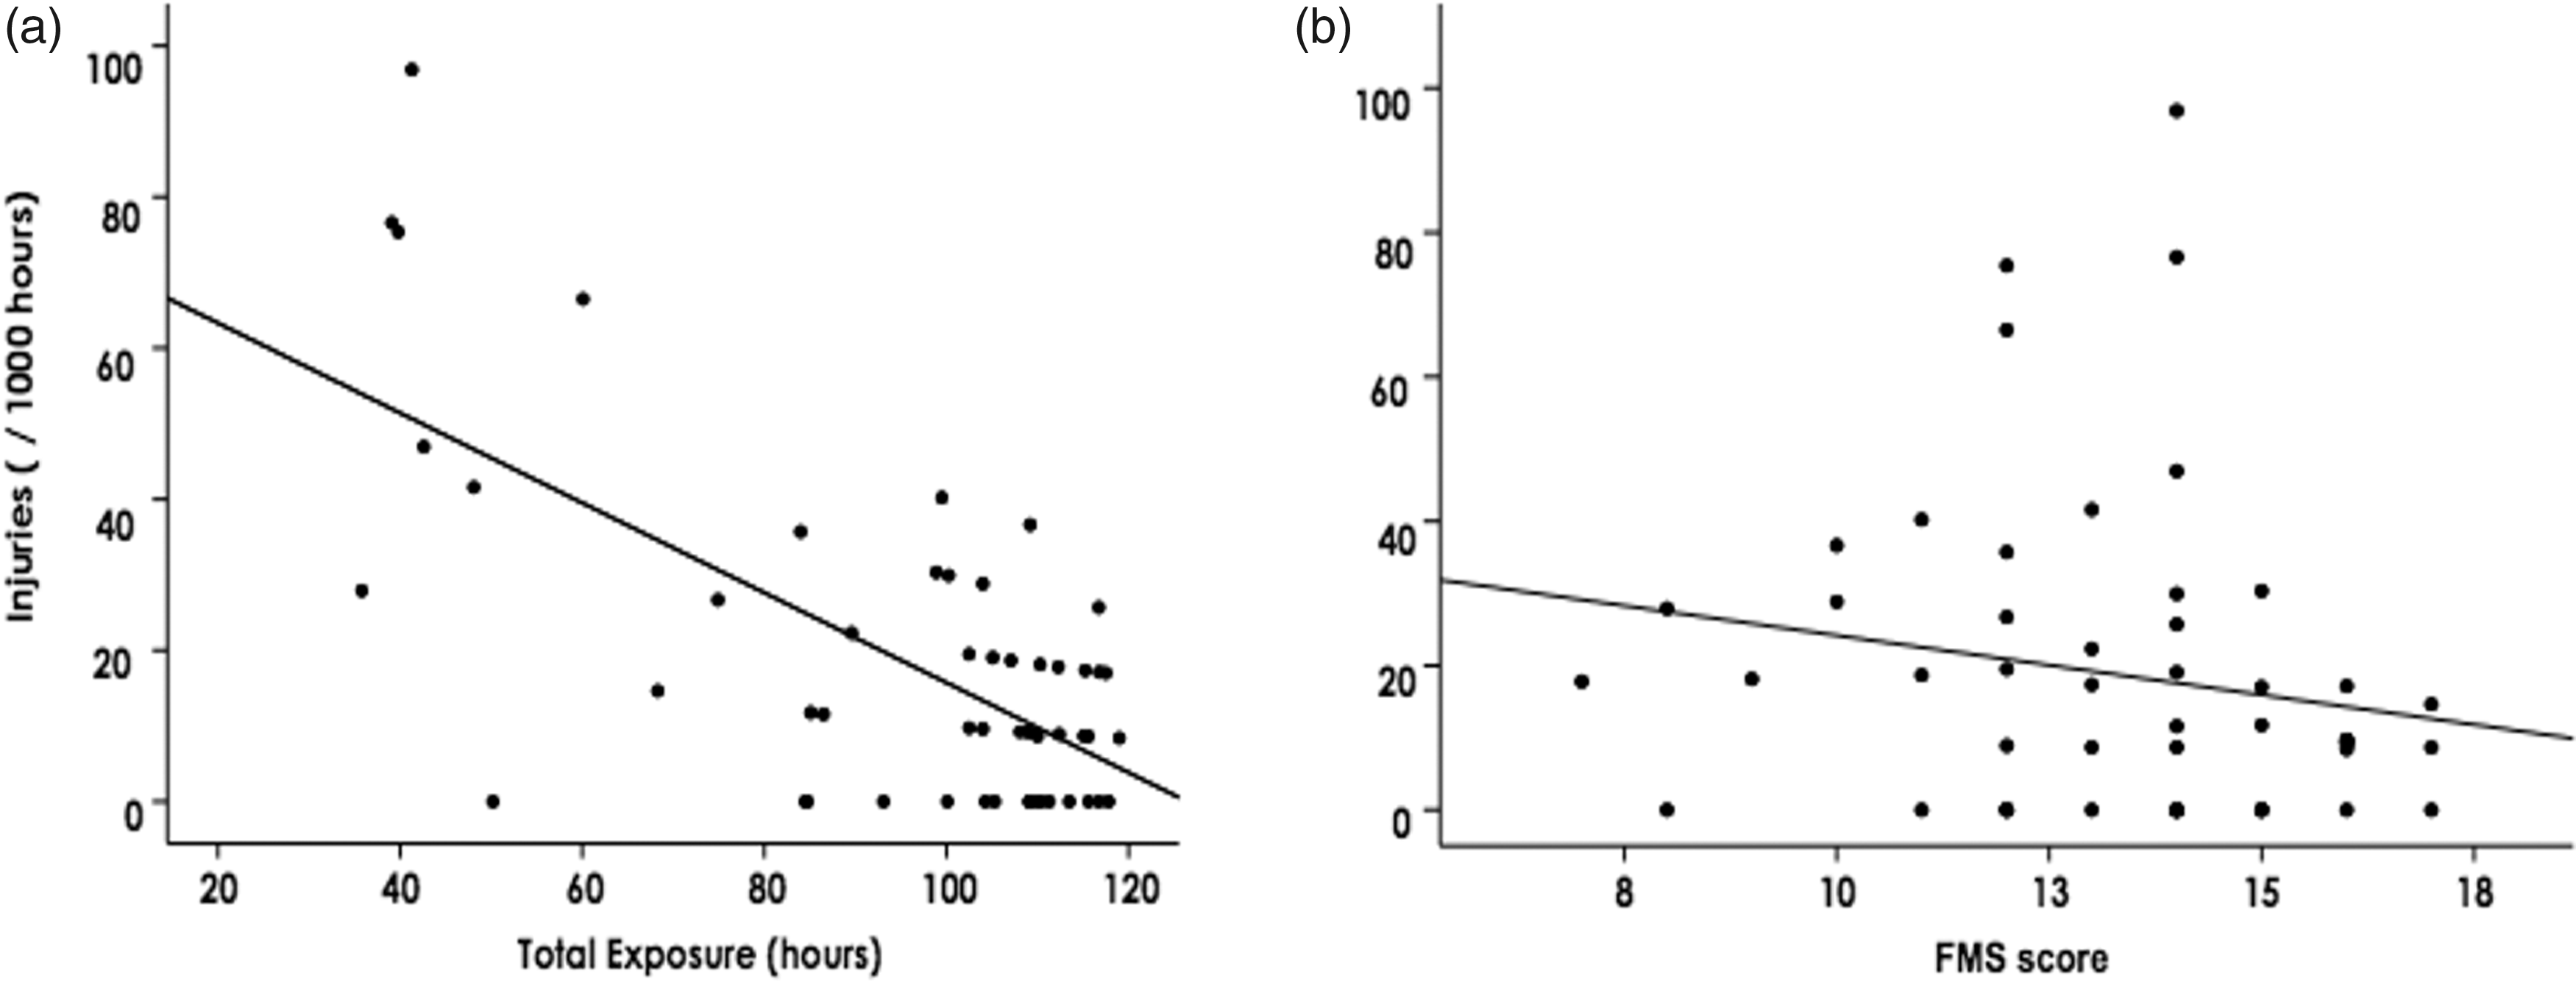


Injuries and associations with FMS scores and exposure
Detailed injury analysis according to “overall” injuries and all “non-contact” injury events and split into three severity categories (all injuries, > 1 day time loss, and > 1 week time loss).

Logistic regression analysis for FMS total score (categorical and continuous) and FMS sub scores on non-contact injuries.
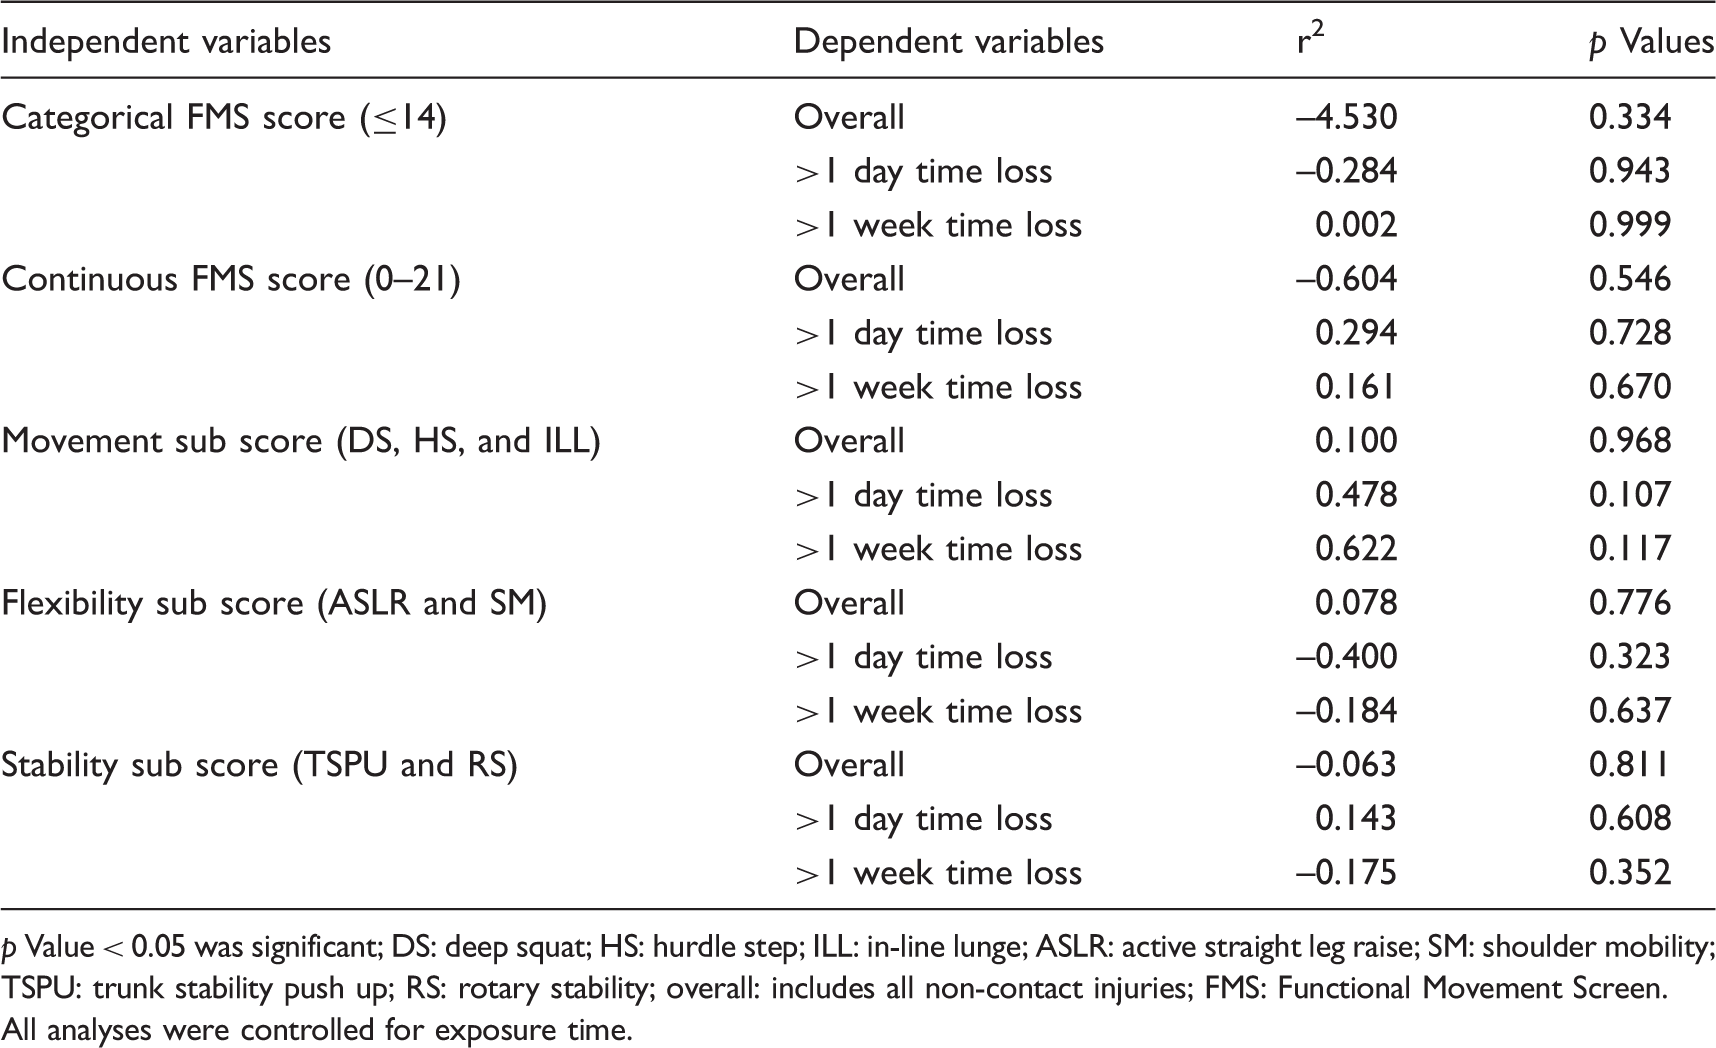
p Value < 0.05 was significant; DS: deep squat; HS: hurdle step; ILL: in-line lunge; ASLR: active straight leg raise; SM: shoulder mobility; TSPU: trunk stability push up; RS: rotary stability; overall: includes all non-contact injuries; FMS: Functional Movement Screen. All analyses were controlled for exposure time.
Discussion
This study was the first to investigate the relationship between FMS scores and injury risk in adolescent rugby league players and the first to investigate associations between FMS scores and non-contact injury while controlling for training and competition-match exposure. By focusing on non-contact injury (the types of injuries the FMS is purported to more likely predict) and controlling for exposure, our research attempted to gain a truer representation of how FMS scores relate to injury. No statistically significant associations were found between FMS scores and injury risk, despite using several different methods of categorizing FMS score and including severity groupings in the injury data. Our research does not support the hypothesis that low scores on the FMS are associated with increased risk of sustaining a non-contact injury in elite adolescent rugby league players. This is consistent with other studies that have found that FMS score does not predict injury.30,41,42
We recorded a total of 72 non-contact injuries at a rate of 18.7 injuries per 1000 exposure hours (95% CI: 12.6–24.8), which is comparable to previously published injury rates for elite adolescent rugby league players.2–5 Players in the current study had a lower mean FMS score (13.3 ± 2.4) than previously reported mean FMS scores in adolescent male sporting36,43 and non-sporting44,45 populations. Given that the athletes in this study had similar FMS scores, yet demonstrated an injury incidence that is representative of an elite adolescent rugby league squad, it would have been expected to see a relationship between FMS score and injury risk.
A significant difference between our study and recent studies that have shown the FMS to be related to injuries in adolescent athletes28,29 may be related to a lower proportion of asymmetrical movements found in junior rugby league players. Only the FMS total score (i.e. 0–21) and categorical score (i.e. ≤ 14 and > 14) were assessed in this study with no consideration given to the number of asymmetrical or painful movements. Other possible reasons why no association was found may be due more limited exposure throughout the season. Exposure time varied widely among the athletes in the current study depending on a player’s selection in the competition squad on a week-to-week basis. Average overall exposure in this study was 95.2 ± 24.7 h, however, of this exposure, a mean of 9.4 ± 4.0 h or 9.9% was match exposure. Match exposure is known to have a higher injury incidence than training exposure,15,46 and training and playing exposures were significantly less in this study than previous studies of rugby league players in older players16,47 due to the shorter season duration and less-frequent training sessions (2 × 2 h sessions per week) compared to professional players. Although we measured individual exposure, no measures of training load (duration ×Rate of Perceived Exertion) were made, and no adjustments were made for athletes that missed exposure time due to injury in our analysis, which may have provided some insights into injury risk in this population.
No internal reliability study was conducted prior to FMS testing; therefore, we cannot comment on the inter rater reliability of our FMS testing, however, the FMS has previously been shown to be have acceptable reliability when conducted in real time among testers with variable experience in adolescent rugby league players.35,36 We did not include previous history of musculoskeletal injury as a confounding variable in our analysis despite previous history of injury being a risk factor for future injury in rugby league players 14 as it is not currently well established how previous injury effects FMS score.40,48,49
It is possible that FMS scores may have changed during the season although there is currently no consensus whether FMS scores change in response to training program, 50 and there is no research on this topic in adolescent athletes. As we did not conduct follow-up FMS testing, we are unable to determine whether the FMS scores changed throughout the season or in the lead up to a player sustaining an injury in this cohort. If FMS was repeated periodically throughout the season, this may have shown a temporal relationship to injury, whereby changes in player’s flexibility, stability, and strength proceeded an injury occurring.
Although all training and playing exposure data were collected on an individual basis for the entire training squad, the researchers acknowledge that the number of athletes participating in the study and the level of individual exposure time over a single season of play (which for this level of rugby is short in duration) may not have been large enough to reflect how FMS score effects an athletes risk of sustaining a non-contact injury. Our power analysis was based on the assumption of an equal number of injured and non-injured players, as previous studies have shown that up to half of junior rugby league players can sustain an injury within a season. 4 Non-contact injuries with > 1 week time loss that do not occur as frequently as contact injuries, so for this category, our study did not meet this assumption. The non-contact time-loss injury definitions used in this study have likely limited the number of injuries available for inclusion in some of the regression analyses, as non-contact injuries have now been shown to have a lower incidence than contact injuries in junior rugby league players.2–5 To overcome this limitation and to ensure enough injury data is captured for analysis, future studies may consider including several teams or following teams over several seasons.
In acknowledging these limitations, it is important to note this study was conducted within the context of a competitive team sport environment. Therefore, we were limited in regard to the number of participants enrolled in the study, time to conduct FMS testing, and opportunities to conduct follow up FMS testing. While the authors acknowledge the limitations of these study conditions, we believe that our research reflects the way the FMS was intended to be used in practice, which is what we wanted to investigate.
While the purpose of the FMS is to identify limitations of fundamental movement patterns, the FMS does not satisfy the key properties of screening tests outlined by Lars et al. (2017) and Bahr (2016)51,52 in that there is currently not a strong relationship between risk factors for injury in elite adolescent rugby league and the FMS test, and the FMS uses a continuous scale without a clear cut off between those at risk and those that are not. Bahr (2016) has discussed the issues related to screening to predict musculoskeletal injuries concluding that there is currently no screening tool able to predict musculoskeletal injury. While the rational for the FMS is plausible, it does not effectively simulate the positions, speeds, and physical demands of rugby league training and competition and therefore is unlikely to be related to meaningful injury risk factors in this population. In order to improve the pre-participation screening standards of elite adolescent rugby league players moving forward, future studies should first look to identify a strong association between a risk factor and injury before seeking to validate specific screening tools such as the FMS.
Conclusion
This study investigated the relationships between FMS scores and non-contact injury risk in elite adolescent rugby league players over the course of a competitive season. This was the first study to examine the use of the FMS in an adolescent rugby league population and the first study of the FMS to account for exposure time. We found no association between FMS score and non-contact injury risk. Future research should consider designing population-specific screening tools that incorporate known risk factors for injury, while monitoring athlete exposure to maximize the predictive ability of rugby league pre-participation screening methods.
Footnotes
Acknowledgements
The authors of this study would like to thank the Newcastle Knights Rugby League Club for the provision of data for this study.
Declaration of conflicting interests
The author(s) declared no potential conflicts of interest with respect to the research, authorship and/or publication of this article.
Funding
The author(s) received no financial support for the research, authorship and/or publication of this article.