



Abstract
This study investigated the return to baseline of movement velocity and maximal strength following a strength-orientated session and power-orientated session in the free-weight back-squat performed with maximal concentric velocity. Fourteen strength-trained males completed a strength-orientated session (five sets of five repetitions @80% of a one-repetition maximum) and a power-orientated session (three sets of six repetitions @50% one-repetition maximum ) in a randomised order over two weeks (e.g. strength week 1, power week 2). The back-squat was then performed with loads of 20%, 40%, 60%, 80%, 90% and 100% one-repetition maximum at 24, 48, 72 and 96 h following the strength and power exercise sessions to assess return to baseline of squat velocity and maximal strength. Dependent variables included one-repetition maximum, back-squat mean velocity and peak velocity and countermovement jump peak velocity. Meaningful changes ((effect size) ≥ −0.60) were reported for mean velocity and peak velocity at loads ≥ 60% one-repetition maximum at 24 and 48 h after the strength-orientated session. Trivial to small (effect size ≤ −0.59) differences were reported for squat velocities following the power-orientated session. Only trivial to small effect size differences were observed for countermovement jump peak velocity and one-repetition maximum at all time points following both sessions. Squat velocity (mean velocity and peak velocity) across the load–velocity profile had recovered at 72 h following the strength-orientated session. However, the return to baseline of squat velocity (mean velocity and peak velocity) did not coincide with the return to baseline of one-repetition maximum or countermovement jump peak velocity. Therefore, measuring and monitoring meaningful changes in velocity may be a more valid and practical alternative in determining full recovery and readiness to train.
Keywords
Introduction
Resistance training is a common form of exercise implemented in clinical and athletic environments to improve muscle size, strength and power. 1 Training for specific outcomes is often prescribed by coaches manipulating training volume, load and frequency. 2 To allow the prescription of training loads, one-repetition maximum (1RM) assessments are often performed to determine individual submaximal loads. Importantly, coaches should monitor athlete training to prevent injuries, to facilitate optimal recovery and to assess training targets. 3
1RM assessments are used as a testing measure to periodically track maximal strength changes. 4 Additional strength assessments such as isometric assessments, countermovement jumps (CMJs) and subjective physical exertion scales are also used to monitor athlete resistance training performance.5–7 However, these assessments present certain limitations and cannot be accurately used to prescribe training volume and loads to accommodate for daily fluctuations in performance. For example, 1RM assessments are time consuming particularly when measured for large groups. 4 Coaches would be reluctant to use a 1RM especially if it was to be performed for every exercise in a training programme.
Recent progress in the research of velocity-based training (VBT) has identified useful benefits for the monitoring of resistance training using movement velocity. As such, measuring the velocity of an exercise can ensure athletes are lifting with maximal concentric effort to greatly improve strength and power adaptations compared to subjective athlete effort. 8 Furthermore, decreases in movement velocity are related to physiological markers of fatigue, which may suggest VBT can determine an individual’s daily readiness to train. 9 To determine appropriate training velocities or the effect of fatigue on an individual, it is first important to measure baseline velocity values. Baseline values are established using load–velocity profiles (LVPs) which determine individualised velocities for specific relative loads.10–12
The relationship between load and velocity is vital in understanding the influence of fatigue during VBT. Importantly, when maximal effort is given for the concentric phase of an exercise, an inverse linear relationship exists between movement velocity and load. 13 Studies have also reported that when an athlete begins to fatigue within a training set, their movement velocity declines, 9,14 suggesting that concentric muscular force production declines as fatigue ensues. Furthermore, it has recently been shown that movement velocity at submaximal loads is reliable between exercise sessions if an individual is in a non-fatigued state. 10 Consequently, if an athlete’s movement velocity is slower than their baseline LVP, their training load could be adjusted to avoid prolonged fatigue, which cannot be applied using 1RM assessments.
Despite numerous studies that have researched VBT, much of the research has been based on individuals in non-fatigued states.10,15,16 Currently, there is a lack of research explicitly investigating the effect on movement velocity following varied resistance exercise sessions. The primary aim of this study was to quantify the time-course changes in movement velocity following a strength-orientated resistance exercise session and power-orientated resistance exercise session for the back-squat exercise. Secondly, the study aimed to determine the rate in which maximal strength returns following the strength-orientated and power-orientated resistance exercise sessions performed in a randomised order. Exploring this aspect of exercise may provide coaches with an accurate method for adjusting training loads to enhance recovery and ensure desired adaptations are being targeted.
Materials and methods
Participants and experimental protocol
Fifteen (n = 15) strength-trained male participants were recruited for this study (24.1 ± 5.2 years, 78.9 ± 8.2 kg, resistance training experience 4.6 ± 3.3 years). Inclusion criteria consisted of participants being able to perform the back-squat exercise with at least 1.5 times their body weight (1RM to body mass ratio = 1.7 ± 0.2), currently completing at least two strength-based resistance training sessions per week for the last 3 months, have had a minimum of 6 months resistance training experience and no current musculoskeletal injuries. Ethics approval was obtained from the University Human Research Ethics Committee.
A repeated-measures crossover study design was used to investigate the time-course changes in movement velocity from a 1RM baseline of the back-squat as well as the rate of maximal strength return following a strength-orientated resistance exercise session and power-orientated resistance exercise session given in a randomised order. Mean velocity (MV) and peak velocity (PV) (m/s) and relative load (% of 1RM) were collected following 1RM baseline assessment at time points 24, 48, 72 and 96 h. Participants attended the laboratory on 13 occasions during a three-week period and the participants performed all their sessions at the same time of day. They were instructed not to perform additional exercise during this period. The initial session familiarised the participants with the desired squatting technique and exercise protocols. The second session involved the completion of a baseline 1RM assessment to quantify maximal strength so that accurate relative loads could be prescribed throughout the rest of the study. The third session was used to develop the individual’s LVP which established their individualised baseline velocities.
In a randomised crossover design, participants then completed either a strength-orientated session (five sets of five repetitions at 80% 1RM) or a power-orientated session (six sets of three repetitions at 50% 1RM), with the corresponding session being completed seven days later. Upon completion from either session, a series of 1RM assessments (which included the LVP) were measured at time points 24, 48, 72 and 96 h. This was done to determine the rate at which an individual’s maximal strength and velocity returned to baseline. Thus, both maximal strength (1RM) and movement velocity (MV and PV) were assessed during this time. In addition to the 1RM assessments, three sets of one repetition of the barbell (20 kg) CMJ exercise were completed immediately after the warm-up for every session. 17 This was done as an additional measure to monitor the return to baseline of PV in the CMJ. For the CMJs, participants were instructed to jump for maximal height and provide maximal concentric effort. They were given 1 min passive recovery between sets and the CMJ with the fastest PV was selected for further analysis. Finally, ratings of perceived exertion (RPE) scores were taken 5 min following the strength- and power-orientated sessions. 18 Participants were asked to verbally state the difficulty of the session according to Borgs 10-point RPE scale (rest 1 – maximal 10). 19
1RM back-squat testing
Prior to all 1RM sessions, participants completed a standardised warm-up procedure. Each 1RM assessment required the participant to complete five warm-up sets comprising of five repetitions at 20%, three repetitions at 40% and 60% followed by a single repetition at both 80% and 90%. 10 Throughout each repetition, it was asked that the eccentric (downward) phase was performed at low speed with the athlete in full control of the descent, while the concentric (upward) phase was completed as fast as possible. The eccentric phase was completed when the thighs were parallel with the floor, then the concentric phase could commence. A linear position transducer (LPT) (GymAware Powertool; Kinetic Performance Technology, Canberra, Australia) was used to assess for consistent squat depth and the trained eye of the chief investigator assessed squat technique and depth for all repetitions. Verbal cues were provided expressing when the eccentric phase concluded, and participants could begin the up phase of the squat. 20 Upon completion of the warm-up, the current load (90%) was increased by approximately 5% and a single repetition was completed. 21 The weight was continually increased at this rate after each successful lift until the participant could no longer complete a full repetition. The individuals’ 1RM was determined by the heaviest successful repetition, and attempts ceased once no further weight could be lifted with the above instructions. Participants were allowed 2 min of passive recovery between warm-up sets and 3 min for 1RM attempts. A maximum of five 1RM attempts were granted to ensure the test was attempted to failure.
LVP session
Twenty four hours following session 2 (initial baseline 1RM assessment), participants performed an individualised LVP. This required participants to complete five sets of the back-squat exercise at loads of 20% (five repetitions), 40% (three repetitions) and 60% (three repetitions) 1RM, followed by 80% and 90% 1RM for a single repetition. Participants were instructed to perform the concentric phase of the lift with maximal intent to ensure the highest attainable velocity was achieved for each load. Banyard et al. 22 established that movement velocities at relative intensities between 20% and 90% 1RM are reliable for the free-weight back-squat and recommend that these relative intensities should be included in the development of the LVP. The LPT was used to measure MV and PV for all repetitions, sampling at 50 Hz. In addition, the LPT was magnetically fixed to the floor directly below the barbells position during the squatting movement, and the device’s retractable cord was positioned on the inside of the barbell collar. Data were transmitted via Bluetooth to an i-Pad (Apple, USA) utilising the GymAware software (V.2.5).
Data analysis
For sets that included more than one repetition, the repetition with the fastest MV was used for the LVP. From these data, a scatter plot figure was constructed in Microsoft Excel (2016) with the relative load placed on the x-axis and the velocity on the y-axis. A linear line of best fit was then applied, and a linear regression equation was calculated. This provided each participant with a baseline individualised LVP. The same analysis was completed for PV. Baseline maximal strength (1RM) collected during the baseline 1RM session was compared to maximal strength at time points 24, 48, 72 and 96 h following the strength or power sessions. As mentioned previously, the CMJ was completed following the warm-up but prior to each testing session. The baseline CMJ data were collected prior to the strength- and power-orientated sessions.
Statistical analysis
Statistical analyses were undertaken using Statistical Package for Social Sciences software, version 22 (IBM Corporation, USA). Effect sizes (ESs) were reported for each relative load at baseline and each time point for all participants. This was performed for all MV, PV, CMJ and maximal strength (1RM) data. ESs (95% confidence intervals) were calculated using Cohen’s d, which was interpreted with values representing trivial (0.20), small (0.21–0.59), moderate (0.60–1.19), large (1.20–1.99) and very large (≥2.0). 23 Any data with at least moderate ES differences (≥0.60) were deemed meaningfully different to baseline data. All data were screened for normality, and any data points that were deemed as erroneous due to maximal intent not performed for a given lift were removed from the analysis.
Results
The mean baseline 1RM of the participants was 132.5 ± 28.3 kg which resulted in a mean 1RM to body mass ratio of 1.70 ± 0.20. RPE scores for the strength- and power-orientated sessions were recorded as 7.5 ± 1.0 and 3.5 ± 1.0, respectively.
The MV and PV data collected across the relative load spectrum at time points from 24 to 96 h after the strength- and power-orientated sessions are reported in Tables 1 and 2. There were moderate reductions in MV and PV for loads of 60%, 80% and 90% 1RM at 24 and 48 h following the strength-orientated exercise session (Figure 1). However, only trivial to small differences in MV and PV were observed at all other relative loads and time points after both sessions (Tables 1 and 2). Figures 1 and 2 show the linear trend and the ES differences of the LVP (using MV and PV) at 24 and 48 h compared to baseline after the strength- and power-orientated sessions.
MV and PV with 95% CIs following the strength-orientated training session at time points baseline, 24 h, 48 h, 72 h and 96 h for relative loads of 20%, 40%, 60%, 80%, 90% 1RM and 1RM.
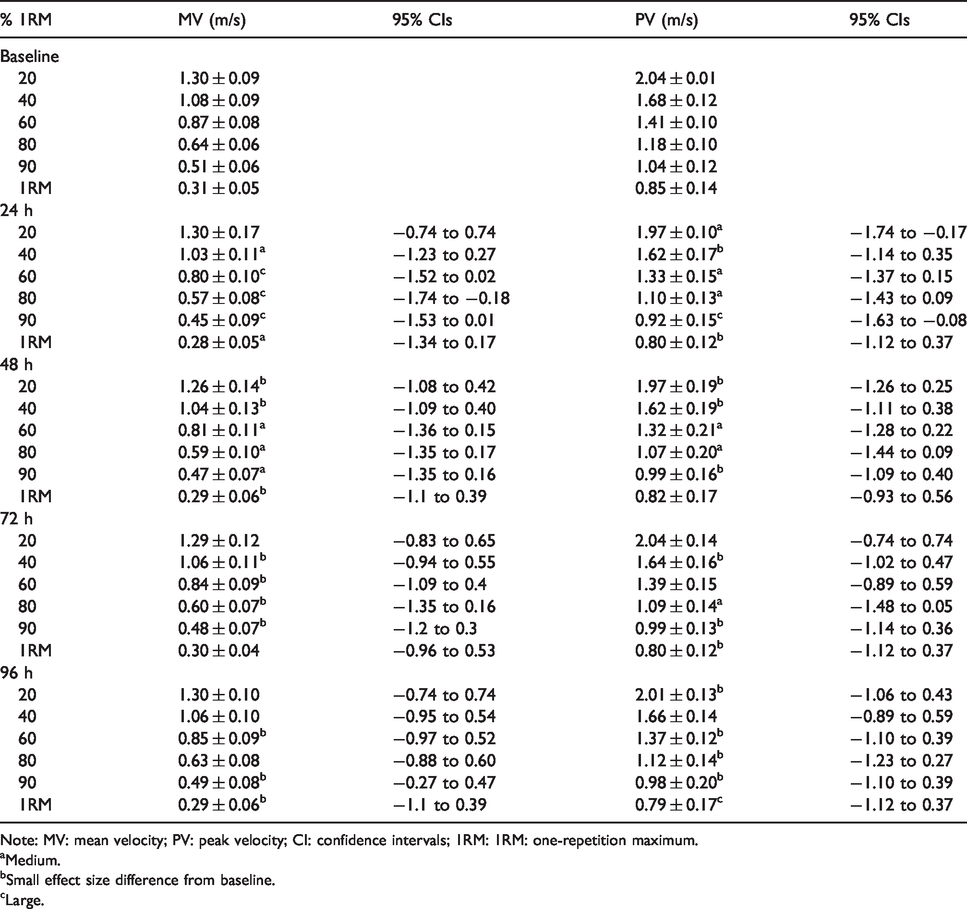
Note: MV: mean velocity; PV: peak velocity; CI: confidence intervals; 1RM: 1RM: one-repetition maximum.
aMedium.
bSmall effect size difference from baseline.
cLarge.
MV and PV with 95% CIs following the power-orientated training session at time points 24 h, 48 h, 72 h and 96 h for relative loads of 20%, 40%, 60%, 80%, 90% 1RM and 1RM.

Note: MV: mean velocity; PV: peak velocity; CI: confidence intervals; 1RM: 1RM: one-repetition maximum.
aMedium.
bSmall effect size difference from baseline.
cLarge.
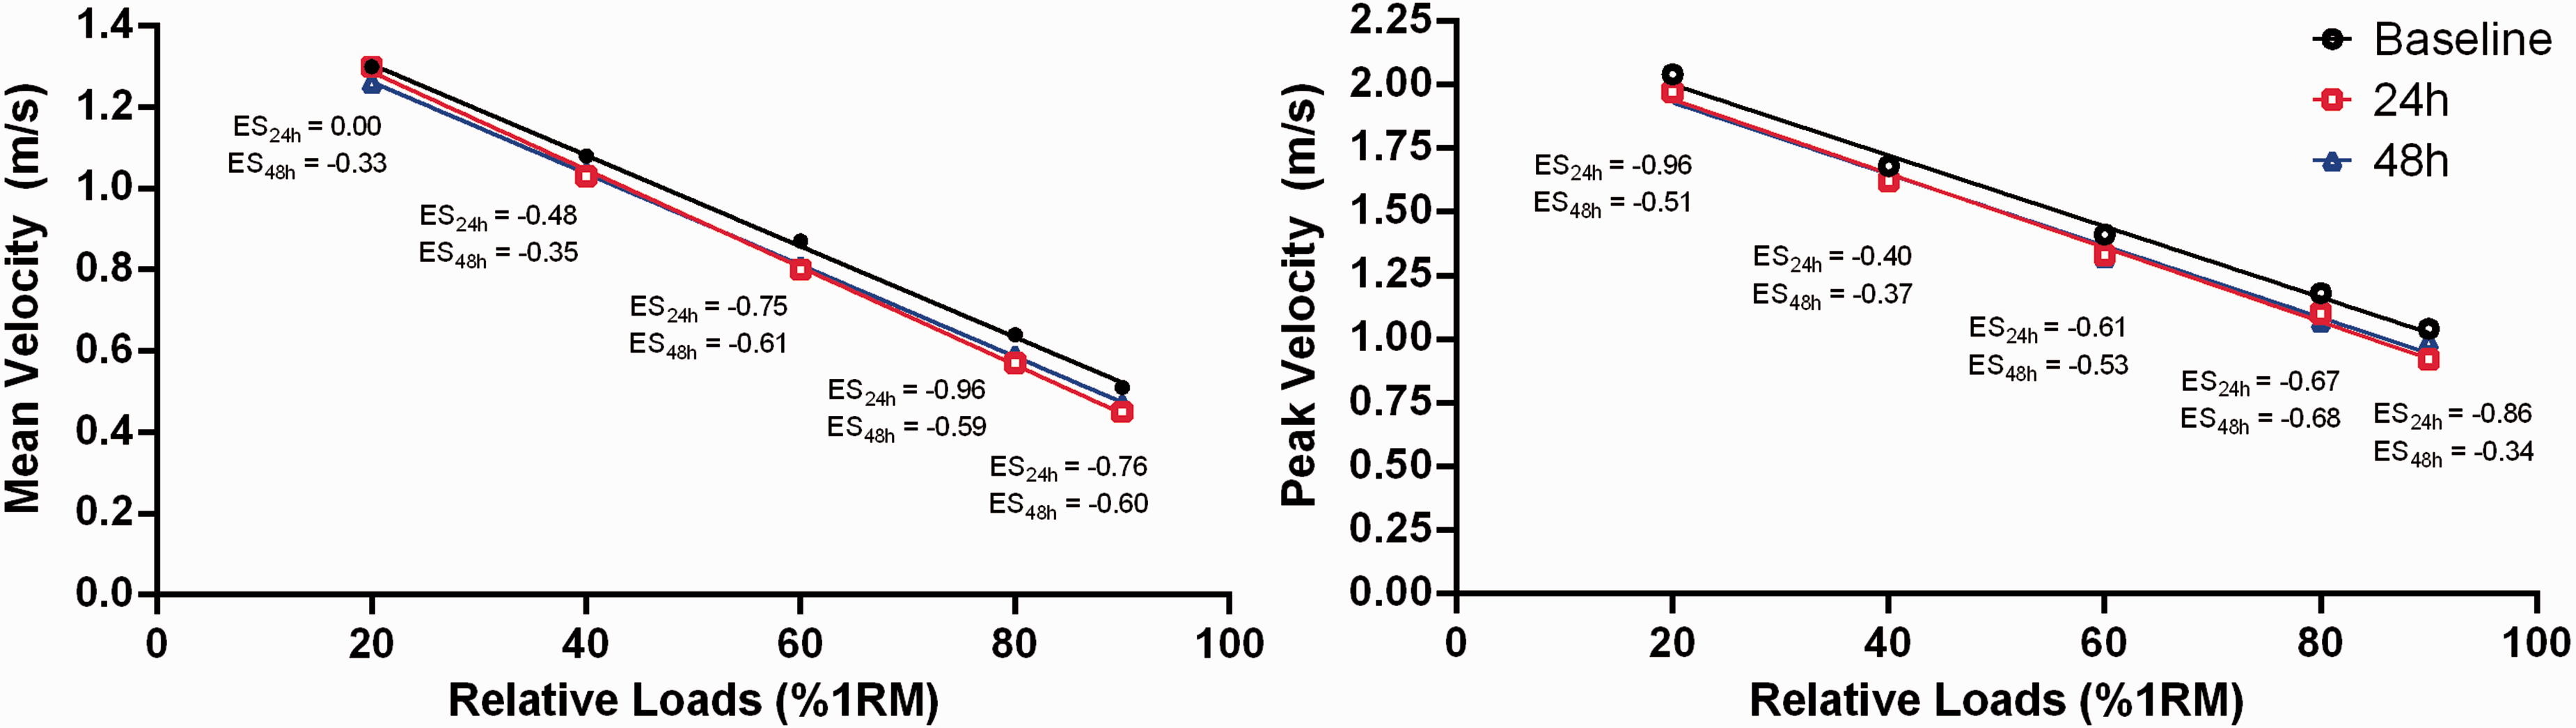
The load–velocity profiles of mean velocity and peak velocity compared at baseline, 24 and 48 h following the strength-orientated ES. Confidence intervals were set at 95%. ES: exercise session; 1RM: one-repetition maximum.

The load–velocity profiles of mean velocity and peak velocity compared at baseline, 24 and 48 h following the power-orientated ES. Confidence intervals were set at 95%. ES: exercise session; 1RM: one-repetition maximum.
Figure 3 reports the percentage change in 1RM at each time point from baseline. There were only trivial differences in 1RM at each time point following both the strength- and power-orientated sessions. Figure 4 reports the relative PV for the CMJ at 24, 48, 72 and 96 h compared to baseline data. Only small to trivial differences in the CMJ data were observed following both the strength- and power-orientated sessions.
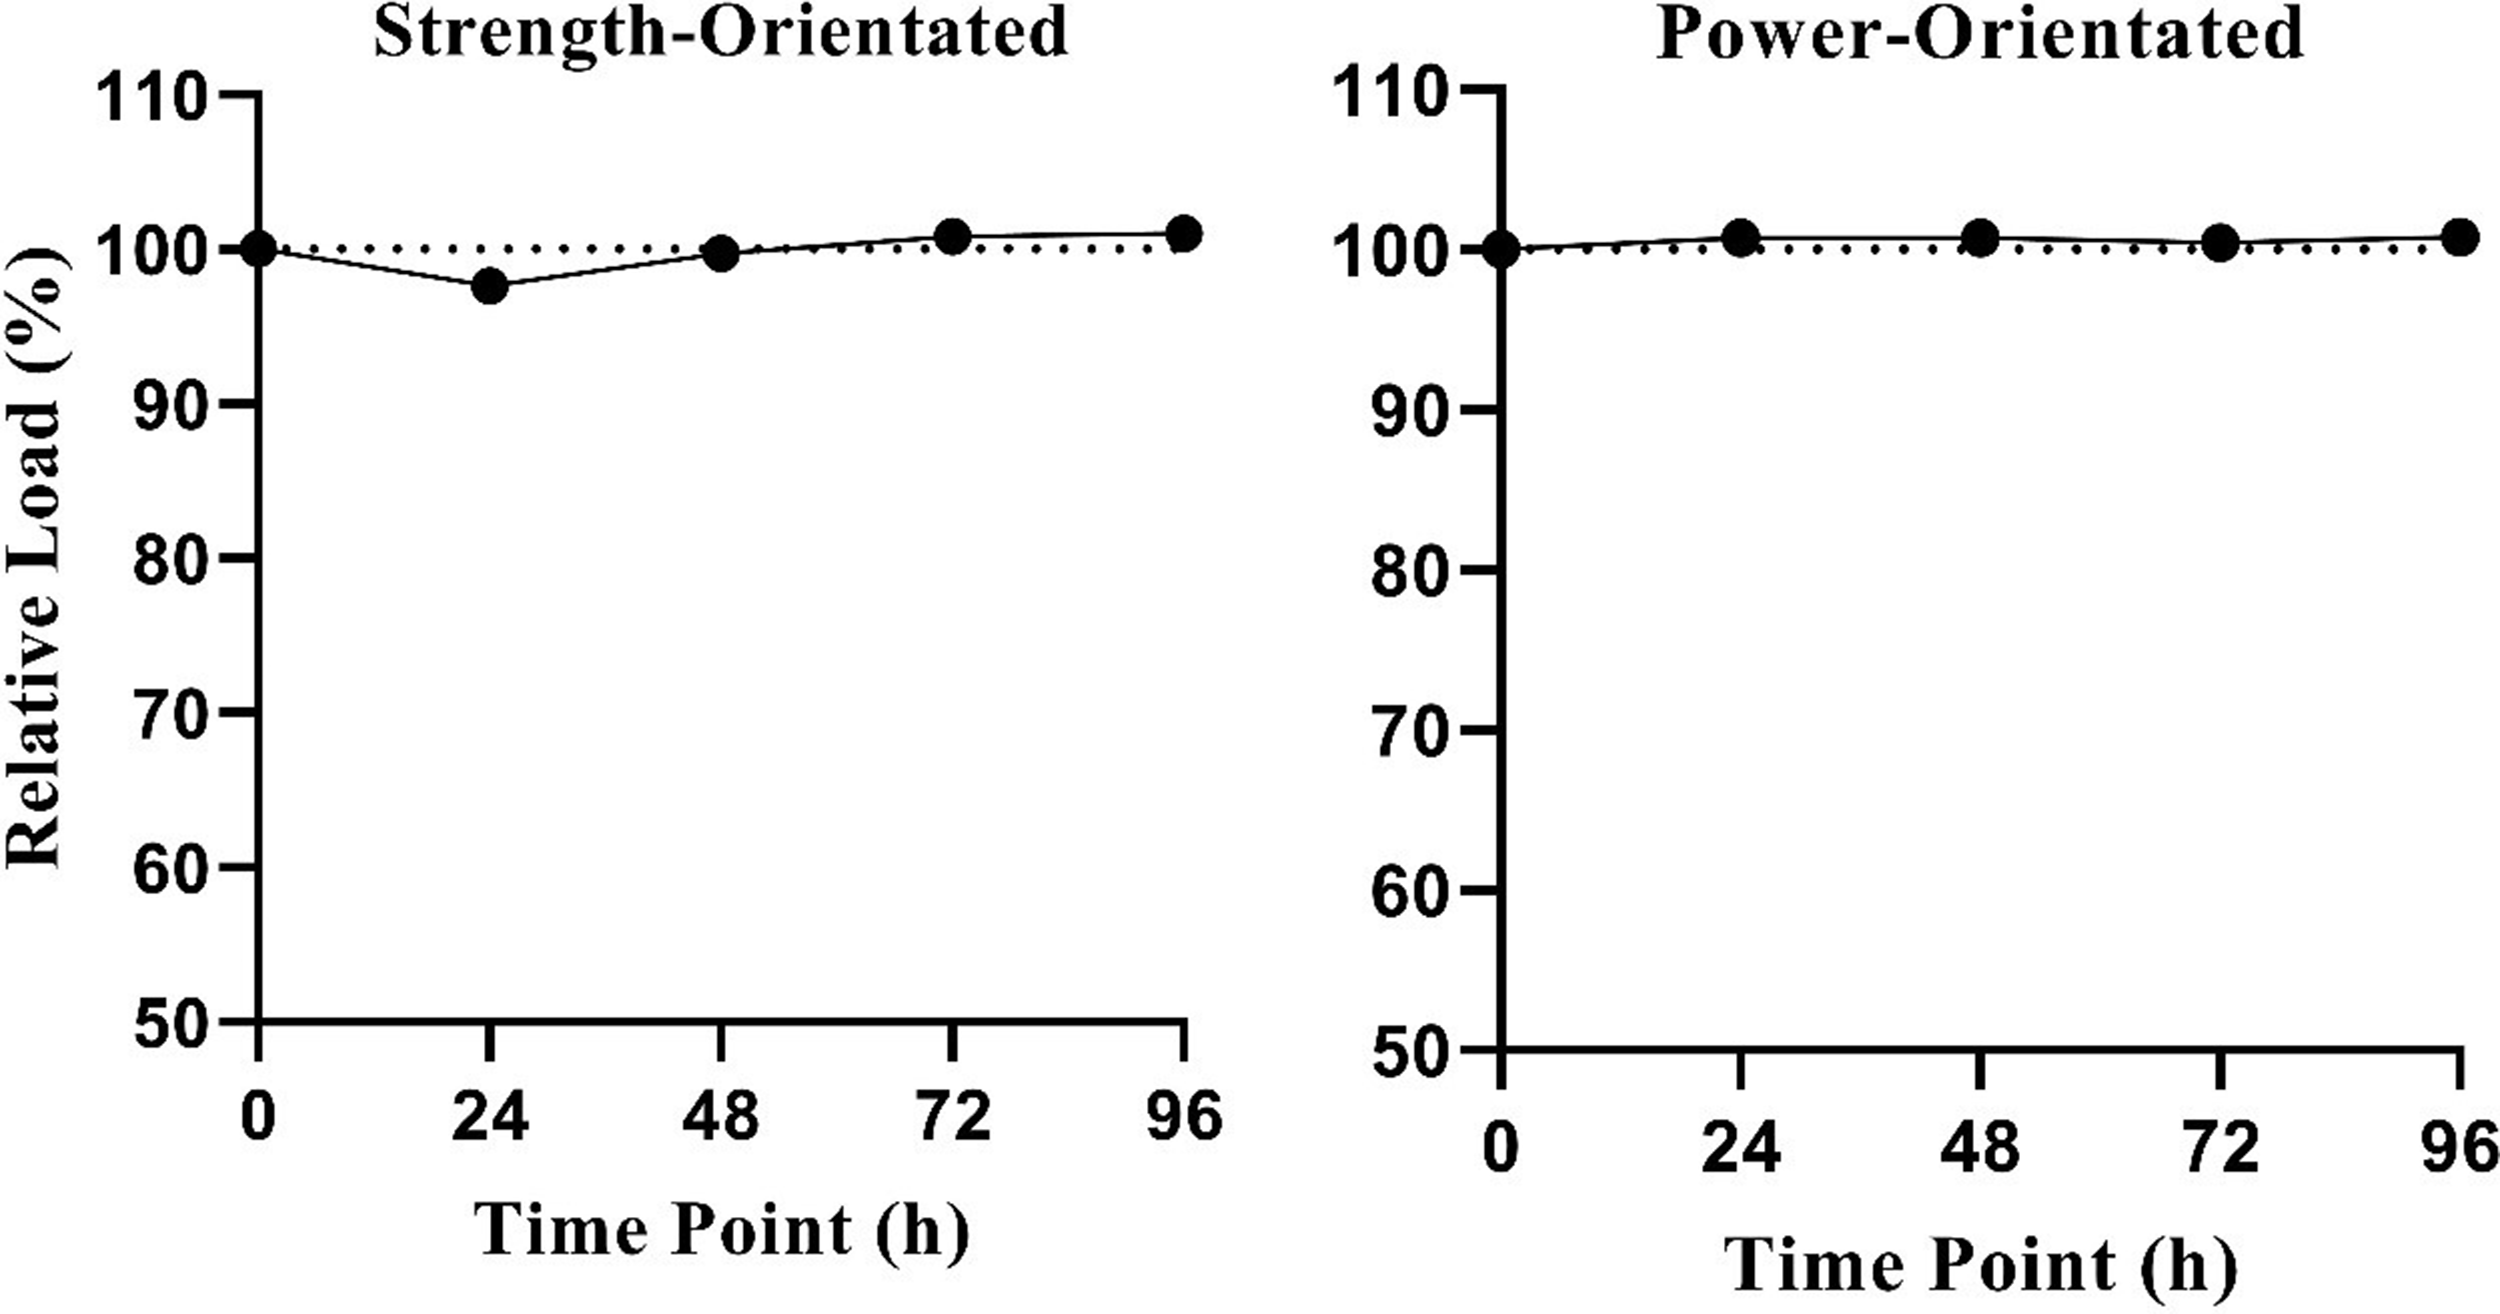
The return of relative 1RM from baseline to time points 24, 48, 72 and 96 h following the strength-orientated exercise session or power-orientated exercise session.
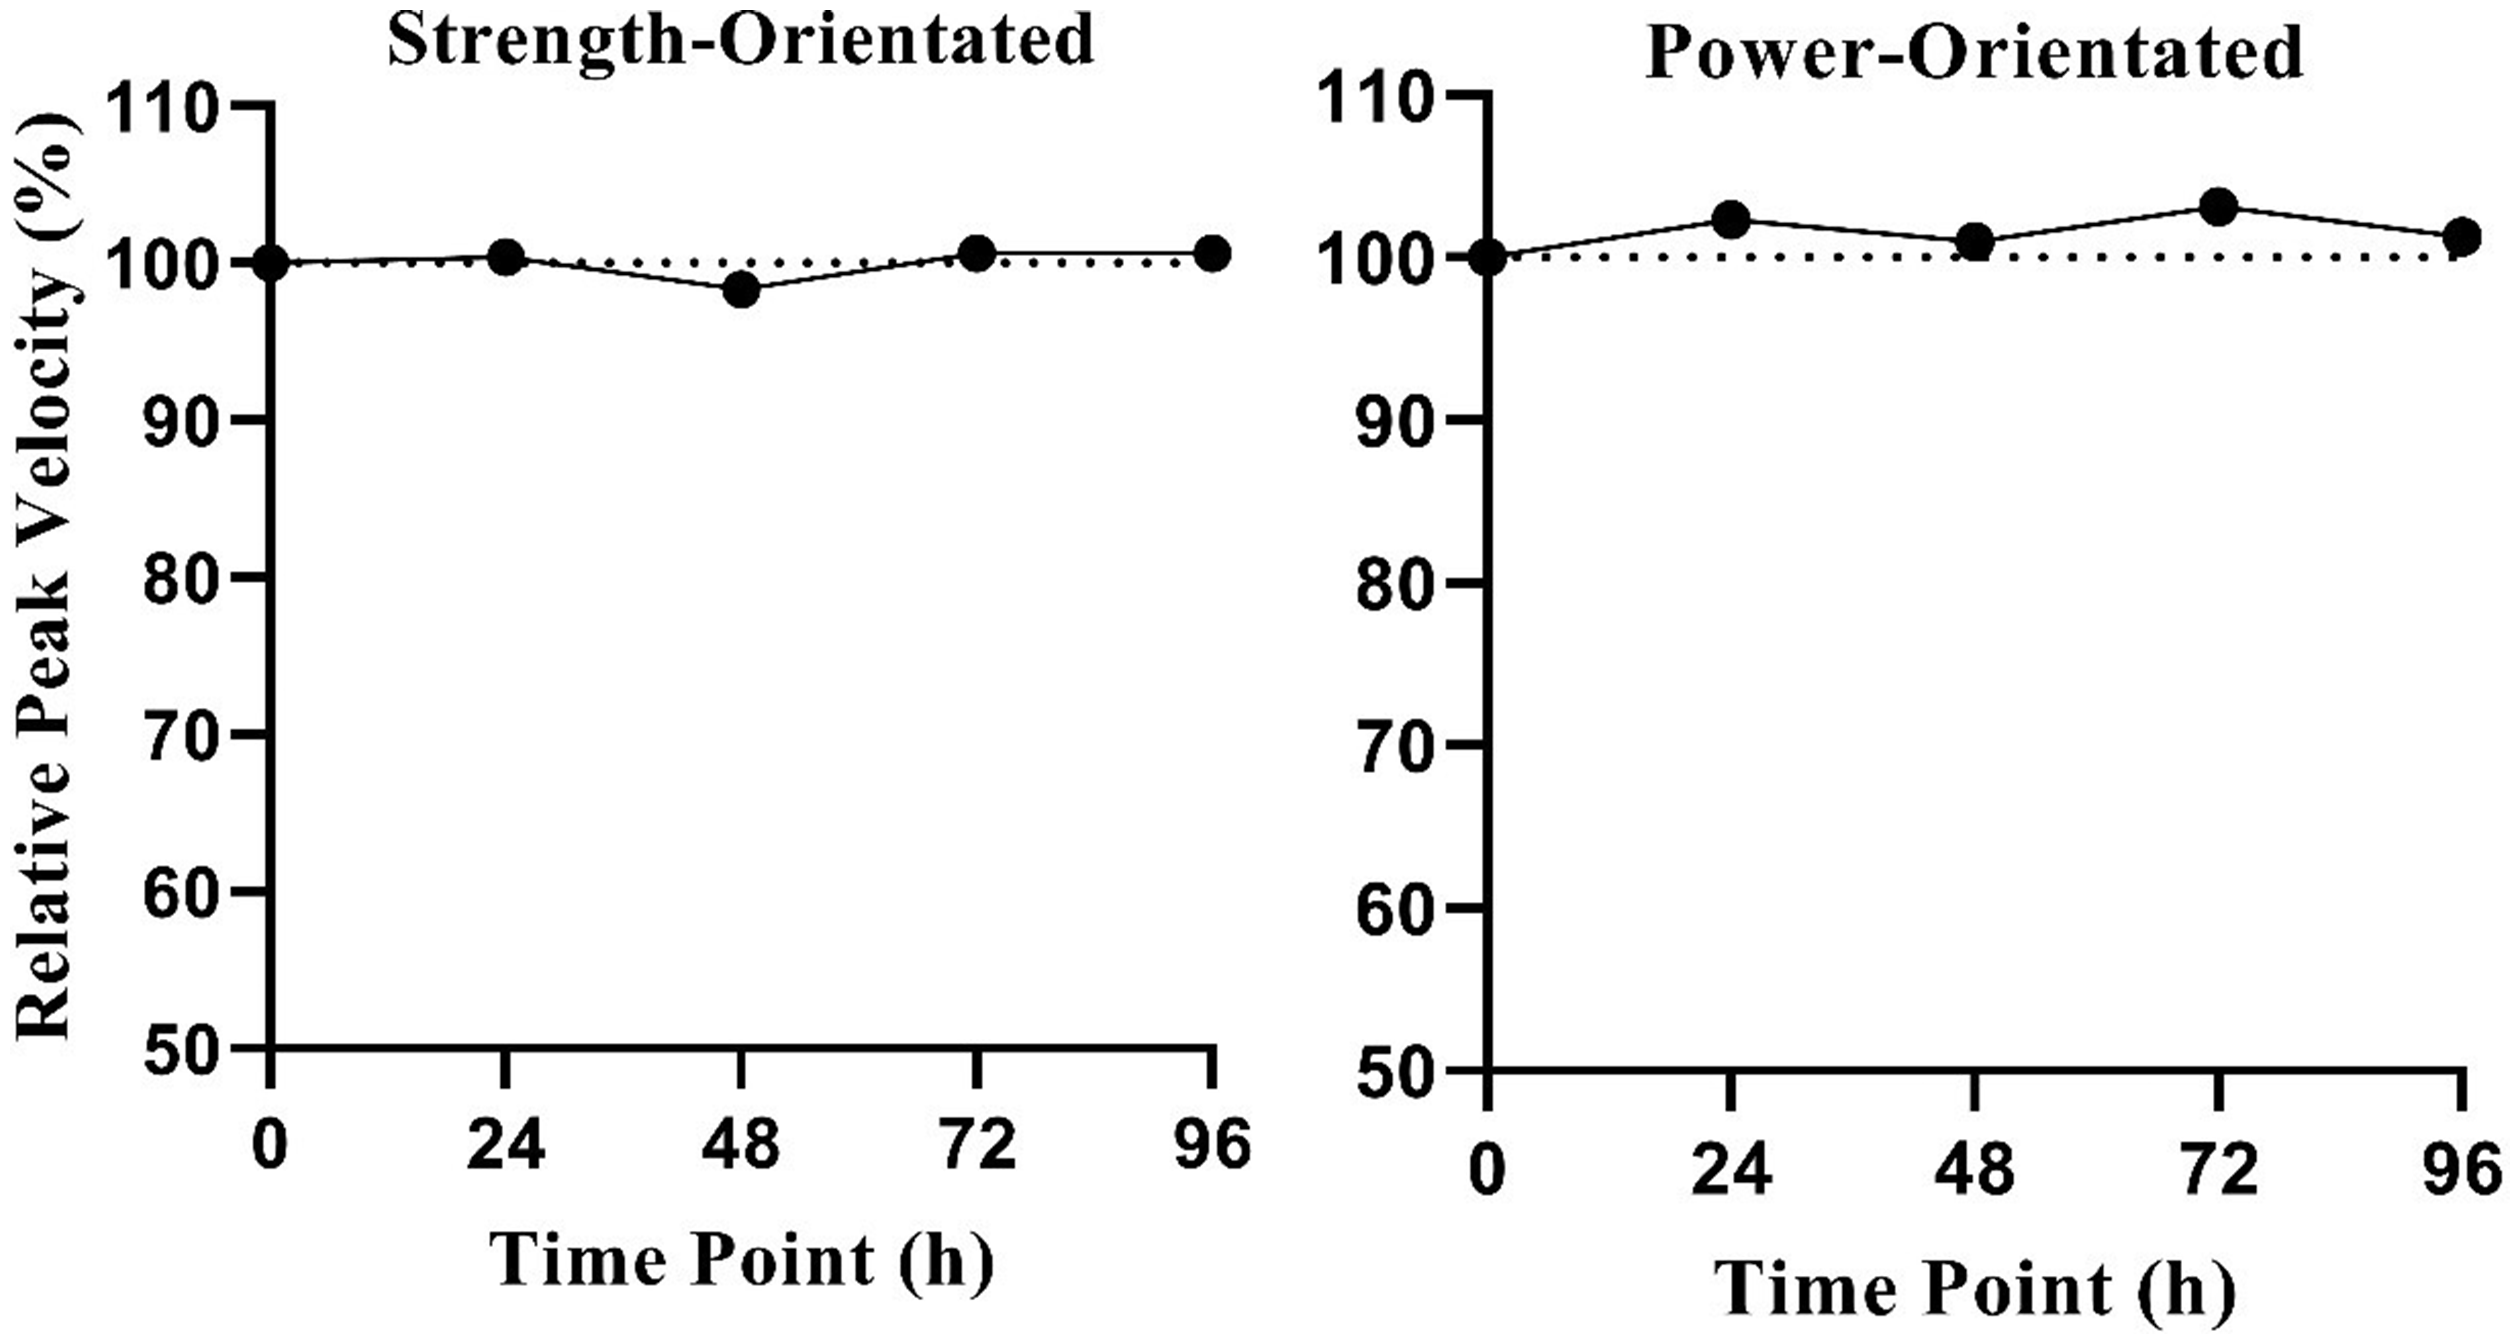
The return of relative peak velocity in the countermovement jump from baseline to time points 24, 48, 72 and 96 h following the strength-orientated exercise session or power-orientated exercise session.
Discussion
The purpose of this study was to quantify the time-course changes in velocity (20%, 40%, 60%, 80%, 90% 1RM and 1RM) and maximal strength at 24, 48, 72 and 96 h after a strength-orientated session and power-orientated session for the back-squat exercise. Moderate reductions in squat velocity (MV and PV) were observed for 60%, 80% and 90% 1RM loads at 24 and 48 h following the strength-orientated exercise session. However, only trivial to small changes in MV and PV were observed at any relative load or time points following the power-orientated session. Notably, there were only trivial differences 1RM at each time point following either the strength- or power-orientated sessions. In addition, there were only trivial to small differences in PV for the CMJ at any time points following either experimental exercise sessions. These findings suggest the assessment of squat velocity (MV or PV) in the days following a strength-orientated squat session may be a more insightful indicator of recovery status and readiness to train compared to maximal strength (1RM) or CMJ (PV) testing. Therefore, for athlete monitoring purposes, a strength coach could monitor and assess changes in velocity to make better informed decisions for prescribing appropriate session training loads.
Prior to this study, it was unknown the effect an acute strength-orientated session would have on the LVP in the days following exercise. The results in Figure 1 show the gradient of the LVP becomes steeper. Specifically, there is a greater magnitude of velocity decrease from baseline values as loads become heavier. For example, 24 h following the strength-orientated session, there were moderate decreases in squat velocity at relative loads ≥ 60% 1RM. Moderate decreases in velocity were still present 48 h post-strength training, but the magnitude of velocity loss was not as pronounced. However, at 72 and 96 h following the strength-orientated session, there were no meaningful decreases in squat velocity (MV and PV) at any relative load. These findings suggest that participants’ neuromuscular systems had not fully recovered until 72 h following the heavy strength training session, even though maximal strength (1RM) and CMJ (PV) had fully recovered by 24 h. Previous research has established that a reduction in velocity for repetitions of a designated load strongly correlates with markers of neuromuscular fatigue. 9 Consequently, in this study, this may indicate that the 1RM and the CMJ assessment could not detect small and meaningful indicators of neuromuscular fatigue following a strength-orientated squat session.
Notably, velocity was reduced with squatting loads ≥ 60% 1RM at 24 and 48 h after the strength-orientated session; however, there was no decrease in squat velocity at 20% or 40% 1RM. It could be speculated that the motor units primarily recruited for higher velocity/lighter load movements (≤40% 1RM) had fully recovered and were not fatigued from the experimental strength session. The full recovery of velocity to baseline values is critically important, since it is known that training with velocities as close to the maximal attainable velocity for a given load (from the LVP) will increase the neuromuscular stimuli to maximise strength adaptations compared to training with less than optimal velocities. 13 Therefore, our findings suggest that training for maximal strength (≥60% 1RM) within 48 h of completing a strength-orientated session could reduce desired training adaptations and delay recovery. However, since there were no meaningful changes in MV and PV (≤40% 1RM) in the days following the strength session, this could allow a coach to prescribe a power exercise session with there being no ill effects in the corresponding training days.
Limitations of this project included previous studies utilising the CMJ assessment to measure fatigue and recovery through changes in PV, peak power and jump height.24,25 The CMJ was chosen as one of our criterion measures to determine whether a participant had recovered from the experimental exercise sessions in accordance with previous research. However, even though previous studies have utilised the CMJ assessment to monitor recovery and return to play, the findings of this study suggest that the CMJ may not be sensitive enough to monitor neuromuscular fatigue and recovery following a strength-orientated squat session. In this study, we found no change in PV for the CMJ at any time point in the days following the strength and power sessions. This may have been because the training stimulus did not elicit enough fatigue even though the exercise session was rated as very hard from the RPE scores. Furthermore, the CMJ is an impulsive movement that was performed with low load and high velocities which did not present a decrease in PV, which is in accordance with the lack of velocity decrease with squat loads ≤40% 1RM. In addition, future research should focus on determining the magnitude of velocity reductions in a strength-orientated session when multiple exercises are performed.
The outcomes of this study may be used by coaches to determine and guide the timing and implementation of strength and power training sessions, respectively. Since back-squat velocity does not return to baseline until 72 hrs following a strength training session, it may be beneficial for a coach to avoid prescribing additional lower body strength and power training prior to this time. This will allow individuals to perform their next session in a non-fatigued state so that desired training adaptations can be effectively targeted. Alternatively, following a typical power-orientated session, baseline movement velocity could be replicated within 24 h of completing the session. Therefore, power training could be performed in subsequent days or in conjunction with strength-orientated exercise as movement velocity was not affected at the lower relative loads for this type of training. Furthermore, monitoring velocity fluctuations from an individual’s LVP during strength training may present an alternative to other strength measures such as maximal strength and CMJ which were all proven to not diminish following resistance exercise.
Footnotes
Declaration of conflicting interests
The author(s) declared no potential conflicts of interest with respect to the research, authorship, and/or publication of this article.
Funding
The author(s) received no financial support for the research, authorship, and/or publication of this article.
