



Abstract
The agile footwork is a basic but important skill, how to efficiently grasp and improve its performance has always interested coaches and athletes, beginners particularly. The purpose of this study was to investigate the differences in kinetics and kinematics of the cross step between professional athletes and novice athletes using the Oxford foot model. Twenty-two male participants (professional athletes, 11; novice athletes, 11) with dominant right feet participated in the table tennis cross step test. A Vicon motion analysis system and a Novel Pedar insole plantar pressure measurement system were used to record kinematic and kinetic data, respectively. Professional athletes showed significantly smaller forefoot plantarflexion and abduction, but larger hallux dorsiflexion at the cross step ending. In addition, they also showed significantly larger forefoot dorsiflexion and adduction but smaller forefoot eversion as well as rearfoot inversion than novice athletes at the forward-end of the step. In the entire motion, professional athletes performed significantly smaller joints range of motion, especially the hindfoot with respect to tibia angles. Concerning plantar relative load, professional athletes were significantly greater than that of novice athletes in the other toes, lateral forefoot and rear foot. Professional athletes possessed higher footwork agility and greater foot motor technique. The findings on the internal mechanisms of the cross step could help coaches and novice athletes understand the mechanical efficiencies in stroke finishing leading to improvements in performance.
Introduction
The benefits of table tennis as an effective means of entertainment, health care and recovery have attracted more and more people worldwide. 1 , 2 As a low-cost sport, table tennis can be performed indoors or outdoors. Furthermore, it has become an important part of physical activity and entertainment in the community and university. 3 Some studies have summarized the potential health benefits of table tennis, such as the improvement in physical function/performance, reduction in mental stress and incidence of myopia in elderly men and young adults. 4 , 5 Table tennis is one of the most popular racket sports requiring the ability of agile steps, strokes speed, body balance, aerobic stamina and sophisticated motor coordination simultaneously. 6 Majority of conventional studies have investigated table tennis from a psychological perspective,7–9 training strategy perspective, 3 , 6 , 10 , 11 and physiological perspective.12–14 However, less studies have developed internal mechanism databases using biomechanical methodologies to compare the performance of table tennis athletes at different levels of expertise.
Table tennis is an intermittent sport that requires its players to change their positions swiftly to enable them complete strokes with a variety of complex footwork in matches and training sessions. 15 Table tennis footwork is a lower-limb fundamental skill, that has a direct relationship with upper-limb performance based on the principle of the “kinetic chain,” 16 which also has an influence on the accurate control of racket movements. 17 , 18 Table tennis cross step—the foot closing to the incoming ball as a support, regulating its tiptoe points to the direction of movement, then following the other foot strides out to the same direction—is frequently executed to counterattack the ball coming from a longer distance. 19 The biomechanical comparison of cross step patterns between the professional athletes (PA) and novice athletes (NA) would be a valuable tool in understanding the internal mechanisms involved in mastering cross step and identifying the key factors underlying effective performance.
In terms of kinetic energy, the biomechanics of lower limbs determine the level of swing performance through the kinematic chain pathway. 20 , 21 In recent years, some research studies have investigated the kinematic and kinetic characteristics of table tennis utilizing generic musculoskeletal models, comparing the differences between standing and squat serves in female table tennis athletes, 18 the effects of performance between the long and short chasse steps with table tennis forehand topspin strokes, 22 joint and plantar loading during cross-court topspin forehands with the footwork of cross step, one step and side step, 19 and comparison about lower-limb kinematics performing two different kind of forehand top spin: long-line and cross-court. 23 However, a reliable multi-segment musculoskeletal model of the foot was developed, which meets the researchers’ demands to provide an in-depth investigation of the internal mechanisms of the feet. 24 , 25 The Oxford foot model (OFM) divides the foot into three parts namely the forefoot, hind foot and hallux. This OFM also permits the analysis of inter-segmental motions of each other.24–26 Additionally, this model has been widely applied to the fields of sports 27 , 28 and clinical medicine 24 , 26 among different populations to evaluate their movement patterns. Based on the comparison in the forefoot with respect to hindfoot angles, hindfoot with respect to tibia angles and hallux with respect to forefoot angles between PA and NA during the cross-step movement patterns, the OFM could offer some clarity in understanding the internal mechanisms responsible for foot segmental movement using a visual three-dimensional (V3D) system.
Further to this, table tennis players have to perform various footwork to hit back the ball, requiring the support from the lower limbs to provide accuracy and stability. Therefore, the biomechanical characteristics of “foot (shoe)-ground” must be taken into account. Novel Pedal insole plantar pressure measurement system can provide additional information and has been successfully used to study the different motion patterns in sports, assessing the dynamic posture control between the male and female table tennis athletes during multi-ball training, 29 the two types of tennis serve 30 and the trajectories of the center of pressure during table tennis topspin forehand loop in different skill levels of players. 31
In light of the above, with the rapid development and the increasing popularity of table tennis, it is of great importance to investigate the footwork of table tennis from the biomechanical perspective by using a reliable multi-segment musculoskeletal model and considering the “foot (shoe)-ground” interaction. Therefore, the purpose of this study was to investigate the biomechanical characteristics of the cross step between PA and NA. This information would help the coaches and players to understand internal mechanisms and enhance the performance characteristics. Based on the previous studies, 19 , 22 , 32 it can be hypothesized that (a) both PA and NA would show different plantar foot joint angles in the three motion planes at the key technical events, respectively and (b) PA would perform smaller joint range of motion (ROM) and faster joint angular changing rate during the cross step. In addition, compared with NA, it was also hypothesized that PA would exhibit distinct plantar peak pressure and relative load at the forward and swing phases.
Method
Participants
Twenty-two participants were recruited into this study. Eleven male PA from Ningbo University table tennis team volunteered to participate in the study. PA were the National Division I players (age: 21.6 ± 0.4 years; body mass: 63.7 ± 4.2 kg; height: 173.5 ± 1.7 cm; training experience: 14.2 ± 1.4 years). Eleven male NA (age: 20.8 ± 0.6 years; body mass: 62.4 ± 3.5 kg; height: 174.2 ± 1.4 cm; training experience: 0.4 ± 0.2 years) were also students of Ningbo University. All participants were right-handed and free from any previous lower limb injuries and surgery or foot diseases for at least 6 months. The handedness of players was established according to which hand was used to hold the racquet. 33 As far as the footedness preference activities in this study, the ball-kick test was employed. All participants were asked to kick a ball pass the pre-prepared obstacles with optional power and exact control, the foot used to kick the ball was defined as the dominant foot and the other side was the non-dominant foot. 34 All participants were dominant right foot based on the ball-kick test.
Participants provided their written informed consent before study, which was approved by the Human Ethics Committee of Ningbo University. No participant received any payment for this study.
Experimental setup
To obtain the lower-limb kinematic data, an eight-camera Vicon motion analysis system (Oxford Metrics Ltd, Oxford, UK) with a frequency of 200 Hz was used in this study. Participants were asked to wear the same tight-fitting pants and table tennis training shoes that contained Pedar insoles, and several holes were created on the surface of the shoes based on the OFM marker set so that reflective markers could be adhered directly on the dominant foot. The anatomical landmarks were used to defined the forefoot, rear-foot, and tibial segments: (1) The head and base of the first and the fifth metatarsal respectively, the proximal end of the distal phalanx of the 1st metatarsal and the base of the hallux. (2) The medial malleolus, superior heel, posterior calcaneus wand marker, sustentaculum tail, inferior heel, and lateral calcaneus. (3) The head of the fibula, tibial tuberosity, lateral shank, anterior aspect of the shin, and lateral malleolus. The three plantar foot joints were defined as right hindfoot with respect to tibia angles (RHFTBA), right forefoot with respect to hindfoot angles (RFFHFA), and right hallux with respect to forefoot angle (RHXFFA). 35 Kinetic data were recorded using the in-shoe plantar pressure measurement system (Novel GmbH, Munich, Germany) at 50 Hz. The plantar region was divided into nine anatomical parts: hallux (H), other toes (OT), medial forefoot (MF), central forefoot (CF), lateral forefoot (LF), medial mid-foot (MM), lateral rear-foot (LM), medial rear-foot (MR), and lateral rear-foot (LR). 31
Before the test, all participants were required to warm up for 15 min at Ningbo University table tennis training gymnasium. Then participants performed a multi-ball training regime for 10 min incorporated with the cross step. A robot machine (Double Fish Sport Goods Group Co., Guangzhou, China) for table tennis serving was distanced from the player’ court at 1.3 m. First, each participant was instructed to impact the ball back at the neutral position during the test (Figure 1(a) and (b)), then perform a single forehand loop using the cross-step movement with maximal power against a topspin ball coming from a serving machine at a 0.15 × 0.15 m area (Figure 1(c) to (e)). Prior to data collection, all participants had enough time to get familiar with the experimental environment. The test of kinematic and kinetic was conducted synchronously, and each participant at least successfully finished seven performances.
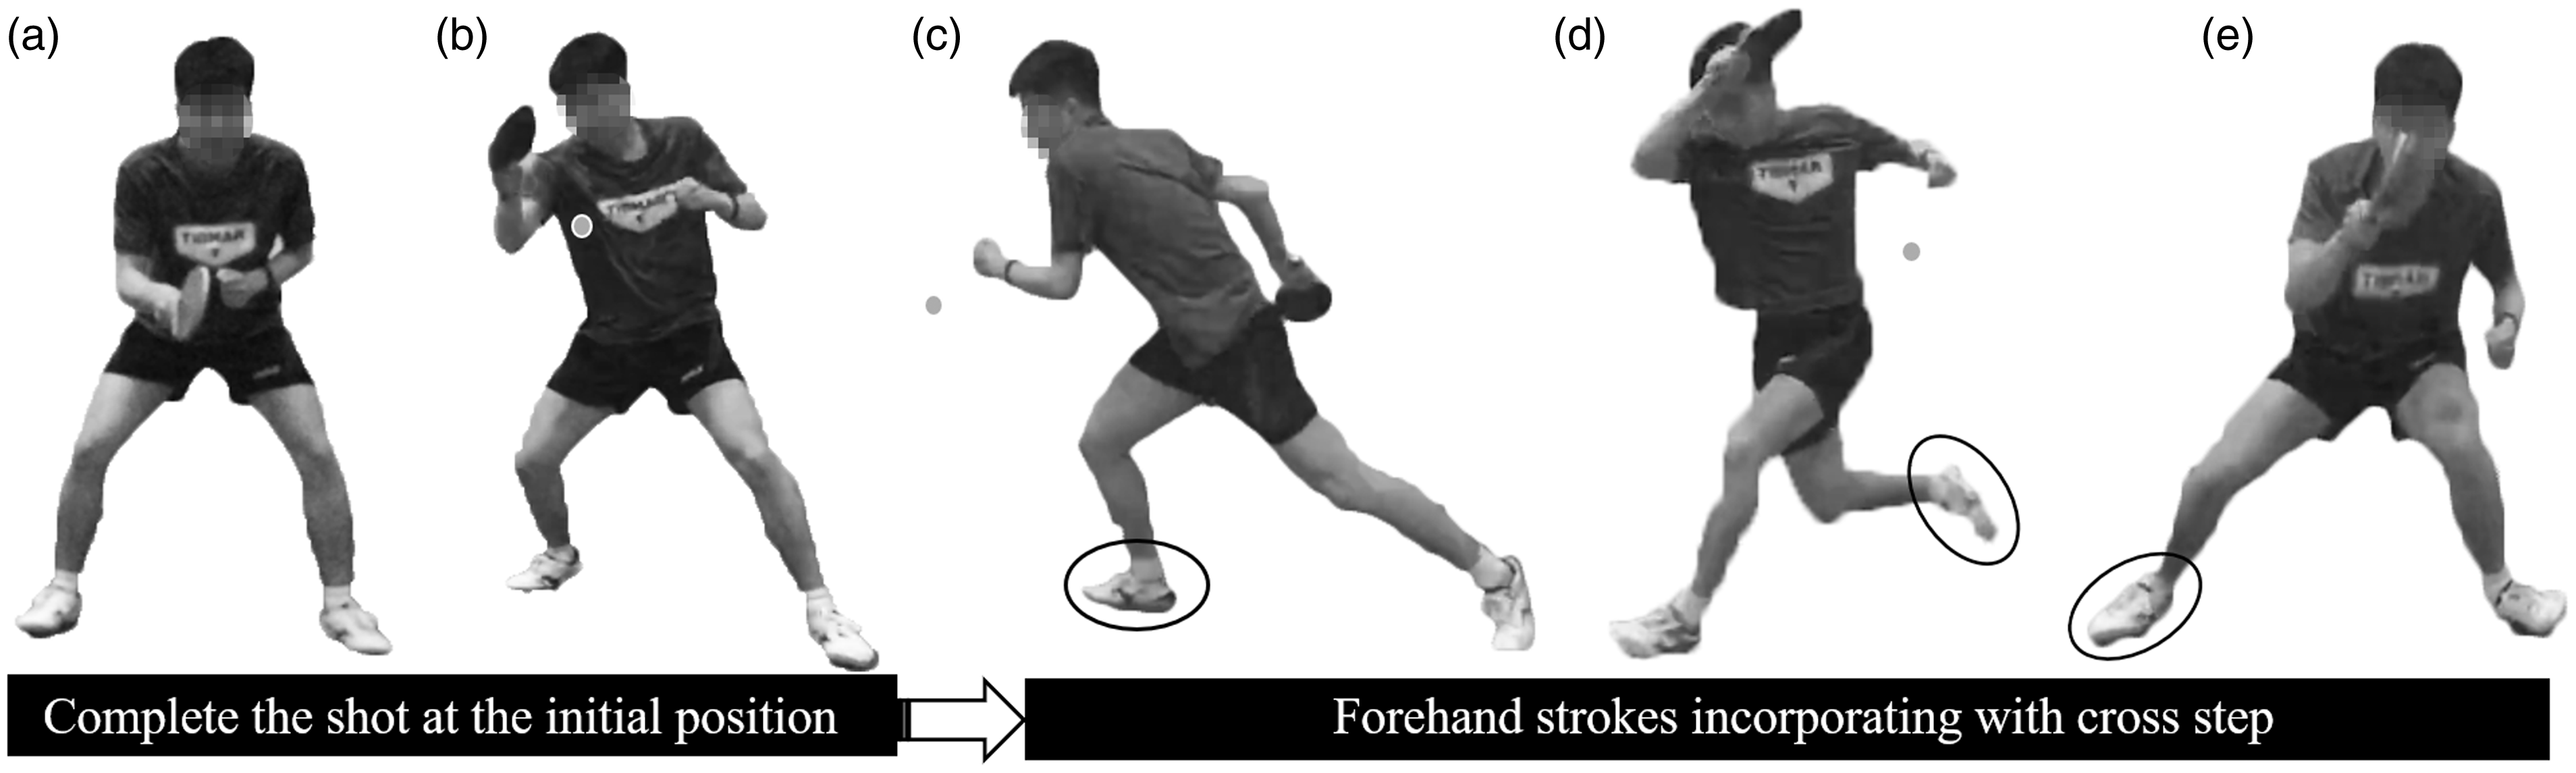
The performance of the participant in the study. (a) Neutral position; (b) the end of first shot; (c) the backward-end of the second stroke; (d) the instant of hitting the ball; and (e) the forward-end of the second stroke.
The cross-step movement was finished during the backswing phase. The cross step was defined as the period from the former stroke end to the backswing end. For integrated experiment process, the backswing phase (I, Figure 1(b) and (c)) and forward phase (II, Figure 1(c) to (e)) were recorded in this study. We also selected two key events of backward-end (BE, Figure 1(c)) and forward-end (FE, Figure 1(e)) for further analysis. ROM and angular changing rate in the three planes, as well as peak pressures and relative load for individual regions were processed for further analysis. 30 , 36
Statistical analysis
All statistical analyses were performed using SPSS 19.0 (SPSS Inc., Chicago, IL, USA). Independent t-test was used to evaluate the differences in kinematics, kinetics and time variables between PA and NA after the Shapiro–Wilks normality test. Significance level was set at p < 0.05. Effect size (ES): trivial (≤0.19), small (≥0.2 and ≤0.49), medium (≥0.50 and ≤0.79) and large (≥0.80) was used to compare the differences in the average of the two groups. 37
Results
Time
As shown in Table 1, both PA and NA spent significantly different times in phases I, II and the entire motion, respectively. PA showed significantly shorter time than NA.
Differences in time between PA and NA at phases I and II of cross step.
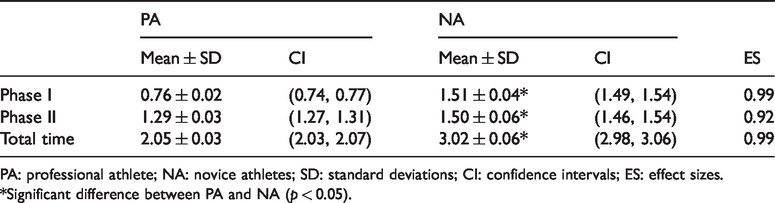
PA: professional athlete; NA: novice athletes; SD: standard deviations; CI: confidence intervals; ES: effect sizes.
*Significant difference between PA and NA (p < 0.05).
Kinematics
The changing trend of the kinematics of the three-dimensional space is shown in Figure 2 between PA and NA. Based on Tables 2 and 3, the plantar foot joint angles showed significant differences at the two key events between PA and NA: (1) Compared with NA, PA showed significantly smaller forefoot plantarflexion and abduction, as well as larger hallux dorsiflexion at the backswing/cross-step end. (2) At the forward end, PA not only showed significantly greater forefoot plantarflexion with smaller eversion and abduction, but also showed significantly smaller rear-foot inversion and hallux dorsiflexion than NA. Apart from RHXFFA, RHFTBA, and RFFHFA, PA showed significantly smaller ROM than NA in the sagittal plane at phase I (Table 4). Compared with NA, the RHFTBA of PA also showed significantly smaller ROM in the sagittal and frontal planes, but clearly larger in the transverse plane at phase II (Table 5). Concerning the angular changing rates of the plantar foot joints in three planes, the PA were significantly greater than NA at phase I. RFFHFA showed no significant difference in the transverse plane (Table 6). In addition, PA showed significantly faster angular changing rate in the three planes, but their RHFTBA was significantly lower in the frontal plane compared with NA in phase II (Table 7).

Changes of plantar foot joints during one cross step in the three planes. X: the sagittal plane; Y: the frontal plane; Z: the transverse plane.
Differences in plantar foot joint angles between PA and NA at the backswing end of cross step in three planes.

PA: professional athlete; NA: novice athletes; RHFTBA: right hindfoot with respect to tibia angles; RFFHFA: right forefoot with respect to hindfoot angles; RHXFFA: right hallux with respect to forefoot; SD: standard deviations; CI: confidence intervals; ES: effect sizes; X: the sagittal plane; Y: the frontal plane; Z: the transverse plane.
*Significant difference between PA and NA (p < 0.05).
Differences in plantar foot joint angles between PA and NA at the forward end of cross step in three planes.

PA: professional athlete; NA: novice athletes; RHFTBA: right hindfoot with respect to tibia angles; RFFHFA: right forefoot with respect to hindfoot angles; RHXFFA: right hallux with respect to forefoot; SD: standard deviations; CI: confidence intervals; ES: effect sizes; X: the sagittal plane; Y: the frontal plane; Z: the transverse plane.
*Significant difference between PA and NA (p < 0.05).
Differences in plantar foot joint ROM between PA and NA at phase I of cross step in three planes.

PA: professional athlete; NA: novice athletes; RHFTBA: right hindfoot with respect to tibia angles; RFFHFA: right forefoot with respect to hindfoot angles; RHXFFA: right hallux with respect to forefoot; SD: standard deviations; CI: confidence intervals; ES: effect sizes; X: the sagittal plane; Y: the frontal plane; Z: the transverse plane.
*Significant difference between PA and NA (p < 0.05).
Differences in plantar foot joint ROM between PA and NA at phase II of cross step in three planes.

PA: professional athlete; NA: novice athletes; RHFTBA: right hindfoot with respect to tibia angles; RFFHFA: right forefoot with respect to hindfoot angles; RHXFFA: right hallux with respect to forefoot; SD: standard deviations; CI: confidence intervals; ES: effect sizes; X: the sagittal plane; Y: the frontal plane; Z: the transverse plane.
*Significant difference between PA and NA (p < 0.05).
Differences in angular changing rate of plantar foot joints between PA and NA at phase I of cross step in three planes.

PA: professional athlete; NA: novice athletes; RHFTBA: right hindfoot with respect to tibia angles; RFFHFA: right forefoot with respect to hindfoot angles; RHXFFA: right hallux with respect to forefoot; SD: standard deviations; CI: confidence intervals; ES: effect sizes; X: the sagittal plane; Y: the frontal plane; Z: the transverse plane.
*Significant difference between PA and NA (p < 0.05).
Differences in angular changing rate of plantar foot joints between PA and NA at phase II of cross step in three planes.
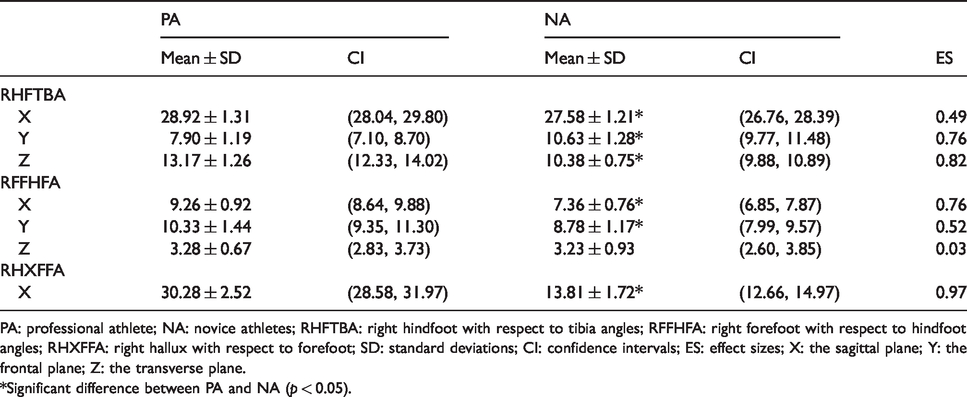
PA: professional athlete; NA: novice athletes; RHFTBA: right hindfoot with respect to tibia angles; RFFHFA: right forefoot with respect to hindfoot angles; RHXFFA: right hallux with respect to forefoot; SD: standard deviations; CI: confidence intervals; ES: effect sizes; X: the sagittal plane; Y: the frontal plane; Z: the transverse plane.
*Significant difference between PA and NA (p < 0.05).
Kinetics
As shown in the Figure 3, PA showed significantly larger peak pressure in the MR and LR regions, while smaller in the H, OT and forefoot regions compared with NA at phase I. For PA, the peak pressure in the OT and LF regions were significantly greater, but clearly smaller than the NA at phase II in the H, CF, and LR regions. In general, the regions of OT, LF, and rear-foot for PA produced a significantly larger relative load (Figure 4) compared to NA, which showed significantly larger relative loads under the H and MF regions (Figure 4).
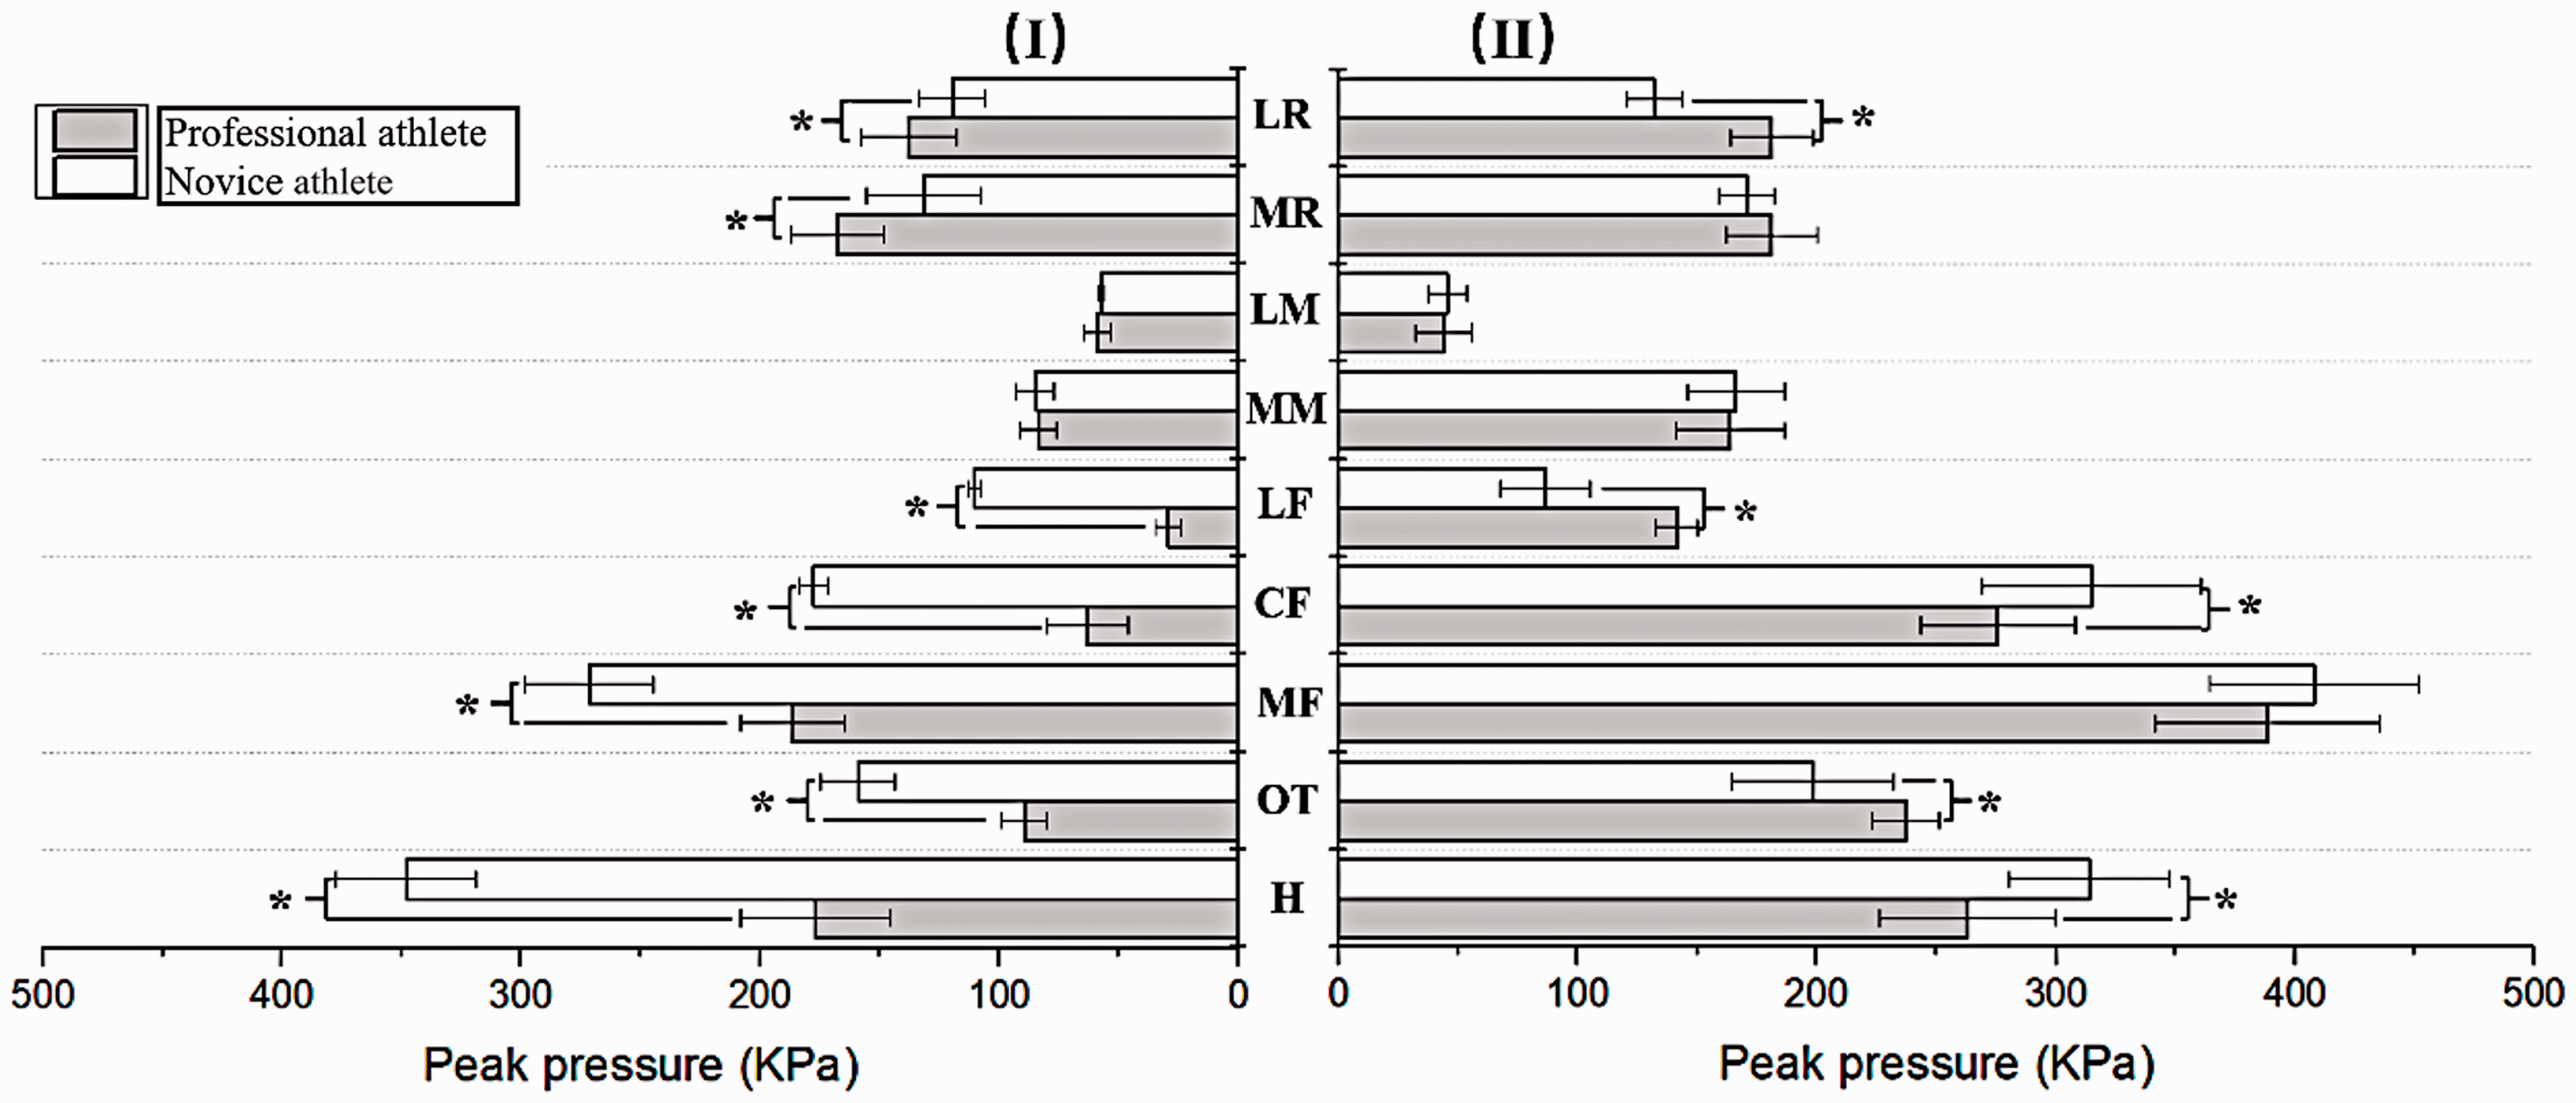
Differences in peak pressure for dominant foot between PA and NA in each of the nine areas of interest at phases I and II of cross step. *Significant difference between PA and NA in the nine areas (p < 0.05). PA: professional athlete; NA: novice athletes; H: hallux; OT: other toes; MF: medial forefoot; CF: central forefoot; LF: lateral forefoot; MM: medial mid-foot; LM: lateral mid-foot; MR: medial rear-foot; LR: lateral rear-foot.

Differences in relation load for dominant foot between PA and NA in each of the nine areas of interest during one entire motion of cross step. *Significant difference between PA and NA in the nine areas (p < 0.05). PA: professional athlete; NA: novice athletes; H: hallux; OT: other toes; MF: medial forefoot; CF: central forefoot; LF: lateral forefoot; MM: medial mid-foot; LM: lateral mid-foot; MR: medial rear-foot; LR: lateral rear-foot.
Discussion
The purpose of this study was to investigate the biomechanical differences between PA and NA in table tennis while incorporating the cross-step movement. The analysis of foot motion patterns provides clarity in understanding the biomechanical correlates leading to mastering the technical performance and prevention of the likelihood of potential sport injuries. Based on the results of this study, we found that there were some significant differences in the kinematics and kinetics for the dominant foot between PA and NA during the table tennis strokes. At the cross-step/backswing and forward swing phases, PA showed significantly smaller RFFHFA and RHFTBA with faster angular changing rate at the plantar foot joints compared to NA. For PA, greater peak pressures under the rear-foot were found at phase I, while at phase II, PA showed greater peak pressures in OT and LF regions. The differences with respect to relation load in rear-foot, LF, ML, H, and OT regions showed statistical significance between PA and NA during the strokes.
At phase I, RFFHFA and RHFTBA of PA showed significantly smaller ROM in the sagittal plane compared with NA, which could infer that the PA possessed better motion control and technical stability. This is partly consistent with previous study. Fu et al. 31 demonstrated that superior players possessed better foot drive technique and ability of foot motion control during forehand loop using one-step. In addition, the smaller forefoot plantarflexion and eversion for PA would support the body balance in performing the cross step, and contributing fully to the backswing. The PA also utilized a shorter time period to complete the cross-step movement. Wang et al. 6 investigated differences of lower limb kinematic and muscle activity during table tennis topspin loop against backspin movements between elite players and amateur players, and they found that elite players could complete this technical motion more economically and they were more efficient in muscle usage and body balance. From the above, it is indicated that PA could efficiently and steady transfer the power from the lower limb to the upper limb in order to prepare for forward swing and hit the ball, and this is also consistent with other previous studies. 17 , 38 Due to the different landing patterns both the PA and NA produced different peak pressure distributions on the sole. This may be attributed to the fact that in phase I, the PA more often finished the landing in the rear-foot region while the NA completed the landing in the forefoot region.
At phase II, PA exhibited significantly smaller rear-foot dorsiflexion and inversion, but greater external rotation than NA. The RHFTBA of NA showed a clearly larger and faster inversion compared with PA at the same period. According to reports from previous study, 78.3% of the ex-elite table tennis had various radiographic signs of osteoarthritis than 36.3% of the control group. 39 Acute ankle injury is one of the most common injuries in sports medicine, the most ankle sprains include strains of the lateral collateral ligament. 40 Ankle sprains, which are common in sports, are caused by rapid and/or large pronation. 41 Therefore, NA are likely to be at a higher risk of ankle related sports injuries. For PA as indicated in the time period with respect to the phases, the sudden movement patterns associated with significantly greater forefoot dorsiflexion, adduction with smaller eversion and high ground reaction forces could lead to a faster return of the ankle joint to its original position when compared with NA. During forward swing, PA showed significantly faster angular changing rate of plantar joints and greater peak pressure in CF, LR, and H regions than NA. In addition, we hypothesized that the larger peak pressure and relative load in the OT region were related to the regulation of body balance. However, further research must be done before this hypothesis can be verified. In the whole process of using cross-step movement to complete the strokes, PA had a larger relation load in LF and MR regions, while NA had a larger relation load in H and MF regions. Lam et al. 19 also found the peak pressure in plantar region of PA mainly focused on MM and rear foot. These indicated that NA may possess a relatively weak “kinetic chain” which would consequently lead to poor performance.
The limitations of this study are shown in the following aspects. This study did not examine differences between genders in cross-step movement because we only recruited male players in this study. Only the ball-kick test was used to define the dominant foot of participants. The participants were not scanned for foot morphology, which could have affected their motion characteristics. 42 , 43 We only selected the participants from China and did not record the ball speed during strokes, and therefore these factors could not reflect the real technical performance expected for the cross-step movement at some degree. In addition, the horizontal force components appeared when moving sideways may distort the results because the Peder insole gauges sense pressures mainly in the normal direction (perpendicular to the foot), and the synchronous use of 3D floor dynamometers in further research can partially eliminate this deficiency. Finally, the definition of NA may differ across previous studies and thus may interfere with the validity of experimental data to a certain degree. 17 , 19 , 22 , 31 , 32 Future studies of table tennis footwork and differences between levels and/or genders using biomechanical methodologies must be done in order to fully understand the internal mechanisms of table tennis techniques that further enhance performance.
Conclusion
The main aim of this study was to compare the differences of foot biomechanics between PA and NA during table tennis strokes incorporating the cross-step movement. The results showed that compared with NA, PA spent less time on completing the cross step, and showed a smaller ROM and a faster rate of angular change. This proves that PA have a better ability to use foot drive thereby retaining body balance in footwork movement technology. At the end of forward swing, PA exhibited significantly smaller forefoot plantarflexion and abduction, which could be better in maintaining the stability of the body’s center of gravity. For PA, greater peak pressure and relation load in performing cross step movement were found in the lateral forefoot and the medial and lateral areas of the rear foot. Generally, the findings of this study are beneficial and provide valuable theoretical references for coaches and NA during table tennis footwork training, it is suggested that NA should focus more on the control of foot motion for improvements in the quality of technical movements and maintenance of body stability when finishing strokes using the cross-step movement.
Footnotes
Declaration of conflicting interests
The author(s) declared no potential conflicts of interest with respect to the research, authorship, and/or publication of this article.
Funding
The author(s) disclosed receipt of the following financial support for the research, authorship, and/or publication of this article: This study was sponsored the by National Natural Science Foundation of China (81772423), NSFC—RSE Joint Project (81911530253), and K. C. Wong Magna Fund in Ningbo University.
