



Abstract
Performance analysis is a well-established discipline in sports science, supported by decades of research. Comparatively, performance analysis in electronic sports (esports) is limited. Therefore, there is an opportunity to accelerate performance outcomes in esports by applying methods grounded in sports science. This study adopted a coach-centred approach to model performance at the 2018 League of Legends World Championship. Three expert coaches rated the proposed relationship between 43 variables and match outcomes in professional League of Legends competition using a Likert scale (1–10). The Likert scale was anchored with ‘no relationship’ at 1 and ‘very strong relationship’ at 10. The coaches’ median ratings were calculated for each variable. Variables with a median score ≥6 were retained for analyses. A total of 14 variables were collected from the 2018 League of Legends World Championship (n = 119) matches via video annotations and match histories. Generalized Linear Mixed Effects Models with binomial logit link function were implemented with respect to the Blue Side winning or losing the match, and individual teams were specified as random effects. Variables were screened for multicollinearity before using a step-up approach. The best model of performance included Tower Percentage (p = 0.006) and Number of Inhibitors (p = 0.029). This model achieved classification accuracy of 95.8%. While Tower Percentage and Number of Inhibitors contributed to winning or losing, further research is required to determine effective strategies to improve these variables, to understand the relevance of these variables across the complete time-series of the match, and to determine whether performance indicators remain stable across game updates.
Introduction
Electronic sports (esports) is a modern competitive environment where players compete against each other via human-computer interactions, 1 thus, differentiating esports from the broader field of video gaming. There are numerous genres of games within esports, and a classification of Action Video Games has emerged that includes Multiplayer Online Battle Arenas, First Person Shooters, Third Person Shooters and Real-time Strategy.2 One of the most widely played Action Video Games is League of Legends – a Multiplayer Online Battle Arena game released in 2009, with up to 100 million active users recorded per month. 3 In League of Legends, two teams of five players work against each other to destroy the opposing team’s Nexus (i.e. the main structure located at the opposite side of the arena). The arena consists of three lanes that cross from the bottom left corner (Blue Side) to the top right corner (Red Side), with jungle areas separating each lane and a river passing from the top left to bottom right (Figure 1). At the start of the game, players select from a pool of 145 Champions (the Champion pool size as of September 2019) that they will control as their in-game avatar throughout each match, each of which has unique abilities and skills that the player can activate.
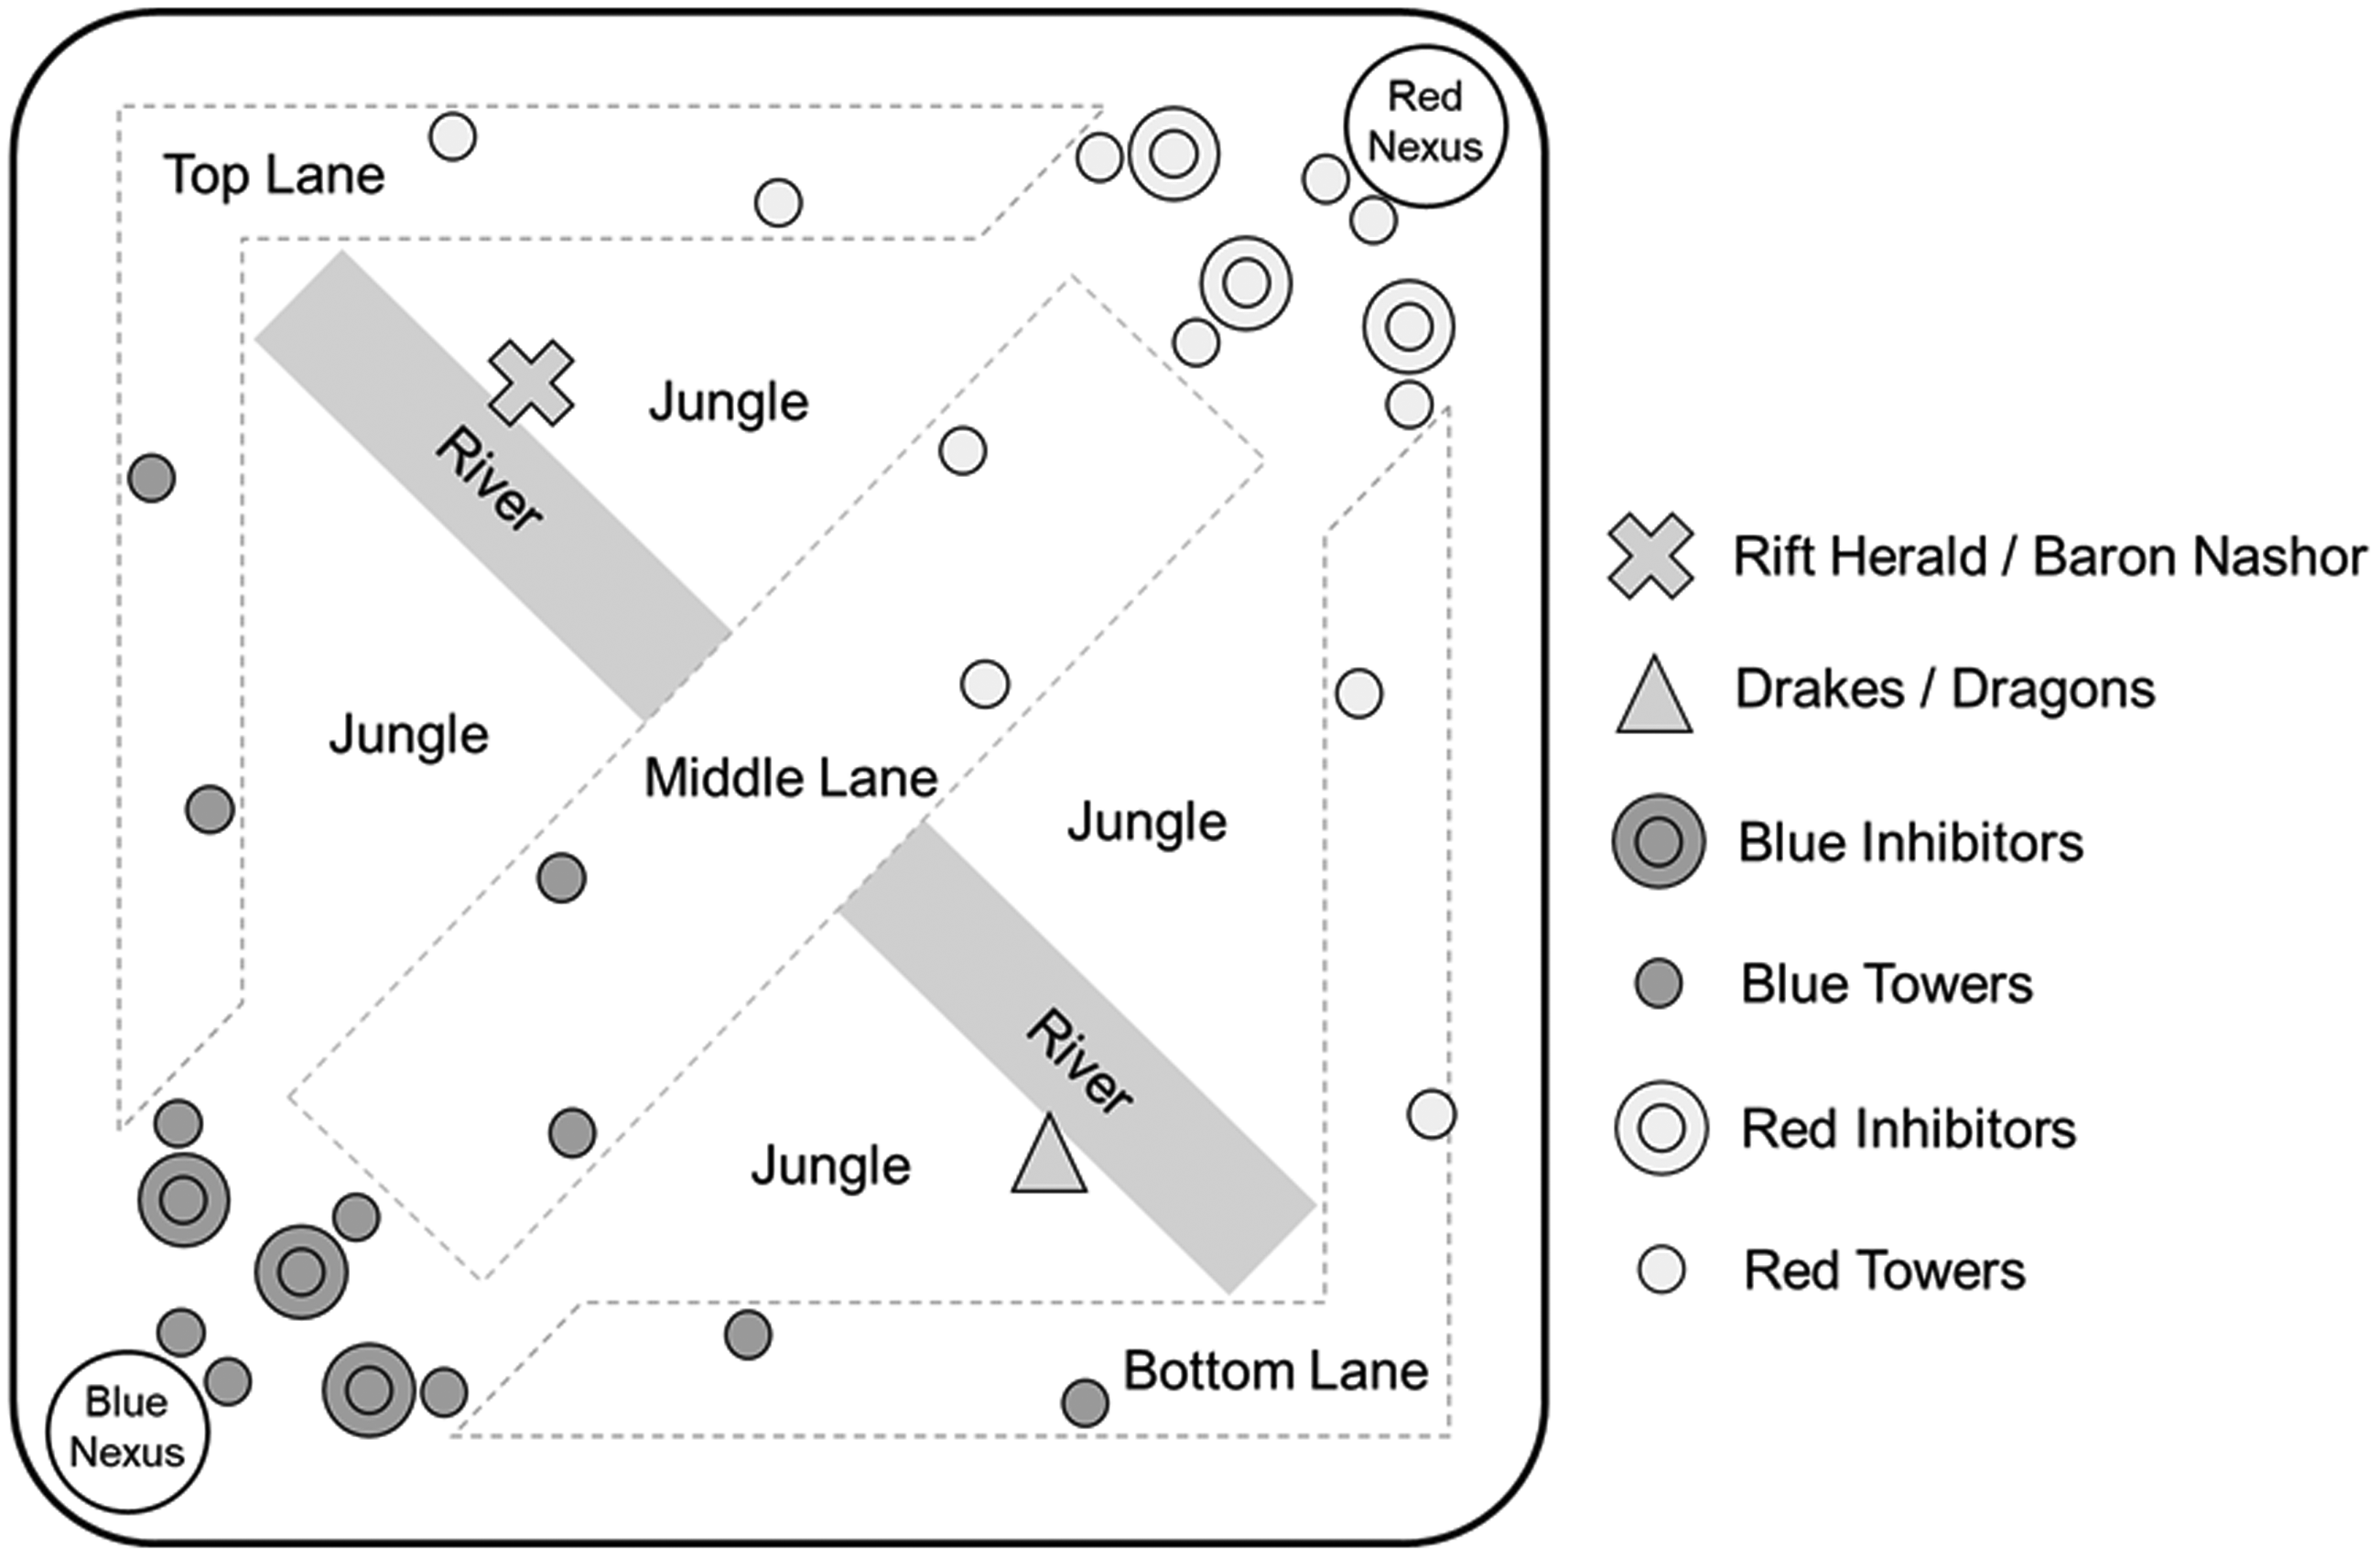
League of Legends arena.
During a match, players face various enemies and objectives including the five opposing team players, waves of computer-controlled Minions, Jungle Monsters, enemy buildings called Towers, and other monsters that only spawn at specific times such as Elemental Drakes, the Elder Dragon, Rift Herald, and Baron Nashor. Attacking each of these enemies and objectives awards experience (used to “level-up” the players’ Champions), and gold (in-game currency used to purchase items), which make Champions more powerful via awarding new abilities or increasing the five primary attributes of attack damage, ability power, armour, magic resistance, and health. Further, bonus rewards are available for acquiring key objectives such as First Blood (extra gold for the player(s) who obtain the first kill in a match), First Tower (extra gold for the player(s) who destroy the First Tower), the Elder Dragon (power increases relative to the number Elemental Drakes that the team has slain), the Rift Herald (the player granted an additional powerful ability that they can use within a 4-minute time frame) and Baron Nashor (provides all surviving teammates with temporary bonus damage and an aura to amplify the power of their team’s nearby Minions). As Champions become stronger, they can overcome objectives more quickly that can ultimately aid in winning the match.
League of Legends is currently played competitively across numerous regions (Korea, North America, Europe West, Europe Nordic and East, Oceania, Russia, Turkey, Brazil, Latin America North, Latin America South, Vietnam, South-East Asia, and Japan). The number of ranked players varies between 200,000 players in emerging regions like Oceania and Russia, to more than 3.5 million ranked players in established nations like Korea (data accessed via website https://[region].op.gg/statistics/tier, 15/09/2019). Many players are employed full-time contracts and earn a salary to train and compete in League of Legends professional. Notably, the 2018 League of Legends World Championship boasted a prize pool of USD 6.45 million (retrieved 24/09/2019 from https://www.esportsearnings.com/tournaments).
To date, most of the research has focused on video gaming and the relationship between participation and domain-general perceptual-cognitive and perceptual-motor skills. For example, there is some evidence that video gaming is associated with enhanced working memory capacity and information processing skills.4,5 Furthermore, expertise in multiplayer online battle arena games is related to domain-general cognitive skills and numerical processing. 6 However, a meta-analysis of experimental studies yielded negligible effects of video gaming on executive functions such as working memory, multitasking, nonverbal intelligence, and task switching. 5 While there is conflicting evidence concerning the relationship between domain-general skills and video gaming, no research has investigated the in-game actions associated with successful match outcomes within professional esports competitions.
Due to the lack of available peer-reviewed scientific research, professional esports coaches and players must use information that is considered poor scientific quality (e.g. anecdotal observations, individual experiences, and unvalidated statistics). Anecdotal reports reveal that professional Oceanic esports coaches and players rely on knowledge derived from other disciplines that are considered somewhat similar such as chess and sports (personal communication, [April 2019]), while some researchers have also drawn links between esports and chess.1,7 In traditional sports, performance analysts and coaches collect data via manually annotating video footage, which can form part of the feedback loop that informs coaching decisions. 8 – 11 Annotating video footage is a manual and time-consuming process, and coaches/performance analysts must decide what actions are the most relevant to capture. In contrast, esports games often record all in-game actions quantitatively and automatically, with data accessible via public websites. The increased accessibility to online data has the potential to accelerate performance analysis outcomes and the coaching feedback loop within esports. Although automatically logging in-game data should theoretically be more accurate than manual video annotation methods (e.g. during sports), the automated data are captured, aggregated, stored and visualised by proprietary software systems, and the validity of the data should not be accepted without investigation. Additionally, any software system can be subject to errors caused by bugs, software and hardware changes, or oversight of an engineer or developer i.e. there is still a level of human error involved. Ultimately, validating esports data before implementing data-driven performance analysis is essential. Therefore, the first aim of the current study was to conduct a preliminary analysis to assess the validity and inter-rater reliability of automated Match History statistics in professional League of Legends competitions, by drawing on methodologies grounded in sports science.12–14 Secondly, the research aimed to engage with expert coaches to determine which in-game actions they believed were associated with successful match outcomes. Finally, the research aimed to determine which of the variables suggested by expert coaches were associated with successful outcomes at the highest level of competition – the 2018 League of Legends World Championship.
Methods
Before undertaking the coach survey and performance analysis, the validity and inter-rater reliability of Match Histories (official summary statistics) and video annotations were assessed by using 30 randomly selected League of Legends matches from the 2019 North American and European professional competitions. Given that the true measure of the action variables cannot be captured via the match histories due to the potential for software bugs and inaccurate data handling processes, the video footage was considered as the criterion measure as it provided a way to observe the underlying data directly, with no subjective interpretations or ratings. The Match Histories were copied from the publicly accessible repository (https://matchhistory.na.leagueoflegends.com), while each of the authors independently viewed videos on the public Video On Demand repository (https://watch.lolesports.com/vods). The authors encoded each action variable into a spreadsheet (see Table 1 for a list of variables available in both Match Histories and video footage). Three of the authors had experience playing League of Legends (255, 1401 and 1596 hours; data extracted from user accounts via the website: https://wol.gg/ data extracted 03/08/2019), as well as many hours viewing professional competitions and two years’ experience consulting with professional League of Legends teams and coaches. The most experienced author’s data were compared with the Match Histories as an assessment of validity, and between the three authors as a measure of reliability. Krippendorff’s Alpha was used with an acceptable agreement of α ≥ 0.8 according to prior recommendations (literature, 15 , 16 p. 241) via the IRR package within R.17
Agreement between the most experienced player and Match History; and between three experienced players.
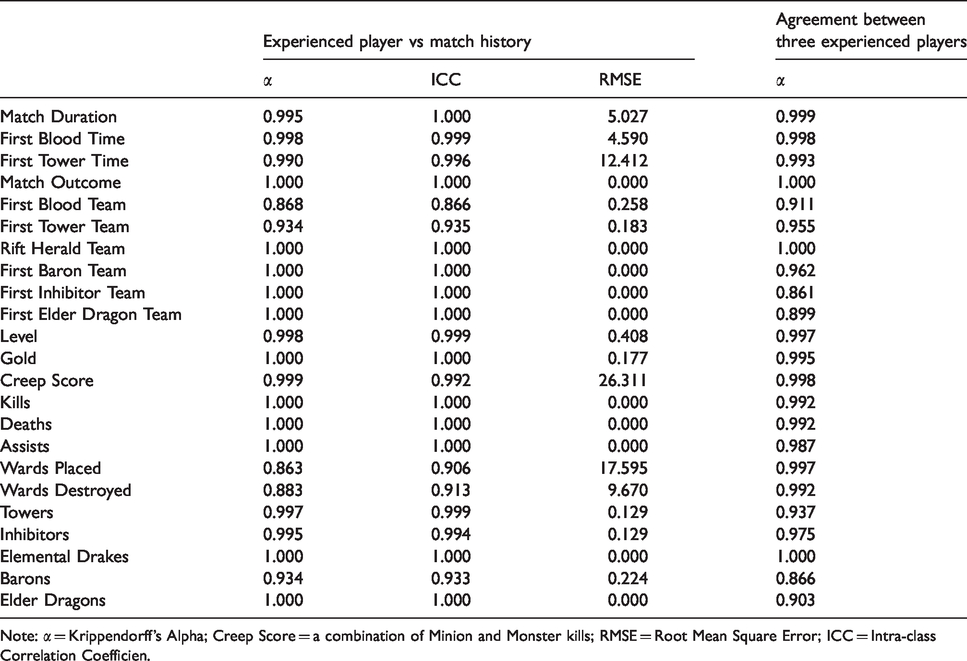
Note: α = Krippendorff’s Alpha; Creep Score = a combination of Minion and Monster kills; RMSE = Root Mean Square Error; ICC = Intra-class Correlation Coefficien.
The results showed that the most experienced author was in acceptable agreement with the Match Histories (α = 0.863–1.000), while the three experienced author were in acceptable agreement with each other (α = 0.861–1.000) (Table 1). However, the Wards Placed and Wards Destroyed had a near-perfect agreement between the three experienced authors but a relatively low agreement between the most experienced author and the Match Histories. Therefore, there might be a systematic error between Match Histories and video footage and all vision-related variables were removed from the subsequent performance analysis. Additional research would be required to ascertain the reasons for these errors, however, it is likely that there is some disparity between when the game is technically won (Nexus destroyed) and when the final vision variables are captured by the software. Aside from the vision-related variables, the Match Histories and the experienced author’s video annotations could be used interchangeably to facilitate performance analysis in League of Legends. Using video annotations might be useful in situations where the Match History statistics are not available, and a match of interest must be coded manually via video footage – a scenario that was encountered twice during the current study. Complete methodology and analysis is available in preprint.18
Coach analysis of performance variables
A survey was created by three of this study’s authors who had experience in League of Legends as per the preliminary analysis. Variables were included based on the collective agreement of these players via open discussion, and if the variables could be collected from Match Histories and/or video annotation as per the preliminary analysis. The final survey identified 43 potential performance variables and asked coaches to “select how strong they believed a list of 43 performance variables related to match outcome in professional League of Legends”. Three expert coaches completed the survey. Two were head coaches and one was an assistant coach at the time of data collection, each with 3–4 years’ experience coaching, and 7–9 years playing League of Legends. Two coaches had coached at the highest level in their region (Professional) and one had coached at the second highest level (Academy). Coaches used a 1–10 Likert scale when rating the relationship between the performance variable and match outcome (i.e. 10 options resulting in no middle/neutral option and enforcing a non-neutral response). The Likert scale contained two anchors: 1 = “no relationship” and 10 = “very strong relationship”. The authors also asked the coaches to list any additional performance indicators that they felt would influence match outcome. Table 2 shows the complete list of performance variables included in the survey.
Variables include in coach survey.
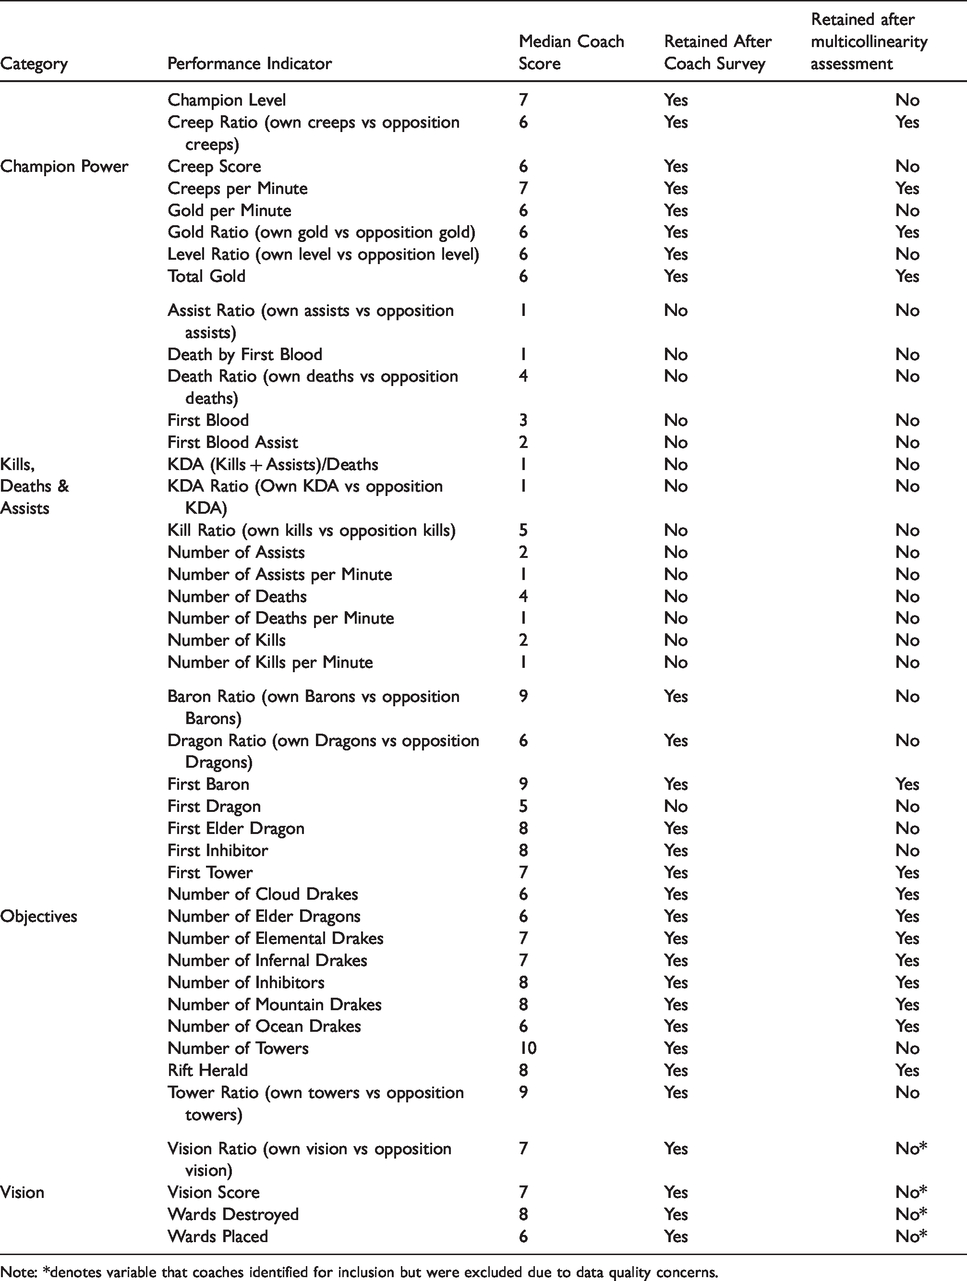
Note: *denotes variable that coaches identified for inclusion but were excluded due to data quality concerns.
2018 League of Legends World Championship
The 2018 World Championship was comprised of 24 teams from 14 regions. The game version was v8.19. Due to historical performance variations across regions, top-performing regions were permitted to each enter their best three teams, while lower-performing regions each entered their single best team (the winning team at yearly regional finals). A total of 119 matches were played throughout the World Championship, with the early stages of the tournament following a round-robin format, while knockout stages such as the finals followed a best-of-five format. Due to these factors, regions and teams did not play an equal number of games (average = 10 ± 6 games per team; range = 4 [Brazil, Oceania, South-East-Asia] to 47 [China and Europe]). Given that draws are not possible in League of Legends, no matches needed to be excluded from analysis when examining win/loss outcomes.
Performance indicators
Video footage for the 2018 League of Legends World Championship was accessed and viewed via the public League of Legends Video On Demand repository, and the Match Histories from the public League of Legends Match History repository as per the preliminary analysis. For each match, the region and name of the winning and losing team were recorded, as well as the team sides (Blue vs. Red) and match duration. Performance indicators determined via the coach survey were recorded within three categories: 1) frequency data (e.g. number of kills, deaths and assists for each player); 2) time-dependent data (e.g. the exact time that the first tower was destroyed); and 3) categorical data (e.g. which team destroyed the first tower). Table 3 displays the complete list of variables. Institutional ethics approval was received prior to undertaking this study.
Descriptive team-based statistics of the 2018 League of Legends World Championship.
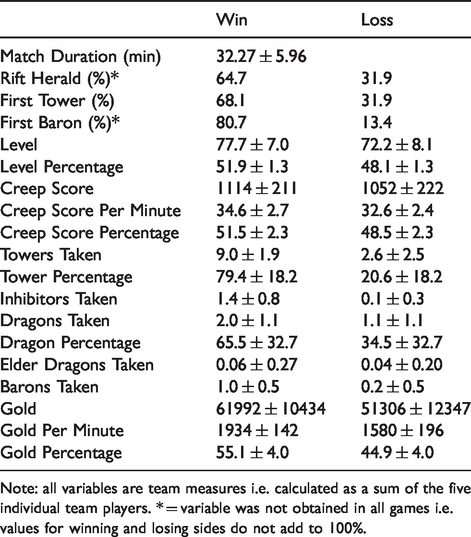
Note: all variables are team measures i.e. calculated as a sum of the five individual team players. * = variable was not obtained in all games i.e. values for winning and losing sides do not add to 100%.
Statistical analysis
Coach survey
Data from the coaching survey were exported from Google Forms as a spreadsheet. For each variable, the Median value of the three coaches’ responses was calculated using Microsoft Excel. Variables with a Median value ≥6 were retained in the final analysis of 2018 League of Legends world championship. A median value of 6 was chosen as it represents a variable that is believed to be relatively strong in its association with match outcomes, while a value of 5 is believed to be relatively low in its association with match outcomes as there was no middle/neutral option available.
2018 League of Legends World Championship
Variables retained after the survey were manually entered into a spreadsheet for each match by one of the experienced players/authors via manually copying data from the Match Histories or video annotation from the Video on Demand. Variables that contextualized the frequencies (e.g. own team gold vs opposition gold) were expressed as percentages of total match values (e.g. own team gold/[own team gold + opposition gold]) for modelling purposes as per previous recommendations for variable normalization in performance analysis. 10 Analyses were conducted using the R statistical framework.19 Variables were initially examined for multicollinearity using a correlation matrix. If a correlation of ≥0.8 was observed between two variables, only the variable with the greatest correlation with respect to match outcome was retained for analysis.
Given that there was an uneven distribution of matches played by each team, generalized linear mixed effects models were deemed appropriate to examine the relationships between performance indicators and match outcomes, as some correlations within groups were expected. The “glmer” function within the “lme4” package was used20 and the Blue Side Team Name was specified as a random effect, while all other independent variables were specified as fixed effects. All matches were analysed with respect to the Blue side, and a binomial link function was adopted to analyse the data with respect to the Blue side winning or losing the match. While all four measures of Vision were retained after the coach survey, the previous data quality concerns regarding variables relating to vision (e.g. Wards Placed and Wards Destroyed; see preliminary analysis above), resulted in a decision to remove those four variables. Therefore, 24 variables remained for further analysis. The 24 variables were assessed for Multicollinearity, and a further 10 variables were removed, leaving a final 14 variables. Given that there were 14 variables remaining and only 119 observations, a step-up approach was adopted when modelling the generalized linear mixed-effects models. In this process, a null model was firstly specified. Subsequently, each variable was added one-by-one as a fixed effect to identify the variable that explained the most variance by comparing the new model against the null model via the anova function in R to view the alpha value and Akaike Information Criterion (AIC). Models were also assessed by comparing the predicted vs. observed values to calculate the classification accuracy of the model. The residuals for each model were also examined via QQ plots to assess normality. Following the identification of the best model with one fixed effect, a second fixed effect was added one-by-one as per the first model and assessed via the same method until no further model improvement was observed.
Results
Coach survey
Of the 43 variables analysed, 28 had a median score ≥6, and therefore were retained for subsequent analysis. These variables are represented in Table 1 and are related to Champion Power, Objectives, and Vision. No variables relating to Kills, Deaths and Assists were given a Median score ≥6 by the three coaches. Only one coach responded to the question asking them to identify any other potential performance indicators. This coach noted that “gold lead in relation to the time in the game” would be important and would be rated 9/10 on the Likert Scale. However, given that time-series analysis was not within the scope of this study and that the other two coaches did not include a similar comment, this variable was not included.
2018 League of Legends World Championship
During the assessment of multicollinearity, Tower Percentage was the strongest variable, resulting in the removal of seven variables that were multicollinear with Tower Percentage (Level Percentage, Towers Taken, Inhibitor Percentage, First Inhibitor, Barons, Gold Percentage, and Gold Per Minute). Descriptive statistics for all variables are available in Table 3 as mean ± SD. Additionally, Tower Percentage was the strongest variable in the generalized linear mixed effects model, becoming the variable retained at the first step of the step-up approach. Subsequently, the number of Inhibitors Taken was retained in the model at the second step of the step-up approach and the inclusion of additional variables thereafter did not improve the model any further. The final model that included Tower Percentage and number of Inhibitors Taken as fixed effects was significantly better than the null model (p < 0.001), reducing the AIC from 148.8 to 37.4 and achieving a prediction accuracy of 95.8% when comparing the predicted values to the observed values for match outcome. Specifications of the final model are presented in Table 4 and estimates have been exponentiated to allow for interpretations as odds ratios.
Best model of performance for the 2018 League of Legends World Championship.

Discussion
The current study is the first to explore the validity of automated match statistics in esports, and to undertake an analysis of in-game performance indicators within a professional esports tournament (i.e. the 2018 League of Legends World Championship). The study aimed to apply methods grounded in sports science to model esports performance, which was achieved via assessing the validity of automated match statistics and inter-rater reliability of video annotation, engaging with expert coaches, and conducting performance analysis facilitated by match statistics and video. This study utilised generalized linear mixed-effects models and identified that the percentage of Towers Taken was most strongly related to match outcome, while the number of Inhibitors Taken also contributed to the best model of performance (95.8% classification accuracy). Specifically, an improvement of 1% in Tower Percentage resulted in 8.7% greater odds of winning the match, while with each additional Inhibitor Taken, there was a thirteen-fold increase in the odds of winning the match.
This study is the first to provide evidence for the importance of Towers and Inhibitors for match outcomes in League of Legends. However, neither of these findings were surprising, given that Towers are the main structures that prevent players from progressing towards the opponent’s Nexus. Towers cause significant damage to players, especially during the early phases of the game when Champions have limited defences and relatively low health. They also prevent access to key objectives such as the opponent’s Inhibitors and the Nexus. Additionally, Inhibitors provide an important effect that helps teams to end the game (stronger Minion waves are deployed towards the opponent’s Nexus to help the team destroy it). While Towers and Inhibitors are crucial for successful performance, further research is required to determine effective strategies to improve Tower Percentage and destroy Inhibitors. Specifically, to improve Tower Percentage, teams need to destroy opposing Towers while simultaneously protecting their own Towers. Additionally, given that there are 11 Towers on each side, there may be optimal strategies for targeting Towers at specific moments of the game, which future research should explore. Coaches should work with their players to develop a strategy that maximises their Tower Percentage and ability to destroy enemy Inhibitors throughout each match.
While the final model of performance produced extremely high prediction accuracy by using only two variables, this does not mean that they are the only variables coaches and players should focus on, or that other variables are not also important. Instead, this only reflects that other variables added no further value to the prediction model once Tower Percentage and Inhibitors were included. Importantly, seven variables were removed before the modelling process due to collinearity with Tower Percentage (Level Percentage, Towers Taken, Inhibitor Percentage, First Inhibitor, Barons, Gold Percentage, and Gold Per Minute). Therefore, further consideration of these variables is warranted. In particular, the causal pathways between each of these variables should be studied. For example, does a team having more gold cause them to take more towers, or does taking more towers cause a team to obtain more gold? Knowledge of the game suggests that both of these are true, and the causal pathway is likely bidirectional. However, further studies using time-series analysis could provide confirmation and greater clarity on how to use these relationships strategically. Secondly, Table 3 shows potentially substantial differences between winning and losing teams for Rift Herald (64.7% vs 31.9%), First Tower (68.1% vs 31.9%), First Baron (80.1% vs 13.4%), Barons Taken (1.0 ± 0.5 vs 0.2 ± 0.5), and all measures of Gold. Univariate analysis of variance was not undertaken for each individual variable, but these data could contribute to the development of hypotheses for further studies.
As noted above, the difference between winning and losing teams for First Tower appears large, yet the First Tower objective did not contribute to the model of performance, likely due to the high variance taken up by Tower Percentage and Inhibitors. Further research should determine whether Towers at various locations are of greater importance than others. It should be noted that two of the Towers are located next to the Nexus and are often destroyed during the final moments of the game. Therefore, the Tower Percentage may be somewhat artificially inflated as a measure of performance in the final statistics, given that the game state in which the winning team finally overcame their opponents may have occurred during a final team fight, i.e. prior to taking these final two Towers. Time-series analysis was beyond the scope of this study but is an area that requires further investigation. These findings based on the objective data are in support of the coaches’ subjective opinions, who also indicated that number of Towers Taken is the most important variable (the only variable with a median value of 10/10), while they also rated Tower Ratio as 9/10.
Limitations
This research should be interpreted considering several limitations. First, only three coaches completed the survey, and therefore, the survey results cannot be generalised. Future research would benefit from seeking engagement from more industry experts, however, the findings of this study supported the opinions of the three expert coaches. It should be noted that one survey responder disclosed via personal communication that contracts are a particularly sensitive topic within esports and that the informed consent form was likely perceived as a form of contract, ultimately deterring responders. While this is somewhat speculative, researchers may benefit from a more sensitive approach when engaging the esports community in future. Second, due to the inclusion bias towards previously high-performing regions (e.g. China, Europe, North America and Korea) and the knockout style format of competition, there may be inherent bias within the data towards teams who played more games (i.e. the results may reflect specific gameplay styles from China and Europe who each played 47 games). While this was accounted for within the mixed-effects model, it could not be accounted for within the summary statistics. Given that the League of Legends World Championship encompasses the top teams across all competitive global regions, it is accepted that the summary statistics encompass current performances at the highest level of competitive League of Legends. Third, League of Legends receives relatively minor updates roughly every two weeks (e.g. minor changes to champion skills, cooldowns, or adding new champions to the game), while more extensive updates typically occur once per calendar year, (e.g. changes to the way the Rune system works [abilities that players select prior to each match] or adding new defences to the Towers to change how players strategize). As noted in this study, the patch version for the 2018 World Championships was v8.19 and future research should be conducted to determine performance indicators that are longitudinally related to successful performance. Finally, due to the limited sample size, it was not feasible to include many independent variables or to withhold a sample to facilitate predictions on unseen data. Future research should aim to acquire larger samples so that more variables can be included, and the predictive power of the models can be assessed. This could be facilitated via the Riot Games Application Program Interface (API); however, validation of the API data quality is required prior to implementation.
Conclusion
The current study applied traditional performance analysis methods that were learned in the sports science domain, to help understand esports performance. At the highest level of League of Legends competition, Tower Percentage and Number of Inhibitors were identified as having the strongest relationships with performance. Therefore, further research should seek to identify strategies to effectively target these objectives across the time-series of the match, and to determine whether there are differences between World Championship competition and other competitions e.g. Professional level and Academy level within individual regions.
Footnotes
Declaration of conflicting interests
The author(s) declared no potential conflicts of interest with respect to the research, authorship, and/or publication of this article.
Funding
The author(s) received no financial support for the research, authorship, and/or publication of this article.
