




Abstract
This study aimed to evaluate the effects playing position, match location (home or away), quality of opposition (strong or weak), effective playing time (total time minus stoppages), and score-line on physical match performance in professional soccer players using a large-scale analysis. A total of 10,739 individual match observations of outfield players competing in the Spanish La Liga during the 2018–2019 season were recorded using a computerized tracking system (TRACAB, Chyronhego, New York, USA). The players were classified into five positions (central defenders, players = 94; external defenders, players = 82; central midfielders, players = 101; external midfielders, players = 72; and forwards, players = 67) and the following match running performance categories were considered: total distance covered, low-speed running (LSR) distance (0–14 km · h−1), medium-speed running (MSR) distance (14–21 km · h−1), high-speed running (HSR) distance (>21 km · h−1), very HSR (VHSR) distance (21–24 km · h−1), sprint distance (>24 km · h−1) Overall, match running performance was highly dependent on situational variables, especially the score-line condition (winning, drawing, losing). Moreover, the score-line affected players running performance differently depending on their playing position. Losing status increased the total distance and the distance covered at MSR, HSR, VHSR and Sprint by defenders, while attacking players showed the opposite trend. These findings may help coaches and managers to better understand the effects of situational variables on physical performance in La Liga and could be used to develop a model for predicting the physical activity profile in competition.
Introduction
Findings from time-motion analysis are useful to quantify match running performance and can provide clear orientations for the development of specific performance test and training regimes. 1 Studies have demonstrated that players regularly transition between brief bouts of high-intensity running and longer periods of low-intensity running. 2 , 3 Research examining situational variables such as score-line (win, draw, lose) and match location (home, away), level of opposition (e.g. strong, weak), and match half demonstrate that these have an impact on running profiles of players. 4
Regarding the effect of score-line on match running, it has been suggested that very high speed running increased when teams are losing a match compared to winning, in the hope of getting back into the match; both when total and effective playing time (i.e., total time minus stoppages) were considered.5–8 Lago et al. 5 demonstrated that for every minute losing, players covered an extra meter of sprinting (>19.1 km · h−1) compared to when winning; and conversely, winning increased low-speed movements (<11 km · h−1). These findings support the idea that players do not always use their maximal physical capacity for an entire match. 9 Other studies suggest a different effect of score-line on running profiles. Moalla et al. 10 found that when considering the outcome of complete matches, winning status was characterized by players covering a longer distance in total distance and low-intensity running (<14.4 km · h−1) whereas losing status induced more sprinting (≥25.2 km · h−1) and high-intensity running (≥19.8 km · h−1). However, when considering partial score-line (i.e. 15-min and half time), players covered a longer distance in all running intensities while winning. Finally, Bradley and Noakes 11 and Redwood-Brown et al. 12 observed that elite players covered a similar high-intensity running distance in matches regardless of the score-lines.
Additionally, very few studies have examined positional differences in match running performance during various score-lines. Redwood-Brown et al. 12 found that midfielders covered a longer distance in high speed running when tied, defenders longer when losing and attackers longer when winning. A similar pattern was reported by Bradley and Noakes 11 who found that central defenders covered 17% shorter, and attackers 15% longer, distance in high speed running during matches that were heavily won vs heavily lost (score differential ≥3 goals). However, more recently, Reedwood-Brown et al. 13 did not find differences between playing positions in high-speed running or sprinting.
These contradictory findings may be due to different methodological limitations. The effects of score-line on match running have been studied by: (1) using only using very small data sets or single clubs, (2) using overall score-line (winning, drawing, losing) rather than by how long time the team were winning or losing, (3) considering very different levels of play (elite, amateurs, youth players), or (4) not including other situational variables such as match location or the level of opposition. Additionally, considering the effective playing time rather than of the total playing time may provide more precise information about competitive physical demands. 14 , 15 If the period when the ball is out of play (∼35 minutes) is included in data when quantifying match demands, the overall physical demands that players are exposed to may be under-reported. There is also a need to investigate positional differences in match running performance during various score-lines by considering more detailed categories (Central Defenders, External Defenders, Central Midfielders, External Midfielders, and Forwards). 2 , 5 , 14
Consequently, the purpose of the current study was to investigate the influence of score-line and positional role on match running profiles in a large sample of elite soccer players.
Methods
Experimental approach to the problem
Physical performance data from one season of the Spanish La Liga (season 2018–2019, n = 368 matches) were analyzed according to playing position (central defenders, CD; external defenders, ED; central midfielders, CM; external midfielders, EM and forwards, F), score-line (winning, drawing, losing)., team quality (strong or weak), effective playing time and match location home or away).
Subjects
The sample consisted of 4.249 match observations (412 players, 297 matches) from 2018–2019 season of the Spanish first league. Only outfield players who played the full match were considered. In addition, matches that included a player dismissal (red card) were excluded from the final sample (n = 73). Additionally, 10 matches were not provided by La Liga. The players were categorized into five playing positions: CD (n observations = 1.231, n players = 94), ED (n observations = 915, n players = 82), CM (n observations = 1.013), n players = 101), EM (n observations = 1.013, n players = 72), and F (n observations = 578, n players = 67), in line with earlier studies. 2 , 5 , 16 Data was obtained from the Spanish Professional Football League (La Liga), which authorized the use of the variables included in this investigation. Following La Liga's ethical guidelines, this investigation did not include information that identifies football players. The study followed the principles of the Declaration of Helsinki and was approved by the ethical committee of the local University.
Procedures
The TRACAB (ChryronHego VID, New York, NY, USA) multicamera computerized optical tracking system, with a 25 Hz sampling frequency, was used capture the match running performance. The data was processed using the Mediacoach (Mediapro & LFP, Madrid, Spain) software. The system has been shown valid and reliable for the used variables. 17 Five variables were used to capture the match running performance: total distance covered, low-speed running (LSR) distance (0–14 km · h−1), medium-speed running (MSR) distance (14–21 km · h−1), high-speed running (HSR) distance (>21 km · h−1), very HSR (VHSR) distance (21–24 km · h−1), and sprint distance (>24 km · h−1), in line with earlier research. 18
To quantify the impact of winning and losing throughout the match, a win index variable was created by summing the proportion of time the team was winning during the match and subtracting the proportion of time the team was losing (e.g., if a team is winning during 45% of the match, tied during 15%, and losing during 30%, the win index is 0.45–0.30 = 15). The win index of both teams in a match will sum to 0. The theoretical range of possible values spans from −1 to 1, where the minimal value corresponds to a team allowing a goal directly at the start of the match and keep trailing throughout the full match. The maximal value, conversely, correspond to scoring directly, and maintaining the lead throughout the match.
For the difference in quality between confronting teams in a match, the difference in the end-of-season ranking was used (e.g., if the second-placed team play against the eighth-placed team, the ranking difference is 6 for the better and −6 for the worst team). The effective playing time was recorded for each match, defined as the duration of play after subtracting the time taken up by stoppages, substitutions, injuries, and goals. 19 As well as the playing location, if at home or away.
Statistical analyses
Descriptive statistics are reported as mean, standard deviation (mean ± SD) and coefficient of variation in percentage (CV%) for each position and match location. Win index is reported as median and interquartile range (IQR). A multi-level linear model was fitted for each of the match running performance, including win index, playing location, ranking difference, effective playing time, and position as fixed main effects. The interaction between win index and each of the other variables were also included. Player and team were included as random factors. Standardized values of match running performance, effective playing time, win index and ranking differences were used in the model. The models did not show problems of non-normal residuals or heteroscedasticity. For follow-up analyses, contrasts of the estimated marginal means from the full models were used. All analyses were made in R version 4.0.0, and models were fitted with the lmer package. Statistical significance was set at p ≤ 0.05, and 95% confidence intervals (CI) were used.
Results
Descriptive statistics of running variables by playing position and match location can be seen in Table 1, and standardized regression coefficients for all running variables in Table 2. The win index ranges from −0.99 to 0.99. Winning teams had a median win index of -0.45 (IQR = −0.68 – −0.20) and losing teams a median of 0.45 (IQR = 0.20 – 0.68).
Descriptive statistics (M ± SD) of running variables by position and location.
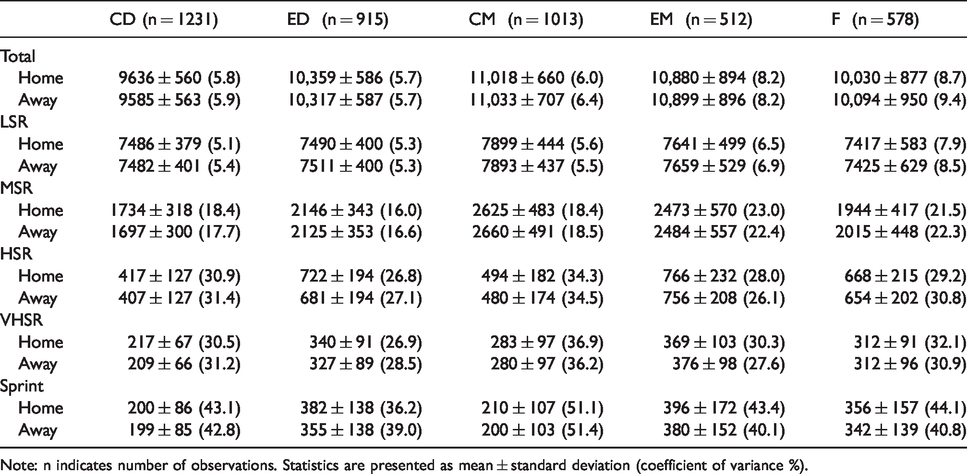
Note: n indicates number of observations. Statistics are presented as mean ± standard deviation (coefficient of variance %).
Standardized regression coefficients.

Note: Reference levels in parenthesis. Eff min = Effective playing time; σ2 = Residual variance.
Score-line
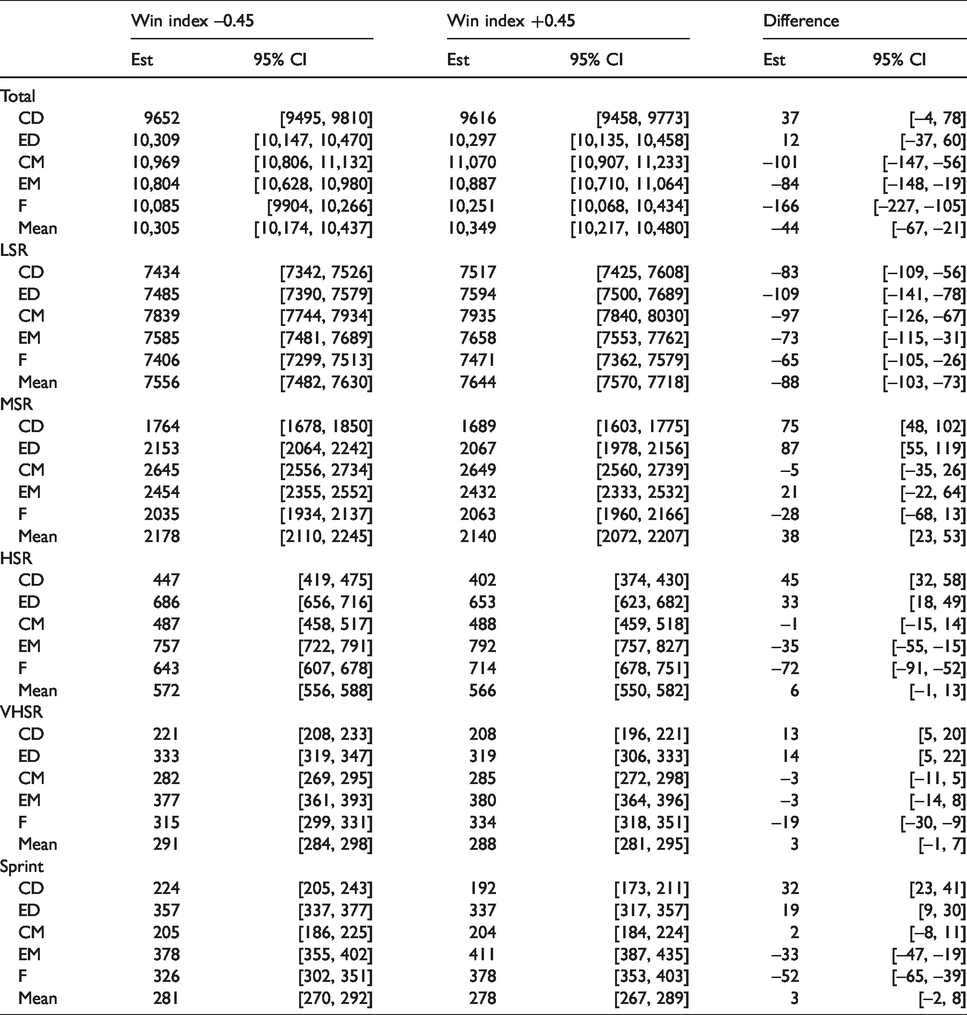
There were significant interactions between win index and position for all match running variables (Table 2). However, this score-line effect depends on the playing position. Defenders (CD and ED) covered longer distance in MSR, HSR, WHSR and Sprint when losing, while attacking players showed the opposite trend. The estimated mean distance covered when the teams were losing (win index = −0.45) and winning (win index = +0.45) half of the match respectively, when accounting for playing location, ranking difference and effective playing time are presented in Table 3. As can be seen, for example, winning 45% of the match increased the distance in Sprint by 16% and 9% for F and EM, respectively compared to losing 45% of the match. However, CD and ED decreased the distance in Sprint by approximately 14% and 7%, respectively. The relationship between win index and distance covered can be seen in Figure 1.
Estimated mean distance covered at win index –0.45 and +0.45 for all variables by position.
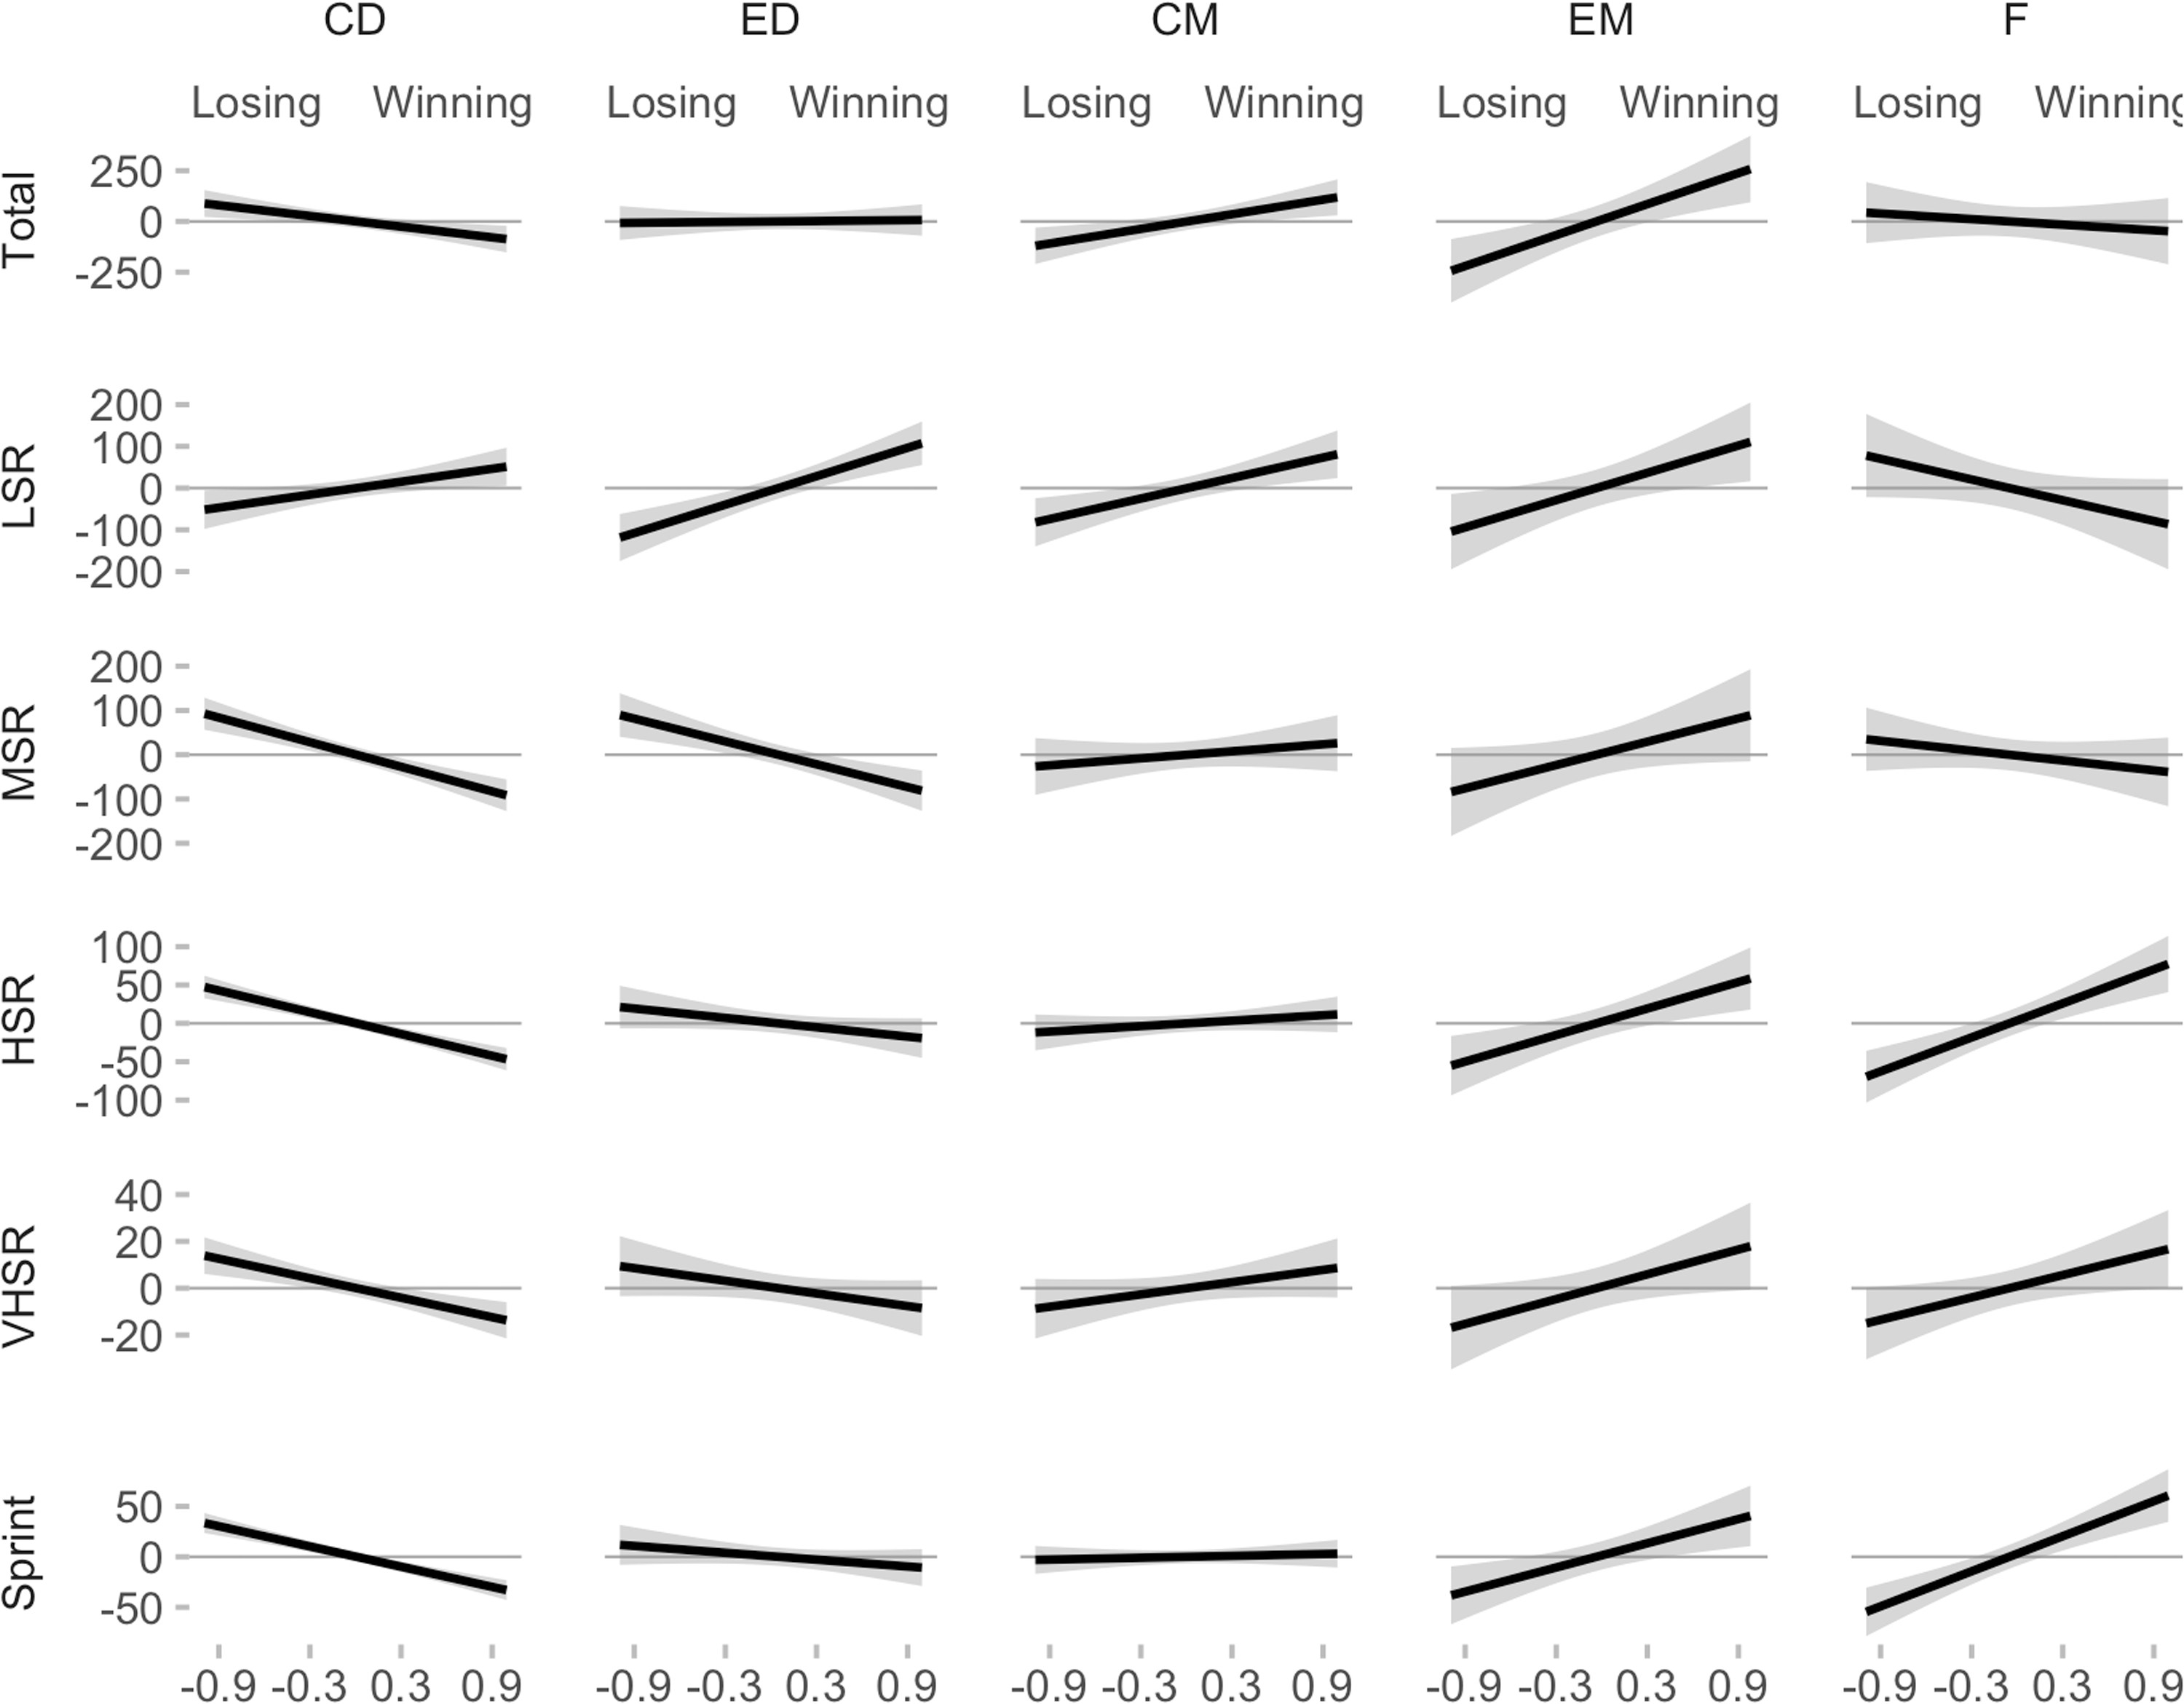
Difference from overall mean of all running variables depending on win index.
Playing location
When playing at home, players covered longer distance in HSR, VHSR and Sprint compared to playing away, when accounting for win index, ranking difference, effective playing time and playing position (Table 2). The players covered shorter distance in LSR and there was no difference in total distance. The interaction between playing location and win index indicate that the longer distance covered in HSR and VHSR was further increased, while the shorter distance in LSR is further decreased when the home team is winning more time in the match.
Ranking difference
A positive ranking difference, i.e., a higher-ranked team playing against a lower-ranked team, was related to a longer distance covered in total, MSR and VHSR, when accounting for win index, playing location, effective playing time and playing position (Table 2). The interaction between ranking difference and win index indicates that when the higher-ranked team is winning more of the match, the players in the higher-ranked team cover longer distance in LSR, and shorter in HSR and Sprint. However, when accounting for main effect of ranking difference, the difference in HSR and Sprint disappears.
Effective playing time
The mean effective playing time for the whole match was 52.3 ± 4.7 min (54.9 ± 5.2% of total time). The mean effective playing time was significantly lower (p < 0.001; d = 0.84) in the second period of the match (25.7 ± 2.7 min, 52.5% of second period total time) compared to the first half (26.6 ± 2.9 min, 57.4% of second period total time). In matches with more effective playing time, players covered a longer distance in total, LSR, MSR, and VHSR; but not in HSR and Sprint, when accounting for win index, ranking difference, playing location and playing position
Discussion
The present study aimed to examine the effect of score-line, match location, difference in team ability and playing position on match running profiles in a large sample of elite soccer players in the Spanish La Liga (n observations = 4.249, matches = 297). Overall, match running performance was highly dependent on the situational variables, especially the score-line conditions. Moreover, the score-line affected players running performance differently depending on their playing position.
Playing position influenced match-running performances. However, the intensity of these effects depended on the score-line. One of the most robust findings within the research literature is the link between playing position and match running performance in elite players.1–3 Our data supports the well-established finding that CM cover a longer total distance than the other playing position and that CD and CM cover a shorter distance in high-intensity running and Sprint than ED, EM and F. 2 , 14 , 20 However, the present study demonstrates that physical indicators are highly dependent on the score-line. In general, losing status increased the distance covered at MSR, HSR, VHSR and Sprint for defenders (Central Defenders and External Defenders). However, attackers (External Midfielders and Forwards) covered a longer distance at those speeds when their team was winning. Central Midfielders covered similar distances independently of the score-line. Indeed, it is commonplace for midfielders to more distance due to their interlinking role between attack and defense within a team. 2 Forwards, on the other hand, have generally been found to cover longer high-speed running and sprint distances than defenders, and in some cases midfielders, in an attempt to capitalize on goal scoring opportunities. 12 , 21 A similar pattern was reported by Bradley and Noakes 11 who found central defenders performed 17% less and attackers 15% more high speed running during matches that were heavily won vs heavily lost (score differential ≥3 goals) and Redwood-Brown et al. 12 More recently, Reedwood-Brown et al. 13 did not found differences between playing positions in high speed running or sprint distance. The lack of sensitivity to the playing positions (only 3 player positions were considered: defenders, midfielders and attackers) maybe the reason for no significant effect of high speed running or sprint distance in the cited study.
Home teams covered a longer distance in MSR, HSR, VSHR and Sprint than visitors when accounting for win index, ranking difference, effective playing time and playing position. These findings support the well-known home advantage effect. 22 Similar results have been provided in other studies. 5 , 23 Even though home advantage in soccer is a well-documented fact, the precise causes and their simple or interactive effects on performance are still unclear. Probably, these results may be linked with the more assertive play of home players and the change of tactical patterns of visitors. 22
The present results suggest that accounting for effective playing time, rather than the total playing time provides more precise information about competitive physical demands. If the period when the ball is out of play is included in data when quantifying match demands, the overall physical demands that players are exposed to may be underreported. For example, evaluations of the time the ball is in play over predefined match periods have indicated that the duration of match interruptions towards the end of a match could impact the match running performance. 14 , 15
We found that, when removing the effect of time winning or losing the match and match location, the higher-ranked teams covered a longer distance in total, MSR and VHSR. However, the effect is small—for example, only 89 m in total distance. Earlier found differences in distance covered between better and worse teams are likely to result from complex interactions between team quality, how much they win, and if they play at home or away. 4 That is, better teams, perhaps, run less because they tend to be winning the matches. In line with the findings of previous studies, the lower the quality of the opponent, the shorter the distance covered by the reference team. 5 , 6
Concerning the limitations of the current study, no control or assessment was made for other confounding match factors, such as mental fatigue, pacing strategies, or tactical considerations. Among the confounding variables that need to be taken into account during the matches played, we assumed that technical abilities, tactical changes, playing formation, match half, type of competition, environmental factors (temperature, humidity, altitude, etc.), and quite probably, several other factors are very important. In addition, these results should be verified in other countries and competitions. 24 Probably, the idiosyncrasy of each league where players or the the style of play adopted by teams may affect the results.
In conclusion, this study shows that the score-line affects the physical performance of soccer outfield players differently, depending on their playing position. Losing status increased the total distance and the covered at MSR, HSR, VHSR and Sprint by defenders, while attacking players showed the opposite trend. Moreover, home teams covered a longer distance in MSR, HSR, VSHR and Sprint than visitors. Finally, the current study suggests that accounting for effective playing time, rather than the total playing time provides more precise information about competitive physical demands. These findings may help coaches and managers to better understand the effects of situational variables on physical performance and could be used to develop a model for predicting the physical activity profile in La Liga.
Footnotes
Declaration of conflicting interests
The author(s) declared no potential conflicts of interest with respect to the research, authorship, and/or publication of this article.
Funding
The author(s) received no financial support for the research, authorship, and/or publication of this article.
