



Abstract
Time constraints often result in the challenge to fit desired programming into training time allotments. Wearable resistance (WR) may be an option to optimise the training content in function of constrained training time. The purpose of this study was to determine the effects of a lower-limb WR sprint running training intervention on athlete speed capabilities following a nine-week off-season, low volume training period within a sample of American football high school athletes. Nineteen athletes completed pre- and post-intervention testing of two maximal effort 30 m sprints. Horizontal force-velocity mechanical profiling variables, sprint times, and maximal velocity were calculated from sprint running velocity data collected by a radar device. The athletes completed seventeen dedicated sprint training sessions during the off-season. The intervention (WR) group completed the sessions with 1% body mass load attached to the shanks (i.e. 0.50% body mass load on each limb). The control group completed the same training sessions unloaded. Post-intervention, no statistically significant between group differences were observed (p > 0.05). However, athletes in both groups experienced increases in velocity measures following the sprint training. The greater adjusted mean theoretical maximal velocity scores (p > 0.05; ES = 0.30) found for the WR group compared to the control group at post-intervention may suggest that WR amplifies the nuances of the training protocol itself. Coaches can consider using lower-limb WR training to increase in-session workloads during periods of low volume training but more research is needed to better understand to what extent WR training might provide an added value to optimise both the training content and planning, as well as the athlete’s training response in order to improve sprint running performance.
Introduction
Coaches and strength and conditioning practitioners are often faced with training time constraints resulting from athlete schedules, organisation rules, and priority of concurrent tactical and technical training. This results in a challenge to fit the desired strength and conditioning programming within the allotted training time frames and often compromises aspects of the programming. To address this challenge, it is imperative to fully optimise the allotted strength and conditioning training time. 1 How to accomplish this varies based on the season within the athletic calendar as time constraints change and must be balanced against the foci of the season itself. For example, the NCAA Division I Athletics programme only allows 20 hours a week of countable athletically related activities during the in-season 2 and lower level sporting groups may only hold three 75 minute training sessions a week in the off-season (e.g. high school football). During the off-season, the focus of the strength and conditioning training is to develop multiple fitness qualities (e.g. strength, metabolic endurance, speed) while during the in-season, the focus is on the development of expressing these fitness qualities within sport-specific practice. Ultimately, when coaches and strength and conditioning practitioners are presented with the need to optimise reduced strength and conditioning training time, two smart options to do so include: 1) closely match the training to the technical demands of the sport; and/or, 2) increase within-session workloads.
Wearable resistance (WR) is a training modality that can be used to accomplish these options.3–6 This has mostly been applied to the lower-limb by attaching an external load, as little as 0.5% body mass (BM), onto the athlete’s thigh and/or shank allowing them to perform the movement task of interest under resistance. This makes training with lower-limb WR particularly applicable for matching the technical demands of linear and multi-directional sprint running for field-based sports and track and field athletes and has been suggested as a tool to improve speed performance.3,4,6 With lower-limb WR, the athlete can train under resistance at high movement velocities while performing sprint running or related technical drills thus maintaining a high level of specificity to closely match the involved muscles, contraction speeds, and joint ranges of motion of the movement task of interest, e.g. sprint running. Given this, it seems that lower-limb WR offers a high level of training specificity to optimise the transference of any strength and metabolic improvements to sprint running performance. 7 However, the utility of WR within programmes that have time constraints placed upon them is unknown.
Lower-limb WR can also be used to increase the within-session workload by performing the prescribed movement tasks with the added limb load at or near the same movement velocity. 3 This increases the mechanical, and therefore muscular, work requirements to perform the movement tasks.8,9 The increases in muscular work that coincide with the addition of the lower-limb WR produce an increased metabolic cost of performing the movement task. 9 Using lower-limb WR during running has therefore been reported to increase oxygen consumption and heart rate, and these metabolic and mechanical changes are increased when load magnitude increases or placement becomes more distal on the limb. 8
Research on longitudinal outcomes of lower-limb wearable resistance training (WRT) for sprint running with athletes is limited to two randomised control longitudinal studies and one single subject case study completed to-date. When 200-600 g of shank WR was used during the warm-up of pre-season training sessions for 16 − 18 year-old provincial level soccer players, the WRT was found to be more effective in reducing 10 m and 20 m sprint times compared to completing the warm-up with no WR following an 8-week training cycle. 10 In the second longitudinal study, when 1% body mass (BM) shank WR was used during sprint-specific training sessions with collegiate and semi-professional rugby athletes, the WRT was found to be more beneficial in maintaining baseline sprint performance measures compared to the control group which wore no WR during the training and experienced significant detraining of performance variables over the 6-week pre-season training period. 11 Lastly, introducing 2% BM thigh WR into a recreational athlete’s sprint training regime substantially improved 40 m sprint times after a 5-week training period. 12 These findings provide evidence that the adaptations from lower-limb WRT transfer to sprint running performance10,12 and help retain fitness qualities that detrain with inadequate training frequency. 11 This further suggests that lower-limb WR is a viable training option to optimise the strength and conditioning training time allotments.
While researchers have started to uncover the effects of lower-limb WRT with athletes, further information on how athletes respond to WRT interventions and what is the minimal worthwhile dose to elicit particular fitness qualities is necessary for coaches and strength and conditioning practitioners to better understand how to incorporate WR within their training programmes. In particular, it is of interest to further understand how to capitalise on the benefits of WRT to influence athlete speed capabilities during periods of constrained training time. Therefore, the purpose of this study was to determine the effects of a lower-limb WR sprint running training intervention on athlete speed capabilities following a nine-week off-season, low volume training period for American football high school athletes. We hypothesised that the WRT would decrease sprint running time, increase velocity, and increase the horizontal force-velocity mechanical variables beyond the changes seen from training with no WR.
Methods
Participants
Twenty-five athletes volunteered to participate in this study and were all members of the same American high school football team. Inclusion criteria required athletes to have a minimum of one year of resistance training experience, be currently training, and be categorised as position player other than an offensive or defensive lineman. Athletes were excluded if they were under the age of 16, had a current or previous lower extremity injury that may be further aggravated by participating in the training or did not pass the Physical Activity Readiness Questionnaire. After attrition due to failure to attend post-testing (2), unrelated injury (1), or drop out from the team programme (3), nineteen athletes completed the study. Eight athletes completed the unloaded training intervention, i.e. control group (age = 16.3 ± 0.46 years, mass = 69.3 ± 7.16 kg, height = 177 ± 6.92 cm) and eleven athletes completed the WR training intervention (age = 16.6 ± 0.50 years, mass = 76.5 ± 4.60 kg, height = 183 ± 5.18 cm). Training programme adherence was above 80% for all athletes included in the results. All study procedures were approved by the host University Institutional Review Board.
Performance testing
The athletes reported to an indoor fieldhouse to complete the pre- and post-intervention performance testing. Each testing session started with a warm-up protocol consistent with the athletes’ typical practice session preparation. Following this, each athlete completed two maximal effort 30 m sprints, separated by a minimum of five minutes of rest. Each sprint was performed from a two-point, split stance start position, and was initiated by the athlete when they felt ready. A radar device (Stalker ATS II, Applied Concepts, Dallas, TX, USA) was used to measure athlete velocity at 47 Hz. The radar was positioned 5 m directly behind the starting position and at a vertical height of 1 m to approximately align with the participant’s centre of mass. 13 STATS software (Version 5.0.2.1 Stalker ATS II, Applied Concepts, Dallas, TX, USA) was used to collect all data.
Training intervention
The sprint training occurred in tandem with an off-season training block in which the athletes reported to three practice sessions a week. Each session started with a twenty-minute warm-up period that included skipping and hopping sprint running drills completed at a moderate intensity (four drills in total, each completed 2 × 30 m). After the warm-up, the athletes participated in the sprint training session that was followed by a weight training session. The athletes were match-pair randomised into the WR and control groups using the pre-intervention 30 m sprint times (control group baseline sprint times = 4.91 ± 0.24 s and WR group baseline sprint times = 4.87 ± 0.30 s) measured by an automatic dual-beam timing system (Swift Speed Light, Swift Performance Equipment, Wacol, Australia). The WR group completed two of the three weekly sprint training sessions with 1% body mass (BM) load attached to the shank with a specialised compression garment (Lila™ Exogen™ Compression Calf Sleeves, Sportboleh Sdh Bhd, Malaysia). Due to the loading increments available (200 and 300 g), exact loading magnitudes ranged from 0.87–1.11% BM. The load was applied at the start of the warm-up period and not removed until the end of the training session. The load placement progressed through the training block from a proximal shank location to mid-shank and finished at a distal shank location to provide a progressive overload. The load placement and magnitude was chosen to be consistent with previous research. 11 A summary of the training sessions and WR placement protocol are listed in Table 1. An image of the load placements can be found in Figure 1. The control group completed the same sprint training, but without the addition of any WR or compression garments. There were some weeks in which a practice session was cancelled due to weather or a public holiday. For these weeks, the training sessions that included WR for the WR group were prioritised over the third training session of the week that did not include WR, with the control group completing the same training as the WR group but unloaded. Some training sessions for the WR and control groups included resisted sprints, meaning the WR group wore the WR while doing resisted sprints. A Run Rocket (Runrocket, San Antonio, Texas, USA) was used for the resisted sprints with a moderate level of resistance (one that would approximately double 20 m sprint times) maintained on this throughout the training study.
Training programme followed by both groups.a
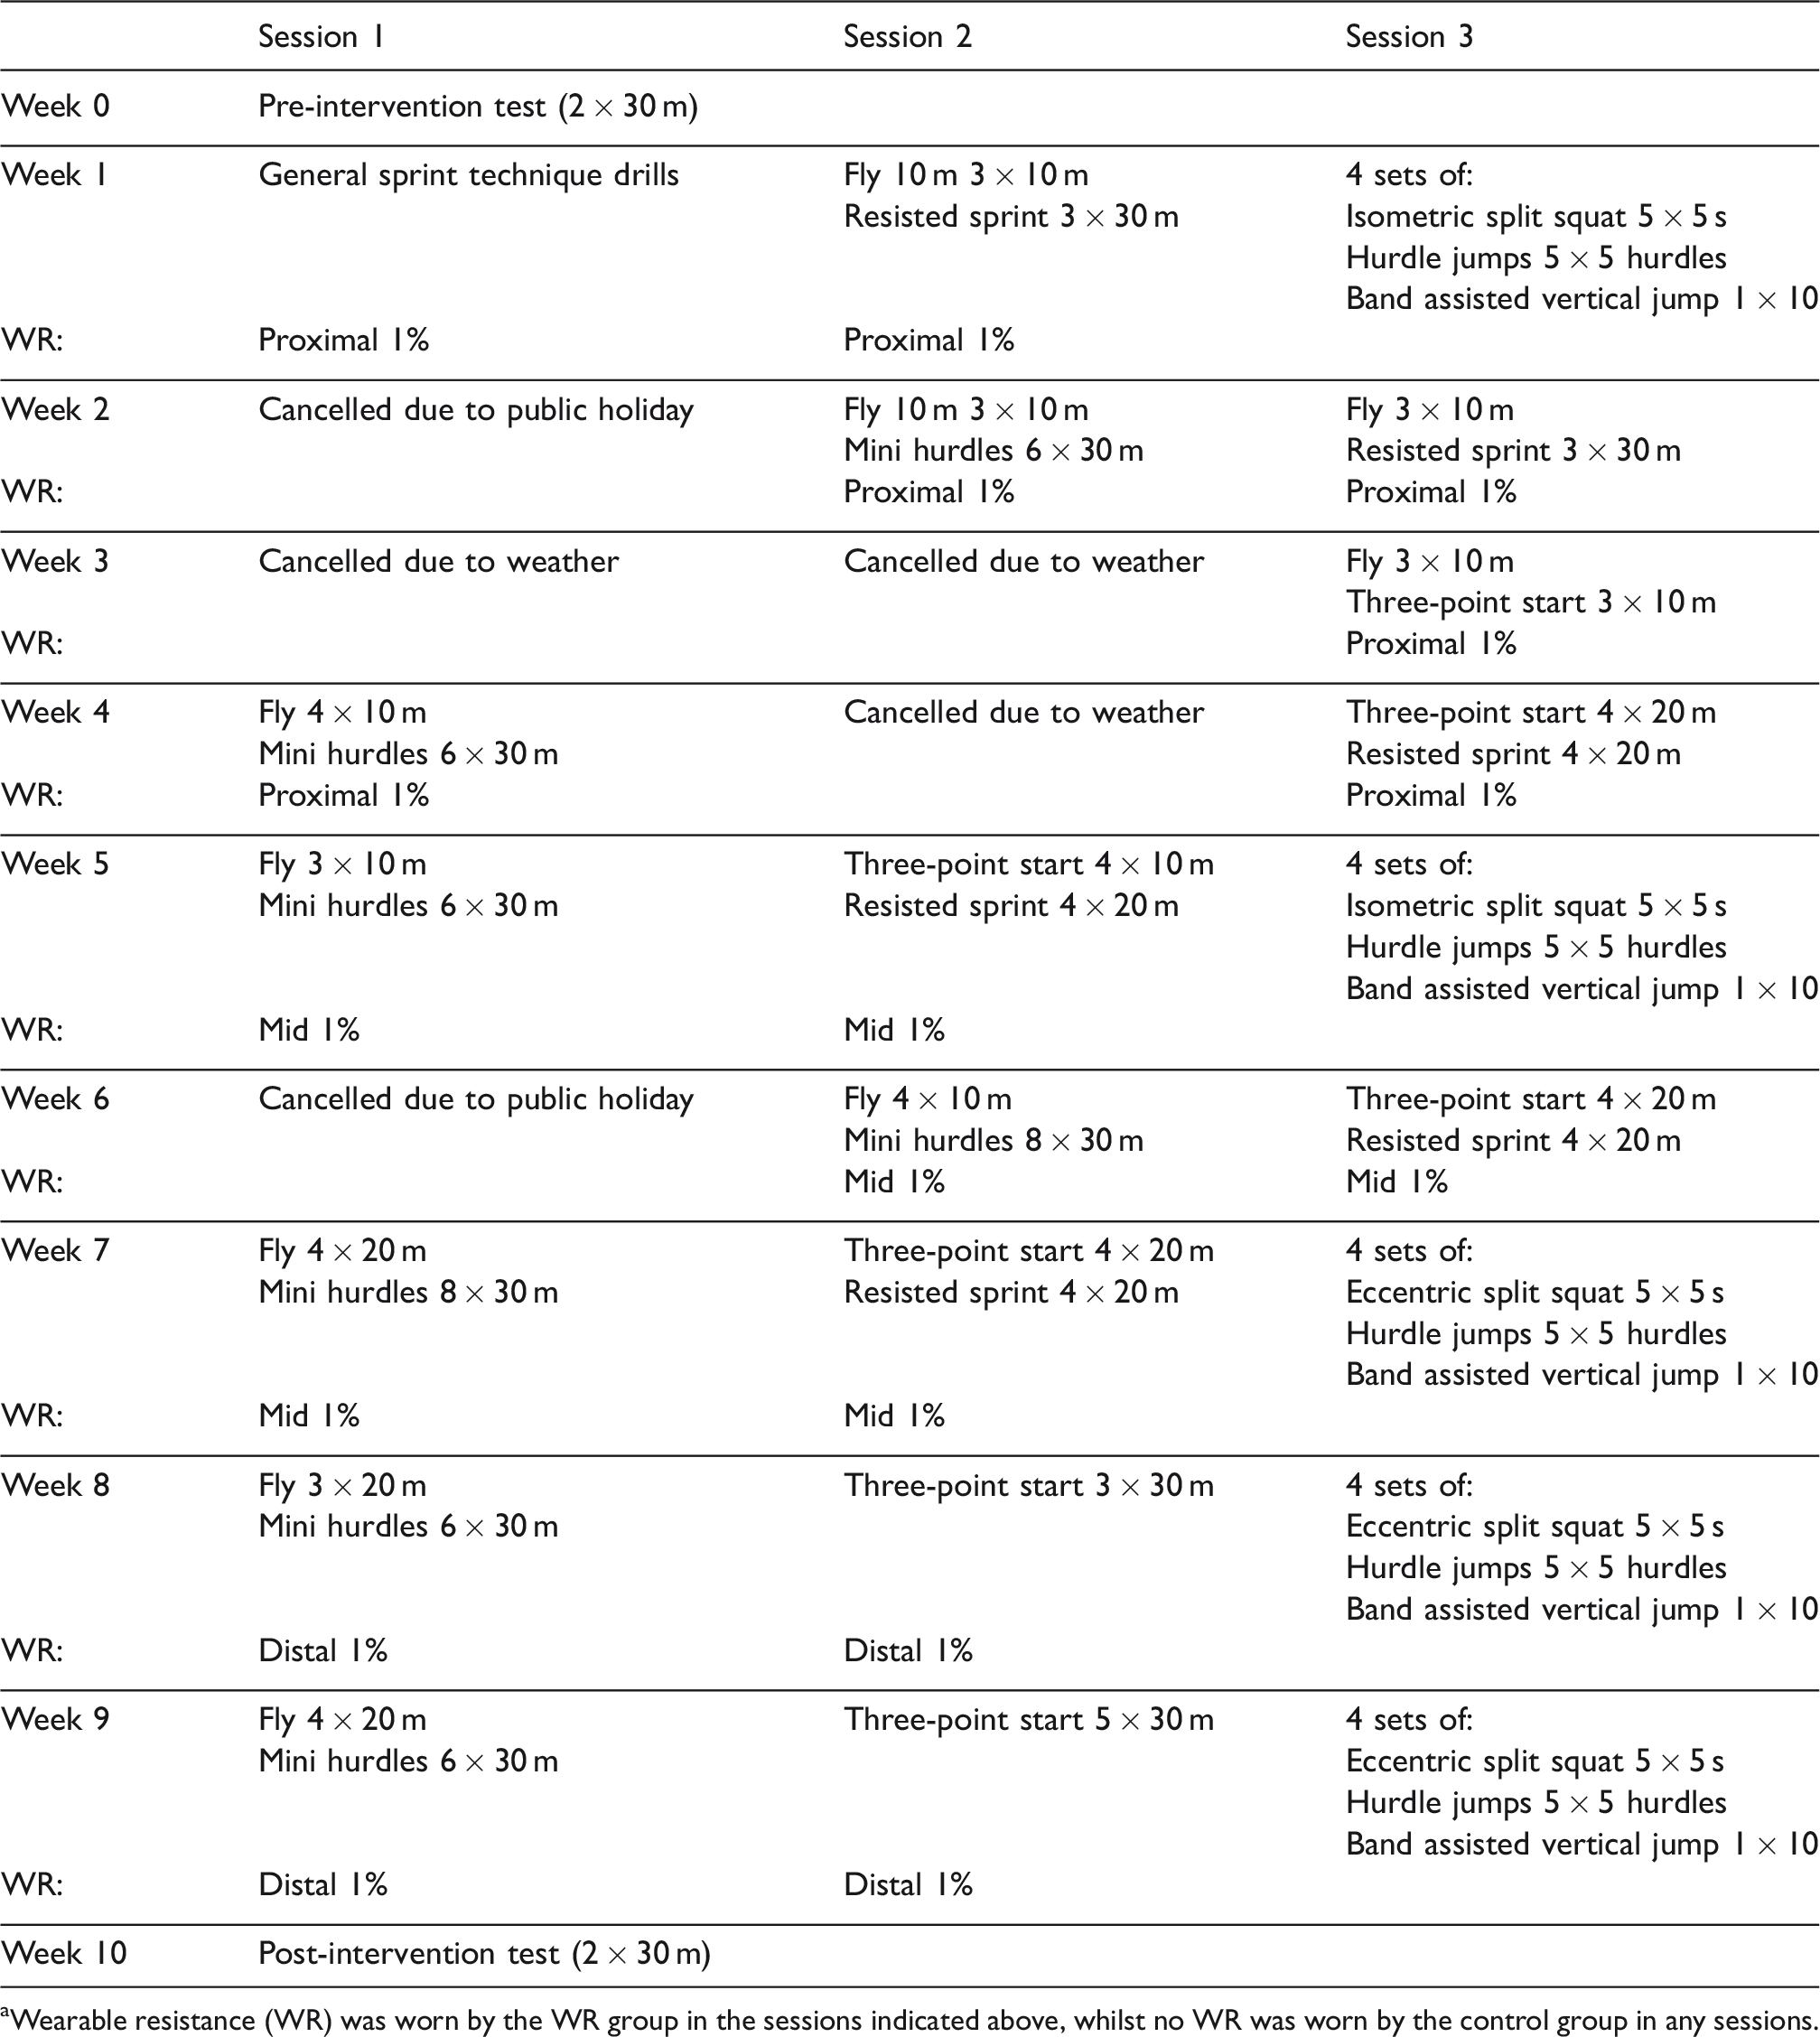
aWearable resistance (WR) was worn by the WR group in the sessions indicated above, whilst no WR was worn by the control group in any sessions.
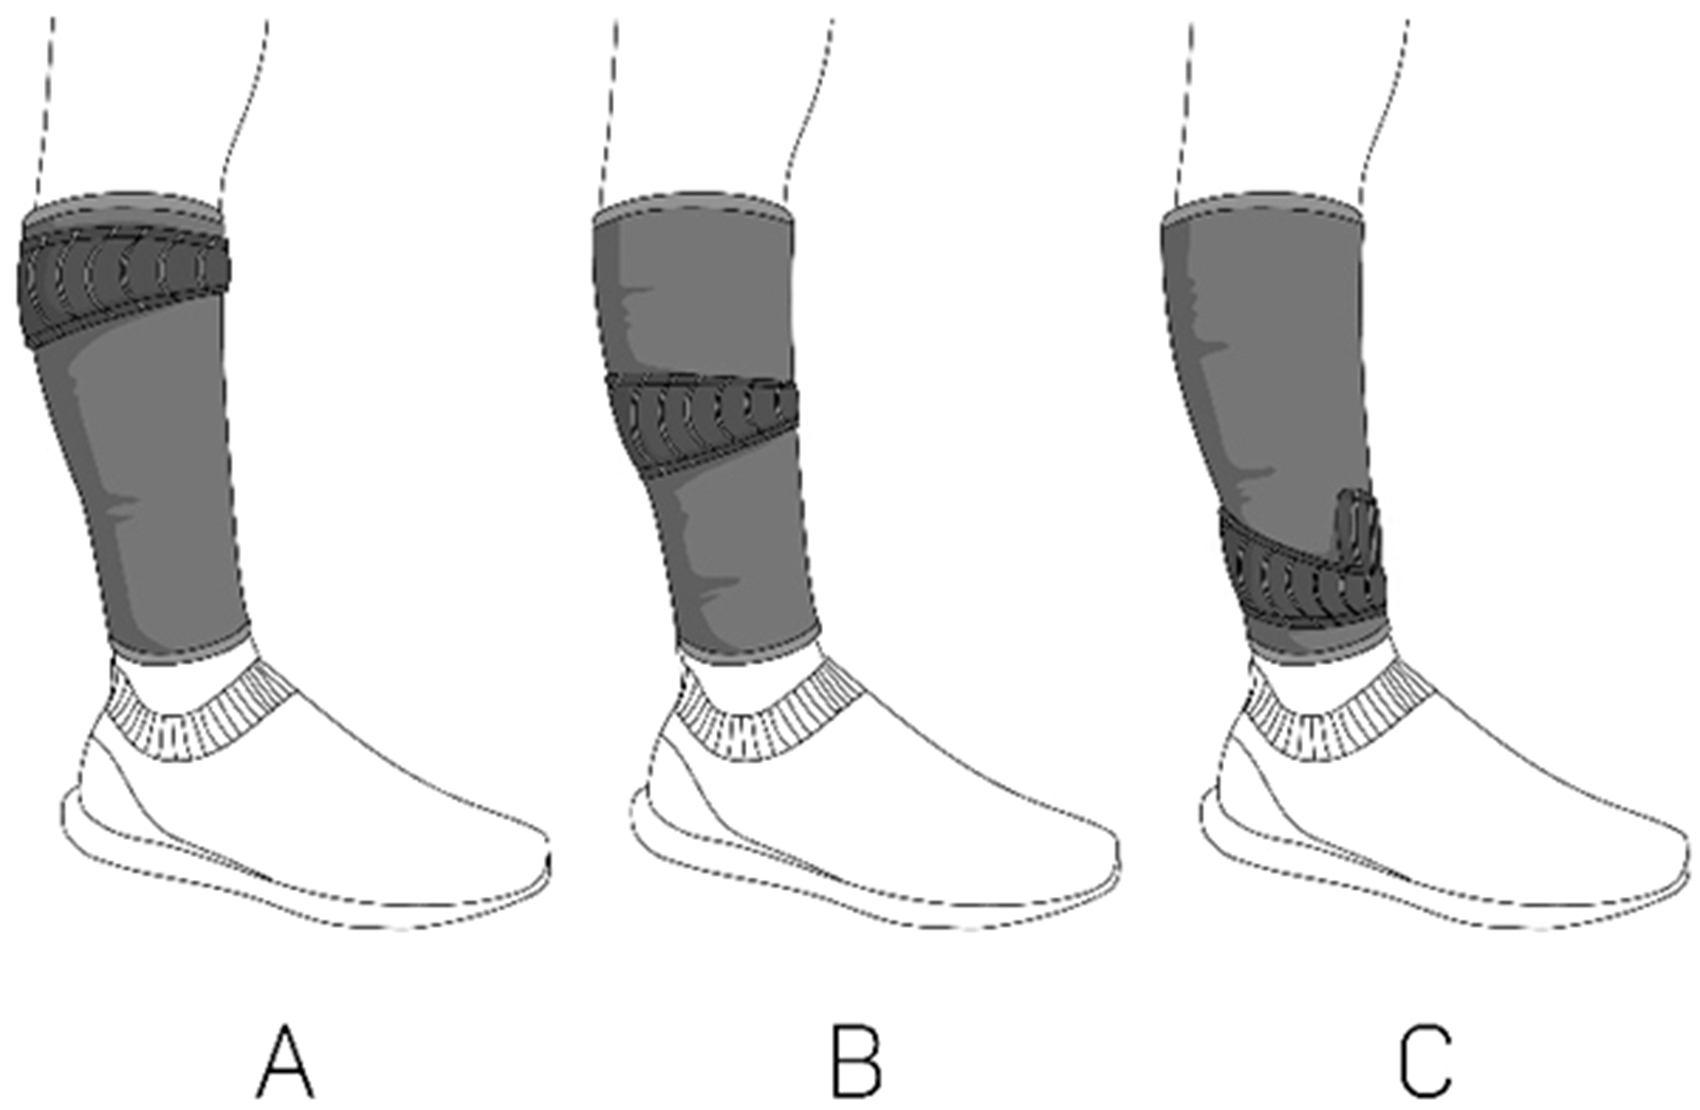
Wearable resistance placements. A: proximal, B: mid, C: distal.
Data analysis
To produce a profile of the athletes’ sprint running capabilities at the pre- and post-intervention time points, the velocity-time data collected were processed to calculate horizontal force-velocity mechanical variables. All processing was done in a custom-made MATLAB script (MATLAB R2019b, The MathWorks, Inc., Natick, Massachusetts, USA). Questionable data around movement onset 14 was removed by applying a 10-sample rolling average to the raw velocity-time data and identifying where the athlete reached 1.5 m/s. The raw velocity-time data from this point onwards was then fit with a mono-exponential function to model the centre of mass velocity of the athlete as a function of time. The procedures utilised are extensively outlined in Samozino, Rabita. 15 To best fit the mono-exponential function given the uncertainty in where the true movement onset occurred, movement of this function in the time domain was permitted in the model-fitting operation. 14 This produced theoretical velocity-time data beginning at 0 m/s at t = 0 s, and ending at the estimated 30 m end-of-sprint. Outlier samples in the raw velocity-time data were then identified by a residual function which removed data points ≥ ± 2 × standard deviations of the residual. The mono-exponential function was then fit again to the remaining data to obtain the final modelled velocity-time profile. Two athletes clearly showed a reduction in velocity before reaching 30 m during the pre-intervention testing. The velocity-time data for their trials was manually trimmed at the end of the velocity plateau prior to data analysis. This resulted in a n = 7 for the control group and n = 10 for the WR group for the 30 m sprint time dependent variable as the modelled data for these two athletes did not reach 30 m. The final mono-exponential modelling of the velocity-time data was well fit to the raw data with an average r2 = 0.97 and all r2 > 0.94.
To describe the general mechanical ability to produce horizontal external force during sprint-running the individual linear force-velocity (F-v) profiles were computed. 15 From this, a series of variables were used to describe the mechanical capabilities of the lower limbs: theoretical maximum velocity (V0); theoretical maximum horizontal force (F0), peak power (Pmax), maximal ratio of forces (RFmax), and index of force application (DRF). 16 These mechanical profiling variables, along with sprint split times (5, 10, 20 and 30 m), maximal velocity of the modelled sprint (Vmax) and slope of the F-v profile (SFV), were calculated consistent with the method previously validated.15,17 To represent athlete performance at a given testing timepoint, the calculated variables from the two trials were averaged.
Statistical analysis
Means and standard deviations were calculated to represent centrality and spread of the dependent variables. The differences between the pre- and post-intervention measures for both groups were normally distributed (assessed by Shapiro-Wilk’s test, all p > 0.05) and no outliers were present (assessed by inspection of a boxplot). To describe individual responses to the training intervention, the smallest worthwhile change (SWC) was calculated as 0.2 × pre-intervention between-subject standard deviation. The individual training responses were then classified as an increase (> + SWC) or decrease (> − SWC) for each dependent variable if the individual change from the pre-intervention measure was outside of the SWC threshold, and a trivial change if it remained within the SWC. 18
To compare the control and WR group responses to the sprint training, a one-way analysis of covariance (ANCOVA) was conducted on post-intervention dependent variables with pre-intervention measures as the covariate.19,20 Evaluation of the homogeneity of regression slopes assumption found that the relationship between each covariate and dependent variable was not significantly different between groups (p > 0.05). Standardised residuals for the interventions and overall model were normally distributed, as assessed by Shapiro-Wilk's test (p > 0.05). There was homoscedasticity and homogeneity of variances, as assessed by visual inspection of a scatterplot and Levene's test of homogeneity of variance (p > 0.05), respectively. There were no outliers in the data, as assessed by no variables with standardised residuals greater than ±3 standard deviations.
All data presented are unadjusted unless otherwise stated. Analyses were performed using SPSS Statistics (Version 25, IBM, Armonk, NY, USA). Significance was set at p ≤ 0.05. Effect size (ES) statistics (Cohen’s d) were calculated and described as trivial (<0.20), small (0.20), moderate (0.50) and large (0.80). 18
Results
Mean, standard deviation, and individual training response for the sprint running time, speed, and horizontal F-v mechanical variables are presented in Table 2. The majority (≥50%) of the athletes in both groups were found to increase V0, SFV, DRF, Vmax, 5 m, 10 m, and 20 m times and decrease F0, Pmax, and RFmax over the training period. The pre- and post-intervention F0 and V0 results for each individual are presented in Figure 2.
Pre- and post-intervention mean and standard deviation measures with individual training response classification.

C: control; WR: wearable resistance.
aIndividual training response identified as an increase or decrease from pre-intervention measure using smallest worthwhile change threshold (i.e. > ± 0.20 × pre-intervention between subject SD).

Pre- and post-intervention theoretical maximal horizontal force (F0) and theoretical maximal velocity (V0) for the athletes in the wearable resistance group (solid black line) and control group (dashed grey line). A filled in circle at post means the training response was greater than the smallest worthwhile change.
The results of the ANCOVA, used to determine differences between groups on post-intervention measures, are reported in Table 3. After adjustment for pre-intervention measures, small (non-significant, p > 0.05) effects were found for all variables except Vmax (ES = 0.09).
Adjusted mean difference scores for post-intervention measures with pre-intervention measures as a covariate with results of the one-way ANCOVA for between-group p value and effect size statistics.
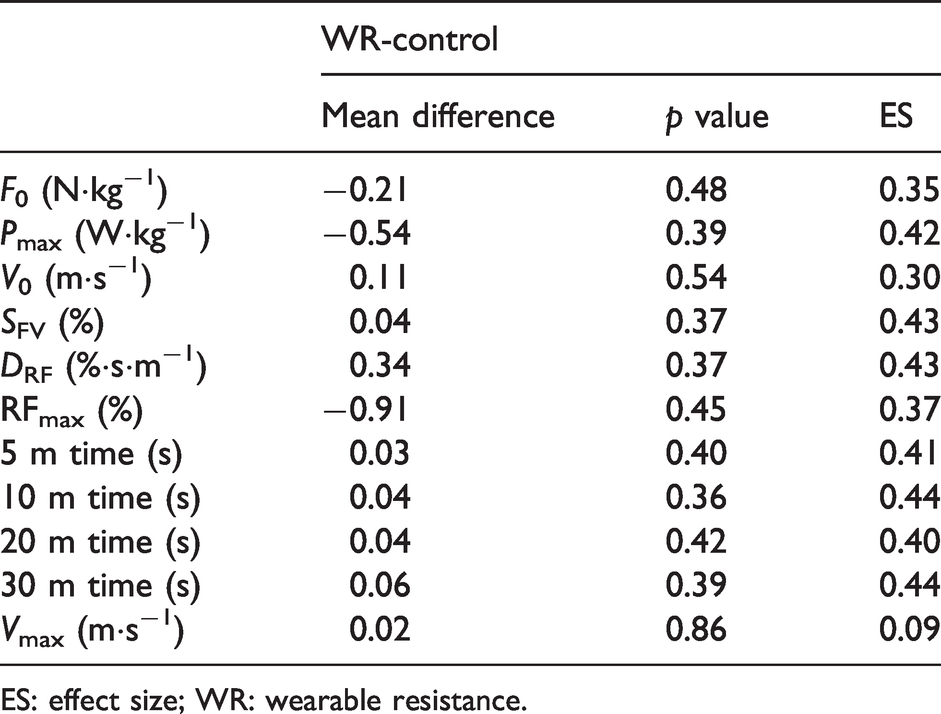
ES: effect size; WR: wearable resistance.
Discussion
This study determined the effects of a lower-limb WR sprint running training intervention incorporated into a nine-week off-season, low volume training period for American football high school athletes. Our hypothesis was unsupported as there were no statistically significant between group differences observed. However, there were other findings of practical significance worthy of discussion. The main findings were: 1) WRT used in this study did not produce significant improvements in sprint running time, velocity, or horizontal F-v mechanical variables as compared to unloaded training; and, 2) the sprint training programme produced increases in velocity measures beyond the SWC for the majority of athletes.
For a sprint training protocol to produce positive adaptations in performance, the protocol must include adequate recovery time, training frequency, and total training volume. 21 The detraining of several variables that occurred for athletes in both groups suggests that recovery time was inadequate or the training protocol failed to provide the minimum stimulus necessary to maintain or improve performance. Although the athletes in WR group did not experience significant improvement in sprint performance measures beyond changes seen in the control group, they did complete a greater off-season training workload by completing the same sprint training prescription with an external load. Additionally, this greater training workload was highly movement- and velocity-specific to the technical demands of the task. A factor that may have influenced the lack of transfer of the resistance training to sprint running performance was, in fact, this higher training workload experienced by the athletes in the WR group. We received feedback from the coaching staff mid-intervention that stated consistent identification of in-practice fatigue indicators for the WR group. In this instance, a decision was made to delay the progression of the WR location from proximal to mid by one week to week five, as reflected in the study timeline (Table 1). It may be that the inclusion of the WR during the corresponding warm-up sessions induced an accumulation of fatigue throughout the intervention, in which the athletes were unable to recover by post-intervention testing. An advantage of WRT is that the athlete can complete a relatively higher training load in the same amount of time but this must not come at a compromise to recovery. Additionally, no offloading or tapering period was used in this study. Short tapering time frames (e.g. 1 − 2 weeks) have been shown to maximise the training response of sprint running performance.22,23 It is unknown if the response to the WRT peaked after the post-intervention test occurred.
In sprint running, the F-v relationship is used to identify an athlete’s horizontal force production abilities from zero to theoretical maximal velocity and these abilities are represented by the F-v profile with the F0 and V0 values representing each end of the spectrum. While the optimal profile balance and relative magnitude of each component of the F-v relationship are currently unknown for sprint running,24,25 determining athletes’ F-v profiles can be useful to identify individual mechanical capabilities relative to group norms, detect changes that occur over time, and understand adaptations to specific training stimuli. In this study, 16 of the 19 athletes across both groups experienced a positive training response in V0 (quantified by the SWC threshold), indicating an improved ability to produce horizontal force at higher velocities. Considering the majority of athletes in both the WR and control group responded with positive V0 changes, this suggests the training programme itself was successful in influencing the velocity end of the F-v spectrum.
In this study, it is possible that the WRT provided a superior velocity-oriented stimulus as compared with unloaded training, as greater adjusted mean V0 scores (p > 0.05; ES = 0.30) from the ANCOVA were found for the WR group at post-intervention testing. This contrasts with findings of a previous study where the WR group did not experience a significant change in V0 measures following the use of the same shank WR intervention over a six-week time frame while the control group that completed the same sprint training with no WR did. 11 In that instance, the training protocol utilised in Feser, Bayne 11 appears to have emphasised repeat sprint ability by including upwards of 22 repetitions in a single training session. This leads to the possibility that the WR group completed the large volume of sprint running at slower sprint speeds than their control group counterparts resulting in less of an influence in the velocity measures of interest. Instead, early acceleration specific measures (i.e. F0 and RFmax) were positively influenced beyond that of the control group. 11 Taken together, it can be suggested that WR may amplify the nuances of particular sprint running training protocols. However, further understanding is needed to better determine how to optimise WR programming to complement the goals of training.
Faster sprint running acceleration is related to an athlete’s ability to apply large forces to the ground, to orient the force vector in a more horizontal direction, and to maintain the horizontal force vector orientation with increasing speed.16,26,27 An athlete’s acceleration specific strength capacity and technical abilities can be quantified with the measures F0, RFmax, and DRF. The majority of the athletes in this study decreased F0 (16 out of 19 athletes) and RFmax (12/19) and increased DRF (17/19) following the sprint training and subsequently increased in sprint times as indicated by the number of training responses greater than the SWC thresholds (≥ 58.8% of all athletes). Although an increase to DRF could be interpreted as a technical improvement, i.e. a less steep decline in ratio of force with increasing speed, the athletes simultaneously decreased RFmax and increased Vmax. This global change to sprint performance impacted DRF and, instead, suggest ratio of force was lower at almost all speeds post-intervention testing. This may be further evidence of how this training program influenced the F-v spectrum. It appears the improvements to the velocity end of the spectrum came at a cost to the force end of the spectrum for the majority of the athletes. It should also be noted that the between-group comparison of the adjusted post-intervention measures showed the WR group to have lower F0 and RFmax values and higher DRF. Although the differences between the groups were small and not significant (p > 0.05; ES = 0.37 − 0.43), this reiterates the suggestion that WR amplifies the nuances of the training protocol itself.
Also, it is possible that the changes in F0, DRF, and RFmax and subsequent increase in sprint times for WR group athletes were related to the athletes’ initial F0 levels, per the hypothesis that an athlete’s response to different sprint running training modalities may be contingent on their initial F-v profile.28,29 This has been shown in professional rugby players, where it was reported that the magnitude and direction of the training response to two different sprint training modalities were related to the initial F-v properties of the individual athletes.
23
In our study, the athletes with higher initial F0 values tended to experience larger decreases in F0 at post-testing. Specifically, three of the four athletes with the highest initial F0 values experienced the largest decreases in F0 over the course of the study (each > −20.0%; Figure 2). If the response to the sprint training programme was directly influenced by the initial F0 value, the training programme itself may have overshadowed any adaptation from the WRT at the force end of the F-v spectrum for the athletes with higher initial F0 values. Previously, lower-limb WRT for sprint running has been shown to produce a positive adaptation or be related to maintaining F0 even with initial values higher than that seen in this study (8.09 N·
Research on the longitudinal effects of lower-limb WRT for short-distance sprint running is in its infancy. While its use as a training modality is well supported from a theoretical basis, continued investigation within practical athlete training settings is necessary for coaches and strength and conditioning practitioners to further understand how to optimise the benefits of WRT to influence athlete speed capabilities. Future research should consider how to best quantify the overload associated with WRT which may help inform programming decisions. This would lead to a better understanding of how the external workload prescription may need to be adjusted when using WRT (i.e. less sets and/or repetitions) compared to unloaded training. Until then, coaches and strength and conditioning practitioners can also consider employing alternative methods to adjust workloads during a WRT session such as reducing sprint distances, alternating between loaded and unloaded repetitions, or selecting particular drills to overload. This would still allow for an increased within-session workload to optimise strength and conditioning training goals within specific time periods while maintaining sensitivity to the pre-requisite individual- or group-based recovery times.
Practical applications
As coaches and strength and conditioning practitioners look to find efficient and specific training modalities to increase sprint running speed, lower limb WRT holds logical potential to accomplish these needs. Given the results of previous shank loading WRT studies, it was expected that WRT would provide a training benefit over and above unloaded training. The WRT used in this study did not produce significant differences from unloaded training for sprint running time, velocity, or horizontal F-v mechanical variables. However, athletes in both the WR and control groups experienced increases in velocity measures, and the greater adjusted mean V0 scores (p > 0.05; ES = 0.30) found for the WR group may suggest that WR amplifies the nuances of the training protocol itself. However, it should be noted this increase to the velocity end of the F-v spectrum came at a cost to the force end of the F-v spectrum as lower F0 and RFmax scores were found for the WR post-training. Coaches can consider using lower-limb WRT to increase in-session workloads during periods of low volume training but should be cognisant of the potential for fatigue accumulation due to the relatively higher training load inherent with WRT. Further research is needed to better understand how to programme WRT to influence individual athlete mechanical capabilities to improve sprint running performance.
Footnotes
Declaration of Conflicting Interests
The author(s) declared the following potential conflicts of interest with respect to the research, authorship, and/or publication of this article: John Cronin is Head of Research for Lila but was blinded from data and statistical analyses and writing of this manuscript. His participation was limited to methodological design and final proofing. The remaining authors report no conflicts of interest.
Funding
The author(s) disclosed receipt of the following financial support for the research, authorship, and/or publication of this article: Global Sport Institute at Arizona State University.
