
Abstract
When competing in road races, runners enter starting corrals long before the starting gun triggers. Athletes consequently must complete warm up routines well in advance of race commencement. To optimize performance readiness warm up intensity may need altered to account for the prolonged time between warm up and performance. This study tested the effectiveness of various warm up intensities on 1600 m run performance given a 20 min separation between warm up and time trial, and assessed the physiological bases for performance outcomes. In a randomized, crossover design, 14 athletic men and women [(age (mean ± SEM) = 22 ± 1 y; V·O2peak = 50.3 ± 2.5 ml·kg−1·min−1] completed three warm up routines (light-, moderate-, or high-intensity warm up), rested for 20 min, and ran a 1600 m time trial. Warm up procedures were evaluated for their influence on performance, blood lactate, V·O2, and alterations to neuromuscular function. Time trial performance was significantly faster (P < 0.03) following a moderate-intensity warm up (6:12 ± 18 min:s·1600 m−1) compared to a light-intensity warm up (6:30 ± 18 min:s·1600 m−1). Performance following the high-intensity warm up (6:18 ± 24 min:s·1600 m−1) fell between the light and moderate conditions. When stratified based on starting lactate concentrations, 1600 m performance was optimized when pre-time trial lactate was 2.0–4.9 mmol·l−1. When a prolonged rest separates warm up exercise from time trial performance, warming up remains efficacious. Optimal warm up intensity may be identified using starting lactate as a gauge for performance readiness.
Introduction
Each year, tens of millions of runners compete in professional or recreational road races (runningusa.org). These athletes are oftentimes ushered to starting corrals well in advance of race commencement. Due to space restrictions, athletes must complete warm up routines prior to entering the corrals—perhaps 20 min in advance of race initiation. To optimize performance readiness then, warm up logistics may need altered to account for the prolonged time between warm up and performance.
Traditional guidelines state that warm ups should be performed at a light-to-moderate intensity, enabling physiological adjustments to the demands of exercise while avoiding fatigue. 1 , 2 Such recommendations assume that exercise will be performed within 5 min of warm up termination. 1 If recovery time exceeds this period, recommendations for warm up intensity may require modification. Although traditional warm up protocols warn that intense exercise prior to performance could result in fatigue, 1 , 2 a high-intensity warm up might upregulate performance-enhancing mechanisms such as lactate, neuromuscular function, and baseline V·O2, thereby improving exercise capacity if a sufficient rest period allows fatiguing mechanisms to recover. 3 , 4 Indeed, Bailey et al. 5 found that when a high-intensity warm up was followed by 20 min of recovery, V·O2 kinetics remained accelerated and exercise time to exhaustion improved compared to no warm up.
Given that warm up exercise elicits ergogenic benefits despite a prolonged rest, questions arise regarding what warm up intensity best maintains physiological enhancements and promotes subsequent performance. The purpose of this study was to determine the influence of various warm up intensities (light-, moderate-, and high-intensity) on 1600 m run performance when a prolonged rest separated warm up termination from performance initiation. To provide insight into the physiological bases for exercise performance we measured lactate and V·O2, and quantified neuromuscular function via magnetically evoked contractions. We hypothesized that, while warming up at a high intensity would initially create adjustments in lactate, V·O2, and neuromuscular function that were detrimental to exercise performance, 20 min of rest would ameliorate the magnitude of these responses and improve 1600 m run performance compared to light- and moderate-intensity warm ups.
Methods
Participants
Participant characteristics are provided in Table 1. Based on power analyses for our dependent variables, fourteen recreational athletes (7 men and 7 women) familiar with treadmill running and high-intensity exercise took part in our study. Participants were recruited from local sporting organizations within the surrounding community. Testing was performed with women in the follicular phase of the menstrual cycle, within 14 days following the start of menses according to self-report. All participants were healthy as indicated by the Physical Activity Readiness Questionnaire (PAR-Q+). Inclusion criteria were: recreationally active (≥30 min exercise ≥3 × per week), age 18–35 years, and willingness to abstain from alcohol and strenuous exercise for 24 h prior to visiting the laboratory. Individuals were excluded from the study if they had a recent (≤ 2 months) musculoskeletal injury or were currently smoking. Participants were tested at the same time of day for each of the experimental visits and were instructed to arrive at the laboratory on a 2 h fast. Upon arriving to the laboratory participants completed a 7 d training log and 24 h dietary recall and were instructed to repeat similar diet and activity patterns before subsequent visits. All procedures and the informed consent statement were approved by the Pepperdine University Human Subjects Committee.
Participant characteristics.

V·O2 peak: peak oxygen consumption; V̇Emax: maximum minute ventilation.
n = 14 participants (7 men, 7 women).
Study design
A randomized, crossover design was implemented where participants visited the laboratory on four separate occasions. All exercise occurred on a motorized treadmill (Trackmaster TMX 3030C, Full Vision Inc., Newton, KS). Visit 1 consisted of an incremental running test to exhaustion to determine V·O2peak, followed by a 1600 m familiarization time trial. For Visits 2-4 participants completed one of three warm up protocols (low-, moderate-, or high-intensity warm-up), followed by a 20 min rest period, before completing a 1600 m time trial. During Visits 2-4, blood lactate and quadriceps contraction force (used as surrogates for pH and neuromuscular function, respectively) were assessed immediately before and after warm up exercise as well as immediately before and after the 1600 m time trial. The study design is displayed in Figure 1.
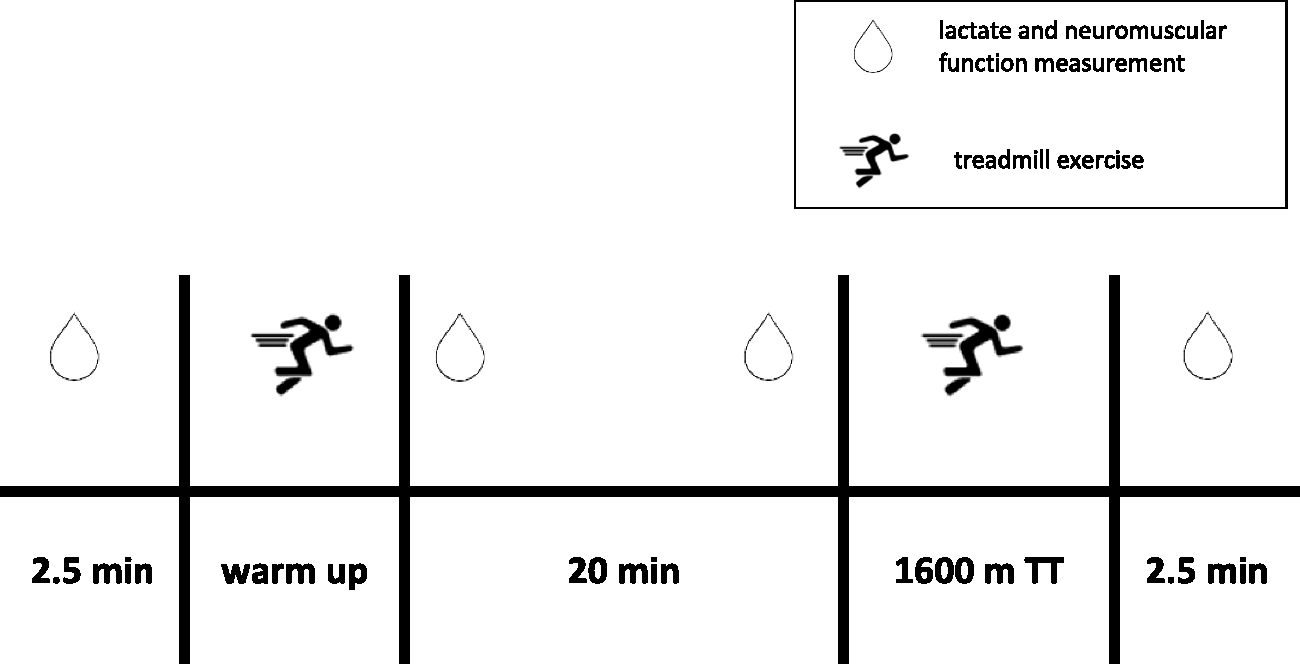
Schematic of experimental visits. Participants completed the study protocol on three separate occasions in random order. The warm up routine for one visit consisted of quiet sitting, while the warm up routines for the other two visits involved running 1600 m continuously at a moderate intensity or completing 4 × 400 m intervals at a high intensity. TT: time trial.
Visit 1: V·O2peak test. During Visit 1, participants completed a running test to exhaustion for determination of V·O2peak as described elsewhere. 6 Participants with the qualifying V·O2peak (V·O2peak >45 ml·kg−1·min−1 for men and V·O2peak > 40 ml·kg−1·min−1 for women) rested for ∼15 min before completing a 1600 m familiarization time trial. For all time trial performances (Visit 1–4), participants were free to adjust the speed of the treadmill according to perceived effort, but received no feedback other than elapsed distance, which was continuously displayed. Verbal encouragement was given only in the final 400 m of running. During Visit 1, participants were familiarized with all testing procedures.
Visits 2–4: Warm up and 1600 m time trial
Visits 2–4 were separated by a minimum of 48 h and were randomized to avoid an order effect. During Visits 2–4, participants completed a light stretching routine followed by a light-, moderate-, or a high-intensity warm up. Upon completion of warm up exercise, participants then rested for 20 min before completing a 1600 m time trial. Participants and researchers remained unaware of past performances. Rest duration was based on (1) a rest period that allowed comparison with previous studies investigating warm up efficacy, 5 , 7 and (2) observed delays in start times from professional and amateur athletics events. Participants spent the majority of the rest duration in the seated position, but towards the end of the 20 min rest, participants performed a standardized stretching routine consisting of both active and static exercises.
Warm up protocol
Light-intensity warm up
Prior to the 20 min rest, participants sat quietly for 5 min to mimic the warm up period. Towards the end of the 20 min rest, participants performed the stretching routine (thus “light-intensity” warm up) before completing the 1600 m time trial.
Moderate-intensity warm up
Prior to the 20 min rest, participants ran 1600 m at a moderately hard effort. Treadmill speed was held constant, requiring participants to complete the moderate-intensity warm up at ∼85% of the average speed attained during the 1600 m familiarization time trial. For example, if a participant completed the familiarization trial averaging 14.3 km·h−1, he or she ran the moderate-intensity warm up at 12.2 km·h−1. Warm up speed was designed to elicit a rating of perceived exertion (RPE) of 13 on the Borg 6-20 scale 8 where 13 represents a moderate effort. 2 Warm up duration lasted ∼7 min, which is similar to the duration used previously when investigating warm up efficacy on 1600 m performance. 9
High-intensity warm up
Participants completed 4 × 400 m with 1 min rest between intervals. The total warm up (running and rest intervals) took ∼9 min. The aim of the high-intensity warm up was to replicate the actual intensity athletes utilize when performing 400 m intervals, and to evoke a very hard effort, or an RPE of 17. Treadmill speed during the 400 m intervals was ∼120% of average speed during the 1600 m familiarization time trial, which aligns with investigations utilizing 400 m high-intensity interval training. 10 , 11 To ensure applicability of these speeds (i.e., that these speeds were comparable to what athletes utilize in the field during 400 m interval sessions) a popular training manual was referenced. 12
Metabolic and ventilatory responses to exercise
Throughout warm up and time trial procedures participants wore an oronasal face mask (7450, Hans Rudolph, Shawnee, KS) and breathed through a two-way nonrebreathing valve (2700, Hans Rudolph) connected to a flow sensor and portable gas analysis system (K5, COSMED, Concord, CA) displaying breath-by-breath V·O2 and minute ventilation (V̇E). Gas analyzers were calibrated pre-test with known gas concentrations within the physiological range. Immediately prior to warm up and time trial exercise, a fingertip blood sample was taken and subsequently analyzed for lactate concentration using a portable lactate analyzer (Lactate Pro, ARKRAY Inc., Japan). Additional fingertip samples were taken 4 min after the end of the warm up and time trial, according to post-exercise lactate kinetics. 13 Altogether, four lactate samples were taken during each visit (Figure 1). RPE was recorded at three time points: post-warm up exercise, halfway through the time trial, and post-time trial.
Neuromuscular function
Knee extensor force during magnetically evoked contractions was used to quantify neuromuscular function, as described elsewhere. 6 Briefly, participants lay supine on a custom-made table with a hip joint angle set at 130° and the right knee joint angle set at 90° of flexion. A calibrated load cell (RL200001I S-Beam Load Cell, Rice Lake, WI) was fixed to the table and connected to a noncompliant cuff wrapped just superior to the ankle malleoli of the participant’s right leg. Five maximal voluntary contractions (MVCs) of the right quadriceps, separated by 30 s, were performed for 5 s each. Magnetic stimulation of the femoral nerve elicited a quadriceps twitch (Qtw) 2 s after each 5-s MVC. We performed this procedure before and after warm up exercise, as well as before and after time trial exercise. Therefore, participants completed five MVCs, with accompanying potentiated quadriceps twitch (Qtw,pot), at four distinct time points (Figure 1).
Statistical analyses and reliability measurements
Statistical analyses were performed with SigmaPlot version 14.0 (Systat Software, San Jose, CA) and significance was established when P < 0.05. Data were assessed for normality using a Shapiro-Wilk test. Sphericity of data was assessed using Mauchly’s test. When sphericity was violated, the departure from sphericity (ε) was calculated. When ε < 0.75, the Greenhouse-Geisser correction was applied and when ε > 0.75 the Huynh-Feldt correction factor was applied. Repeated-measures ANOVA tests were used to examine the changes in neuromuscular function, metabolic variables, and performance outcomes. Bonferroni corrected post-hoc tests were applied to identify differences. For performance outcomes, effect sizes (ES) were assessed with Cohen’s d, where d = 0.8 is a large effect, d = 0.5 is moderate, and d = 0.2 a small effect. Power analysis (G*Power 3.1; Germany) showed that a sample size of 14 would allow detection of significant differences in lactate, performance, and pre-exercise V·O23, 9 with statistical power of 1 – β = 0.80 and α = 0.05. Data are expressed as means ± SE. To examine the consistency of running performance between days, three participants repeated the moderate-intensity visit. Between-day coefficient of variation (CV) was determined by the logarithmic method. When three participants repeated the moderate-intensity visit, 1600 m time trials demonstrated a CV of 1.0%, which compares well with published data on reliability for running performance. 14
Results
Performance
Participants completed the 1600 m time trial significantly faster following the moderate-intensity warm up (6:12 ± 0:18 min:s·1600 m−1) compared to the light-intensity warm up (6:30 ± 0:18 min:s·1600 m−1; P = 0.03, d = 0.2), which represented an average improvement of 4.4%. Performance following the high-intensity warm up (6:18 ± 0:24 min:s·1600 m−1) fell between the performances of the moderate- and light-intensity conditions and was not statistically different from either (Figure 2).

Group (bars) and individual (lines) data displaying 1600 m time trial performance following warm ups of various intensities (light-, moderate-, or high-intensity) and a 20 min rest. *P < 0.05 compared to performance following light-intensity warm up.
Metabolic, ventilatory, and 1600 m time trial data per 400 m split are shown in Table 2. When time trials were divided per 400 m the high-intensity warm up elicited a faster opening 400 m compared to the light-intensity warm up (P < 0.01), and the moderate-intensity warm up resulted in a faster closing 400 m compared to the high-intensity warm up (P = 0.02). No other significant differences in time were observed between 400 m splits.
1600 meter metabolic, ventilatory and performance responses per 400 m interval.

HR: heart rate; V̇E: minute ventilation; V·O2: oxygen consumption.
Data are mean ± SE.
*P < 0.05 compared to light-intensity at same distance interval.
†P < 0.05 compared to high-intensity at same distance interval.
Metabolic and ventilatory responses to exercise
Average warm up velocity was 13.0 ± 0.5 km·h−1 (7:26 min:s·1600 m−1) for the moderate-intensity warm up and 17.5 ± 0.5 km·h−1 (5:31 min:s·1600 m−1) for the high-intensity intervals. Moderate-intensity exercise elicited an average HR of 166 ± 6 bpm (86 ± 3% of HRmax), an average V̇E of 85 ± 5 l·min−1, and an average RPE of 13 ± 1. High-intensity intervals evoked a mean HR of 180 ± 3 bpm (93 ± 1% HRmax), a mean V̇E of 109 ± 5 l·min−1, and an average RPE of 17 ± 1. Immediately prior to initiating the 1600 m time trial, HR was significantly elevated in the high-intensity (119 ± 6 bpm) and moderate-intensity (117 ± 6 bpm) conditions compared to the light-intensity condition (92 ± 5 bpm; both P < 0.01). Minute ventilation, however, had recovered in the moderate- and high-intensity conditions and was similar to light-intensity V̇E immediately prior to beginning the 1600 m time trial (P = 0.15).
V·O2
Figure 3(a) shows V·O2 values throughout warm up and time trial exercise. V·O2 at baseline was similar across conditions. Moderate- and high-intensity exercise elicited 85 ± 3% and 100 ± 3% V·O2peak, respectively. Warm up exercise evoked a greater V·O2 in the high-intensity compared to the moderate-intensity warm up (P < 0.01), but after 20 min of rest V·O2 had returned to baseline in all conditions (all P > 0.05).

Effects of warm up intensity, 20 min rest, and 1600 m time trial performance on oxygen consumption (a), lactate (b), and neuromuscular function (c). Data are mean ± SE. V·O2: oxygen consumption; Qtw,pot: potentiated quadriceps twitch; Pre-WU: immediately before warm up exercise; WU: physiological response elicited by the warm up; Pre-TT: 20 min after warm up completion and immediately prior to time trial exercise; TT: physiological response elicited by the 1600 m time trial. *p < 0.05 compared to light-intensity at same time interval; †P < 0.05 compared to light- and moderate-intensity at same time interval.
Lactate
Blood lactate values before and after warm up exercise as well as before and after time trial performance are displayed in Figure 3(b). Baseline blood lactate was similar between conditions. Following warm up exercise, blood lactate was significantly greater in the high-intensity condition compared to the moderate-intensity condition (P < 0.01), and both were significantly elevated compared to the light-intensity condition (both P < 0.02). Twenty minutes after warm up exercise, however, only the high-intensity warm up sustained the elevation in lactate and resulted in values greater than light- and moderate-intensity values (P < 0.01).
The high-intensity warm up elicited varying degrees of exertion, where some participants experienced extreme difficulty completing the high-intensity warm up and immediately post-warm up had blood lactate values as high as 13.8 mmol·l−1. When stratified based on lactate, instead of warm up intensity, 1600 m performance was significantly faster when pre-time trial lactate was 2.0 – 4.9 mmol·l−1 compared to when starting lactate was ≥ 5.0 mmol·l−1 (P = 0.03; Figure 4).
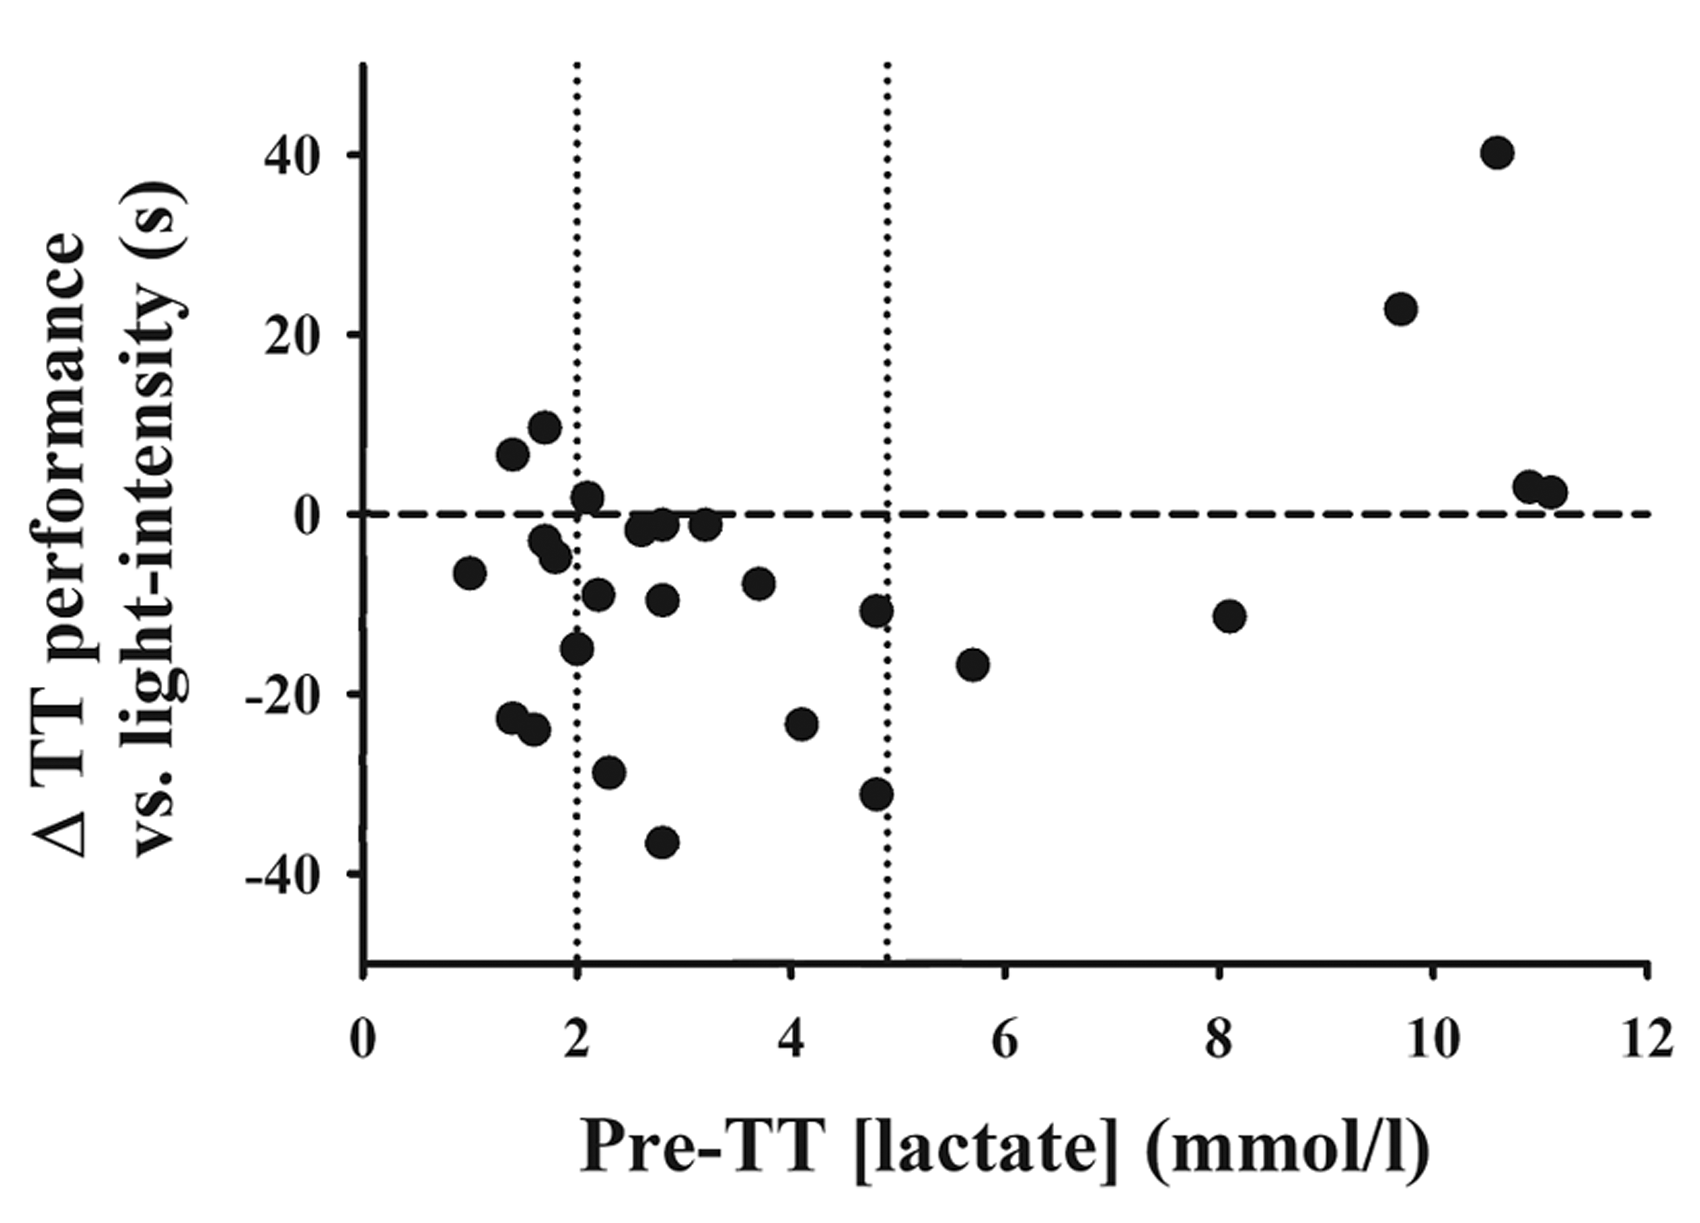
Change in time trial performance following moderate- and high-intensity warm ups compared to performance after light-intensity warm up. Performances following moderate- and high-intensity conditions are combined and stratified based on circulating lactate concentrations immediately prior to time trial commencement. Dashed vertical lines denote range 2.0–5.0 mmol·l−1. TT: time trial.
Neuromuscular function
The percent change in neuromuscular function throughout warm up and time trial exercise is shown in Figure 3(c). Neuromuscular function was impaired immediately following the high-intensity warm up (pre-warm up vs. post-warm up neuromuscular function, P < 0.01) and had not recovered 20 min later (pre-warm up vs. pre-time trial, P < 0.01). As would be expected, neuromuscular function was significantly reduced following time trial performance in all conditions (all P < 0.03).
Discussion
The main finding of our study was that a moderate-intensity warm up improved 1600 m run performance when a 20 min rest separated warm up termination from time trial commencement. Specifically, performance was best when warm up intensity was such that, 20 min after ending the warm up, lactate concentrations remained slightly elevated, between 2.0 – 4.9 mmol·l−1. Strengths of our study include our athletic population, our pairing of performance outcomes with physiological perturbations, and the small CV on time trial performances. Our data demonstrate that while a 20 min separation between warm up and time trial is prolonged in comparison to the recommended 5 min interval, 20 min is not long enough to abolish the effects (be them positive or negative) of warm up exercise on subsequent performance. When a prolonged rest separates warm up exercise from performance, the optimal warm up intensity may be identified using starting lactate as a gauge for readiness. These findings support investigations demonstrating warm up efficacy given a prolonged rest 15 , 16 and provide further insight into best practices for warm up intensity.
In attempting to provide physiological insight into performance outcomes, we investigated whether warm up exercise elevated baseline V·O2 given a prolonged recovery. Though no differences were observed in V·O2 immediately prior to beginning the time trials, V·O2 kinetics may yet explain performance outcomes. 3 Previously, Bailey et al. 5 demonstrated that V·O2 kinetics accelerate when a severe-intensity warm up is followed by 20 min of recovery. When warm up intensity was reduced from severe- to heavy-intensity, performance gains dissolved. Based on the percentage of V·O2peak elicited by our warm ups, and using the exercise domain classification of Bailey et al., 5 and Poole et al. 17 we speculate that our moderate-intensity warm up fell within the severe domain and that our high-intensity warm up approached the extreme-intensity domain. 18 , 19 If so, our findings support the conclusion that a severe-intensity warm up promotes exercise tolerance given a 20 min rest. Furthermore, our data indicate that warming up at an extreme-intensity also influences performance 20 minutes later.
Comparable to baseline V·O2, neuromuscular function was similar between light- and moderate-intensity conditions, exhibiting a return to baseline after 20 min of rest. Following the high-intensity warm up, however, neuromuscular function decreased immediately after warm up termination and failed to return to baseline 20 min later. Although those in the high-intensity condition initiated the 1600 m time trial with greater levels of quadriceps fatigue, the initial 400 m of the 1600 m trial was fastest following the high-intensity warm up. This may represent a readying of enzymatic activity and force-generating pathways that are primed for contraction but experience accelerated reductions in force output due to the initial state of fatigue. The physiological mechanisms at play in the initial 400 m may also mirror the performance enhancements some runners feel when performing “strides” (100 meter sprinting bursts) prior to a race or hard training effort. Future research should explore the benefits of a high-intensity warm up on anaerobic exercise given a prolonged rest.
In addition to V·O2 and neuromuscular function, we assessed warm ups for their effect on lactate, which was used as a surrogate for pH. Our data demonstrate that, whereas a mild acidemia promotes subsequent performance, lactate levels greater than 5–6 mmol·l−1 are associated with performance impairment. The finding that mild acidemia promotes subsequent exercise is consistent with the work of Jones et al. 20 and Burnley et al., 3 who showed that prior heavy exercise—resulting in baseline blood lactate values of 2.5 mmol·l−1 and 3.0 mmol·l−1, respectively—increased cycling time to exhaustion and power output. Additionally, Gerbino et al. 21 observed that, when exercise was commenced with elevated blood lactate, V·O2 kinetics were hastened, further supporting the idea that accelerated V·O2 kinetics contributed to the performance improvements we observed. The beneficial effects of prior exercise on V·O2 kinetics are lost, however, once lactate concentrations recover to ≤2 mmol·l−1, 15 which again may help explain the performance improvements observed following our moderate-intensity exercise, where blood lactate was 2.4 ± 0.3 mmol·l−1 prior to time trial commencement.
Although the purpose of the high-intensity warm up was to elicit a challenging, though not exhausting, effort, the 400 m intervals represented a strenuous task for some participants and elicited varying degrees of effort as well as lactate production. Why some participants struggled completing the high-intensity intervals is difficult to determine as running speeds were similar to previous research utilizing 400 m intervals. 10 , 11 Future research using a similar protocol should ease participants into the high-intensity intervals by first performing 1–2 lower intensity intervals. In attempting to not over-burden our participants, we confirmed the viability of interval speed by referring to a training manual commonly used in the running community. 12 Still, the interval pace was too high for some, and our high-intensity warm up is best considered as evoking varying degrees of difficulty. To account for the differences in effort, we combined the moderate- and high-intensity values, stratifying them based on the lactate response to warm up exercise. During running exercise, lactate reaches a steady state when concentrations are ≤4–5 mmol·l−1.22,23 Taken alongside the previously mentioned data indicating that benefits in V·O2 kinetics are lost when lactate falls below 2.0 mmol·l−1 we examined differences in performance when lactate concentrations went outside this range. When 1600 m time trials were initiated with lactate levels ≥5.0 mmol·l−1 performance worsened. In support of our conclusion that that mild, but not high, baseline blood lactate improves performance Koppo and Bouckaert 24 found no improvements in cycling performance when a heavy warm up elicited a mean lactate value of 6.3 mmol·l−1. Additional limitations of our study include the possibility of a learning effect on time trial performance. Although the trial order was randomized, participants may still have gotten systematically better or worse over time.
Due to the popularity of road races—and the time gap between warm up and performance frequently experienced in these races—our results are best viewed in light of this setting. In applying our experiment to road racing scenarios, a few differences arise. Road racing distances are commonly ≥5000 meters, and during the 20 min rest period, athletes are standing (not sitting) in the corrals. Subsequent studies should therefore investigate our findings at distances ≥5000 meters.
Practical applications
Amateur and elite competitions often call participants to starting corrals long before start time. These corrals restrict movement to static and dynamic stretching, requiring athletes to warm up well in advance of race initiation. From this, questions arise regarding warm up efficacy. Our results direct coaches and athletes as follows: when known that a prolonged period separates the warm up from performance commencement, develop a warm up routine that achieves a blood lactate of approximately 3.0 mmol·l−1 immediately prior to competition, even if this requires performing a high-intensity warm up. This applies most specifically to performance events lasting less than 10 min and a wait period lasting ∼20 min.
Conclusions
In scenarios where a mandatory wait period separates warm up from performance, warm up intensity may need altered to optimize physiological preparedness prior to race commencement. An elevation in lactate of approximately 3.0 mmol·l−1 was associated with performance enhancement. Values ≥5.0 mmol·l−1 were connected with performance impairment.
Footnotes
Acknowledgements
We extend our thanks to Dr Adam Pennell for composition edits and guidance on statistical testing. Additionally, our gratitude goes to our participants for their willingness and efforts to participate all-out in this study.
Declaration of Conflicting Interests
The author(s) declared no potential conflicts of interest with respect to the research, authorship, and/or publication of this article.
Funding
The author(s) received no financial support for the research, authorship, and/or publication of this article.
Author contributions
HLP, CMC, AMK, MAL, WM, SCR, and ECS conceived and designed the research. HLP, CMC, AMK, MAL, WM, SCR, and ECS conducted experiments. HLP analyzed and interpreted data. HLP, MAL, ECS, and WM wrote the manuscript. HLP, CMC, AMK, MAL, WM, SCR, and ECS edited the manuscript. All authors read and approved the manuscript.