




Abstract
This study aimed to (1) track changes in body composition, lower body force-time characteristics, and swim start performance over a competitive season, and (2) investigate the intra-individual associations between changes in body composition and lower body force-time characteristics to swim start performance in five high performance swimmers (three males, two females). Over a ∼12-month period, body composition, lower body force-time characteristics and swim start performance were assessed at three time points via DXA scan, squat jump and swim start performance test (start times to 5 and 15 m and several kinematic and kinetic outputs). Throughout a competitive season of concurrent swimming and dry-land resistance training, improvements in lower body lean mass and squat jump force-time characteristics were observed. However, changes in start times varied between athletes. Total body and lower body lean mass both displayed large negative correlations with the time spent in the entry and propulsive underwater phases (r = –0.57 to –0.66), along with a large positive correlations with glide time (r = 0.56–0.53). Additionally, lower body lean mass exhibited large to very large positive correlations with the flight phase (r = 0.70–0.73). Overall, these findings provide some insight into the potential magnitude of change in body composition, lower body force-time characteristics and swim start performance in high performance swimmers within a season. The large to very large correlations between increased lower body lean mass and SJ force-time metrics to improvements in aspects of start performance may provide useful information to coaches and sports scientists.
Introduction
High performance swimmers typically focus their annual training on peaking for one domestic national championship or qualification competition, and a subsequent major international competition (Olympic Games, World Championships, Regional Championships). 1 Seasonal trends and individual variability in performance may occur during different time points of the season, depending on the periodisation plans and goals of the swimmer. High performance swimmers often perform several training modalities concurrently to improve their body composition, physical capacities and technical skills, with the ultimate aim to improve their competitive performance. 2 As such, monitoring body composition, training and performance are commonly implemented with high performance swimmers to determine if positive adaptations have taken place in response to the training stimuli imposed. 3
Majority of the longitudinal research in the swimming literature has focused on tracking long term body composition changes and physiological variables such as blood lactate levels, biomechanical parameters such as stroke length and stroke rate, and how changes in these parameters contributes to overall swimming performance.4–7 For example, while the optimal body composition for performance is likely to vary between individuals, previous research tracking the seasonal and long-term changes in body composition have shown increases in lean mass and reductions in fat mass to be associated with significant improvements in swimming performance in elite and collegiate swimmers.5,6,8 However, to the author’s knowledge, there is no longitudinal research assessing changes in body composition and swim start performance in high performance swimmers.
The swim start is commonly defined as the time from the starting signal until the centre of a swimmers’ head crosses the 15 m mark and is comprised of three primary phases: block phase, flight phase and underwater phase, 9 and includes an additional free swimming phase from the point of reaching the surface to the 15 m mark. The block phase requires a quick reaction to the starting signal and a take-off velocity that is primarily horizontal in direction. The block phase is followed by the flight phase, which is the projectile motion phase in which the swimmer becomes airborne and finishes when the swimmers’ head make contact with the water.10,11 The last and the longest phase of the swim start is the underwater phase, which is defined as the period of time from when the swimmers’ head enters the water to when the swimmer begins taking their first stroke to commence free swimming. 12
Total start time is calculated from the starting signal, and includes the transition between the underwater phase until a swimmer resurfaces to begin free swimming with both arms and legs, with the swimmers’ head reaches 15 m. 9 The ability for a swimmer to produce a quick start time to 15 m is highly dependent on an explosive muscular response, especially of the lower body musculature on the starting block to increase net impulse and maximise take-off velocity in the desired direction.13,14
Recent systematic reviews15,16 have indicated the importance of muscular strength and power (hereafter referred to as the force-time) characteristics for enhancing the free swim and swim start phases in competitive swimming, respectively. These findings support the addition of dry-land resistance training modalities into a concurrent training model for competitive swimmers. 15 However, both swim training and dry-land resistance training impose different acute stresses on the body that may elicit distinct adaptations. In particular, the concurrent development of muscular hypertrophy, strength and power from resistance training compared to the development of aerobic and anaerobic endurance from swimming training can lead to conflicting neuromuscular adaptations. 17 Furthermore, the volume of swim training undertaken weekly is considerably greater than the dry-land resistance training sessions. Typically, swimmers engage in nine to ten in-water pool sessions weekly, with each session lasting one and a half to two hours. 18 Dry-land resistance training sessions are generally performed a maximum of three times a week, totalling between three to five hours weekly. 5 Thus, it can be challenging for high performance swimmers to make substantial or short-term shifts in muscular hypertrophy, strength and power compared to aerobic endurance adaptations due to the conflicting physiological adaptations associated with their concurrent training demands.
Current research on long-term tracking (one to two years) of force-time characteristics is relatively uncommon in sport science research, although some research has been performed in gymnastics, various rugby codes and American football.19–22 At this stage, there appears to be no such longitudinal study within the swimming literature that have investigated the relationship between changes in body composition, force-time characteristics and/or swim start performance, and how changes in these body composition and force-time characteristics may contribute to changes in swim start performance. Therefore, the two primary aims of this study were to: (1) gain some preliminary insight into how body composition, lower body force-time characteristics, and swim start performance may change over a competitive season in five high performance swimmers; and (2) quantify the intra-individual associations between changes in body composition and lower body force-time characteristics to swim start performance. Such data will provide practitioners in high performance swimming with insight into the magnitude of change that may occur in these outcome measures across one season and how changes in different body composition and force-time characteristics may ultimately contribute to improved swim start performance.
Methods
Study design
This longitudinal case series was carried out from November 2018 to December 2019 to quantify the time course of potential changes in body composition, lower body force-time characteristics and swim start performance in five high performance swimmers. These athletes were assessed for their body composition, lower body force-time characteristics and swim start performance at three relatively equidistant time points across this year of data collection.
The following assessments were performed within each testing occasion: (1) Dual Energy X-Ray Absorptiometry (DXA) scan (Lunar Prodigy, GE Healthcare, Madison, WI, USA), (2) squat jump (SJ) test and (3) swim start performance test. All three assessments were performed on the same day. The SJ test and swim start performance test were collected as previously described by Thng et al. 23 After completing the DXA scan, all participants refuelled and had a three-hour break before performing the SJ test. Following a 30-min rest after the SJ test, the swim start performance test was performed.
Participants
Five swimmers (three males: M1, M2, M3; two females: F1, F2) volunteered to participate in this study. Participants were primarily 100–200 m swimmers, with all three male swimmers’ primary stroke being the front crawl (freestyle), and the two female swimmers’ main stroke was breaststroke. Baseline characteristics of participants and their respective FINA points for each individual’ best race time for their main event in 2018 are summarised in Table 1. The FINA point score is centred around a base time of 1000 points using the world record of the previous year. A formula is then used to calculate the points for a swim time in comparison to the base time. Prior to participating in this study, participants were briefed on the experimental design and gave written informed consent to participate in the study. The study was conducted in accordance with the Declaration of Helsinki and approved by Bond University Human Research Ethics Committee (0000016006).
Mean and standard deviation (SD) of the general characteristics of participants (N = 5).

Dry-land resistance training and swim training volume
The swimmers typically trained 11–12 sessions per week, which consisted of eight to nine (90–120 min) pool and three (60–75 min) dry-land resistance training sessions. A four-week swim training volume leading into each testing occasion is presented in Figure 1. Participants swam an average of 40.4 km leading into T1, 47.2 km leading into T2, and 35.4 km leading into T3.
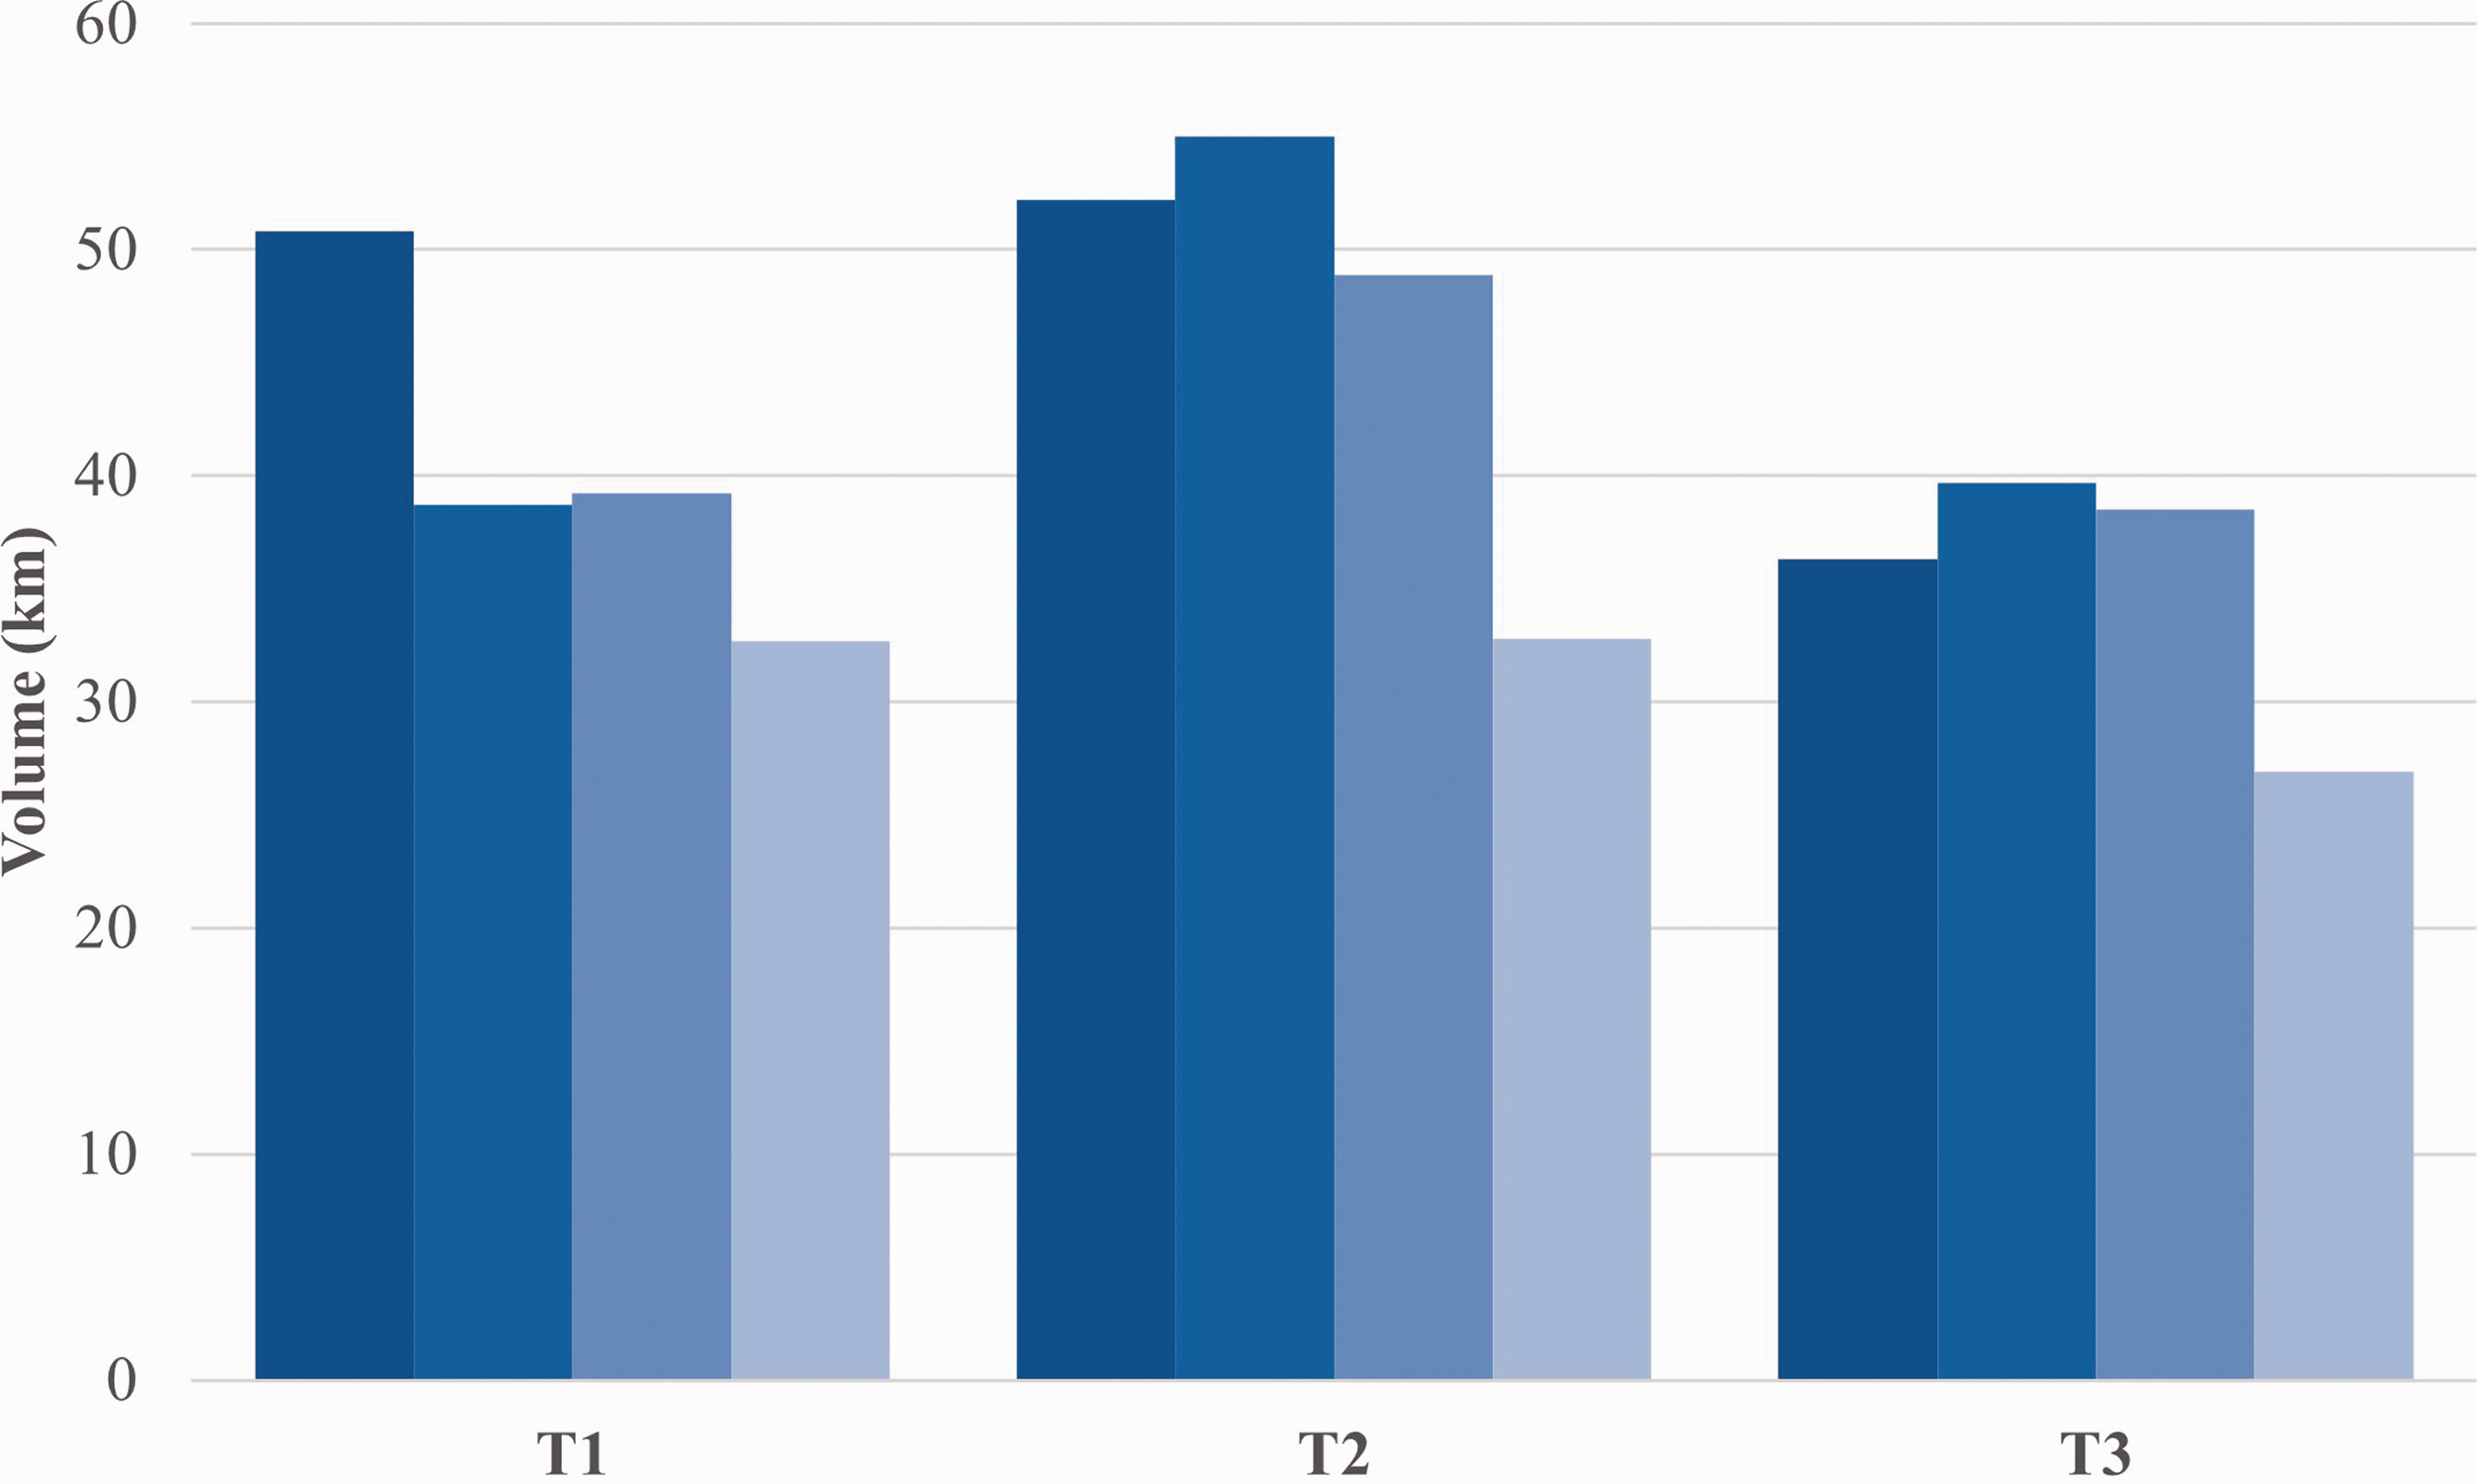
Four-week training volume across the three time points prior to each testing (T) occasion. Darker to lighter shade indicates training volumes from week T-4 to week T-1. Testing was conducted in week T-1 of each testing occasion.
The dry-land resistance training program consistently used a progressive overload approach using a 3:1 loading paradigm, with a progressive increase in load for the first three weeks followed by a reduction in load in the fourth week. 24 Each resistance training session typically consisted of multi-joint free-weight and bodyweight exercises, machines, plyometrics and swimming-specific rehabilitation exercises. The resistance training session generally comprised of strength and power-oriented exercises for the upper and lower body, ranging from three to eight repetitions per set, for a total of 8–12 sets per session, depending on the phases of the season. All male and female swimmers completed the same training program throughout the year.
Body composition assessment
Body composition was assessed using a narrow angle fan beam DXA machine (Lunar Prodigy, GE Healthcare, Madison, WI, USA), which was calibrated prior to every scan according to the manufacturer’s guidelines using a phantom. All DXA scans and analysis were performed by one Australian and New Zealand Bone Mineral Society (ANZBMS) densitometry qualified technician. Automatic analysis of body composition variables were performed using the GE enCORE 2016 software (GE Healthcare) using National Health and Nutrition Examination Survey (NHANES) reference values. 25 The DXA scans were conducted at a similar time of the morning (typically within 60 min) at all three time points. Participants reported to the DXA scan having fasted overnight; had at least 24 h rest between their prior training session and the DXA scan; and with their bladders voided. Participants were instructed to present in a euhydrated state and hydration status was determined by assessing the specific gravity of the first void urine sample using a refractometer (PEN-Urine S. G., Atago, Tokyo, Japan). Upon arrival, participants underwent standing height and body mass measurements prior to the DXA scan. Stretch stature was measured as per the International Society for the Advancement of Kinanthropometry (ISAK) protocol during a maximal inhalation using a medical stadiometer (Harpenden, Hotain Limited, Crymuych, UK) to the nearest 0.1 cm. Body mass was measured using an electronic medical scale to the nearest 0.1 kg (WM202, Wedderburn, Bilinga, Australia). All participants wore minimal clothing (males: i.e., swimming trunks; females: unwired sports bra and cycling shorts) and removed all metal objects from their bodies and clothes prior to the scan. Participants were then carefully positioned in a supine position on the scanning bed using the Nana positioning protocol, which has been previously reported as the best practice protocol in athletic populations. 26 Previous DXA test-retest reliability of Nana positioning protocol in our laboratory had an intraclass correlation coefficient values of 0.97–1.00 and standard error of measurement percentage of 0.2–3.3%. 27
Squat jump test
Participants first completed a standardised full body dynamic warm-up under the supervision of a strength and conditioning coach. All SJs were performed on a force platform (ForceDecks FD4000, London, United Kingdom), with a sample rate of 1000 Hz. Following the warm-up, participants were given two practice bodyweight SJs before the test was conducted. The SJ trials were performed with a self-selected squat depth, with participants instructed to keep their hands on their hips to prevent the influence of arm movements for the jump trials. An isometric hold of 3 s preceded the concentric phase of each SJ. Each participant was given three maximal effort jumps, with a 30 s passive rest in between each effort. 28 The SJ trial with the highest jump height was kept for data analysis. A successful trial was one that did not display any small amplitude countermovement at the start of the jump phase on the force trace. 29 Jump height was determined by the flight-time method (Jump height = g*t2/8, where g is the acceleration due to gravity and t is the flight time). 30 Ground reaction force data from the SJs were analysed using the commercially available ForceDecks software (ForceDecks, London, United Kingdom). Out of the 46 variables that are provided by ForceDecks, the SJ variables selected for analysis were based on previously documented significant predictors of swim start performance identified by Thng et al. 23
Swim start performance test
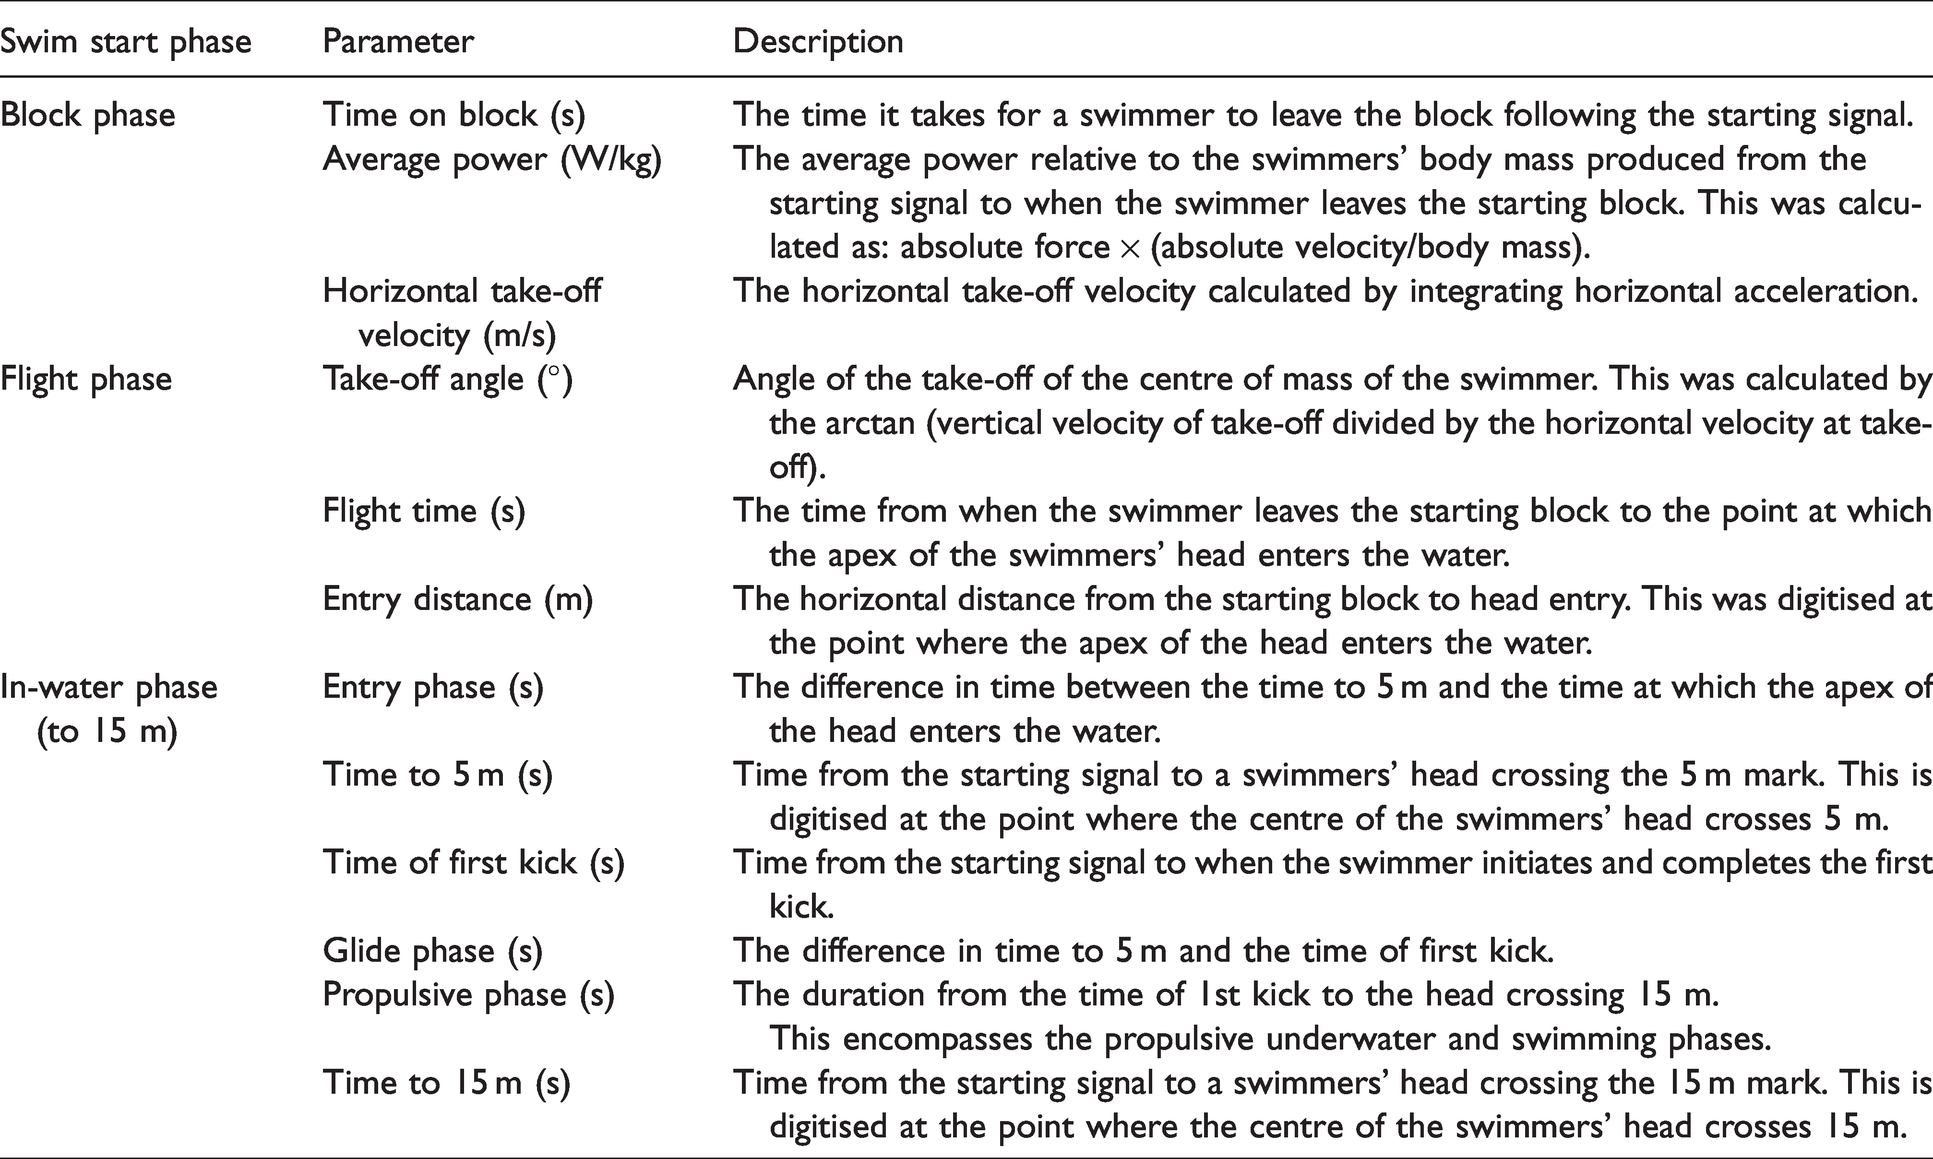
Prior to the swim start test, all swimmers completed a pool-based warm-up based on their usual pre-race warm-up routine. Participants then performed three maximal effort swim starts past the 15 m mark with their main swim stroke (front crawl (n = 3)), and breaststroke (n = 2)), in order to ensure that representative values at the 15 m distance were obtained. 31 Two-minutes of passive recovery was given between each trial. 32 All trials were performed in their regular swim training swimsuit and preferred kick plate position, which was recorded to ensure consistency between testing sessions. The start with the fastest 15 m start time was selected for further analysis to better represent the athletes’ optimal level of performance at each timepoints. Swim starts were collected using a Kistler Performance Analysis System – Swimming (KiSwim, Kistler Winterthur, Switzerland), which utilises a force instrumented starting block, constructed to match the dimensions of the Omega OSB11 block (KiSwim Type 9691A1; Kistler Winterthur, Switzerland) that is currently used in competitive swimming races. Time to 5 and 15 m were collected using five calibrated high speed digital cameras operating at 100 fps, synchronised to the instrumented KiSwim starting block. One camera was positioned 0.95 m above the water and 2.5 m perpendicular to the direction of travel to capture the start and entry of swimmer into the water, while the other three cameras were positioned 1.3 m underwater at 5, 10 and 15 m perpendicular to the swimmer to capture the time to 15 m. The times to 5 and 15 m were defined as the time elapsed from the starting signal until the apex of the swimmers’ head passed the respective distances. 32 An Infinity Start System (Colorado Time Systems, Loveland, Colorado, USA) provided an audible starting signal to the athletes and an electronic start trigger to the KiSwim system. Kinetic and kinematic variables of block performance extracted for analysis were identified by Thng and colleagues as key predictors of time to 5 and 15 m. 33 Analysis of the identified parameters were broken down into the block, flight, and in-water phases of the swim start. The in-water phase comprises the underwater phase and the free swimming component till the 15 m mark. A detailed description of the parameters analysed is provided in Table 2.
Description of variables derived from the KiSwim Performance Analysis System.
Statistical analysis
Descriptive statistics are presented as mean ± SD for normally distributed continuous variables and frequency (%) for categorical variables. Normality was checked using histograms, normal Q-Q plots and the Shapiro-Wilk test. Repeated measures correlations (rrm) with 95% confidence intervals (CIs) were computed to assess correlations between body composition measures, squat jump force-time and KiSwim block outcome variables across the three phases of the swim start, using the R package rmcorr. 34 This approach was utilised given the dependent nature of the data measured repeatedly over time per participant. The following criteria were adopted to interpret the magnitude of correlation between the test measures: <0.1, trivial; 0.1–0.3, small; 0.3–0.5, moderate; 0.5–0.7, large; 0.7–0.9, very large; and 0.9–1.0, almost perfect. 35 A p-value of <0.05 was considered as statistically significant. All analyses were completed with statistical software R version 3.5.3.
Results
Changes in body composition, squat jump force-time variables and swim start performance
A summary of the changes in body composition and SJ force-time variables across the three time points for each of the five individual participants are provided in Table 3. While there were some inter-athlete variations, the participants typically demonstrated an increase in lower body lean mass (3.5–9.5%) and jump height (3.1–10.3%) over the three testing occasions. The only exception to this was F2 who demonstrated a 5.0% increase in jump height from first to the second testing session, but a 1.1% decrease from the second to final testing session.
Body composition measures and squat jump force-time variables at each time point over 12 months.
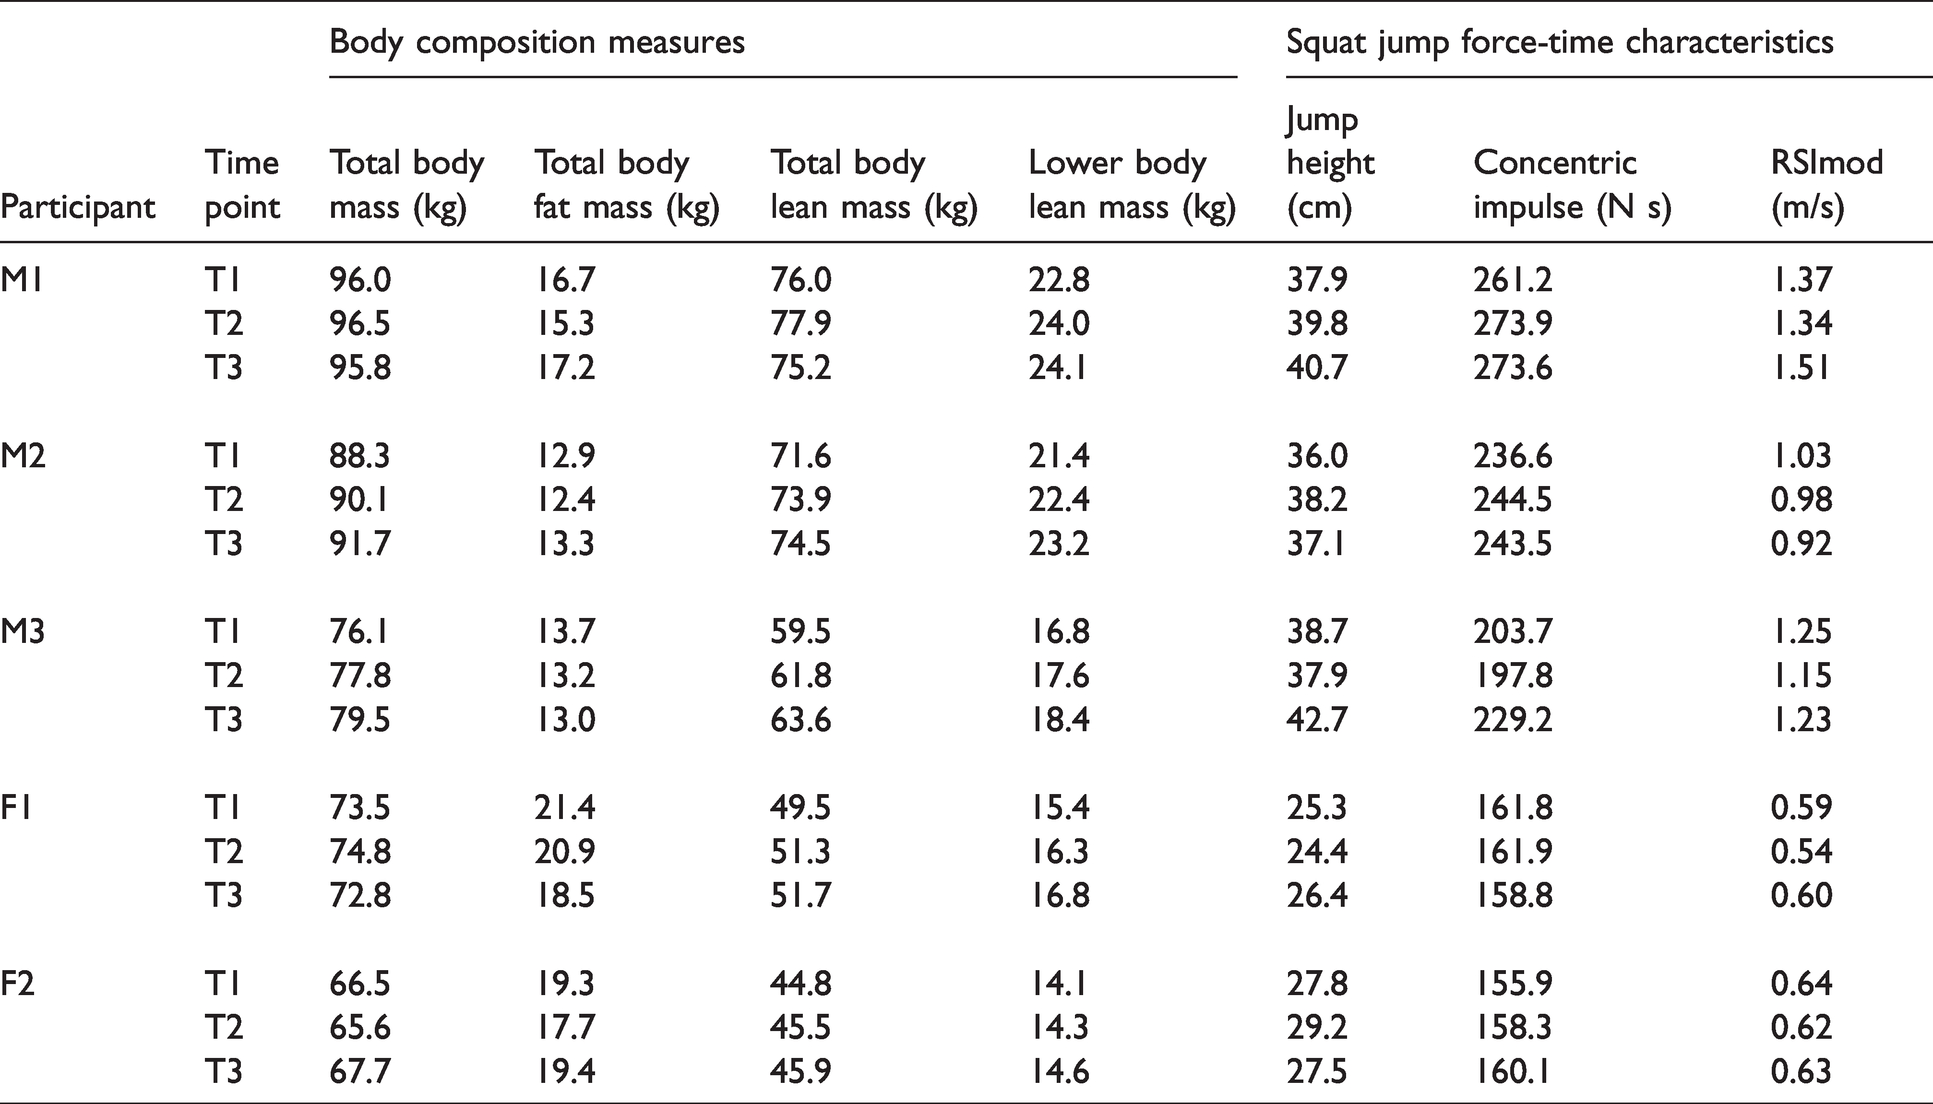
Table 4 provides a summary of the kinetic and kinematic variables of the swim start at each testing session. In contrast, to the changes in body composition and SJ force-time variables, the changes in time to 5 and 15 m were more variable across the five swimmers. An overall increase in time to 5 m was observed in M1 and M3 (5.5% and 2.8% increase, respectively), which contrasted with the relatively unchanged times for M2 and F2 and a 1.7% decrease in time to 5 m for F1. With respect to time to 15 m, a 1.3% increase was seen for M2, with M1 and F2 remaining relatively unchanged across time. Alternatively, M3 and F1 had notable improvements in time to 15 m, with a 3.1% decrease from the first to the third testing session. Figure 2 illustrates the changes across the subphases of the swim start of the fastest start trial for each participant from the initial to the final testing session. Closer inspection of Figure 2 shows a trend for both male and female subgroups, whereby most of the changes over time were observed in the flight and underwater phases of the swim start.
Swim start kinetic and kinematic variables in the block, flight, and in-water phases at each time points over 12 months.

T5 m: time to 5 m; T15 m: time to 15 m; T1st kick: time of first kick.
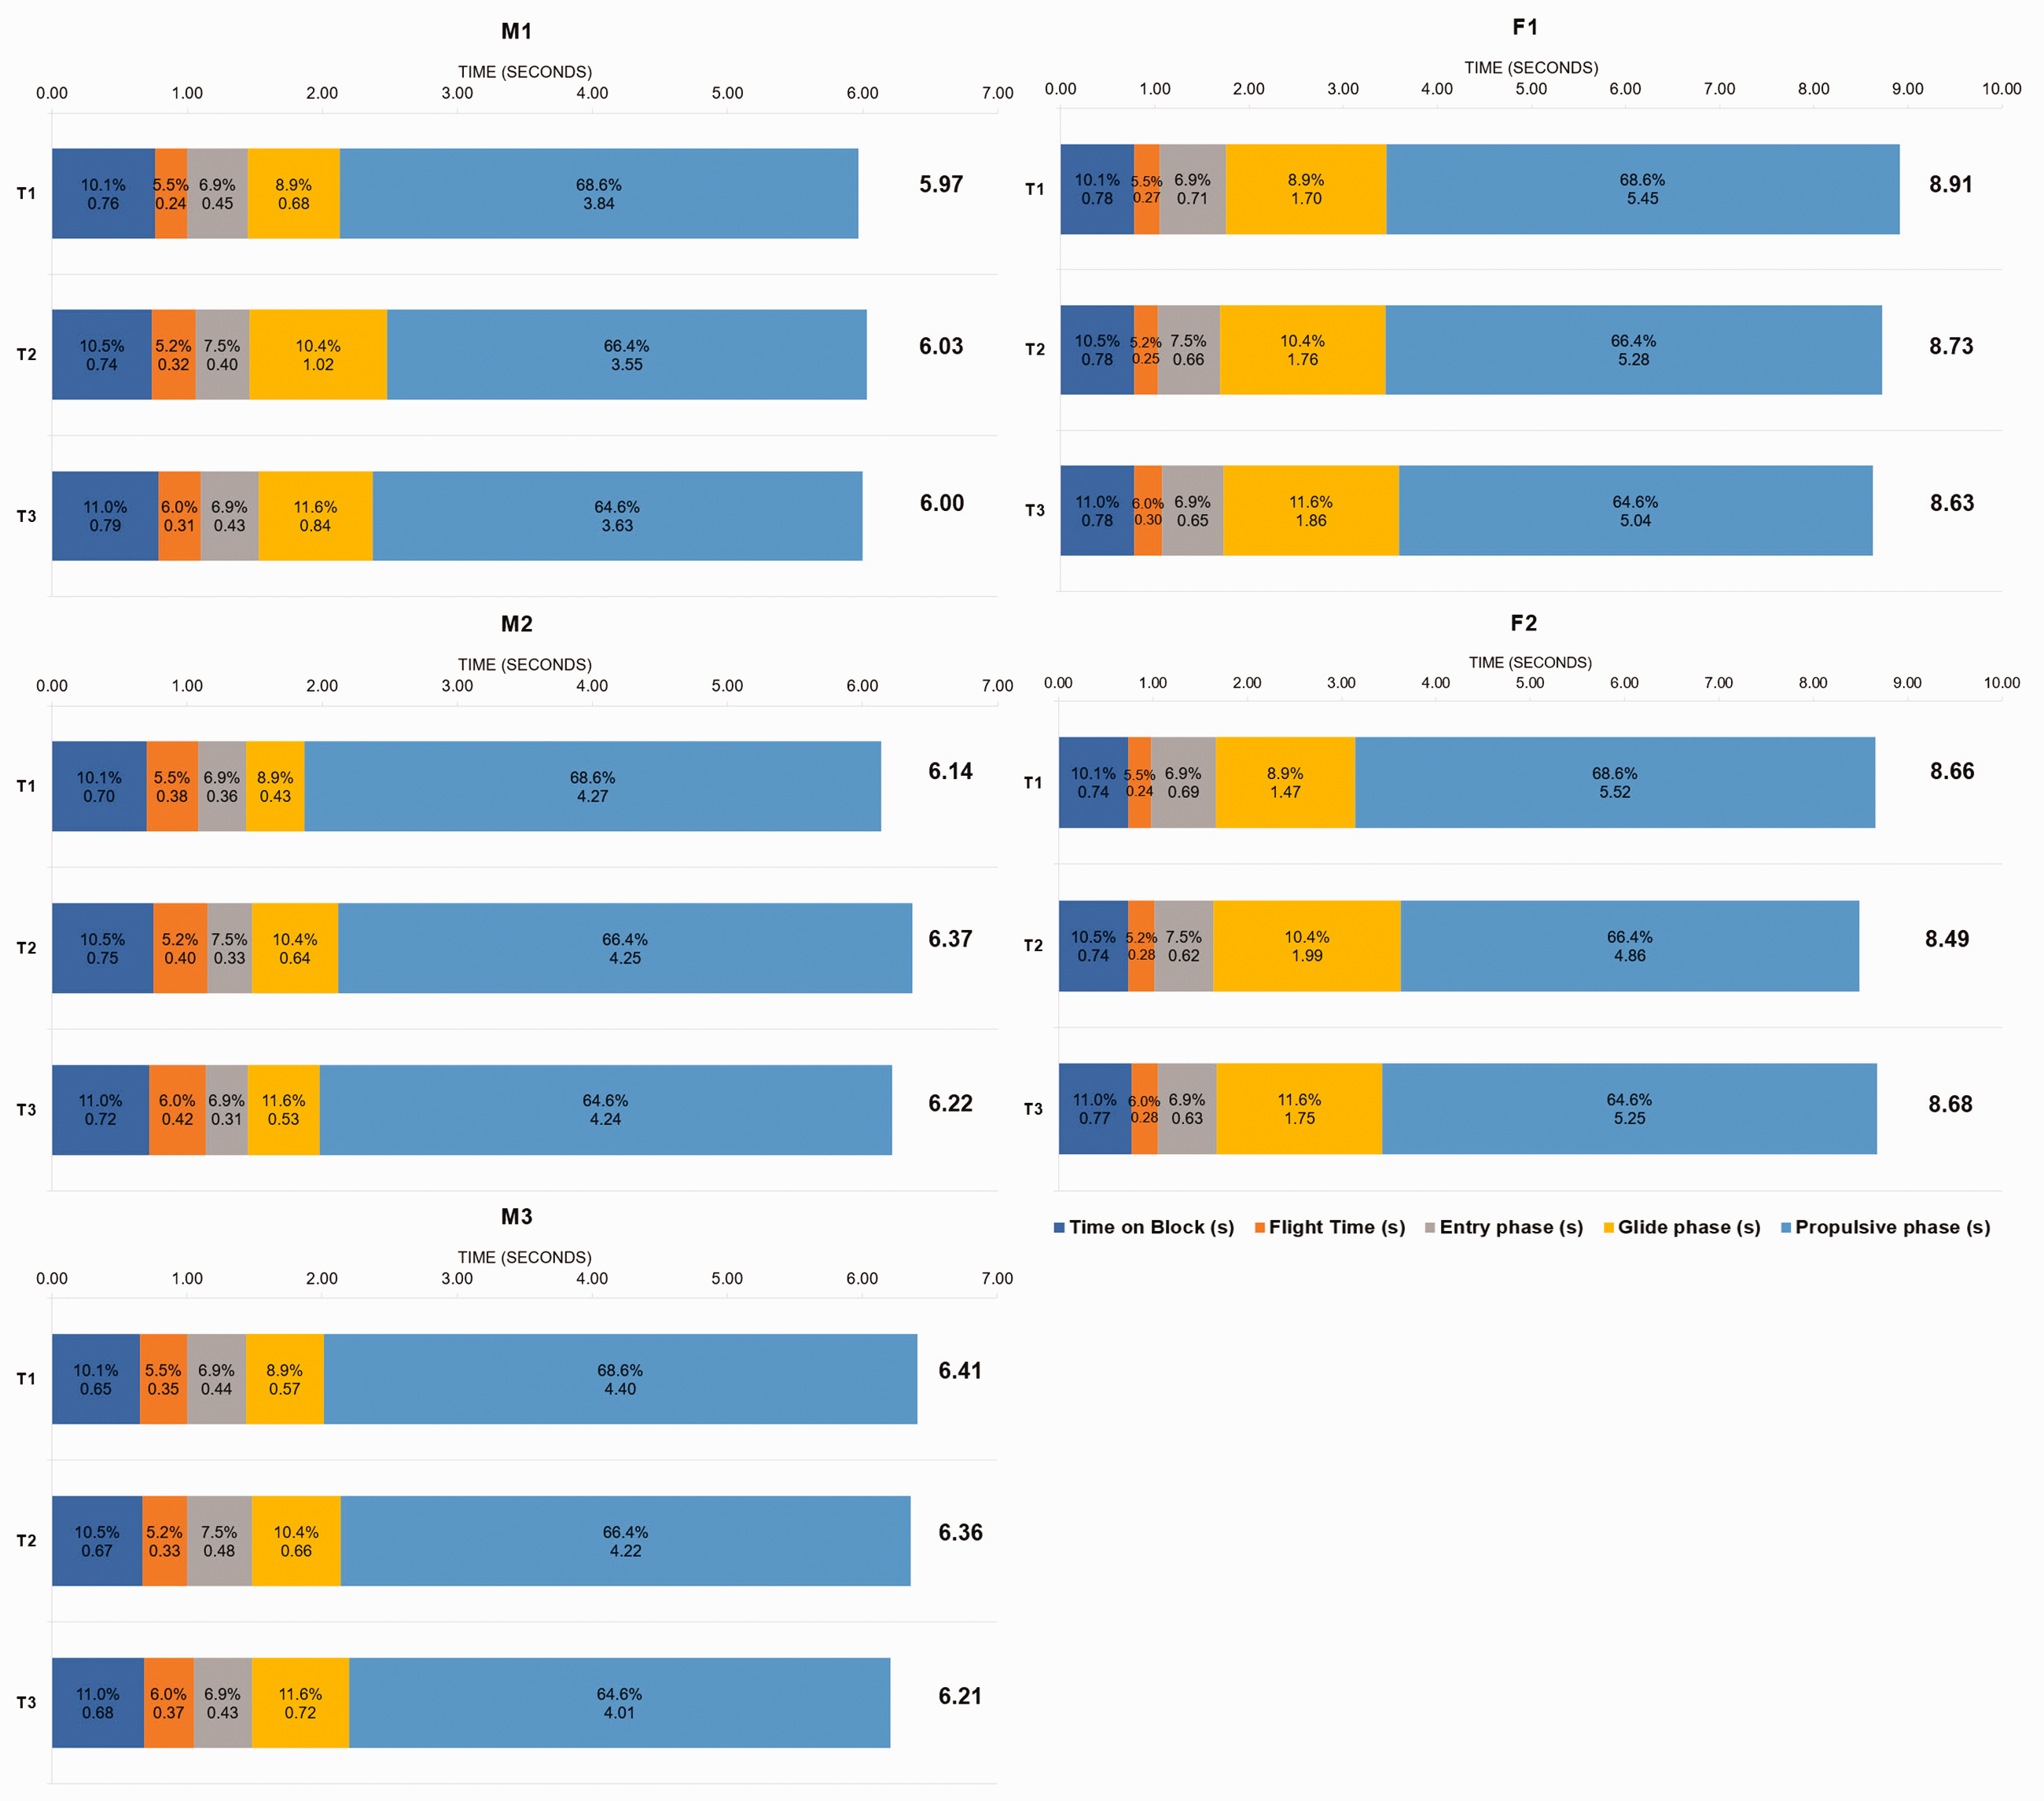
Start time to 15 m of each participant across the season in the respective phases of the swim start.
Repeated measures correlation
The repeated measures correlations analysis was performed to gain some preliminary insight into how changes in the body composition and SJ force-time variables may be related to changes in swim start performance times (Table 5). Repeated measures correlations revealed moderate to large positive correlations between lower body lean mass, SJ jump height and SJ concentric impulse to the three sub-components of the flight phase. Large negative or positive correlations were observed between total body and lower body lean mass to the in-water phase to 15 m. Of all the variables monitored, total body fat mass was the only variable to show a notable correlation to the overall performance measure of start time to 15 m. Overall, these results indicate significant moderate to large correlations for a variety of body composition, squat jump, and starting block kinetic variables with the time spent in different phases of the swim start, but relatively little relationship to time to 5 or 15 m.
Repeated measures correlation (rrm) scores and 95% confidence intervals between body composition measures, squat jump force-time and swim start kinetic and kinematic variables of the swim start across the three phases of the swim start.

T5m: time to 5 m; T15m: time to 15 m; T1st kick: time of first kick; Bolded values indicate a moderate to large rrm score.
*p < 0.05; **p < 0.01.
Discussion
To our knowledge, this is the first study to quantify how body composition, lower body force-time, and swim start performance characteristics of high performance swimmers change over the course of a competitive season, and how these changes may be related at an intra-individual level. The present case series primarily demonstrated that over the course of a competitive season of concurrent swimming and dry-land resistance training, the swimmers tended to improve their lower body lean mass and SJ jump height, although changes in start performance times to 5 and 15 m varied between athletes. Results indicated very large positive correlations between changes in lower body lean mass and the flight phase, along with large correlations between increases in lean mass and longer glide time, and reduction in the time spent in the entry and in-water propulsive phases. The correlational analyses also indicated large to very large positive relationships between SJ jump height and concentric impulse to the take-off angle and flight phase of the swim start.
Much of the current literature has highlighted the importance of horizontal take-off velocity in the block phase, being the on-block variable most related to time to 15 m.12,36 An unexpected finding in the current study was that all participants experienced a decrease in horizontal take-off velocity from the first to the final testing session, although this was not associated with a reduction in start performance as might have been expected based on previous research. However, it is also worth noting that the previous research highlighting the importance of horizontal take-off velocity has been cross-sectional rather than longitudinal in nature. The results of the present study suggested that the combined effects of an increase in vertical drive (as indicated by the change in vertical take-off velocity over time) and take-off angle of the swimmer’s centre of mass contributed to an increase in flight time and therefore further entry distance over time. This is explained using the laws of projectile motion, whereby the swimmers’ centre of mass (COM) is considered a projectile once they have left the starting block and the flight distance (of the COM, not necessarily individual parts of the body) to water entry is determined by take-off speed, angle, and relative height. 37 It was interesting to note that positive shifts in body composition and lower body force-time characteristics were associated with an increase in take-off angle (although the take-off angle was still negative i.e. below horizontal).
While the lack of association between horizontal take-off velocity and start time was surprising, greater flight distances corresponding to faster time to 15 m have previously been observed at the Sydney 2000 Olympic Games. 9 A similar trend was reported in an analysis of the phases of the swim start by Ruschel et al., 38 with a significant negative correlation between flight distance and start time to 15 m (r = –0.48). While Ruschel et al. 38 concluded that differences in horizontal velocity at take-off primarily determined the differences in the flight distance in their cross-sectional study, the results of the present study suggested that the swimmers in the present study adapted their block phase technique in a way that favoured take-off angle and vertical take-off impulse as a mechanism to further increase their entry distance over the year, rather than increasing horizontal velocity.
Positive changes in physical preparation variables were also associated with a longer glide phase and a shorter time spent in the in-water propulsive phase over the monitoring period. A further investigation into the correlation between the sub-phases of the swim start to time to 15 m at an intra-individual revealed significant moderate correlation of the time spent in the propulsive phase to the overall start time (r = 0.66). While it is not possible to provide definitive evidence of what drove these changes, there are several potential mechanisms that could help explain these findings.
Firstly, the improvements in body composition, SJ concentric impulse and jump height is indicative of improvements in the swimmers’ relative force production capability that allowed a greater entry distance, as noted previously. 39 Entry distance is significant in swim starts as the flight phase off the blocks represents the highest velocity the swimmer is travelling anywhere in the race, and entry into the water results in a substantial reduction in that velocity due to water resistance (hydrodynamic drag) exceeding air resistance. 40 As such, greater entry distance observed in the present study represents an extension of that high velocity slightly further into the race. Second, it is possible that the reductions in total body mass and fat mass for some swimmers may have resulted in decreased frontal surface area and therefore some reduction in hydrodynamic drag. Such changes may have allowed the swimmers to hold the glide phase for a longer duration to maintain the velocity acquired in the preceding phase and initiate their first kick later in the underwater phase. 41 However, it must be acknowledged that no direct assessment of frontal surface area or hydrodynamic drag was actually performed, and thus this explanation is purely speculative.
Previous research has highlighted the importance of the underwater phase as it is the longest phase of the swim start and is when the swimmer is travelling at their fastest through the water.12,40,42 As the free swim velocity that occurs when a swimmer resurfaces to commence the first stroke is directly related to the final velocity of the underwater phase, ensuring minimum loss in velocity during the underwater-to-free swim transition is crucial. 43 There are a couple of potential interpretations based on the mixed results in this study. For swimmers who had a notable decrease in the relative contribution of the in-water propulsive phase to time to 15 m (M3 and F1), this may support the contention that M3 and F1 had a more efficient underwater phase at the end of the season, either through improved underwater propulsion or reduced hydrodynamic drag. However, the changes in performance times for others may be more associated with efficiencies in the earlier flight, entry, and glide phases.
Although several elements were similar in the entire sample of swimmers, some inter-individual differences were observed from the first to the final testing session. For example, total body fat mass decreased by 0.7–2.9 kg in two swimmers (M3 and F1), remained unchanged for F2, but increased by 0.4–0.5 kg in M1 and M2. Despite a decrease in total body lean mass in M1 (–0.8 kg), an increase in lower body lean mass was observed (+1.3 kg) across time. For the other four participants, the improvements in total body lean mass over the season was largely attributed to an increase in lower body lean mass. Previous investigations have found lean mass to increase during the season,6,8 with Pyne et al. 8 noting noticeable reductions in body fat accompanied by modest increases in total body lean mass in elite swimmers. Notable improvements in total body lean mass, and lower body lean mass, as well as lower body force-time characteristics, were observed in M3 and were associated with a substantial reduction in start time to 15 m from 6.41 s to 6.21 s from the first to the final testing session.
The marked improvements in SJ jump height and concentric impulse in M3, which subsequently appears to have contributed to reductions in start time to 15 m could be explained by the greater potential for improvements in lower body force-characteristics in M3 compared to the other two males. Previous research has established a minimum concentric impulse of 200–230 N s in the SJ as being required for a fast start time to 15 m, with any additional impulse production appearing to have diminishing returns for improving swim start time in male swimmers. 23 The improvements in swim start performance in M3 observed may therefore be explained by the increases in their concentric impulse production over time. Specifically, M3 had an initial concentric impulse of 203.7 N s in comparison to M1 and M2 who had baseline results of 261.2 N s and 236.6 N s. This suggests that M1 and M2 were already above the required threshold in concentric impulse for an optimal swim start performance. This could mean that for M1 and M2 to improve their swim start performance further, possible training focus could be on improving the technical aspect of their swim start and/or on improving their power and rate of force development rather than their strength characteristics. For female swimmers, SJ concentric impulse and other factors such as RSImod and concentric rate of power development were identified as significant predictors to time to 15 m. 23 As concentric impulse and RSImod were relatively unchanged for both female swimmers, it is possible that the substantial loss of total body fat mass and a concomitant increase in lean mass, combined with changes in technical factors in the flight and underwater phase could explain much of the improvements in start performance in F1 across the season and for F2 between the first and second testing session (T1 and T2).
Conclusion
Overall, the findings of this study provided some preliminary insight into how swim start performance, lower body force-time characteristics, and body composition may change over a year in high performance swimmers performing concurrent swimming and resistance training. An association between increased lower body lean mass and SJ force-time metrics to improvements in aspects of swim start performance were observed, with the primary contributions of these changes being to the flight and in-water phase of the swim start. Based on these results, emphasising improvements in lower body lean mass and SJ force-time metrics and assessing these periodically in a long-term monitoring program may contribute to enhanced swim start performance in high performance swimmers. The interactions between physical and technical determinants of swim start performance highlights the need for an interdisciplinary approach to improving swim start performance in high performance swimmers. Strength and conditioning coaches and sport science practitioners should consider an individualised approach when assessing performance parameters and program design to improving swimmers’ start performance. We acknowledge the inherent limitations of this study being a case study design with small sample sizes. Notwithstanding these limitations, this study offers insights into the magnitude of change in body composition, lower body force-time characteristics, and swim start performance of high performance swimmers changes throughout a competitive season and how these factors may be interrelated.
Footnotes
Acknowledgements
The authors would like to acknowledge Dr Tom Vandenbogaerde for his assistance with data collection.
Declaration of conflicting interests
The author(s) declare no potential conflict of interest with respect to the research, authorship, and/or publication of this article.
Funding
The author(s) disclosed receipt of the following financial support for the research, authorship, and/or publication of this article: This work was supported by the Queensland Academy of Sport’s Sport Performance Innovation and Knowledge Excellence Unit in conjunction with Bond University Faculty of Health Sciences and Medicine.
