



Abstract
The aim of the study was to examine the evolution of players' perception of group variables (leadership, motivational climate, cohesion, and collective efficacy) and to determine whether the intercept and growth trajectory differed as a function of whether expectations have or have not been met in a sample of semi-professional Spanish football players. The results show that the levels of the variables (except for autocratic leadership and coach-created ego climate) decrease over the season. Furthermore, the mean scores of the “fully meets expectations” group were significantly higher in positive leader characteristics, coach-created task climate, cohesion and collective efficacy. Also, rates of decline were significantly greater in the “does not meet expectations” group. The results indicate the importance of establishing reachable expectations by coaches and players because to achieve or to miss the expected goals can affect psychological group dynamics.
Given the importance of psychological factors in sport in recent years, group processes that may have an impact on improving performance have been examined. 1 Thus, many cross-sectional studies have been carried out, confirming that variables like cohesion, motivational climate, collective efficacy or leadership can make a difference to achieving success.2–5 In contrast, there has been little longitudinal research attempting to analyze how these variables manifest over a season3,6 and whether any factor determines their variations. 7 One aspect that can affect the player's perception of the team is achieving or missing the expectations created by the team 8 because approaching or drawing away from the expected results can lead to the emergence of positive or negative behaviors within the group. 4 Therefore, it may be relevant to know how the growth trajectory of each variable varies during the season and whether meeting or missing the expectations created by the coach and players can determine these changes.
Dynamic variables
One reason for examining these variables together (e.g., leadership, motivational climate, cohesion, collective efficacy) draws from the fact that they have been identified as psychological variables on which players on sports teams base their expectations and judge the team's effectiveness.8,9 Furthermore, Carron and Eys, 10 from the conceptual framework of the study of sport teams, suggest that these factors are associated with team functioning.11,12 In fact, there is much research that has found positive links between these variables,3,4,13 and, in turn, with performance.2,7,14 However, it is important to note that only a few studies have attempted to explain the reasons for the evolution of these dynamic variables during a season. Some authors have emphasized that fulfilling the expectations created 7 or achieving a good performance5,15 might lead to the appearance of more adaptive behaviors in the group, such as greater cohesion, 7 collective efficacy5,16 or democratic leadership, 17 and therefore, promote changes in the perception of these psychological variables and in later performance.
Taking into account each variable, leadership, motivational climate, cohesion, and collective efficacy have been considered changeable elements that depend on several factors. In fact, leadership, grounded on the multidimensional model of leadership, 18 is affected by a number of antecedents among which are the situational factors. 17 Thus, a coach may display diverse types of leadership—training and instructions, social support, positive feedback, and democratic behavior, and autocratic behavior—which will fluctuate depending on the team situation. 17 In the same vein, motivational climate, embedded in the achievement goal theory, 19 is of a situational nature and may be affected by social and dispositional factors. Thus, coaches can establish an ego climate or a task climate in the teams. In a task-involving climate, coaches encourage effort and reward task mastery and individual improvement. In contrast, in an ego-involving climate, coaches focus on social comparison and normative ability, linking acknowledgement to normative success. 20 In this regard, it has been shown that these types of motivational climate are not orthogonal and that they change over time depending on group interactions. 21
Group cohesion has been defined by Carron et al. 22 as “a dynamic process that is reflected in the tendency for a group to stick together and remain united in the pursuit of its instrumental objectives and/or for the satisfaction of members’ affective needs” (p. 213). As expressed in the definition, this process changes over time and is affected by a series of personal, environment, or team factors, which can significantly increase group cohesion.2,22 This cohesion is reflected in four dimensions: Group Integration-Task (GI-T), Group Integration-Social (GI-S), Attraction to the Group-Task (ATG-T) and Attraction to the Group-Social (ATG-S). Therefore, it may be important to measure the dimensions that can be influenced by achieving or missing the expectations to provide useful information to coaches to deal with their actions and trainings.
Lastly, collective efficacy is defined as “a sense of collective competence shared among individuals when allocating, coordinating, and integrating their resources in a successful concerted response to specific situational demands” (p. 309). 23 Within the model of collective efficacy proposed by Beauchamp, 8 has different antecedents, with emphasis on past performance and success expectations. 9 This suggests that assessment of the fluctuations as a function of achieving the expectations established at the beginning of the competition may raise awareness of the need to maintain these levels in the team for the entire season.3,7,16,24
Hence, as previously indicated, due to the existing relationships between those constructs, 25 it would be interesting to know how these variables progress during the season, as they are dynamic variables. Some works have indirectly examined diverse variables at different moments over a season, obtaining similar results: The levels of task climate,3,21 cohesion3,6,7 and collective efficacy3,6,24 decreased as the season advanced and the season's end approached. Only the study of Reinboth and Duda 26 did not find significant changes in task- and ego-involving climate, which might be due to the fact that the sample was made up of university players, where motivational climate may be more stable.
Meeting expectations
From Bandura’s 9 efficacy theory comes the idea that a person's expectations are determined by a series of elements such as performance achievements, vicarious experience, verbal persuasion, emotional state, physiological states, … If we consider a sports group, there are surely other group elements that can determine each player's perceived expectations—such as the team's past performance, cohesion, motivational climate, and leadership—and which interfere with the perception of group efficacy. 8 Therefore, when establishing expectations, people carry out an overall assessment of the aspects that may affect their performance and they determine the goals than can be reached. Research findings suggest that athletes with high expectations achieve a better performance than athletes with low expectations. 27 But, when considering sports teams and long-term goals, establishing excessively high expectations, and in some cases even unattainable ones, may produce adverse effects as time passes. 7 As stated by Johnson and Fowler, 28 when people have too much confidence in their possibilities, they can create unrealistic expectations and, with the passage of time, this produces negative effects on decision-making, communication, and group relationships. 29 Thus, if the raised expectations are not met, more pressure may be generated. This may provoke players' lack of interest and a decrease in motivational work climate, effort, union among the team players, and confidence in teammates to achieve success, or else the coach's leadership may change or decrease in importance within the team. 4 Therefore, instead of setting too ambitious expectations, coaches should strive for realistic levels of team confidence and attainable expectations throughout the season7,28,29 because the team's success or failure can play an important role when determining its functioning. 5
Despite this fact, little research has focused on how meeting expectations can explain the reasons for this decrease in group variables. Some authors have emphasized that teams that achieve their expectations or their expected performance generate a task motivational climate in the group, with greater union and more confidence emerging in the team,5,7,8,25 and therefore, optimizing team functioning. Contrariwise, teams that do not achieve their expectations or their expected performance generate a tenser climate, and more maladaptive behaviors emerge. 7
The present study
Therefore, our research presents new information about the evolution of these variables in semi-professional football players, with the aim of examining whether the intercept and growth trajectory of each variable differed as a function of achieving or missing the expectations. Furthermore, the manuscript presents three assessments at three different time points, analyzed through multilevel analysis, which can provide a broader view of the fluctuation of these variables. This type of analysis offers great advantages for the examination of these group processes in the field of psychology, because it explores the variables at within-person, between-person, and between-team levels 30 and may provide information to complete the studies developed to date. The target variables are individual perceptions of group dynamics (i.e., cohesion, collective efficacy, motivational climate, and leadership). Each player’s perceptions may vary within teams and between teams. Thus, considering the possible variability in each player over time (i.e., within-person level), between players (i.e., within-person level), and between teams (i.e., between-team level), the examination of these variables at different levels of analysis could provide a deeper understanding of these variations. We established three different groups (“fully meets expectations,” “partially meets expectations,” and “does not meet expectations”) as a function of how initial expectations approach or recede from the final classification and to examine the group differences in the diverse variables.
Thus, based on previous studies6,7,21,24 we hypothesized that the levels of positive factors of leadership (training and instructions, social support, positive feedback, and democratic behavior), coach-created task climate, cohesion, and collective efficacy will drop at the end of the season. In addition, we hypothesized that players in “fully meets expectations” teams would score higher and display less decrease over time in the positive aspects of the diverse variables (positive leadership, coach-created task climate, cohesion, and collective efficacy) compared with players in the “does not meet expectations” teams, 7 who would score lower and show less decrease in the negative factors (autocratic leadership and coach-created ego climate).
Method
Participants
The participants were semi-professional male football players from twenty Spanish teams that participated in the same competition in Group 14 of the third division. At the beginning of the season (Time 0), we recruited a total of 377 players, ranging in age from 16 to 39 years with a mean age of 24.51 years (SD = 3.73) and with 1 to 22 years’ experience playing amateur football from (M = 15.83, SD = 4.36). The number of players per team ranged from 16 to 24 players, with an average of 18.85 players per team (SD = 2.41). At the middle of the season (Time 1), there were a total of 339 players, ranging in age from 16 to 38 years with a mean age of 24.41 years (SD = 4.24) and with 1 to 20 years’ experience playing amateur football from (M = 14.97, SD = 4.07). The number of players per team ranged from 10 to 21 players, with an average of 16.95 players per team (SD = 2.58). At the end of the season (Time 2), there were a total of 303 players, ranging in age from 16 to 39 years with a mean age of 24.58 years (SD = 4.26) and with 1 to 22 years’ experience playing amateur football from (M = 15.35, SD = 4.24). The number of players per team ranged from 6 to 22 players, with an average of 15.15 players per team (SD = 3.99).
Instruments
Leadership behaviors
Coach leadership behaviors were assessed using an adapted Spanish version of the Leadership Sport Scale developed by Crespo et al. 31 This is a 40-item instrument designed to measure five dimensions of leadership: Democratic behaviors (i.e., “My coach asks for the opinion of the athletes on strategies for specific competitions”), Autocratic behaviors (i.e., “My coach speaks in a manner not to be questioned”), Training and instruction (i.e., “My coach sees to it that efforts are coordinated”), Social support (i.e., “My coach looks out for the personal welfare of the athletes”), and Positive feedback (i.e., “My coach gives credit when it is due”). Responses were rated on a 5-point scale ranging from strongly disagree (1) to strongly agree (5). Confirmatory factorial analysis (CFA) was performed to verify that the model fit was appropriate, obtaining acceptable values at the three time points (Time 0: χ2(265) = 517.78, p < .001, CFI = .90, TLI = .90, RMSEA = .06, SRMR = .05; Time 1: χ2(265) = 537.65, p < .001, CFI = .90, TLI = .90, RMSEA = .05, SRMR = .05; Time 2: χ2(265) = 556.70, p < .001, CFI = .91, TLI = .90, RMSEA = .05, SRMR = .06).
Perceived Coach Motivational Climate
The Spanish version of the Perceived Coach Motivational Climate in Sport Questionnaire-2 developed by Balaguer et al., 32 was used. This questionnaire consists of 33 items that measure six dimensions of Task- involving (i.e., “The coach tells us that trying our best is the most important thing”) and Ego-involving coach climate (i.e., “The coach pays the most attention to the best players”). In this paper, we were interested in the two higher order dimensions and not in the lower order dimensions. Responses were rated on a 5-point scale ranging from strongly disagree (1) to strongly agree (5). CFA showed acceptable values of model fit at the three time points (Time 0: χ2(53) = 144.72, p < .001, CFI = .93, TLI = .91, RMSEA = .06, SRMR = .06; Time 1: χ2(53) = 170.02, p < .001, CFI = .92, TLI = .90, RMSEA = .07, SRMR = .06; Time 2: χ2(53) = 187.76, p < .001, CFI = .95, TLI = .93, RMSEA = .07, SRMR = .05).
Group Cohesion
The Spanish version of the Group Environment Questionnaire developed by Leo, González-Ponce, Sánchez-Oliva et al., 33 was used to assess team cohesion. This 12-item inventory comprises four factors: Group Integration-Task (i.e., “Team members are united in their efforts to reach their performance goals in training sessions and matches”), Group Integration-Social (i.e., “Team members would like to spend time together in situations other than training and games”), Individual Attraction to the Group-Task (i.e., “On this team, I can do my best”), and Individual Attraction to the Group-Social (i.e., “The team is one of the most important social groups I belong to”). Responses were rated on a 5-point scale ranging from strongly disagree (1) to strongly agree (5). CFA showed acceptable values of model fit at the three time points (Time 0: χ2(48) = 114.36, p < .001, CFI = .94, TLI = .91, RMSEA = .05, SRMR = .04; Time 1: χ2(48) = 74.47, p < .001, CFI = .97, TLI = .96, RMSEA = .04, SRMR = .04; Time 2: χ2(48) = 115.48, p < .001, CFI = .93, TLI = .91, RMSEA = .06, SRMR = .05).
Collective Efficacy
To assess collective efficacy, the Football Collective Efficacy Questionnaire developed by Leo et al. 7 was used. This instrument starts with a stem phrase (i.e., “Our team’s confidence in our capability to…”) and has a total of 26 items that refer to some offensive (i.e., keeping ball possession in the face of rival pressure) and defensive football situations (i.e., “… to defend set piece ball situations”), which are grouped into a single factor. Players responded to all items on a five-point scale ranging from bad (1), to excellent (5). CFA showed acceptable values of model fit at the three time points (Time 0: χ2(298) = 684.38, p < .001, CFI = .90, TLI = .91, RMSEA = .05, SRMR = .05; Time 1: χ2(298) = 686.34, p < .001, CFI = .90, TLI = .90, RMSEA = .05, SRMR = .05; Time 2: χ2(298) = 689.17, p < .001, CFI = .90, TLI = .90, RMSEA = .05, SRMR = .05).
Meeting Expectations
To measure meeting or missing the expectations, we calculated a quotient between the team expectations at the start of the season and the final classification obtained in the league.
7
To obtain team expectations, we calculated the average classification position considered adequate by team players at the start of the season (i.e., players’ expectations), and we then calculated the mean with the classification position established by the coach at the start of the season (i.e., coach’s expectations), because coaches have more expertise in determining the team’s expectations.
34
Responses to both expectations (i.e., players’ and coach’s expectations) were rated on a 20-point scale ranging from first position (1) to last position (20). The value was divided by the final classification achieved by the team, ranging from first position (1) to last position (20), with a score ranging from .35 to 1.37, with higher values indicating that the teams met the expectations created. On the basis of these data, we made up three groups of teams as a function of percentile 33, obtaining a “Does Not Meet Expectations” group (<.59), a “Partially Meets Expectations” group (.60–.89), and a “Fully Meets Expectations” group (>.90).

Procedure
We used a correlation methodology with a longitudinal design. We carried out three assessments at three different time points. Measurements were taken within three weeks of the beginning of the sport season (at the end of the preseason, to ensure that the players had practiced for at least month and a half), at the middle (between the end of the first round and the beginning of the second round of competition), and at the end of the season (when the season was just ending), separated by a 20–22 weeks interval.
The study received ethical approval from the University (239/2019). All participants were treated according to American Psychological Association ethics guidelines regarding consent, confidentiality, and anonymity of responses. Informed written consent was obtained from all participants prior to the administration of the questionnaires. Data collection took place at the clubs in group settings under the supervision of trained research assistants. Questionnaires were matched over time using a coding system to protect anonymity.
Data analysis
Multilevel regression analyses, employing MLWin 2.18, was used to examine changes in all variables over the three time points. This type of analysis is particularly useful when there are missing observations, as it does not assume an equal number of measurement occasions for all individuals. Three level of analysis were specified. Level 1 encompassed the repeated observations of all variables. These observations were nested within athletes, therefore the latter constituted Level 2 in the analysis. Teams were the third level of analysis.
The analysis had two parts. The first part examined whether there were significant between-person variations in the means (intercepts) and rates of change (growth trajectories) of all variables under investigation. The second part examined whether these changes differ as a function of meeting expectations (see Supplemental Table 1).
Results
Descriptive statistics and Cronbach’s alpha coefficients
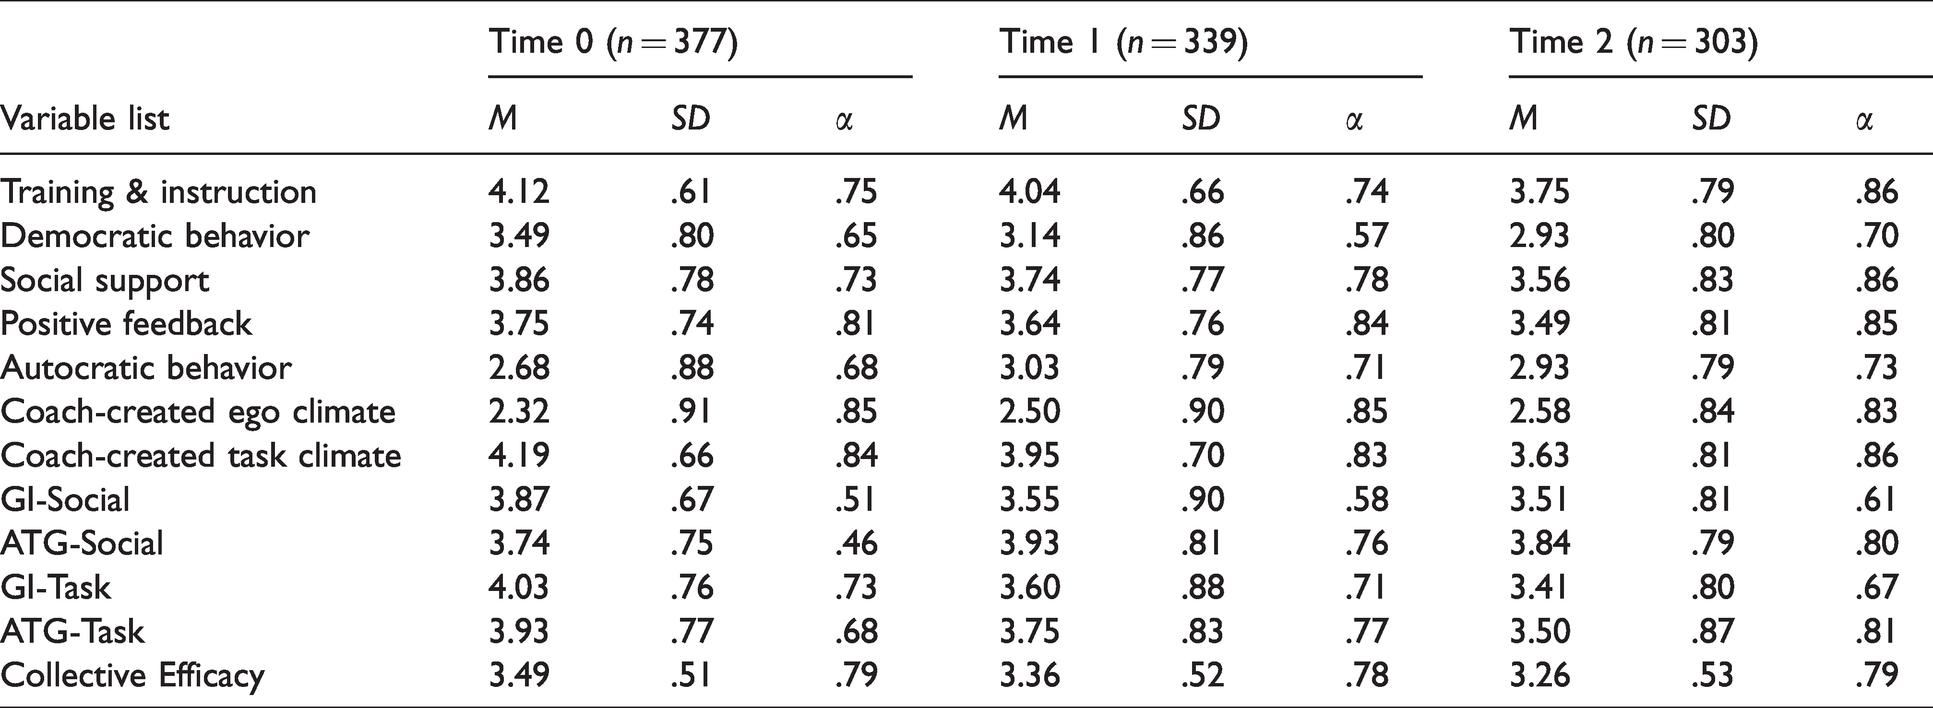
Means, standard deviations, and Cronbach’s alpha coefficients for each variable at each time point can be seen in Table 1. All scales showed acceptable internal consistency at all three times (i.e., α > .70), with the exception of some variables of the cohesion scale (GI-S at Times 1, 2, and 3, and ATG-S only at Time 1) and democratic leadership (at Times 1 and 2). Although these variables had lower values than those typically reported (i.e., α < .70), Loewenthal 35 recommended that values above .50 should be considered suitable if there is good validity evidence, good theoretical support for the scale, and there are fewer than 10 items. As the present scales meet all these criteria and these low values were only found in some of the time points, we decided to include them in the analysis. In general, participants reported levels of training and instruction, social support, positive feedback, and democratic leadership behaviors, coach-created task climate, cohesion, and collective efficacy above the midpoint of the scale. However, participants reported autocratic leadership and coach-created ego climate close to the midpoint of the scale.
Means, standard deviations, and Cronbach’s alpha coefficients of all study variables.
Variations in intercepts and growth trajectories of all variables
Following Singer and Willett’s 36 approach, we first tested a series of unconditional (i.e., intercept-only) models, one for each variable under investigation. Their purpose was to examine whether there was sufficient between-person and between-team variation in the intercepts. The results revealed that there was variability in the intercepts of some of the variables (see Table 2). Intraclass correlation coefficients expressing the variability at the team level as a function of the total variability ranged from 0 to .38 (Mdn = .13). Intraclass correlation coefficients expressing the variability at the athlete level as a function of the total variability ranged from 0 to .46 (Mdn = .23).
Linear changes in all variables over the three time points.

Note: R2 ε = Percentage of within-person variation accounted for by time.
* p < .05. ** p < .01.
We also tested a series of conditional growth models to examine the rates of change of the variables. With three time points, only linear changes could be examined. “Time” was centered at Time 1 (i.e., the first wave of measurement was coded 0). The growth trajectories are presented in Table 2. As can be seen, the linear term (i.e., slope) for time was negative (i.e., indicating decrease over time) for all four positive leader dimensions, coach task climate, three of the four cohesion dimensions, and collective efficacy. In contrast, the slope for time was significant and positive (i.e., indicating increase over time) for autocratic leader behaviors and coach ego climate. No significant temporal changes were observed for ATG-S. These slope coefficients represent fixed effects (i.e., average change) over time across the whole sample. An inspection of the between-person and between-team variability of these slopes (Table 2) indicates relatively small variability in these rates of change. The R2 ε = in Table 2 indicates the amount of within-person variation in the variables under investigation explained by time. This is an estimate of effect size, analogous to an R2. These values ranged from .01 to .42 (Mdn = .20).
We also examined whether the intercept and growth trajectory of each variable differed as a function of meeting or missing the expectations (“Does Not Meet Expectations,” “Partially Meets Expectations,” and “Fully Meets Expectations”), using dummy variable coding. The reference category for the dummy variable was changed, and the analyses were re-run with another category as the reference point, to ensure that all group comparisons were performed. The results are presented in Table 3. For positive leader characteristics, coach task climate, group cohesion, and collective efficacy, mean scores were significantly higher when expectation achievement was rated as “fully meets”. Also, rates of decline were significantly greater when expectation achievement was rated as “does not meet”. For autocratic leader behaviors, mean scores were significantly higher when expectation achievement was rated as “does not meet”. Differences in group performance ratings were less important for coach ego climate (see Figures 1 to 3).
Variations in intercepts and slope of the variables as a function of expectations.

Note: DN-ME: “Does Not Meet Expectations” group; P-ME: “Partially Meets Expectations” group; F-ME: “Fully Meets Expectations” group. Intercepts of variables sharing the same subscript within the same row do not significantly differ at p < .05. The same notation applies for slope comparisons within the same row.

Variations in slopes from leadership behaviors over the three time points. DN-ME: “Does Not Meet Expectations” group, P-ME: “Partially Meets Expectations” group; F-ME: “Fully Meets Expectations” group.
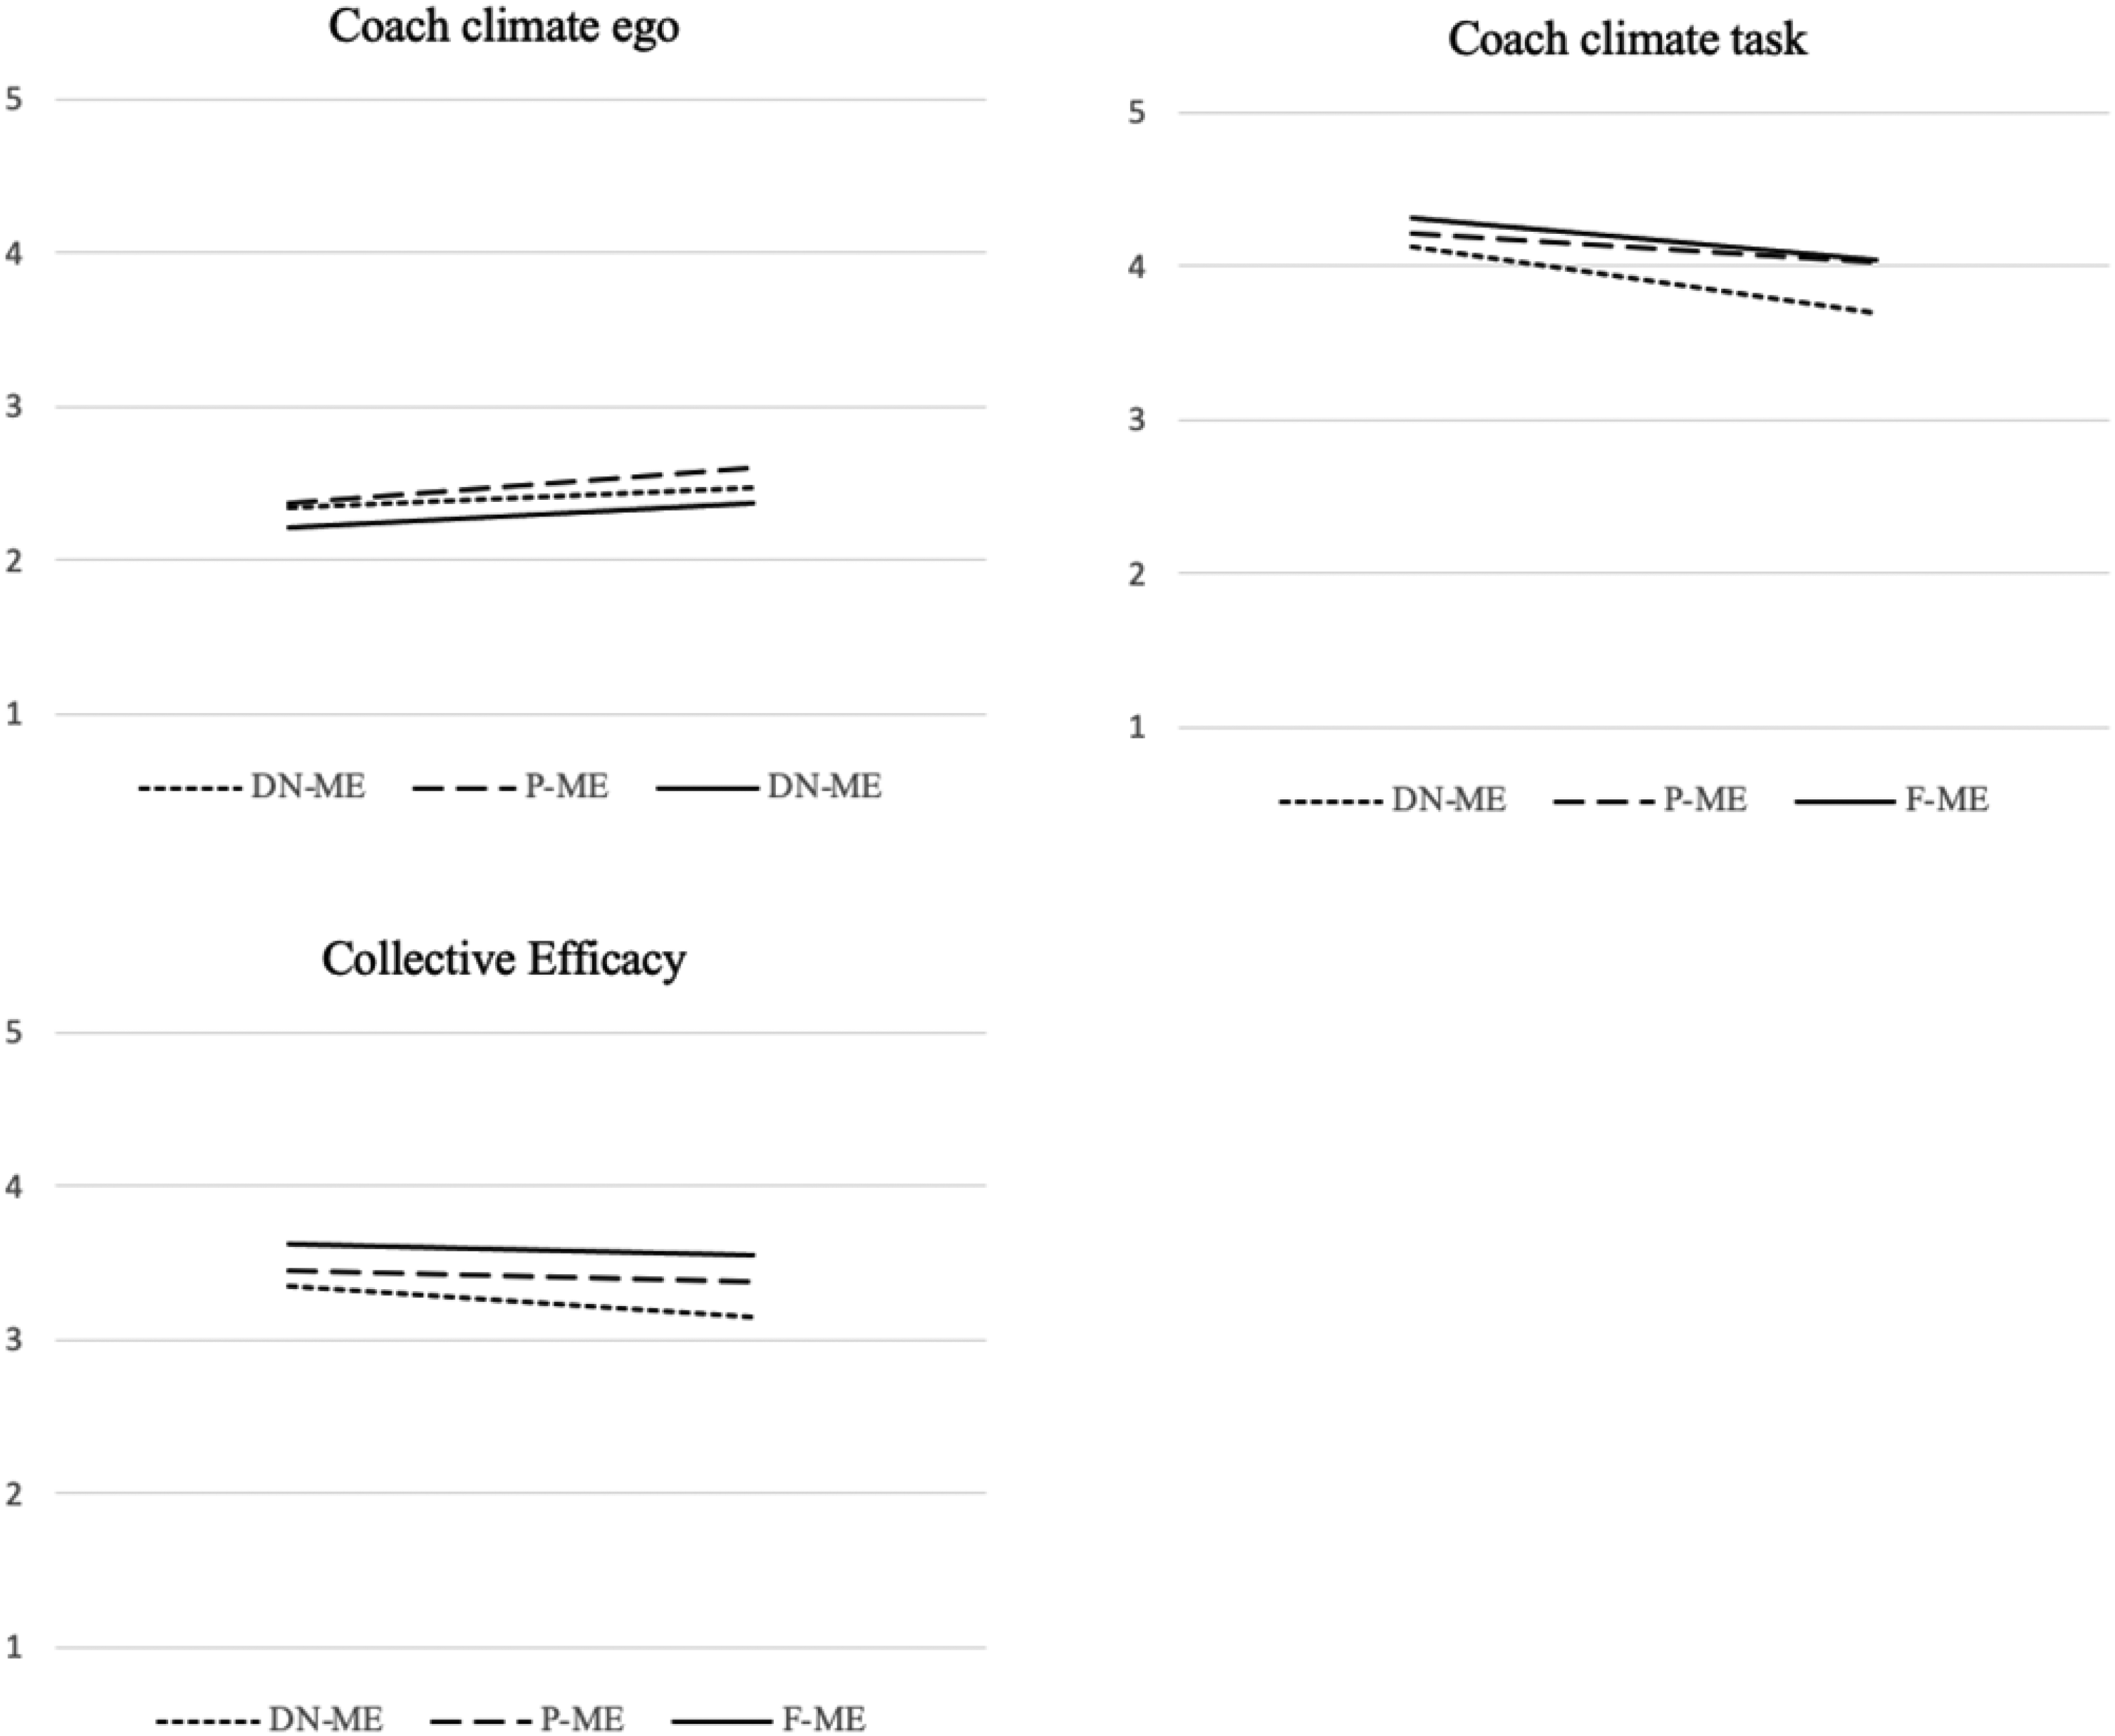
Variations in slopes from perceived coach motivational climate and collective efficacy over the three time points. DN-ME: “Does Not Meet Expectations” group, P-ME: “Partially Meets Expectations” group; F-ME: “Fully Meets Expectations” group.
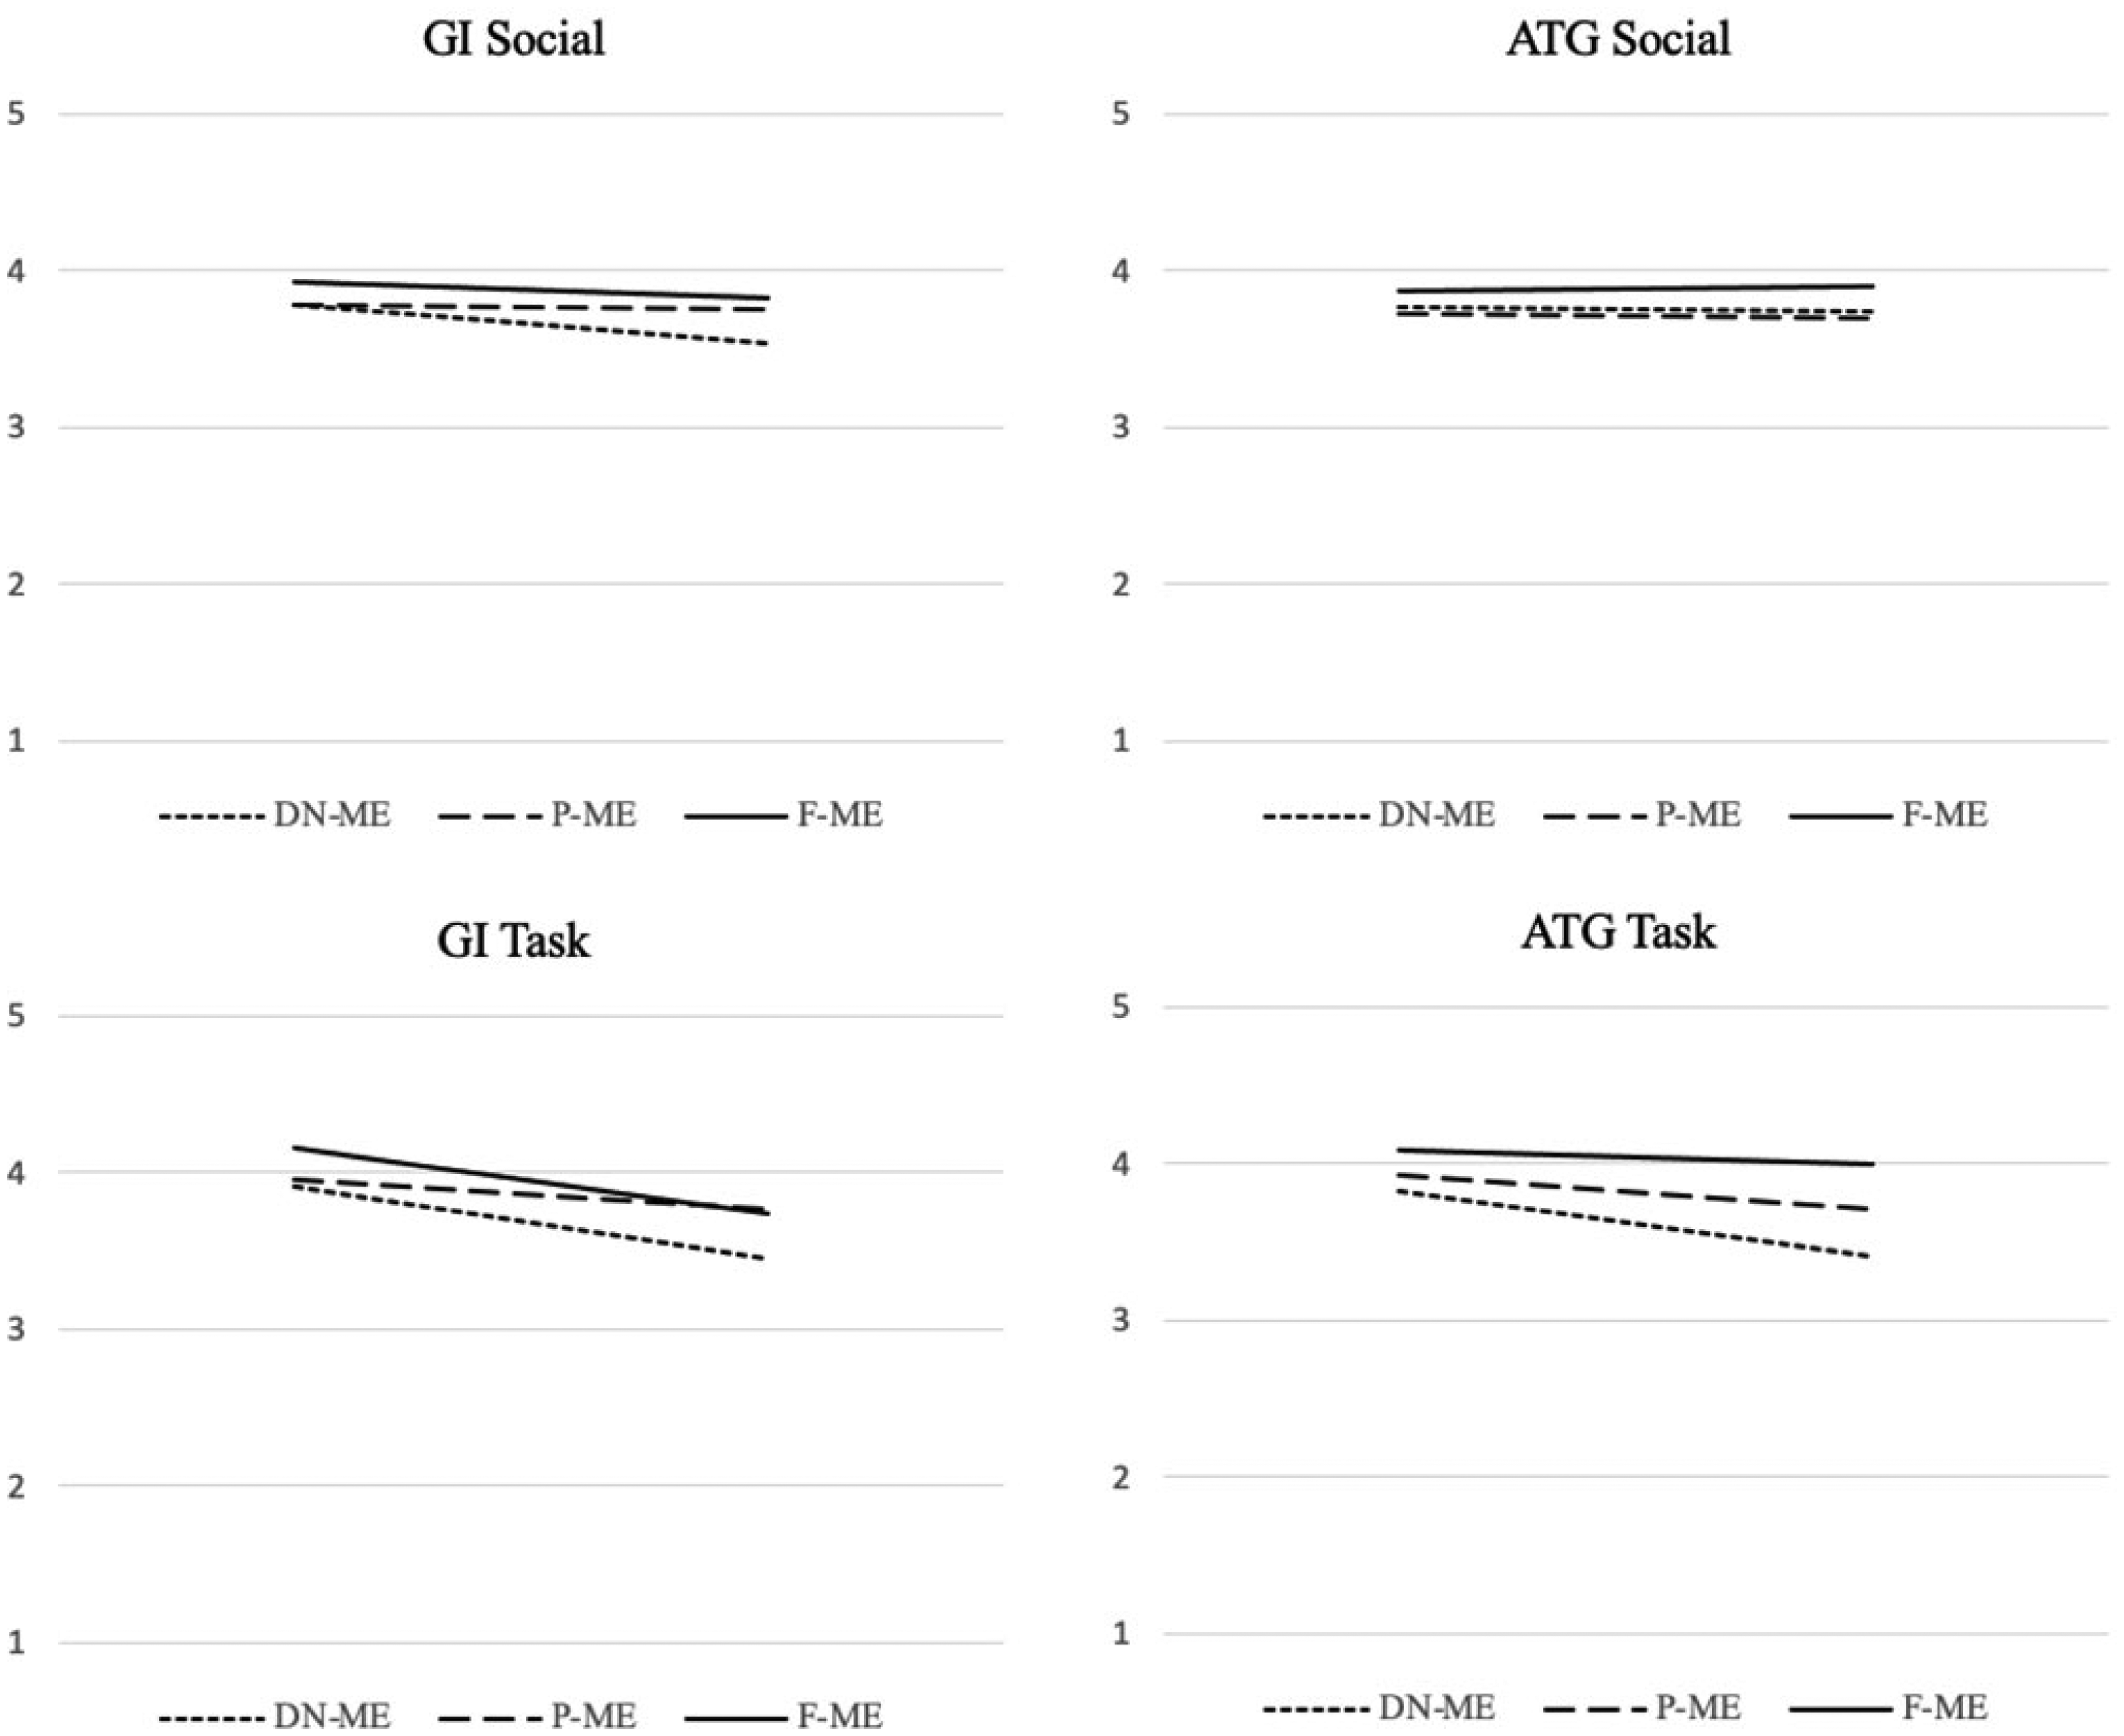
Variations in slopes from group cohesion over the three time points. DN-ME: “Does Not Meet Expectations” group, P-ME: “Partially Meets Expectations” group; F-ME: “Fully Meets Expectations” group.
Discussion
The present study examined the evolution of players' perception of coach's leadership style, coaches’ motivational climate, group cohesion, and collective efficacy. We hypothesized that the levels of positive factors of leadership behavior (training instruction, positive feedback, social support, and democratic behavior), coach-created task climate, task cohesion, and collective efficacy would drop at the end of the season.3,6,7,21,24
Considering the results obtained, leadership factors associated with more democratic styles and player support (training and instructions, positive feedback, social support, and democratic behavior) and coach-created task climate decreased between the start and the end of the season. This apparently indicates that, at the beginning of the season, players perceive that their coaches attempt to use styles that grant more autonomy and confidence, inculcating a climate that rewards improvement and personal effort but as the season advances, this kind of behavior and environment becomes weaker.3,21 Interactions among players, the player-coach relationship, and even sport results, that is, the nature of the situation, are extremely important considerations to understand coach leadership over the season. 10 Therefore, these situations can sometimes produce undesired effects, such as using more autocratic behaviors and fomenting higher competitiveness among teammates. This is reinforced when the coach's autocratic leadership and ego climate evolve inversely, reaching higher values in the final stretch of the competition compared with the start of the league. 3
Concerning variables related to player interactions, team cohesion follows the same trend of results. At the start of the season, players seem to feel strong attraction to the group (ATG-T) and strong team integration (IG-T and IG-S).3,6,7 Over time, these levels are affected, and the group perceives lower levels of cohesion among teammates. Similar results were found by other authors in sports such as handball, 6 basketball 3 and football, 37 and they note that all the cohesion factors decrease their levels as the season advances and the end is nearer. This may be theoretically explained through the definition of this construct, for which Carron et al. 22 revealed that an important characteristic of cohesion is that it is dynamic, that is to say, it can change over time with regard to factors concerning the group. Thus, intensity, length, and frequency of the relationships within the group might be modified in their various forms. Furthermore, the non-achievement of the expected performance over the season, that is, not meeting the expectations as analyzed in this work, can also explain this decline. 7 Nevertheless, we note that individual attraction towards the social group (ATG-S), which describes how the group attracts each player and satisfies his or her social relations, is not affected over time. This reflects that, in spite of all the interactions and conflicts that may emerge over the season, the players' feelings of identification with the social group are not affected.
Lastly, concerning collective efficacy, at the start of season, all the players have great confidence in the group’s capacities to achieve the proposed goals and thereby have a good season. This confidence in the group seems to lose strength as the competitions advance. Various authors, such as Heuzé, Sarrazin, et al., 3 Heuzé et al., 6 Leo et al. 7 and MacLean and Sullivan, 24 also observed a decrease in the levels of collective efficacy from the start to the end of the season. Players who perceive that team expectations for the season are not being met may begin to doubt whether the team really has the necessary capacities to attain the desired classification. 7
Therefore, the first hypothesis is confirmed because levels of positive leadership, group cohesion (except for ATG-S), and coach-created task-climate descended over time. Due to this decrease, we decided to make up three groups as a function of meeting expectations to determine whether there were significant differences in each group.
Thus, our second hypothesis stated that meeting expectations would be a determinant of the evolution of the above-mentioned positive variables. Thus, we expected that players on “Fully Meets Expectations” teams would obtain higher mean scores on leadership behaviors (democratic behaviors, training and instruction, social support, and positive feedback) coach-created task-climate, task cohesion, and collective efficacy. In contrast, players on “Does Not Meet Expectations” teams would obtain higher mean scores on autocratic behaviors and coach-created ego climate.
According to the results obtained, mean scores in positive leader characteristics, coach- task climate, group cohesion, and collective efficacy were significantly higher in the “Fully Meets Expectations” group. Moreover, the decrease in these variables over the season was lower in the “Fully Meets Expectations” and “Partially Meets Expectations” groups compared with the “Does Not Meet Expectations” group. That is, teams with players whose proposed expectations at the start of season were similar to their final classification not only scored higher in the variables related to team success, but also their levels decreased less over the season. 7 In contrast, teams whose proposed expectations were far from their final classification not only scored lower and had a greater decrease in these positive variables, but they also scored higher in variables with negative connotations (e.g., autocratic leadership].
Thus, proposing expectations that match group capacities may be the key to improving performance because success during the season can affect group processes8,10 that will determine the final results. In this way, a cycle is established in which adequate expectations28,29 will have an impact on group processes, and these, in turn, will be essential to improve team functioning.8,10,14 Therefore, the second hypothesis is corroborated, as players on “Fully Meets Expectations” teams score higher and show less decrease in positive leadership, task-related motivational climate, team cohesion, and collective efficacy compared with players on “Does Not Meet Expectations” teams.
Limitations and future research directions
A limitation of our study is that the findings, although longitudinal with three measurements across the sport season, were correlational, and no causal inferences can be established. Thus, we cannot ensure that the results and changes over time are actually produced by poor performance. Also, it is important to note that some variables of the cohesion scale and democratic behavior showed low internal consistency reliability, so the results should be taken with caution and should be considered in further studies.
Another limitation is that the study relied exclusively on self-reports and, therefore, to some extent, our findings are subject to potential influences of shared method variance. Future longitudinal research in this area would do well to obtain records of objective markers of these variables through objective records (e.g., observational instruments). Furthermore, future research can build on this work by incorporating measures of coaches’ reports of the leadership and motivational climate they create and by subsequently comparing variations between athletes’ and coaches’ perceptions of leadership and coach motivational climate.
Regarding this aspect, till now, there have been no standardized performance measurements in sports like football. Most of the studies have used table classification or statistics,10,14 without taking into account the goals and capacities of each team. Despite the approach of this research towards meeting expectations, 7 the elaboration of an objective and generalized assessment of performance that can be applied in similar studies might be a very interesting prospective for the future.
Conclusions and practical implications
In conclusion, our findings present new information about the evolution of psychological variables (leadership, motivational climate, group cohesion, and collective efficacy) using multilevel analysis, which offers great advantages when examining these group processes in the field of psychology, because it tests these variables at within-person, between-person, and between-team levels. In this sense, we conducted three measurements at three different time points in semi-professional football players, and the results indicate that the levels of the variables of the study (except for autocratic leadership and coach-created ego climate) decrease over the season. However, “Fully Meets Expectations” teams improve their scores and show less decrease compared with “Does Not Meet Expectations” teams. Up to now, this methodology has not been widely used, and therefore, outcomes are not currently applied to high performance. Furthermore, due to the inexistence of a standardized performance measurement in sports such as football, in this study, we attempted to approach the subject through meeting expectations.
Therefore, an important practical implication of this study is to recognize that the figures of the coach and sport psychologist are essential in professional sport, not only so teams will establish reachable expectations/goals,28,29 but also to establish strategies to maintain and improve these levels over the season, which can lead to better performance. 38 For instance, holding meetings at the beginning of the season to establish the objectives of the season, and specifying quantifiable short-term goals during the season focused on the tasks to be performed by each player and by the team and not based on the results could help to improve group dynamics. 7 In addition, coaches should take care not to change their behaviors if the results are not satisfactory or the expected performance is not achieved because negative coaching behaviors will also affect group processes and future performance.4,13,21
Supplemental Material
sj-pdf-1-spo-10.1177_17479541211029602 - Supplemental material for Multilevel analysis of evolution of team process and their relation to performance in semi-professional soccer
Supplemental material, sj-pdf-1-spo-10.1177_17479541211029602 for Multilevel analysis of evolution of team process and their relation to performance in semi-professional soccer by Francisco M Leo, Miguel A López-Gajardo, Juan J Pulido and González-Ponce Inmaculada in International Journal of Sports Science & Coaching
Footnotes
Declaration of Conflicting Interests
The author(s) declared no potential conflicts of interest with respect to the research, authorship, and/or publication of this article.
Funding
The author(s) disclosed receipt of the following financial support for the research, authorship, and/or publication of this article: This work was supported by the European Regional Development Fund and, also by FSE, Government of Extremadura (Counsel of Economy and Infrastructure) [grant numbers GR18102, TA18027 and PO17012] and Government of Spain (Ministry of Education, Culture and Sports) [grant numbers FPU17/03489].

Supplemental Material
Supplemental material for this article is available online.
References
Supplementary Material
Please find the following supplemental material available below.
For Open Access articles published under a Creative Commons License, all supplemental material carries the same license as the article it is associated with.
For non-Open Access articles published, all supplemental material carries a non-exclusive license, and permission requests for re-use of supplemental material or any part of supplemental material shall be sent directly to the copyright owner as specified in the copyright notice associated with the article.
