




Abstract
Background
Particularly at the level of professional athletics, injury prevention is of critical importance. We hypothesized that elevated in-game statistics over a period of 3-10 games places increased cumulative stress on players’ joints and thus predisposes players to injury.
Methods
Utilizing a comprehensive database of National Basketball Association (NBA) player statistics, we identified 34 NBA players who suffered significant in-game injuries during the 2016-2019 seasons, leading them to miss at least ten consecutive games. We then assessed several potential markers of increased player workload during the cumulative one, three, five, and ten games directly preceding the injuries and compared them to season averages for each player.
Results
Increased minutes played per game over the cumulative three (4.9% increase, p = 0.04), five (5.8% increase, p = 0.004), and ten (4.0% increase, p = 0.02) games directly preceding injury were closely related to increased injury occurrence. In-game activity level as measured by statistics such as points scored and rebounds per game did not relate to injury occurrence.
Conclusion
In addition to injury mitigation practices currently used by NBA teams, maintaining players’ minutes played per game constant over time may be an additional effective strategy to be used by coaches and general managers in the future.
Introduction
In recent years, the concept of “load management” has ignited debate among players, coaches, and executives in the National Basketball Association (NBA). Load management is the practice of resting healthy players for games during the regular season in the hope of preventing overuse injuries and keeping players fresh for the postseason playoffs. As such, strategies that might mitigate the risk of injury to these elite athletes are of great interest.
There are multiple studies that have retrospectively evaluated risk factors, such as player demographics, for injury in NBA players.1–6 Yet, there is limited data on how the amount and/or type of activity may increase injury occurrence in NBA players. Prior research of European basketball players found that increasing practice and competition time increased both the overall team performance and the number of injuries. 7 In addition, Lewis previously conducted an impactful study on game load, fatigue and injury risk in NBA players. The study found that increased playing time over a two-game period increased the risk of injury while a day of rest greatly reduced this risk. 8 The study also found that every additional three rebounds or shot attempts above one’s average output increased injury risk. Finally, the study showed that players who had been in the NBA for a longer period of time were more likely to sustain injuries, providing additional evidence for the concept of long-term overuse injuries.
There are similarly data from other sports which have investigated load and injury occurrence. A study conducted by Bacon et al. found that the total distance run by professional soccer players in practices and games predicted overuse injuries, such as noncontact muscle strains and ankle injuries, during the season. 9 Seminati similarly found that the total number of hours played are correlated with an increased risk of injuries, such rotator cuff impingement and muscle strains in the low back, among recreational, collegiate, and elite volleyball players. 10 In addition, there is evidence that acute increases in weekly workload are associated with increased injury risk in Gaelic football players. The study found that moderate workloads and small increases in weekly workload may be protective factors for players. 11 Notably, Malone also found that moderate weekly loads were protective compared to low loads and that stronger athletes better tolerated acute increases in workload among hurling players. 12
In addition to intrinsic risk factors for injury, such as training volume, game-related statistics, or physical attributes, there are extrinsic risk factors which may influence injury occurrence. For example, travel and days of rest between competition may play a role with regard to injury occurrence. While numerous studies have linked air travel across time zones to athletic performance13–15 and risk of developing illness, 16 , 17 there is sparse literature on the link between travel and increased occurrence of in-game injury. Fuller et al. found that long-distance travel did not increase the risk of injury in professional rugby players. 18 Alternatively, Teramoto et al. found that injuries in the NBA occurred more frequently during road games. 19 Similarly, there is mixed literature from other sports on the whether there exists an association between “competition congestion,” the number of games played in a set period of time, and injury occurrence.20–23 There is a paucity of data on injury occurrence and competition congestion in the NBA, though there is evidence that performance is negatively affected when teams do not have a day of rest between games. 24
The purpose of our study was to evaluate potential markers of increased injury occurrence. We examined the relationship between cumulative game-related statistics, travel, and rest periods as they relate to injury occurrence. We hypothesized that increased cumulative game-related statistics over the preceding three, five, and ten games, not simply within the game during which an injury occurred, will be related to injury occurrence. In addition, we hypothesized that players may be more likely to be injured during an away game or following fewer days of rest between games due to decreased time to engage in recovery practices.
Methods
Datasets
This was a retrospective review of publicly available database information.25–27 Injuries sustained during three NBA regular seasons and playoffs, 2016-2019, were included in the analysis. We acquired statistical data on all NBA players’ in-game performance during these seasons from Bigdataball.com. 25 A dataset from Spotrac.com was used to determine each NBA game missed due to injury by each player. In addition, the Spotrac.com database included information of the site of injury for each player. 26 The latter data were used to identify the initial sample of players who missed at least one game due to injury over the course of the 2016–2019 seasons. We used ESPN.com to collect information on players’ heights, weights, and dates of birth. 27 Injury and demographic data were obtained and subsequently cross-referenced between the various databases by the authors.
Selection criteria
We initially identified 1015 players who missed at least one game due to injury over the course of the three seasons during the time frame of the study. We excluded players who missed fewer than 10 games due to injury to concentrate on potentially season altering injuries (n = 537). We also excluded players who missed more than 57 games during the season in which they were injured in order to have a large enough single season sample of game statistics to compare to the games directly preceding injury for each player (n = 43). This would mean that players played at least 25 total games during the season as the NBA regular season is 82 games. We additionally excluded players who had multiple injuries listed throughout the season to eliminate the potentially confounding variable of one injury directly or indirectly causing another (n = 313). Players who missed games due to abdominal strains (n = 2) or illnesses (n = 7) were also excluded as these are not generally directly relevant to orthopaedic injuries. We further excluded players whose injuries occurred within the first 10 games of the season as we could not calculate average statistics for a full set of 10 games preceding their injuries (n = 12). In addition, players whose injuries did not occur during an NBA game but rather during developmental league games or practice were also excluded (n = 16). Players whose injuries occurred prior to the start of the season and those whose injuries were deemed chronic in nature, meaning that the missed games cannot be traced to a single inciting injury during a game in the 2016-2019 seasons, were also excluded from our analysis (n = 43). Finally, we excluded players who did not play at least 10 consecutive NBA games due to two-way contracts with developmental teams in the NBA’s “G” League (n = 8). This process resulted in 34 players found to be eligible for analysis. See online Appendix A for a summary of selection criteria.
Study design and statistical analyses
We directly compared full season statistical averages to statistical averages from the games directly preceding injuries. We analysed the following statistics: minutes played per game, usage rate per game (see online Appendix B for formula), “Draft Kings” fantasy basketball points (see online Appendix C for formula) scored per game (as a marker of in-game activity level), field goals made per game, field goal attempts per game, three point shots made per game, three point shot attempts per game, free throws made per game, free throws attempted per game, offensive rebounds per game, defensive rebounds per game, total rebounds per game, assists per game, personal fouls per game, steals per game, turnovers per game, blocks per game, and points per game. Mean values of each of the metrics noted above were calculated for the composite group of 34 players across the entire season during which they were injured. These full season statistics were compared to the mean values of each of the metrics calculated for the composite group of players across the 1, 3, 5, and 10 games preceding injury. We then used paired t-tests to evaluate the differences in mean values of the chosen metrics between the full season statistics and those cumulative statistics from the 1, 3, 5, or 10 games immediately preceding injury. We further calculated the percent differences between statistics in games preceding injury and full season statistical averages using the following formula:

In addition, we evaluated whether the injuries were more likely to occur during games played at home or on the road and whether injuries were more likely to occur when there were fewer average days of rest between games. We used the BigDataBall.com datasets cross-referenced with the ESPN.com and SpotTrac.com datasets to determine where the injuries took place and whether the preceding game was at the same or a different location.25–27 Statistical significance was set at p < 0.05. All data analyses were performed using Stata® MP 16 analytical software (StatCorp, LLC, College Station, Texas).
Results
Player demographics
Thirty-four NBA players met the inclusion criteria for the current study. The average height of the included players was 200.9 cm (SD: 9.4, range: 180.3-215.9 cm). The average weight of the players was 102.2 kg (SD: 11.8, range: 78.9-122.5 kg). The average BMI of the 34 players was 25.3 kg/m2 (SD: 1.5, range: 22.0–28.9 kg/m2). The average age of players in the study was 26.6 years old at the time of injury (SD: 4.89, range: 19-36 years). The 34 players we evaluated suffered a range of musculoskeletal injuries. The most common injury locations were the knee (29.4%), ankle (11.8%), hamstring (11.8%), foot (11.8%), and thumb (11.8%). The distribution of injuries in summarized in Table 1. The average number of games missed was 24.1 (SD: 12.74, range: 11-57). During the games missed, players earned an average of $34,55,763 (SD: $40,53,303 range: $2,13,500-$1,74,89,538). 26
Distribution of injuries.

Statistics in games preceding injury vs. full season statistical averages
In the one game preceding injury, we found that the 34 players earned significantly fewer offensive rebounds as compared to their season averages (p = 0.0006). Table 2 summarizes the statistical comparisons between players’ season averages and statistics in the one game preceding injury.
Statistical comparison between season averages and one game preceding injury averages.

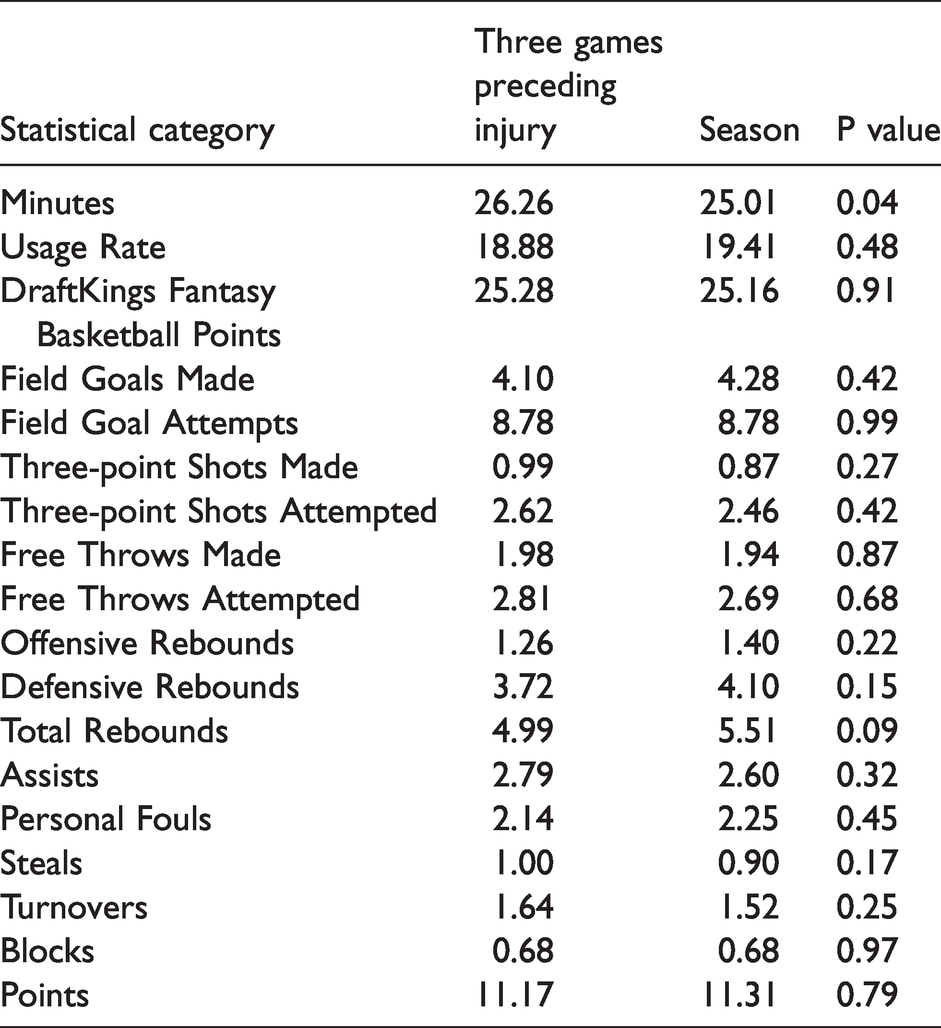
Across the three games preceding injury, we found that the 34 players played statistically significantly more minutes per game (26.26) as compared to their season average of 25.01 minutes per game (p = 0.035). This is an increase of 4.9% minutes played per game. Table 3 summarizes the statistical comparisons between players’ season averages and statistics in the three games preceding injury.
Statistical comparison between season averages and three games preceding injury averages.
Across the five games preceding injury, we found that the 34 players played statistically significantly more minutes per game (26.52) as compared to their full season average of 25.01 minutes per game (p = 0.004). This is an increase of 5.8% minutes played per game. We also found that players created more steals on average (1.08) in the five games preceding injury as compared to their full season steals per game averages (0.90) (p = 0.041). This is an 18.2% increase in steals during these games. Table 4 summarizes the statistical comparisons between players’ season averages and statistics in the five games preceding injury.
Statistical comparison between season averages and five games preceding injury averages.

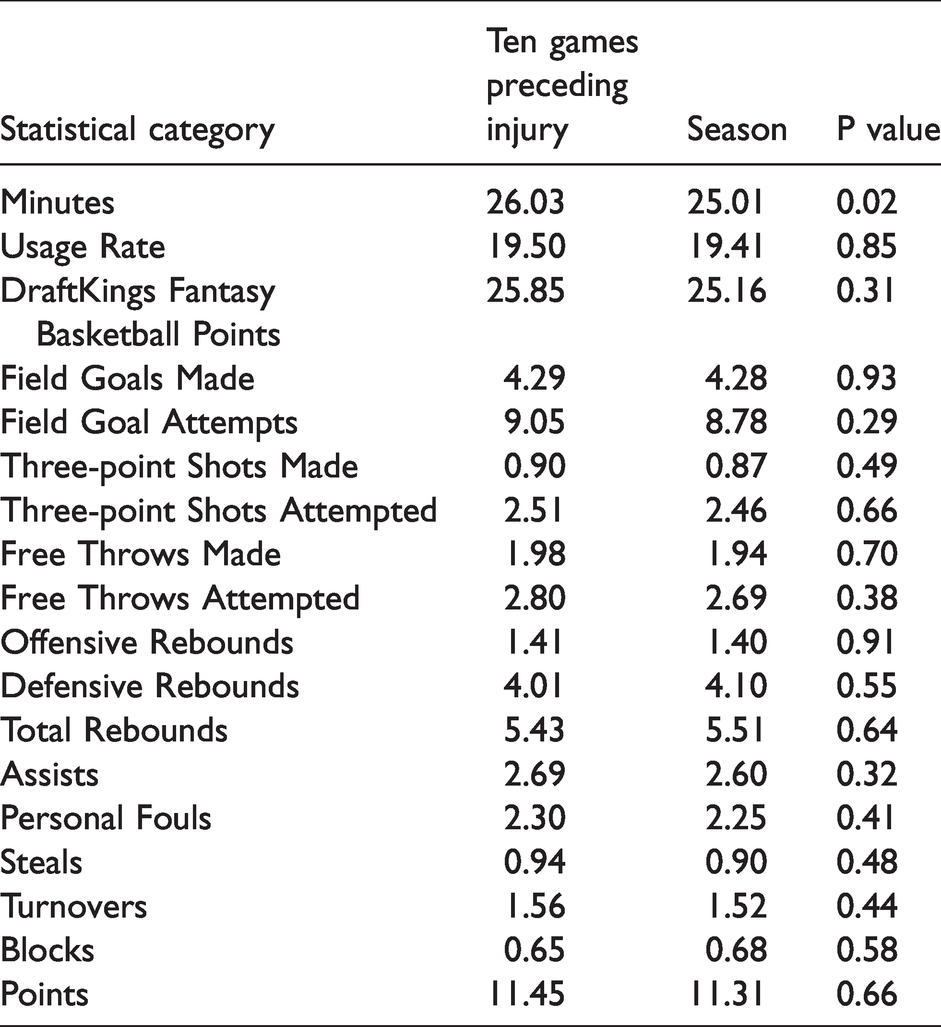
Across the ten games preceding injury, we found that the 34 players played statistically significantly more minutes per game (26.03) as compared to their full season average of 25.01 minutes per game (p = 0.023). This is an increase of 4.0% minutes played per game. Table 5 summarizes the statistical comparisons between players’ season averages and statistics in the ten games preceding injury.
Statistical comparison between season averages and ten games preceding injury averages.
Injured game data
We found that of the 34 games in which players were injured, 17 (50%) occurred during road games. 25 , 26 Furthermore, 10 of the 34 players (29%) were injured in games with no immediately preceding travel (i.e. 10 of the 34 players were injured during games at their home arena following another game played at home with no interval travel). 25
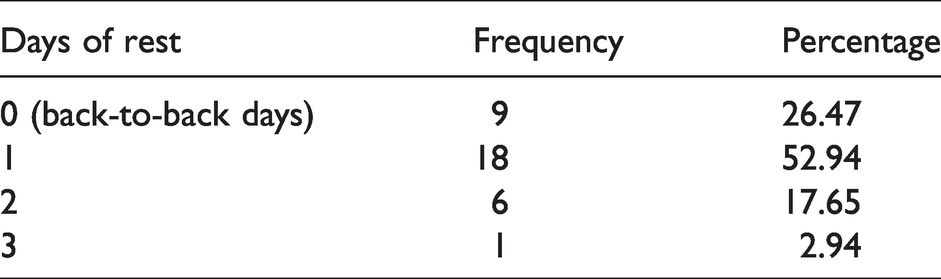
The average days of rest preceding the game in which our cohort of players were injured was 0.97 days (SD = .76). See Table 6 for a summary of these data. When comparing the average value of days of rest preceding injury (0.97) with the average number of days of rest between games over the course of an NBA season (1.15), we did not find a statistically significant difference (p = 0.177).
Days of rest preceding injury.
Discussion
In the current study, we evaluated a number of potential markers of increased injury occurrence among NBA players. We demonstrated that there was a statistically significant relationship between injury occurrence and increased minutes played per game in the period leading up to the game in which the injury took place. It is important to note that even relatively modest increased playing time of approximately 5% over a player’s full season average appears to relate to the occurrence of season-altering injury. Thus, once a player’s baseline average minutes per game is established for a given season, coaching staffs may consider carefully following this metric to guard against substantial changes in this key marker – at least across a three, five, or ten game period. If such increased playing time is necessary, greater attention should be paid to recovery techniques in order to potentially mitigate the risk to the player.28–30
Notably, a player’s minutes played per game was not significantly related to injury occurrence in the one game directly preceding injury. Therefore, the statistically significant finding of increasing risk of injury with increased playing time seen with assessment of the three, five, and ten games before injury suggests that a cumulative effect of increased minutes played may be more closely related to injury occurrence than playing time during any single game. This is in line with prior research that has demonstrated a link between cumulative physical load, such as distance run and hours spent during training and competition, and injury risk in soccer and volleyball players. 9 , 10 It may be the case that players become increasingly susceptible to specific injuries over time due to repetitive movements, but that acute variations in factors such as minutes played per game are not sufficient to increase the probability of injury occurrence.
We also hypothesized that players would be more likely to be injured during away games due to increased time spent traveling and thus less time available for employing recovery techniques. Among the 34 injuries that we analysed, we did not find evidence that the location of the game was related to injury risk as 17 of the 34 (50%) occurred at home and 17 of the 34 (50%) occurred at an opponent’s arena. Furthermore, 10 of the 34 injuries (29%) occurred in games following no travel (that is, these injuries occurred during the second of consecutive home games). These data suggest that injury occurrence is not directly related to the location of the game. Though we are not able to make causal assertions based on the design of the study, it is possible that players are able to engage in sufficient recovery exercises, such as massage, cryotherapy, and active recovery, during the travel process, leading to the similar injury rates at home and away games.28–30 Future research should analyse whether the use of these techniques directly improve recovery among NBA players, especially during periods of travel.28–30 Similarly, future research should evaluate these findings in a larger sample size to better understand the relationship between travel and injury occurrence. In sum, our results support the sparse evidence that suggests that injury occurrence may not be affected by travel. 18
We additionally analysed whether injuries were more likely to occur following fewer days of rest. While we found that, among the 34 players we studied, the average days of rest preceding the injury was 0.97 days as compared to the players’ season average of 1.15 days of rest, this result was not statistically significant. This similarly may be due to athletes being able to adequately engage in recovery protocols between games.28–30 Alternatively, it may be the case that overuse injuries depend more on chronic stress on the body and thus the physical load from the preceding week or month may more greatly predispose players to injury than the physical stress from the previous day. This is in line with findings from Malone et al who found that acute increases in weekly workload are associated with injury risk in Gaelic football players. 11 Due to the small sample size of the present study, future research should more comprehensively assess the relationship between injury risk and competition congestion over the course of a season. In addition, future research may evaluate the role that longer term scheduling patterns, such as the number of games in the week preceding injury, play in predisposing players to injury.
We found that the average number of offensive rebounds was significantly less in the game directly preceding injury and that players earned more steals per game in the five games preceding injury as compared to their season averages. As there was not a relationship between defensive rebounds or total rebounds in the game directly preceding injury and no relationship between offensive, defensive, or total rebounds in the cumulative three, five, and ten games directly preceding injury, this is likely a statistical anomaly. Similarly, we did not find that steals per game were related to injury occurrence in the one, three, or ten games directly preceding injury. While steals per game may be a sign of effort exerted on the court, there is no mechanistic reason that might explain why earning fewer offensive rebounds in a game would make one more likely to be injured in the following game. As such, further research should assess whether either of these statistics are truly a potential marker for injury occurrence or whether these are statistical irregularities.
Limitations
Given the modest sample size of players in our study, further research should examine the extent to which the present data are indicative of trends in the NBA at-large. In addition, due to the relatively small sample size of players, we are not able to assert that player statistics are normally distributed as they might be for a sample of all NBA players. While the distribution of injuries in this study is in line with prior research indicating that knee and ankle injuries are the most common NBA injuries, this diverse range of musculoskeletal pathologies likely arise secondary to different forms of stress on the body. 5 In addition, the datasets used in this analysis included contact injuries which are likely not the result of cumulative body stress. As such, our findings may not necessarily be equally applicable to each type of basketball injury. Similarly, we did not stratify players based on their position on the team or BMI. There is evidence that positional differences contribute to variance in markers of physical load such as running distance per game, the number of acceleration movements, and the number of jumps per game among young basketball players. 31 As such, future work may seek to address the role that positional differences play in influencing injury occurrence. We are also not able to assert a definitive causal relationship between minutes played per game over a certain time span and injury occurrence as we measured differences between two samples of data for a group of players who all suffered an injury.
Additionally, our methodology does not allow us to comment of the efficacy of “load management.” To further evaluate this popular strategy, future research should analyse the change in injury occurrence following variable periods of rest for an otherwise healthy player. Finally, our findings were obtained for a group of elite professional athletes so it is not clear if the risk mitigation strategy suggested by our findings might also apply to athletes of other levels and/or across other sports.
Conclusions
Taken together, these data provide evidence that increasing an athlete’s minutes played per game in the three, five, and ten games directly preceding injury is related to increased injury occurrence. It is important to note that this relationship was not observed in the one game preceding injury. This supports our hypothesis that injuries in the NBA may be more likely to occur as a result of cumulative stress on the body that occurs over a series of games. In order to minimize injury risk for players, NBA coaches and general managers may consider maintaining players’ minutes played per game relatively constant over time.
Supplemental Material
sj-pdf-1-spo-10.1177_17479541211037037 - Supplemental material for Acutely increased workload is correlated with significant injuries among national basketball association players
Supplemental material, sj-pdf-1-spo-10.1177_17479541211037037 for Acutely increased workload is correlated with significant injuries among national basketball association players by Matthew J Orringer and Nirav K Pandya in International Journal of Sports Science & Coaching
Footnotes
Declaration of conflicting interests
The author(s) declared the following potential conflicts of interest with respect to the research, authorship, and/or publication of this article: Dr. Nirav K Pandya is a consultant for Orthopediatrics.
Funding
The author(s) received no financial support for the research, authorship, and/or publication of this article.

Supplemental Material
Supplementary material for this article is available online.
References
Supplementary Material
Please find the following supplemental material available below.
For Open Access articles published under a Creative Commons License, all supplemental material carries the same license as the article it is associated with.
For non-Open Access articles published, all supplemental material carries a non-exclusive license, and permission requests for re-use of supplemental material or any part of supplemental material shall be sent directly to the copyright owner as specified in the copyright notice associated with the article.
