
Abstract
The game of cricket is one of the most popular team games. Its influence continues globally, with efforts by the International Cricket Council (ICC) to expand the game to other regions and make it more inclusive beyond the commonwealth countries. Weather has become an integral part of cricket because the game is played outdoors, and the weather can impact the game in many ways. Though there are numerous cricket-related studies in the literature, there is a shortage of research work focusing on the impact of the weather on the game. This study considers one-day international cricket games played during the last decade and conducts an in-depth analysis to quantify the impact of weather-related factors on batting and bowling. Furthermore, we extend the analysis to explore weather-prone cricket venues, and at the end, we accurately predict the result of a weather-affected game. According to the experimental outcomes, the nature of the weather (clear, overcast, rainy, sunny) and some of the weather–related parameters such as temperature, heat index, humidity, dewpoint, precipitation, win-speed, pressure, and the amount of light significantly impact both batting and bowling at various stages of the game. When predicting the winner of the weather-affected game, the Bagging model can predict the winner with an accuracy of 79%, recall value of 84%, and precision of 76%.
Introduction
Cricket is a bat-and-ball game between two teams involving 11 players per side. The game originated in England in the late sixteenth Century and is populated among other countries. At present, cricket has become a globally popular team sport playing all around the world. The International Cricket Council, the global governing body for cricket, has over 100 member nations categorized into three member groups: full members, associate members, and affiliate members. There are three main game formats: test cricket, one-day international (ODI), and the Twenty20 (T20). While full nations play all formats of cricket, the associated and affiliated members are not eligible to play the test cricket format. Both full and associate members can play the ODI format.
Cricket becomes a complex game involving numerous variables that can influence the outcome of a match. Some of these variables include game variables, player variables, tactical variables, match context, and other external variables. Game variables comprise factors such as the condition of the pitch, the weather, and the status of the toss. Player variables cover aspects like the player's form and fitness, skill levels, mental and physical toughness, and team composition. Tactical variables include batting order, bowling order, and fielding positions. Match context covers areas like the game format, match situation, and the opposition team's analysis. Umpire decisions, crowd support, and home advantage can be considered as external variables.
Existing cricket-related research publications encompass a wide range of academic and analytical investigations found in the literature. These publications examine various aspects of cricket, including player performance analysis,1,2 player selection, 3 team selection,4,5 game prediction, 6 umpire's decision making, 7 home advantage,8,9 player fitness,10,11 and the batting. 12
Weather plays an integral role in cricket, affecting various aspects of the game. 13 Hence, unlike other games, a good cricket game depends on good weather availability. Some areas affected by the weather include the condition of the pitch, the performance of the players, and the match outcomes. Dry and sunny weather can make the cricket pitch surface harder and faster, favoring batters. When this weather continues, over time, it can make the pitch dry and experience cracks on the surface, making the pitch favorable for spin bowlers. 14 When the pitch becomes more arduous, it can change the conditions of the surface of the cricket ball, which can impact the performances of the reverse swinging bowlers.13,15 In addition, very sunny and hot weather conditions can cause players to experience fatigue and dehydration, impacting their performance in the game. 16 When the weather is overcast and humid, it can create a favorable condition for fast bowlers due to their ability to swing the ball. 15 Experiencing rainy conditions has a direct impact on the playable conditions of the game. In addition to rain interruptions, the game is delayed due to wet outfields and damp pitch. This is where the Duckworth-Lewis-Stern (DLS) method is utilized to adjust targets in rain-affected matches. Even the cold weather may significantly impact the player's performance in addition to the conditions of the ball's surface.
Out of the three-game variables stated previously, numerous studies exist in connection with the outcome of the toss17,18 and the condition of the pitch19,20 on the outcome of the game. Though there are a handful of research works related to weather conditions and the game of cricket, unfortunately, none of them conduct an in-depth analysis of the impact of the weather on the game. Hence, this study aims to investigate how weather-related factors impact the game in terms of scoring and bowling abilities. In addition, we strive to check whether we can use Machine Learning models to predict the winner of weather-affected games. According to the authors’ belief, the findings of this research will fill the vacuum in cricket literature related to the influence of weather on the game and the players. Finally, these findings will be beneficial to coaches to make informed decisions in cricket that will optimize the team performance, manage player well-being, and ultimately enhance the likelihood of winning games.
Related work
In one of the first rudimentary studies on the weather in cricket who classified games as rain-affected games based on the match reports. 21 Weather interruptions can impact countries in different ways depending on the region. Hynds and Smith 13 stated that weather has become integral to English cricket as weather interrupts county games and test matches in the summer. According to Hignell, 22 the weather has become integral to English county cricket. However, people must pay attention to the fundamental inter-relationship between county cricket and the weather. In this study, the author thoroughly investigated the impact of the weather on English country cricket, considering various aspects, including crowd participation and economic impact.
The study conducted by Forrest and Dorsey 18 aimed to investigate how winning the toss and the weather impacts the county cricket championship. They were interested in estimating the loss of playing time due to the weather interruptions for each match played in the season. In addition, based on the data collected from 1993 to 2006, the authors pointed out that the possibility of winning a game for either side declines rapidly as the duration of weather interruption increases. In another study conducted by Nallakaruppan et al., 23 the aim was to predict the weather interruption for a cricket game using several machine learning algorithms, namely, Random Forest, Naïve Bayes, SVM, and Decision Tree.
James et al. 24 studied the effect of atmospheric conditions on the swing of the cricket ball. This investigation claimed that the impact of the humidity remains perplexing with the swinging of the ball, as the study showed there is no direct or indirect significant evidence to support the impact of cricket ball swing and humidity.
Unlike other weather conditions, the impact of rain significantly influences the game. Due to the financial impact, games that are interrupted by the rain are required to adjust the game situation and complete it on the same day to see a result. The current model used in games interrupted by the rain is the Duckworth-Lewis-Stern (DLS). It is reported that targets set by the DLS method are sometimes unrealistic. 25 As an alternative, a model based on statistical estimation is proposed by Chougale 25 to assess the situation of rain-affected cricket games.
By considering existing prior studies related to the impact of the weather on the game of cricket, there is no study focusing on various aspects, including whether the condition of weather impacts players or do certain teams have the advantage over the other teams under different weather conditions. In addition, most of the prior studies have focused on the impact of weather on test cricket, in which the condition of the ball and the pitch can have a significant influence. Hardly any studies are available on the impact of the weather on the ODI format.
Methodology
Data collection
In this study, we collected all the ODI games played from January 1, 2014, to December 31, 2023. The data collection process involved obtaining comprehensive cricket match details, hourly and aggregated weather data, and supplemental cricket information from various reputable sources.
Sources
We integrated cricket data with weather data from multiple sources to analyze the impact of weather conditions on cricket match outcomes.
Cricket Match Data Cricket data were extracted using the “cricketr” package in the R statistical software. This package connects to the popular cricket data archive cricsheet.org and provides analytics-ready flat files. We extracted data for men's 50-over international cricket matches played over the last ten-year period from January 1, 2014, to December 31, 2023. The primary collected data includes ball-by-ball data (runs scored, wickets fallen, extras, batter, non-striker, bowler). Additionally, we extracted match attributes (match date, teams involved, toss winner, innings, total runs scored, total wickets, winner, winning margins, winning method, use of Duckworth-Lewis-Stern (DLS) ‘s adjustment, playing country/venue) and player attributes such as batting style, bowling style, batting statistics, and bowling statistics. Weather Data
WeatherStack.com: Using the website's Application Programming Interface (API), we used custom-written R code to capture hourly weather data for the match venue/city on the given match day. Extracted variables include major weather factors such as hourly temperature, heat index, humidity, dew point, wind speed and direction, cloud cover, precipitation, and general weather descriptions. NASA POWER Project and WeatherSpark.com: This project provides aggregated data representing yearly and monthly weather for a given location globally dating back to the early 80 s. By inputting the latitude and longitude for a given match venue/city, we gathered aggregated monthly weather data for 30-year historical period containing our study period. Additionally, we used data from WeatherSpark.com, extracted given the city of the match venue, to complement the weather variables obtained from NASA POWER. Combining these two sources, we captured weather indicators for temperature (daily average, high, low within the month), maximum and minimum temperatures recorded for months, average humidity, average dew point, wind speed (daily average, high, low within the month over the historical period), maximum and minimum wind speeds recorded for months, wind directions, cloud cover, average precipitation, average hours of daylight, and other weather descriptions for each of the 12 months. Other Supplemental Cricket Data
The match starting time is essential for integrating game-time weather data with ball-by-ball data to identify weather conditions when a selected over is bowled. Unfortunately, cricket R packages do not provide the match starting time. Hence, we used the following websites for that.
Cricbuzz.com: This website's API provides comprehensive cricket match data. We developed a series of R programs, parsed the nested structure of cricbuzz.com data layers to access individual match levels, and extracted starting time data alongside many other match attributes obtained from the “cricketer” R package. ESPNCricinfo's StatsGuru Data: The “cricketr” package does not indicate whether the match was a day game or a day/night game. A given game's day/night status is an integral variable in this data analysis. We gathered this information using a custom query within the StatsGuru tool.
Handling missing data
Working between “cricketr” and “cricbuzz” data, we found that some matches in “cricketr” (specifically in cricsheet.org) do not exist in “cricbuzz” and vice versa. We selected “cricketr” as our primary data source and identified 1239 ODI games for our 10-year study period—additionally, some matches in “cricketr” lack venue/city information. If found in “cricbuzz” data, we accordingly replaced the missing venue (ground/city) information.
For matches not found in “cricbuzz,” we estimated proxy starting times. We created reference datasets for starting times (most of the matches) for day or day/night games at a given ground, city, or country. We also identified separate reference starting times for the first and second halves of the year to account for playing seasons in different parts of the world. Missing starting times were replaced with proxy times based on the available ground, city, or country information.
Data integration and aggregation
There was no common identifier for matches (such as match ID or ICC match number) between the two source systems, “cricketer” and “cricbuzz.” We linked matches from both systems based on matches played between the same two international teams on the same day, assuming only one international 50-over (men's) game is played between the same countries on a given day.
To integrate hourly weather data with ball-by-ball data, we first estimated the time a particular ball/over was bowled. We used an average time of 4 min and 20 s to complete an over, common second-inning starting times for each venue/country (adjusting for a 30–45 min inning break) and approximated the time each over was completed during the match. Game-time weather data (WeatherStack) were linked to the ball-by-ball data based on this over-completion timestamp. Additionally, aggregated monthly data for the venue/city (NASA POWER and WeatherSpark) were linked to ball-by-ball data based on the match day (month).
A dataset representing the end of each 5-over period (runs scored in five overs, wickets fallen in five overs, cumulative runs at the end of each 5-over period, average weather variables for each 5-over period) along with match attributes was created for the final analysis.
Research questions
This study tried to answer the following questions related to the weather impact on the game of ODI cricket.
Does the weather impact differently on cricket venues when conducting an ODI game? How does the weather impact on scoring runs in an ODI game and what weather indicators are significant? How does the weather impact on taking wickets in an ODI game and what weather indicators are significant? Can we accurately predict the outcome of a given game interrupted by bad weather?
Results
Does the weather impact differently on cricket venues when conducting an ODI game?
According to the chi-square test for homogeneity of proportions, significant evidence supports the premise that the proportion of non-resulted games is significantly different in games that took place, χ2(15, 1185) = 25.72, p < 0.05. The pairwise comparison indicates that there is a significant difference in the proportion of games that lasted fully between Australia and England (p = 0.04), England and India (p = 0.01), India and Ireland (p = 0.04), Austria and Oman (p = 0.04), India and Oman (p = 0.04), England and United Arab Emirates (p = 0.02), and Oman and United Arab Emirates (p = 0.03). This indicates that games that took place in England, Ireland, and Oman have experienced non resulted games significantly more often than the rest of the countries.
Considering the proportion of DLS games played out of all games held, there is a significance evidence to support that the proportion of DLS games each country held is significantly different, χ2(15, 1185) = 46.5, p < 0.005. The pairwise comparison indicates that the proportion of DLS games held in New Zealand is significantly more than in India (p = 0.04) and in the United Arab Emirates (p = 0.009). Similarly, this proportion is significantly higher in Sri Lanka than in Australia (p = 0.007), India (p = 0.00002), New Zealand (p = 0.04), South Africa (p = 0.03), Namibia (p = 0.02). In addition, the above proportion is significantly lower in India than in the West Indies (p = 0.01), Scotland (p = 0.003), and Zimbabwe (p = 0.007). UAE also has significantly experienced fewer DLS games than Bangladesh (p = 0.02), England (p = 0.02), South Africa (p = 0.003), Scotland (p = 0.0004), and Zimbabwe (p = 0.002).
Figure 1 illustrates the four weather patterns experienced by each of the considered cricket venues when conducting an ODI game. According to Figure 1, venues in England show a higher number of combined rainy and overcast games than the rest. Further analysis was conducted to understand the venues in England and their weather patterns when conducting ODI games.

Weather experienced in venues in England.
According to Figure 1, London and Birmingham have experienced more overcast conditions. Manchester and London have experienced rainy conditions, though the former has a higher proportion of rainy days than London.
How does the weather impact on scoring runs?
Impact of weather on each team
In order to test the impact of weather on scoring runs in ODI games, each team's scores for five-over intervals were recorded and compared. Figure 2 illustrates how each team scored during each five-over interval under all the weather conditions when batting first. A two-way ANOVA test was conducted to test the impact of weather on scoring for each team. Based on the analysis, significant evidence supports that teams have scored significantly differently with each five over intervals, F (9, 360) = 3.05, p < 0.005. Though preliminary results indicate the scoring changes under various weather conditions, ANOVA results do not demonstrate statistical significance.
Impact of the weather on scoring and the venue
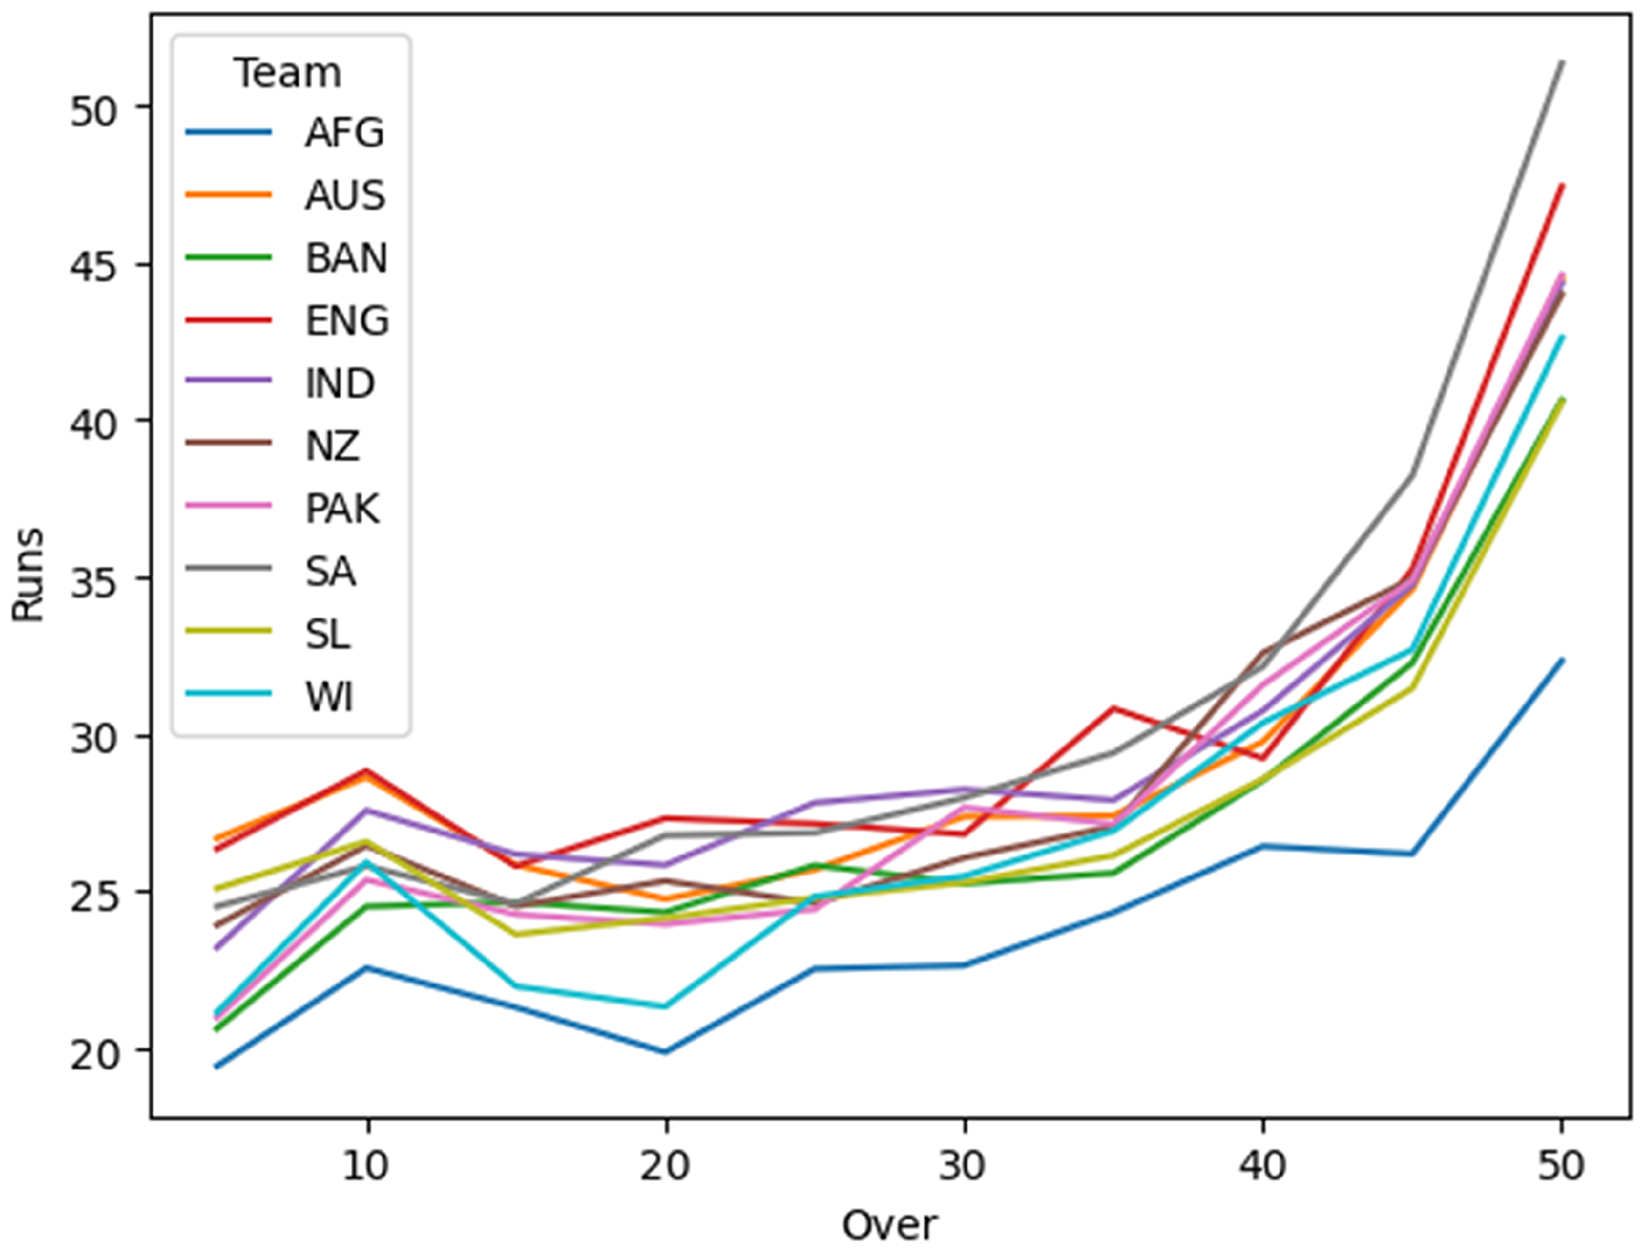
Scoring runs in each of the five-over intervals.
The impact of the weather and the location on scoring runs were tested using two-way ANOVA. In this analysis, we recorded the venues belonging to sub-continental and the rest. According to the analysis, the number of runs scored during the 11th to 15th over the weather significantly impacted the scoring runs [F (3,1290) = 3.57, p < 0.05]. Similarly, there are significant effects on the weather on scoring runs at overs 41–45 [F(3,1290) = 4.34, p < 0.005], and 46–50 [F(3,1290) = 8.22, p < 0.0001]., In addition, whether the game is played in the sub-continent or not significantly impacts scoring runs at overs from 21–25 [F(1, 1290) = 4.14, p < 0.05], 36–40 [F(1,1290) = 6.84, p < 0.01] respectively. The interaction of the weather and whether the game is played in the sub-continent or not significantly impact scoring runs during the overs 21–25 [F (3, 1290) = 2.54, p < 0.05] and 41–45 [F (3,1290) = 9.25, p < 0.05]
Based on the post hoc comparisons using the Tukey HSD test, the mean number of runs scored during the 41st to 45th over clear (M = 31.81, SD = 0.55) and sunny (M = 35.49, SD = 13.00) weather conditions are significantly different. Similarly, during the 46th to 50th over, the average number of runs scored in overcast (M = 31.81, SD = 0.55) conditions is significantly lower than in clear (M = 35.62, SD = 10.48). Similarly, during the same over, the average number of runs scored in the clear (M = 35.62, SD = 10.48) and sunny (M = 43.48, SD = 14.20) conditions are significantly different.
How does the weather impact on taking wickets?
Impact of the weather on each team
Figure 3 illustrates how each team took wickets during each five-over interval under all the weather conditions when they bowl first. A two-way ANOVA procedure was applied to test the impact of weather on the team's taking wickets. The number of wickets each team was taking in each of the five over windows was recorded and used for this analysis. According to the ANOVA findings, the team and the weather significantly impact taking wickets. These significant results found the team's impact on wickets at overs 11–15, F (9,1258) = 2.46, p < 0.05. During the overs 26–30, there is a significant impact from both the team, F (9,1258) = 2.56, p < 0.05, and the weather F (3, 1258) = 2.78, p < 0.05 on the wickets taken by the bowling team. For the overs 31–35. F (9, 1258) = 2.65, p < 0.05 and 36–40, F (9,1258) = 2.05, p < 0.05 there is significant impact on the team as to wickets taken. Finally, for the overs 41–45 there is significant impact on the team as to wickets taken (F (3, 1258) = 2.59, p < 0.05).

Wickets taking in each of the five-over intervals.
Based on the post hoc comparisons using the Tukey HSD test, the mean number of wickets taken during the 11th to 15th over for Australia (M = 0.5, SD = 0.67) is significantly lower than that of South Africa (M = 0.8, SD = 0.82). Similarly, during the overs 31st and 35th, the mean number of wickets taken by Bangladesh (M = 0.52, SD = 0.77) is lower than that of South Africa (M = 0.92, SD = 1.02).
Impact of the weather and the venue Which weather indicators impact the team total? Which weather indicators impact the total wickets taken by each team in an ODI game?
Based on two-way ANOVA analysis, the average number of wickets taken during the 36th–40th over is significantly impacted by whether the game is played in the sub-continent, F(1, 914) = 5.49, p < 0.05. Furthermore, the weather has a significant impact on the average number of wickets taken during the 41st–45th over, F(3, 914) = 2.55, p = 0.05. The post hoc comparisons conducted using the Tukey HSD test indicate that the mean number of wickets taken in overcast (M = 1.38, SD = 0.67) conditions is significantly higher than the sunny (M = 1.04, SD = 0.80) conditions.
We conducted multiple regression models to identify the weather-related factors that impact team totals, and then evaluated the performance of each model. Table 1 illustrates this.
Coefficients and the significant factors on the team total for each country.
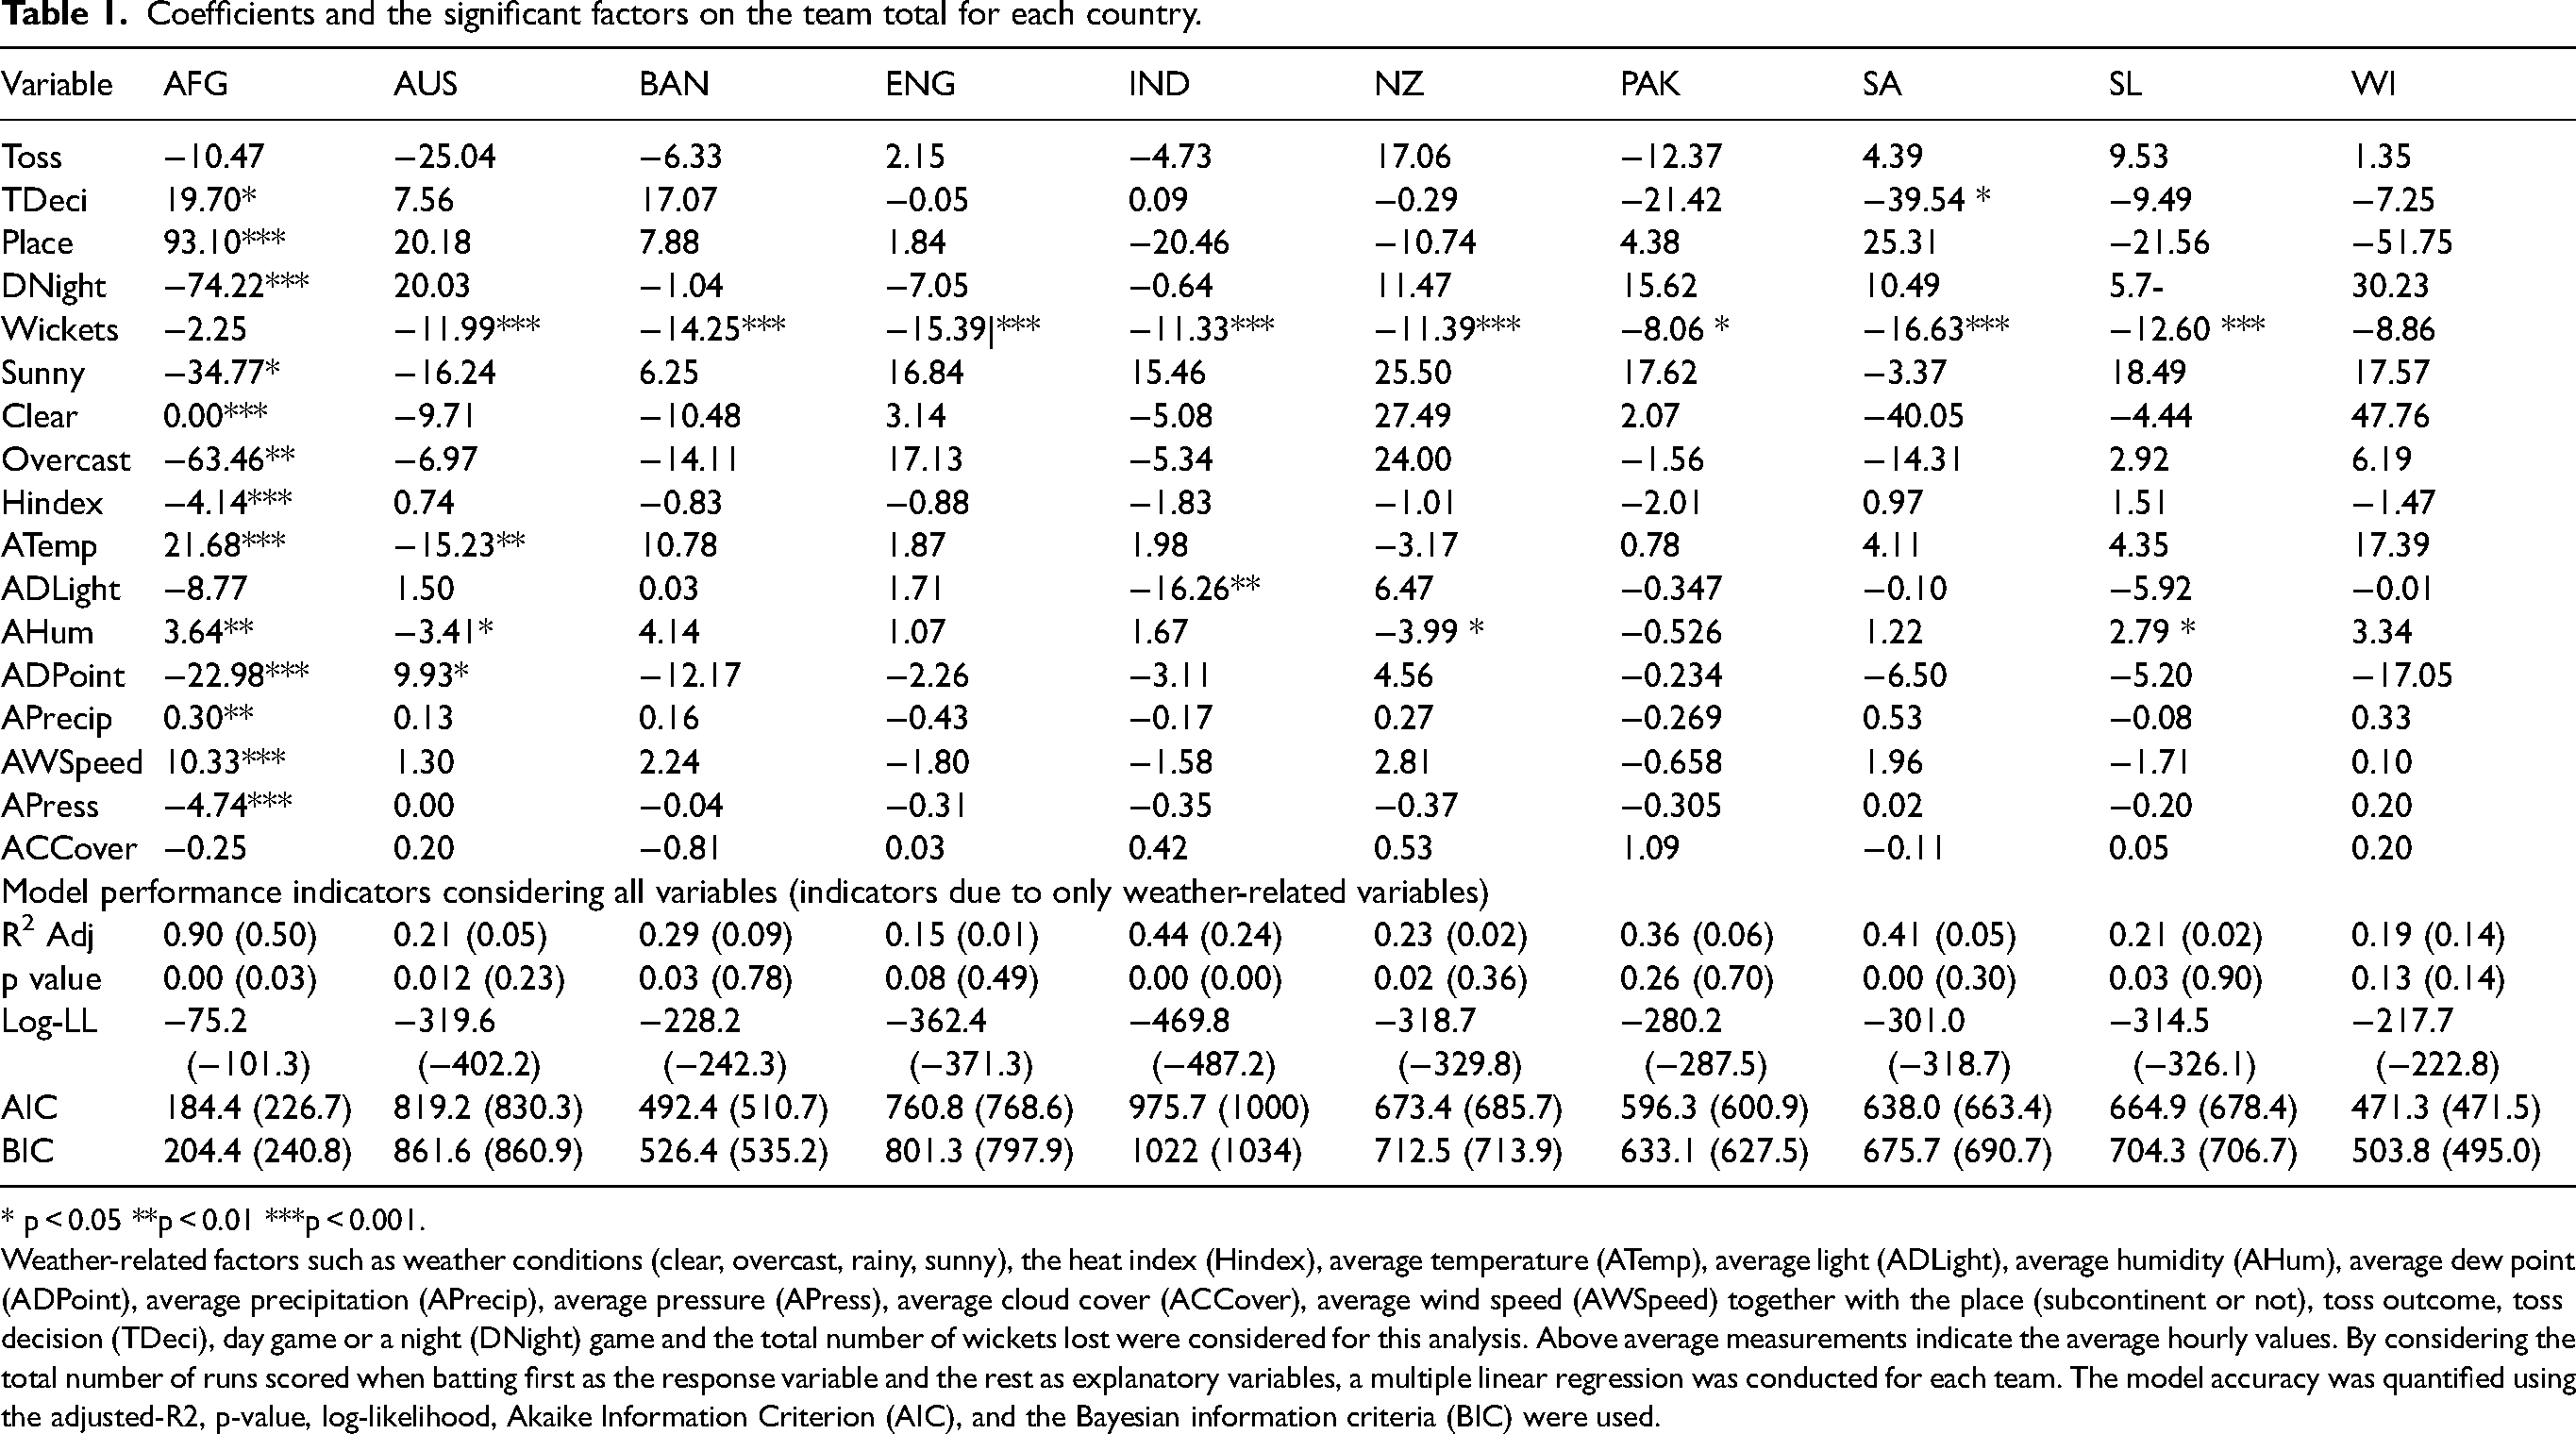
* p < 0.05 **p < 0.01 ***p < 0.001.
Weather-related factors such as weather conditions (clear, overcast, rainy, sunny), the heat index (Hindex), average temperature (ATemp), average light (ADLight), average humidity (AHum), average dew point (ADPoint), average precipitation (APrecip), average pressure (APress), average cloud cover (ACCover), average wind speed (AWSpeed) together with the place (subcontinent or not), toss outcome, toss decision (TDeci), day game or a night (DNight) game and the total number of wickets lost were considered for this analysis. Above average measurements indicate the average hourly values. By considering the total number of runs scored when batting first as the response variable and the rest as explanatory variables, a multiple linear regression was conducted for each team. The model accuracy was quantified using the adjusted-R2, p-value, log-likelihood, Akaike Information Criterion (AIC), and the Bayesian information criteria (BIC) were used.
Also, in this section we conducted multiple regression models to quantify the impact of weather-related factors on wicket taking. Table 2 illustrates the findings.
Coefficients and the significant factors on the total wickets for each country.

Prediction of the outcome of an ODI game affected by the weather
Predicting the outcome of an ODI game holds significant importance in many ways, including sports analytics, betting, planning team strategies, fan engagement, and media coverage. Nevertheless, predicting the outcome of a game is challenging due to the numerous factors involved in the game. 26 When the game is affected by harsh weather, prediction tasks become even more challenging yet imperative. In this task, we consider all the weather-affected ODI games out of the collected games. All these games have been completed according to the Duckworth-Lewis-Stern (DLS) method.
We used five machine learning models to predict the winning of a weather-affected game. They are the Bagging model (Model #1), the Random Forest model (Model #2), the Logistic model (Model #3), the Hyper-parametrized Bagging model (Model #4), and the Hyper-parametrized Random Forest model (Model #5). These models were trained and tested using 70%:30% of the randomly sampled dataset from the weather-affected ODI games. Model accuracy was tested using accuracy, precision, and recall for both training and testing data. In addition to these measurements, the Receiver Operating Characteristic curve (ROC) for each model was constructed (see Figure 4).
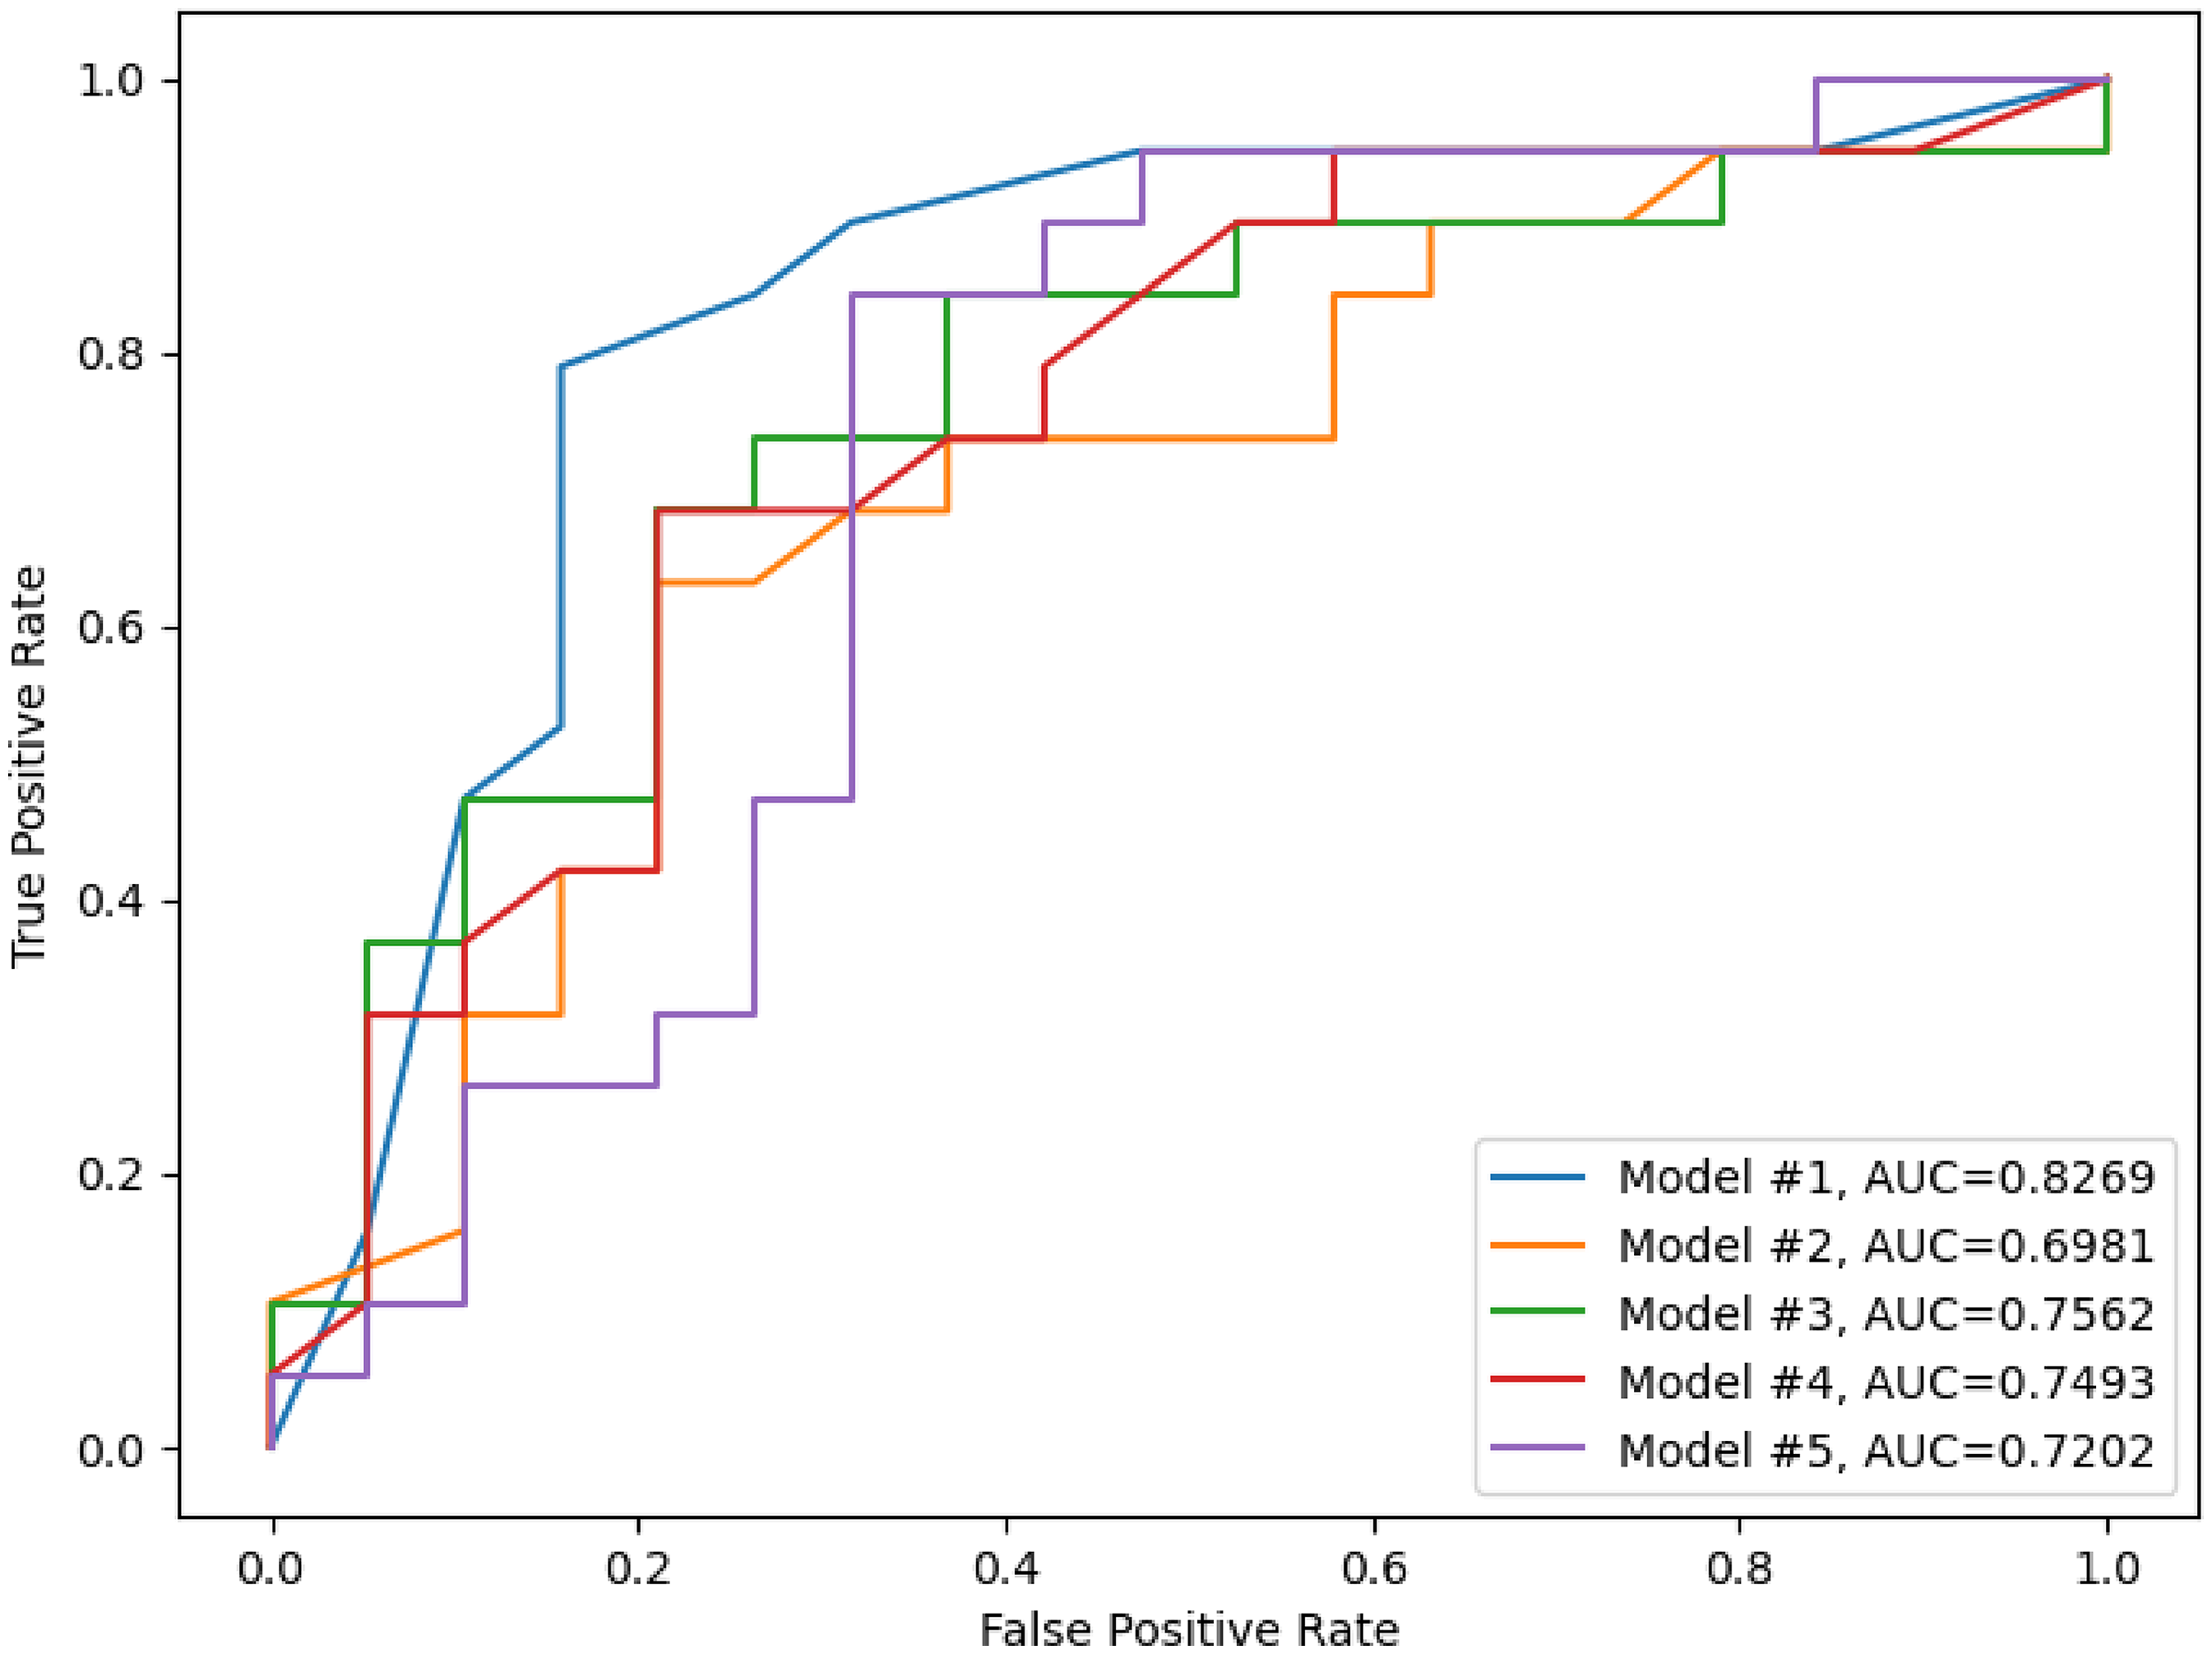
Area under the curve (AUC) values for each model.
Discussion
Based on the findings, Nepal records the highest rate of resulting games, and Namibia shows the highest number of games resulting without weather interruption. However, both nations have hosted less than 30 ODI games in each country. Considering the countries that have hosted more than 100 games, India records the highest number of resulting games. Furthermore, India has hosted the highest number of games without using the DLS method.
Furthermore, the analysis shows that England has hosted the lowest (90.4%) rate of resulting games. This could be due to England's climate, which brings a combination of mild winters, warm summers, and high total rainfall. In addition, Sri Lanka records the highest rate of games played under the DLS law. This is understandable as Sri Lanka is one of the countries with the highest average annual rainfall among the selected countries. Though Bangladesh also experiences similar rainfall compared to Sri Lanka, they have less percentage of DLS games compared to Sri Lanka. Though Sri Lanka has experienced a higher rate of DLS games, they have maintained over 95% of game completion, meaning less than 5% of abandoned games due to bad weather.
England has shown a higher percentage of overcast and rainy conditions in games than in other countries. London has hosted the most number of ODI games. However, London and Nottingham show a higher rate of rainy games than the rest of the cities in England. Further analysis indicates that in London, there was only one un-resulted game out of 32, while in Nottingham, there was one un-resulted game out of 13. Meanwhile, all the games (16) played in Manchester have seen results without any abandoned games. Out of all the countries, the United Arab Emirates, Zimbabwe, and India have shown a higher percentage of sunny conditions in ODI games compared to the rest of the countries.
Based on the findings, clear, overcast, rainy, and sunny weather conditions impact teams differently when they play in and away from the sub-continent. Though the weather's impact does not uniformly apply for all the overs, findings confirm that scoring runs are impacted by the weather at specific overs differently on different teams. Like the impact of weather and scoring runs, the weather significantly impacts the number of wickets a team takes.
When studying the influence of non-weather related and weather-related factors on the team's total score when batting first, for Afghanistan, it is influenced by the non-weather-related factors such as toss decision (p < 0.05), country in the games played (p < 0.001), and day night nature of the game (p < 0.001). In addition, there are weather related factors such as the sunny (p < 0.001), clear (p < 0.001), overcast nature (p < 0.01), heat index (p < 0.001), average temperature of the day (p < 0.001), average humidity of the day (p < 0.01), average dewpoint of the day (p < 0.001), average precipitation of the day (p < 0.01), average wind-speed of the day (p < 0.001), and average pressure (p < 0.001). For the Australian team, non-weather-related factors of the number of wickets they lost (p < 0.001) and weather-related factors such as the average temperature (p < 0.01), average humidity (p < 0.05), and average dewpoint (p < 0.05) significantly impact their team's score when they bat first. In teams such as Bangladesh (p < 0.001), England (p < 0.001), Pakistan (p < 0.05), and South Africa (p < 0.001), only the number of wickets they lose significantly impacts their inning score. The number of wickets influences the Indian team's total score when batting first they lose (p < 0.001) and the average amount of light (p < 0.01) of the day. For the New Zealand team, both the number of wickets (p < 0.001) and the average humidity (p < 0.05) significantly impact the score when batting first. For the Sri Lankan team, both the number of wickets (p < 0.001) and the average humidity (p < 0.05) significantly influence their team's score when they bat first. In contrast to all the teams, the West Indies team's score when batting first does not significantly impact on any of the selected factors. Based on Tables 1 and 2, performance indicators of the regression models change significantly when considering only weather-related factors for both scoring runs and wicket taking.
When considering the number of wickets, the bowling team takes; for the Afghanistan team, none of the selected factors significantly impact the number of wickets. For the Australian team, the above is significantly influenced by winning the toss (p < 0.05), the number of runs they provide to the opposite team (p < 0.001), and the average temperature (p < 0.05) of the day. For teams such as Bangladesh (p < 0.05), England (p < 0.001), India (p < 0.001), and West Indies (p < 0.05), only the number of runs the opposition teams take against them significantly impacts the number of wickets they take. For the New Zealand team, the number of wickets they take when bowling first is influenced by the day-night nature of the game (p < 0.05) and the number of runs they offer (p < 0.01). Meanwhile, for the South African team, only the number of runs they offer (p < 0.01) and the sunny nature (p < 0.05) significantly influence the number of wickets they take when bowling first. For the Sri Lankan team, both the number of runs (p < 0.001) they offer for the opposition and the heat index (p < 0.05) significantly influence the number of wickets they take when they bowl first.
When predicting the winner of a weather-affected game using several ML models, based on the performances of each model, model #1 has 99% accuracy with the training data but shows 79% with the testing sample. The recall value for training data is 98% and 84% with the testing sample. Similarly, the precision value for training data is 100%, but it drops to 76% with the testing sample. A drop in performance from the training to testing samples is expected. The best model should display the highest performance values with the testing samples rather than the training samples. When the rest of the models are considered, model #1 performs better with testing samples. In addition to the accuracy, recall, and precision values, AUC is another indicator that can be used to select the best model out of all the models considered. The best model should have the highest AUC value. Theoretically, an AUC value of 1 or 100% is the highest value a model can achieve. Based on Figure 4, it is evident that Model #1 indicates the highest AUC of 83%.
Conclusion
Though the impact of the weather on cricket is a significant factor, prior research has yet to conduct an in-depth analysis of it. This study focused on how the weather influences various cricket venues and the impact of batting and bowling. Finally, we attempted to predict the winner of a weather-affected game using ML techniques.
Based on the data analysis, weather significantly impacts cricket venues in various countries to conduct an ODI game without a weather interruption. England and Sri Lanka are weather-prone countries that can conduct an ODI game without interruption. Cricket boards of the respective countries must consider the most suitable venues for the ODI game and the appropriate season to host cricket games. Due to the complexity of scheduling the preset international games due to the amount of cricket played worldwide, including franchise cricket, this could be a daunting task. On the other hand, India and the United Arab Emirates are two destinations that indicate the minimal impact of weather interruption when completing an ODI game.
According to the analysis, we find significant evidence of the impact of weather-related factors on batting and bowling. The clear, sunny, overcast, rainy nature, average temperature, heat index, average humidity, average dewpoint, average precipitation, average wind speed, average pressure, and amount of light are some significant weather-related factors. Though we expected that teams with world-class fast bowlers would show a significant impact of taking wickets under overcast conditions, findings do not provide any evidence to support it. There could be several reasons for this. In test cricket, it is known that fast bowlers take advantage of the new ball under cloudy and humid conditions by swinging it due to the wide range of weather conditions experienced over five days. 15 The red ball is used in test cricket, while in ODI, a white ball is used. Furthermore, the rules related to bowling in ODI and tests are vastly different.
Also, we do not see subcontinent teams significantly impacted by the sunny conditions on their batting compared to the other teams. Similarly, we do not see players from the non-sub-continent taking significant advantage of their familiar weather conditions. This could be due to the many players from most international teams playing franchise cricket worldwide in various weather conditions.
Footnotes
Acknowledgements
NASA POWER data were obtained from the NASA Langley Research Center (LaRC) POWER Project funded through the NASA Earth Science/Applied Science Program.
Declaration of conflicting interests
The authors declared no potential conflicts of interest with respect to the research, authorship, and/or publication of this article.
Funding
The authors received no financial support for the research, authorship, and/or publication of this article.