
Abstract
The current study explored the perceptions of collegiate student athletes in relation to describing readiness constructs (Energy, Tiredness/Fatigue, Muscle Soreness, Physical Readiness, Stress and overall Well-Being). Using a custom electronic survey, participants were asked to determine the positioning of various descriptors (i.e., adjectives describing the construct readiness quality, e.g., very very sore for muscle soreness), on a 100-pt visual analog scale (VAS), to determine where they perceive these descriptors to be placed on a blank scale. The distribution of responses was determined from inspection of the data, with a Bayesian Logistic Regression used to assess the posterior probability that a descriptor was anchored above or below 50 (which was used as the neutral value as the scale minimum and maximum were blinded to the participants). Hierarchical clustering was then applied to determine which descriptors displayed similar response locations. The neutral descriptor was distributed around ∼50 for all readiness constructs suggesting the participants were able to identify the middle of the scale for each construct. The results of the clustering approach demonstrated approximately 5–7 descriptors may be appropriate for tiredness/fatigue, stress, muscle soreness and physical readiness scales. However, energy and well-being displayed more variability amongst responses suggesting these constructs may be more complex and may require a larger number of descriptors. This information provides evidence towards the appropriate design of a custom VAS scale to measure different readiness constructs, with the potential number of appropriate descriptive anchor points being ∼5–7 when using a 100-pt VAS.
Introduction
Current scientific practices within competitive sport often necessitate the collection of various data through embedded athlete monitoring processes. Typically the aim of this type of monitoring process is to provide practical insights into achieving optimal sport performance and success.
1
A popular means of data collection is that of athlete self-reported measures (ASRM), typically conducted using methods such as questionnaires
From a load monitoring perspective various scales to assess ASRM exist, such as the Borg RPE scale (6–20 scale),
3
category ratio scales CR10 (1–10 scale)
5
and CR100 (1–100 scale)
Coaches and sport science practitioners may consequently adopt a more practical approach to ASRM to streamline data collection processes providing a more “custom approach” to these measures. For example, McLean & colleagues 16 utilized a 1–5 Likert scale to detect perceptual fatigue, demonstrating significant reductions in athlete ratings of fatigue, muscle soreness and overall well-being post rugby competition. Similarly, a 7-point Likert scale ranging from very very low (good) to very very high (bad) has previously been linked to overtraining (i.e., when an athlete's performance declines because of overload and increased stress without sufficient recovery).17,18 While such scales may show promise, if they are not appropriately constructed issues can typically arise. Additionally, problems may arise within Likert scales like data spread (e.g., floor and ceiling effects), reliability and the ability to detect statistically meaningful changes needing rescaling approaches.19,20 More worrisome, it has become common applied practice to simply create custom scales from original concepts without any validation process, which may also offer its own set of problems if not correctly validated. 19
Although these above situations show organizational implementation problems, whereby practical custom solutions could be implemented, there are still some other aspects of ASRM development that seemingly have not been addressed. For example, Grant & colleagues 21 showed that the use of visual analog scales (VAS), which employ a horizontal line with two endpoints, was a reliable means of detecting the training load response during V02 max testing, similar to that of the Borg RPE scale. VAS scales are also readily adopted when attempting to measure pain21,22 and readiness to return to sport 23 which are important constructs similar to athlete training and wellbeing responses. There are some additional examples of the use of VAS scales for ASRM to measure athlete readiness following training, which offer some support for the use of these types of scales on a daily basis.24,25 However, one potential problem with VAS scales when attempting to measure constructs of readiness is that only the extremes of the scales are described, 20 and therefore this warrants some additional exploration in the design of these scales to provide further refinement to response selection. As such, alternative approaches have been suggested to improve the utility of the VAS scale by including additional response categories along the continuous scale, whilst simultaneously circumventing the issues presented with Likert type ordinal scales.20,26,27 Given the complex nature of the evaluation of psycho-physiological constructs, such as tiredness/fatigue, energy, muscle soreness, physical readiness, stress and well-being the current study looks to explore the perceptual responses of Division I collegiate athletes in relation to established descriptors of each of these readiness constructs readily employed within the literature. The aim of this study is to explore which respective descriptors for each readiness construct can be distinguished using a VAS type scale (0–100) to provide face and construct validity to this approach (i.e., the scale appropriately measures the construct its attempting to measure). A secondary aim is to determine the potential number of anchor points (the locations of where verbal descriptors are located) for a given construct to refine the VAS scale.
Methods
Research design
The current study utilized a custom designed electronic survey (Qualtrics, Provo, UT) consisting of six sections, with a different section for each readiness construct (fatigue / tiredness, energy, muscle soreness, physical readiness, stress and overall well-being) allocated in a blinded randomized process (i.e., the participants did not know the contents or order of constructs and descriptors during the assessment). The participants were provided with descriptors (one at a time) associated with the construct, in a randomized order. They were asked to determine the positioning of each descriptor on a 0–100pt line through the placement of a marker in electronic format (interactive slider). For example, for the construct of muscle soreness, “very very sore” would appear and the participant would place the slider in the position they felt represented that descriptor. On completion the next descriptor would appear in a randomly selected order (e.g., “minimal”) with the participant repeating this process for all descriptors. Upon completion of data collection, a Bayesian Logistic Regression was fitted to determine the posterior probability that a value associated to the descriptor within a given construct was greater or less than 50. This was done due to the scale ends not being provided, so the directionality of the participant's responses could be determined, using 50 as a central point reflecting neutral when responses were located on either side. The data were also explored through hierarchical clustering to determine which (if any) responses showed similarity in the distribution of placement on the scale. The outcomes of the analysis were used to determine the observed number of clusters within the construct, which could then be used to identify the potential number of factors needed across the scale. This was performed in an attempt to assess the associated verbal descriptors that could be used as anchors within the design of the scale to measure the respective construct..
Participants
Participants consisted of female (N = 48) and male (N = 58) National Collegiate Athletics Association (NCAA) Division I collegiate athletes (USA). Prior to data collection, participant information was provided, and consent was collected in electronic format. All study procedures were conducted in association with the declaration of Helsinki and the study was approved by the local institutional review board.
Procedures
Prior to the design of the survey the researchers performed a literature review of current readiness practices in sports to determine common words/descriptors associated with each readiness construct.16–18 After review, the specific nomenclature was extracted and then cross referenced with each construct so that some internal consistency was maintained, when possible, across constructs. Prior to administration the survey was designed using an online survey software (Qualtrics, Provo, UT). Each construct was added as an individual section and the associated descriptors were added to each respective section as individual questions. Both sections and their respective questions were randomized to minimize any learning effects as a result of previous answers. The interactive slider was designed as a blank black line with the marker starting at the left side (corresponding to 0) so that each descriptor was assessed from the same starting point. There were no associated tick marks or descriptor anchors to designate the polar ends of the scales. This minimization was done purposefully to gauge the perception of each athlete without any influence of visual factors, as responses will typically distribute around delineated tick marks and anchors. 23
Each participant was provided with a link to the survey through their mobile device and instructed to perform the survey at home free of distractions. The choice of mobile device and home environment was selected to maintain ecological validity, as if such a questionnaire was employed collegiate athletes would typically assess readiness within their home environment. The participants were provided with one example question (using an example construct of RPE) in an attempt to provide familiarization and minimize confusion as to what was expected within the survey. Participants were instructed to slide the marker to the area on the interactive slider scale that they perceived to be the best place for the descriptor that was displayed at the top of their screen. Participants were free to select any location for each descriptor and could repeat locations. Participants performed this process for all sections and questions to determine a distribution of responses across the scale, taking approximately 10–15 min to complete. Similar approaches to establish this type of visual analog scale have been documented elsewhere. 20 The data were then exported to excel spreadsheet format for subsequent analysis.
Statistical analyses
Analyses were performed in RStudio (version 2024.04 “Chocolate Cosmos”) using the base R programming language (version 4.4). Data were inspected through histograms and box plots for each descriptor within each readiness construct. As the two ends of the scale were not provided to the participants during the data collection, for descriptive purposes the percentage of responses above and below 50 (with 50 being deemed approximate neutral for this type of VAS) for each descriptor in each construct were determined as to provide an indication of directionality (i.e., did the participant view the descriptor to be above or below neutral / the middle point of the scale).
Since participants were not directed as to which side of the scale (0 or 100) to select, a Bayesian logistic regression was fitted using rstanarm (version 2.32.1). 27 This was utilized to determine the posterior distribution for the probability that a response was above or below 50. Given that the participants were blinded to the polar ends of the scale, this allowed for an adjustment to be made based on which end of the scale the participants naturally associated the descriptor to. The model had random effects for each construct and the nested descriptors within each construct (Full model specification given in Supplementary Material A). Prior to modeling some data processing was required to group similar adjectives together. Given the similarities between descriptors for each construct the following words associated with the construct were removed (e.g., very *sore*, very *tired* etc..) so that adjectives (such as “very” or “extremely”) could inform the model (i.e., which side of 50 a participant would be likely to select). After verifying via the Rhat statistic that the posterior sampling had converged, a 90% Bayesian credible interval was constructed for the posterior distribution with posterior significance being determined when this interval (based on Highest Posterior Density (HPDI)) was either entirely below or above 50 respectively.
For each descriptor in which the mean posterior probability was below 0.5, all values x above 50 were transformed to
Results
The descriptive statistics and the percentage of results above, at and below 50 for each descriptor within each construct are displayed within Supplementary Material B.
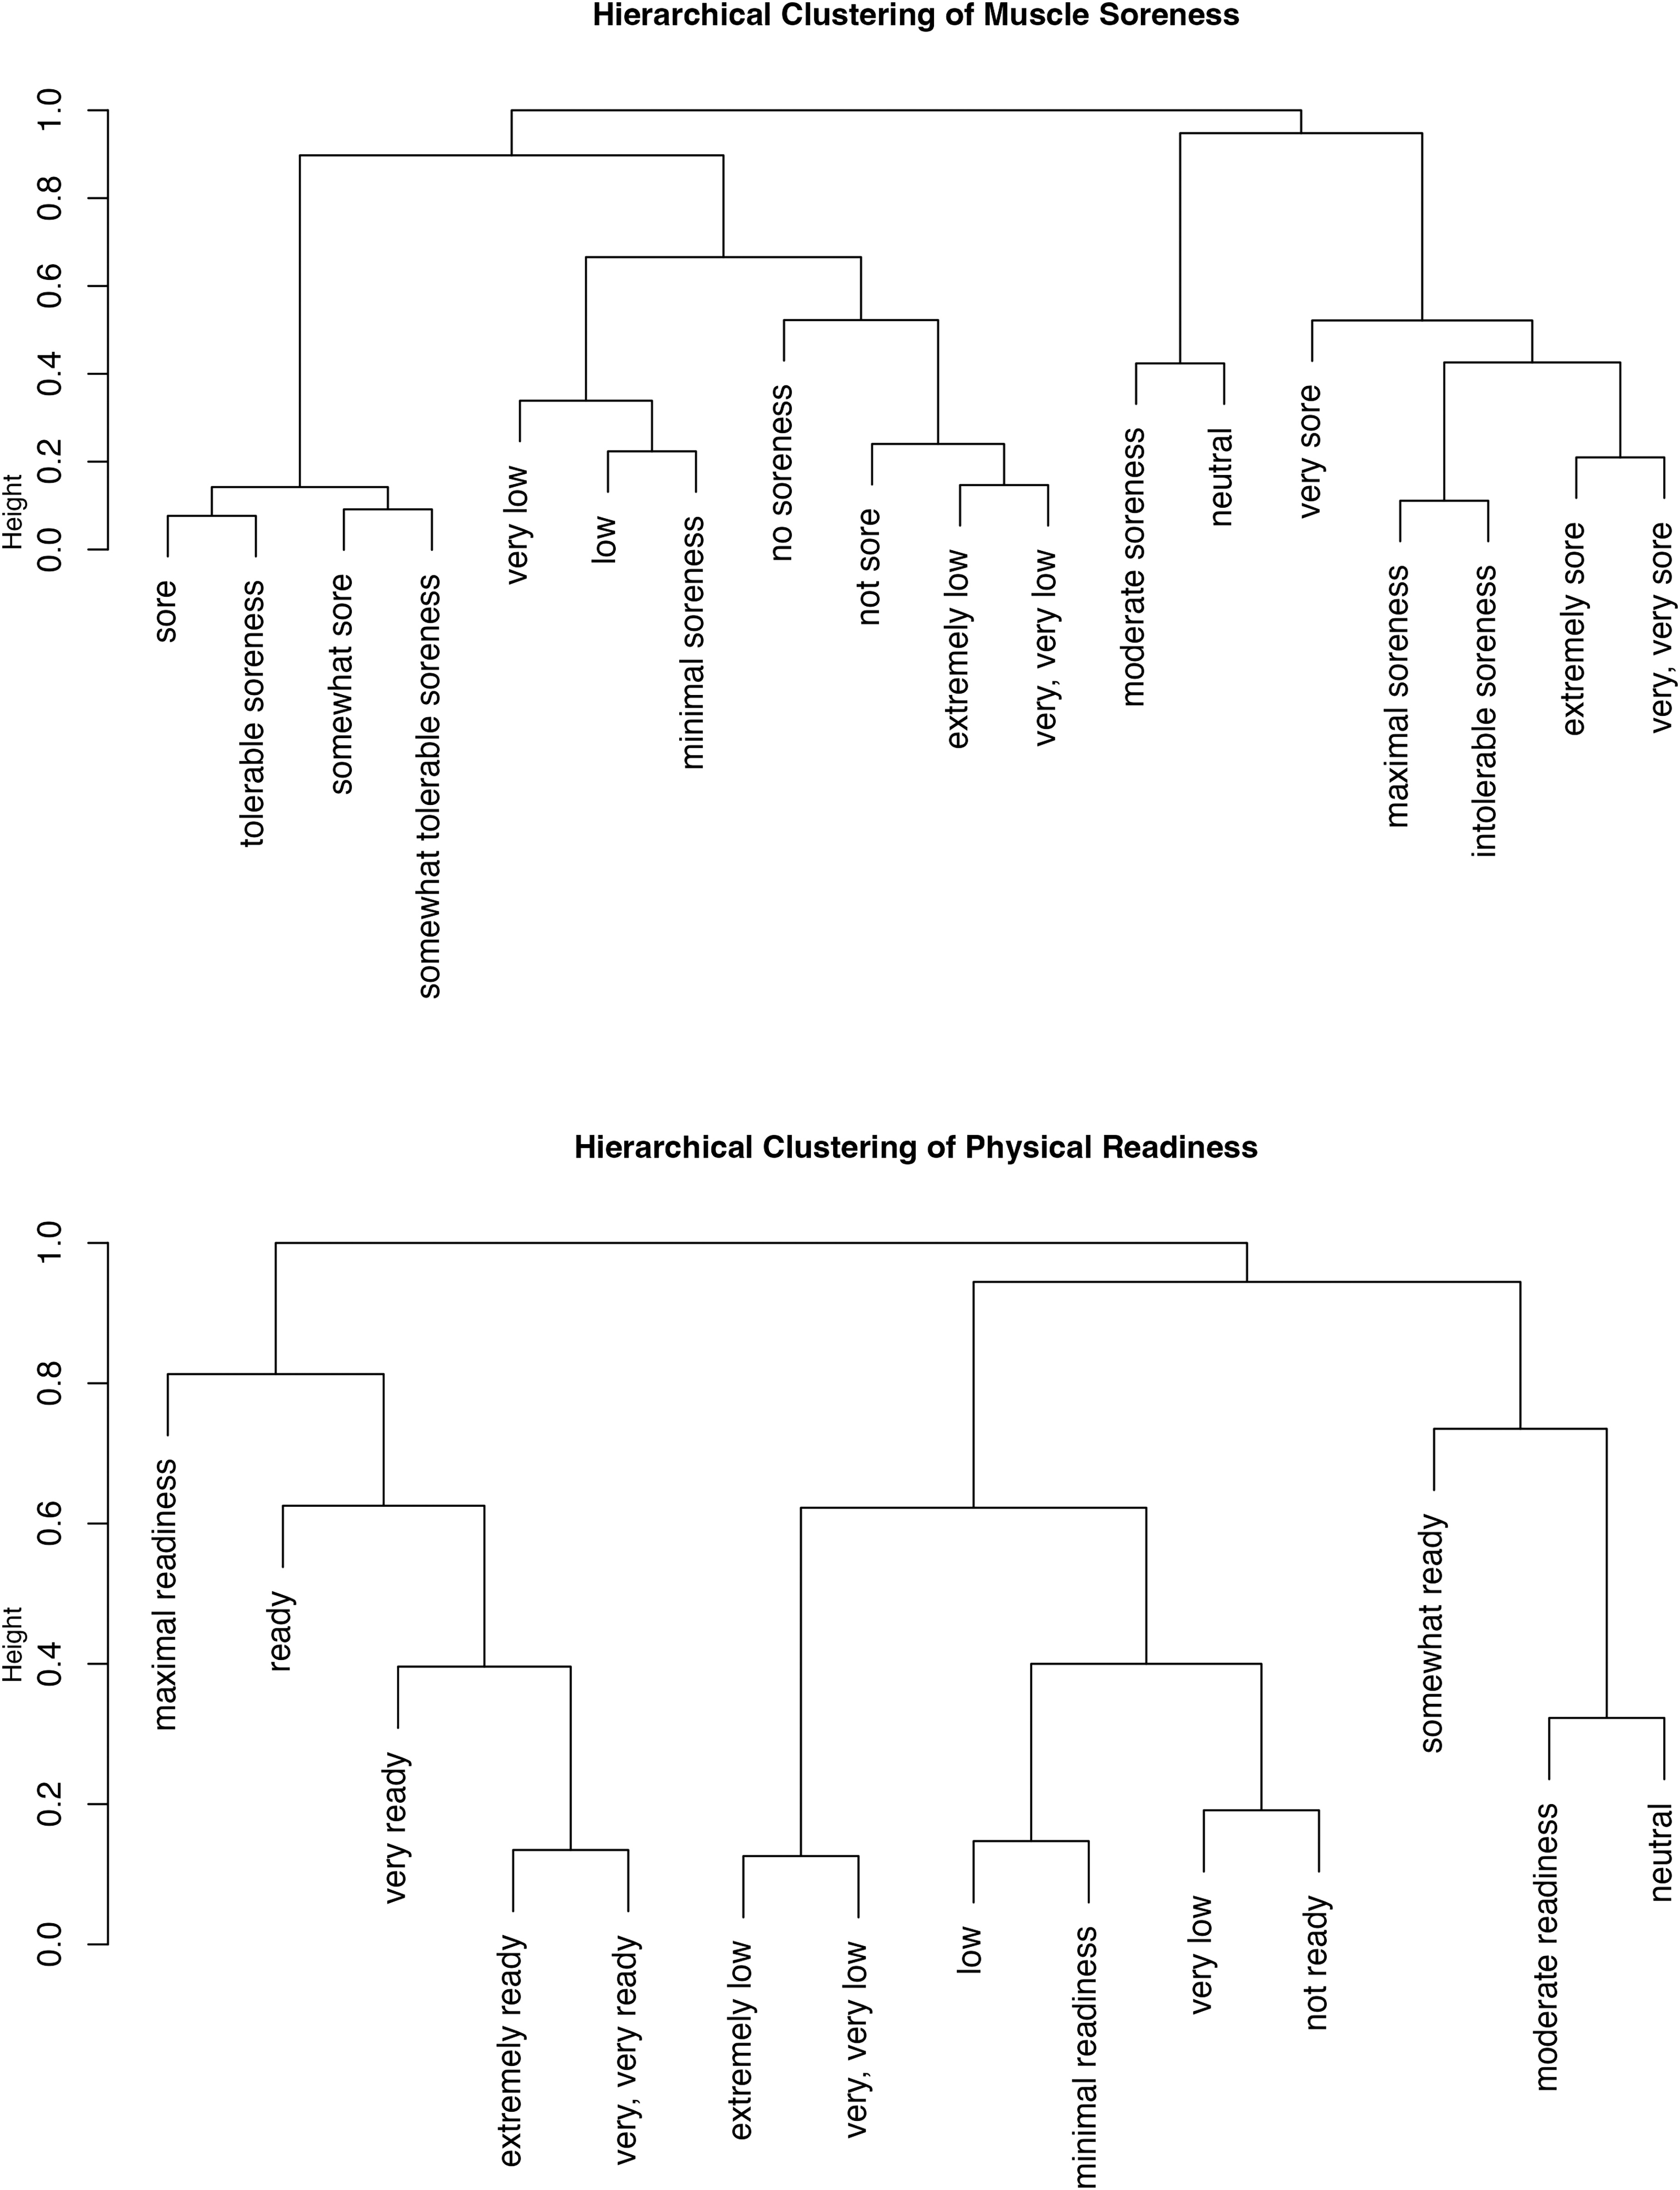
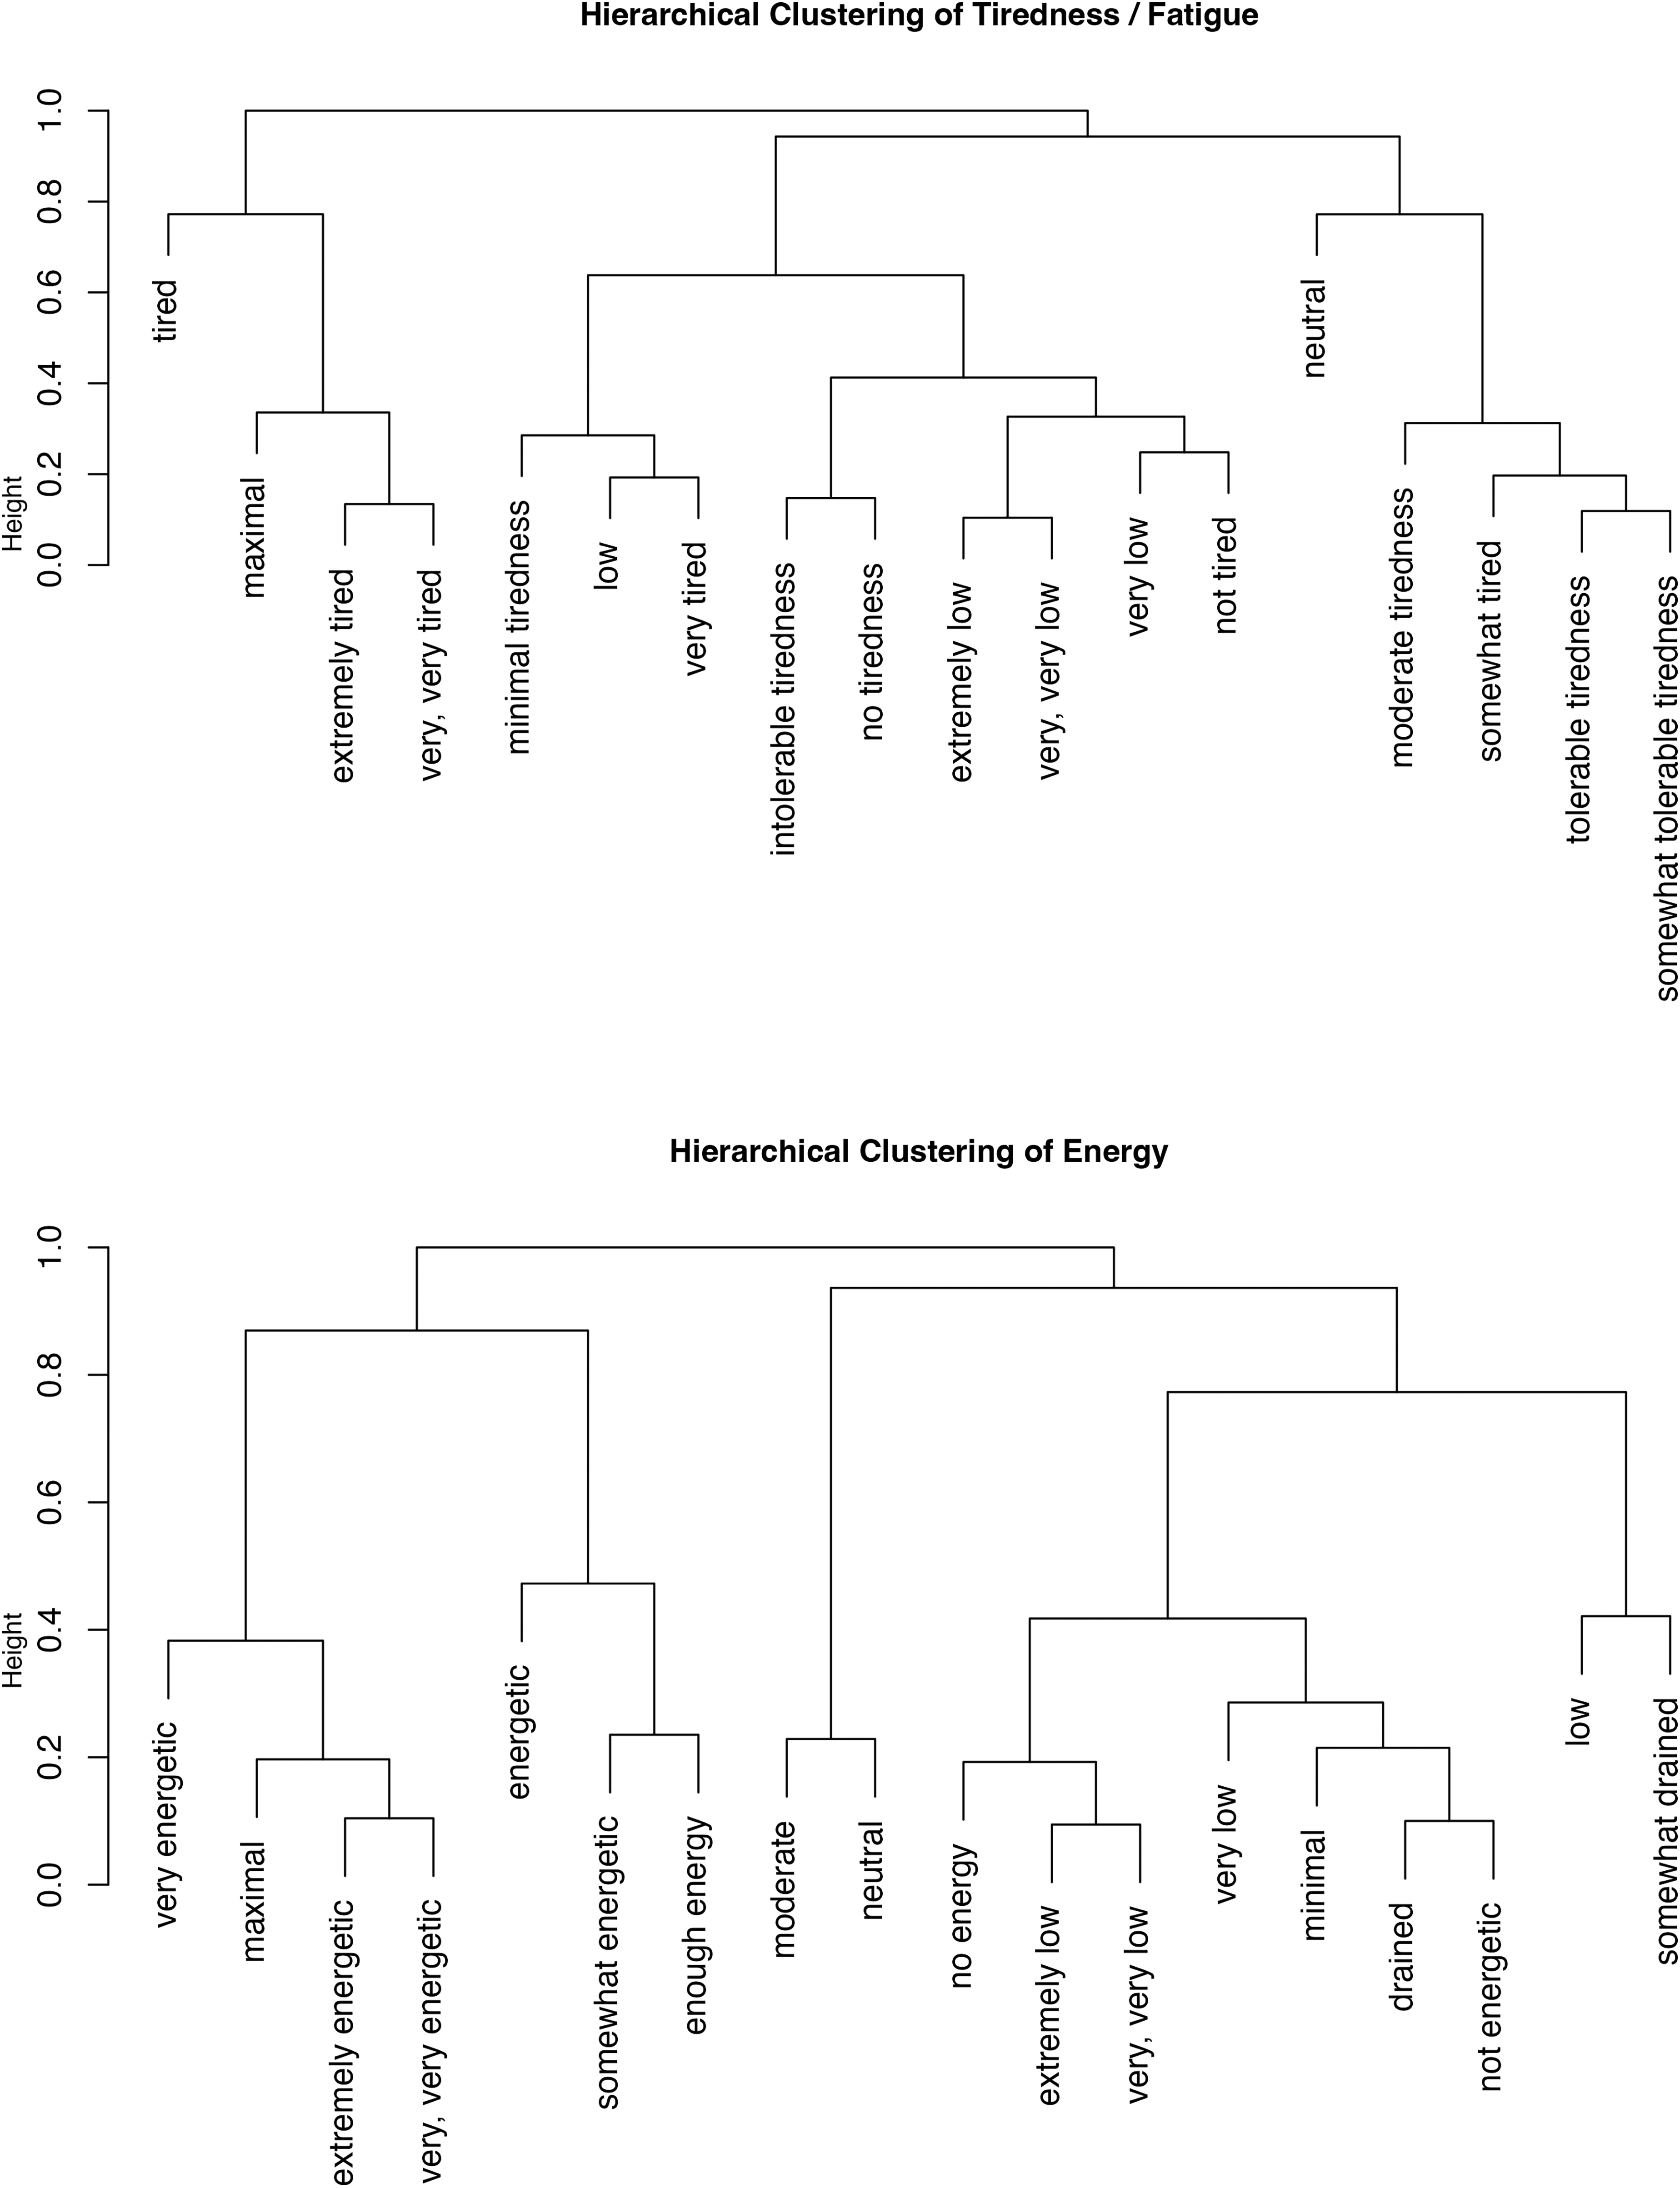
The results of the Bayesian logistic regression are displayed within Figure 1. For the constructs Energy, Fatigue/Tiredness, Physical Readiness, Well-Being and Stress, the “neutral” descriptor had a posterior probability ∼0.5, suggesting this descriptor was distributed around the central point of 50 for each respective construct. Only Muscle Soreness demonstrated a 90% posterior probability that the values were above the central point of 50 for the neutral descriptor as approximately 80% of responses were at 50 or higher (though the central tendency for this descriptor was approximately 50 and the credible interval still included 50). In general, the common descriptors amongst constructs were distributed on the same side of 50 for each construct with the exception of “somewhat” for the Energy construct and “moderate” for the Muscle Soreness construct. Following transformation to reflect the respective side of the scale a descriptor had the highest probability of being on (<50 or >50) hierarchical clustering was performed to identify the relationships between descriptors, the respective cluster models are displayed in Figures 2 to 4.
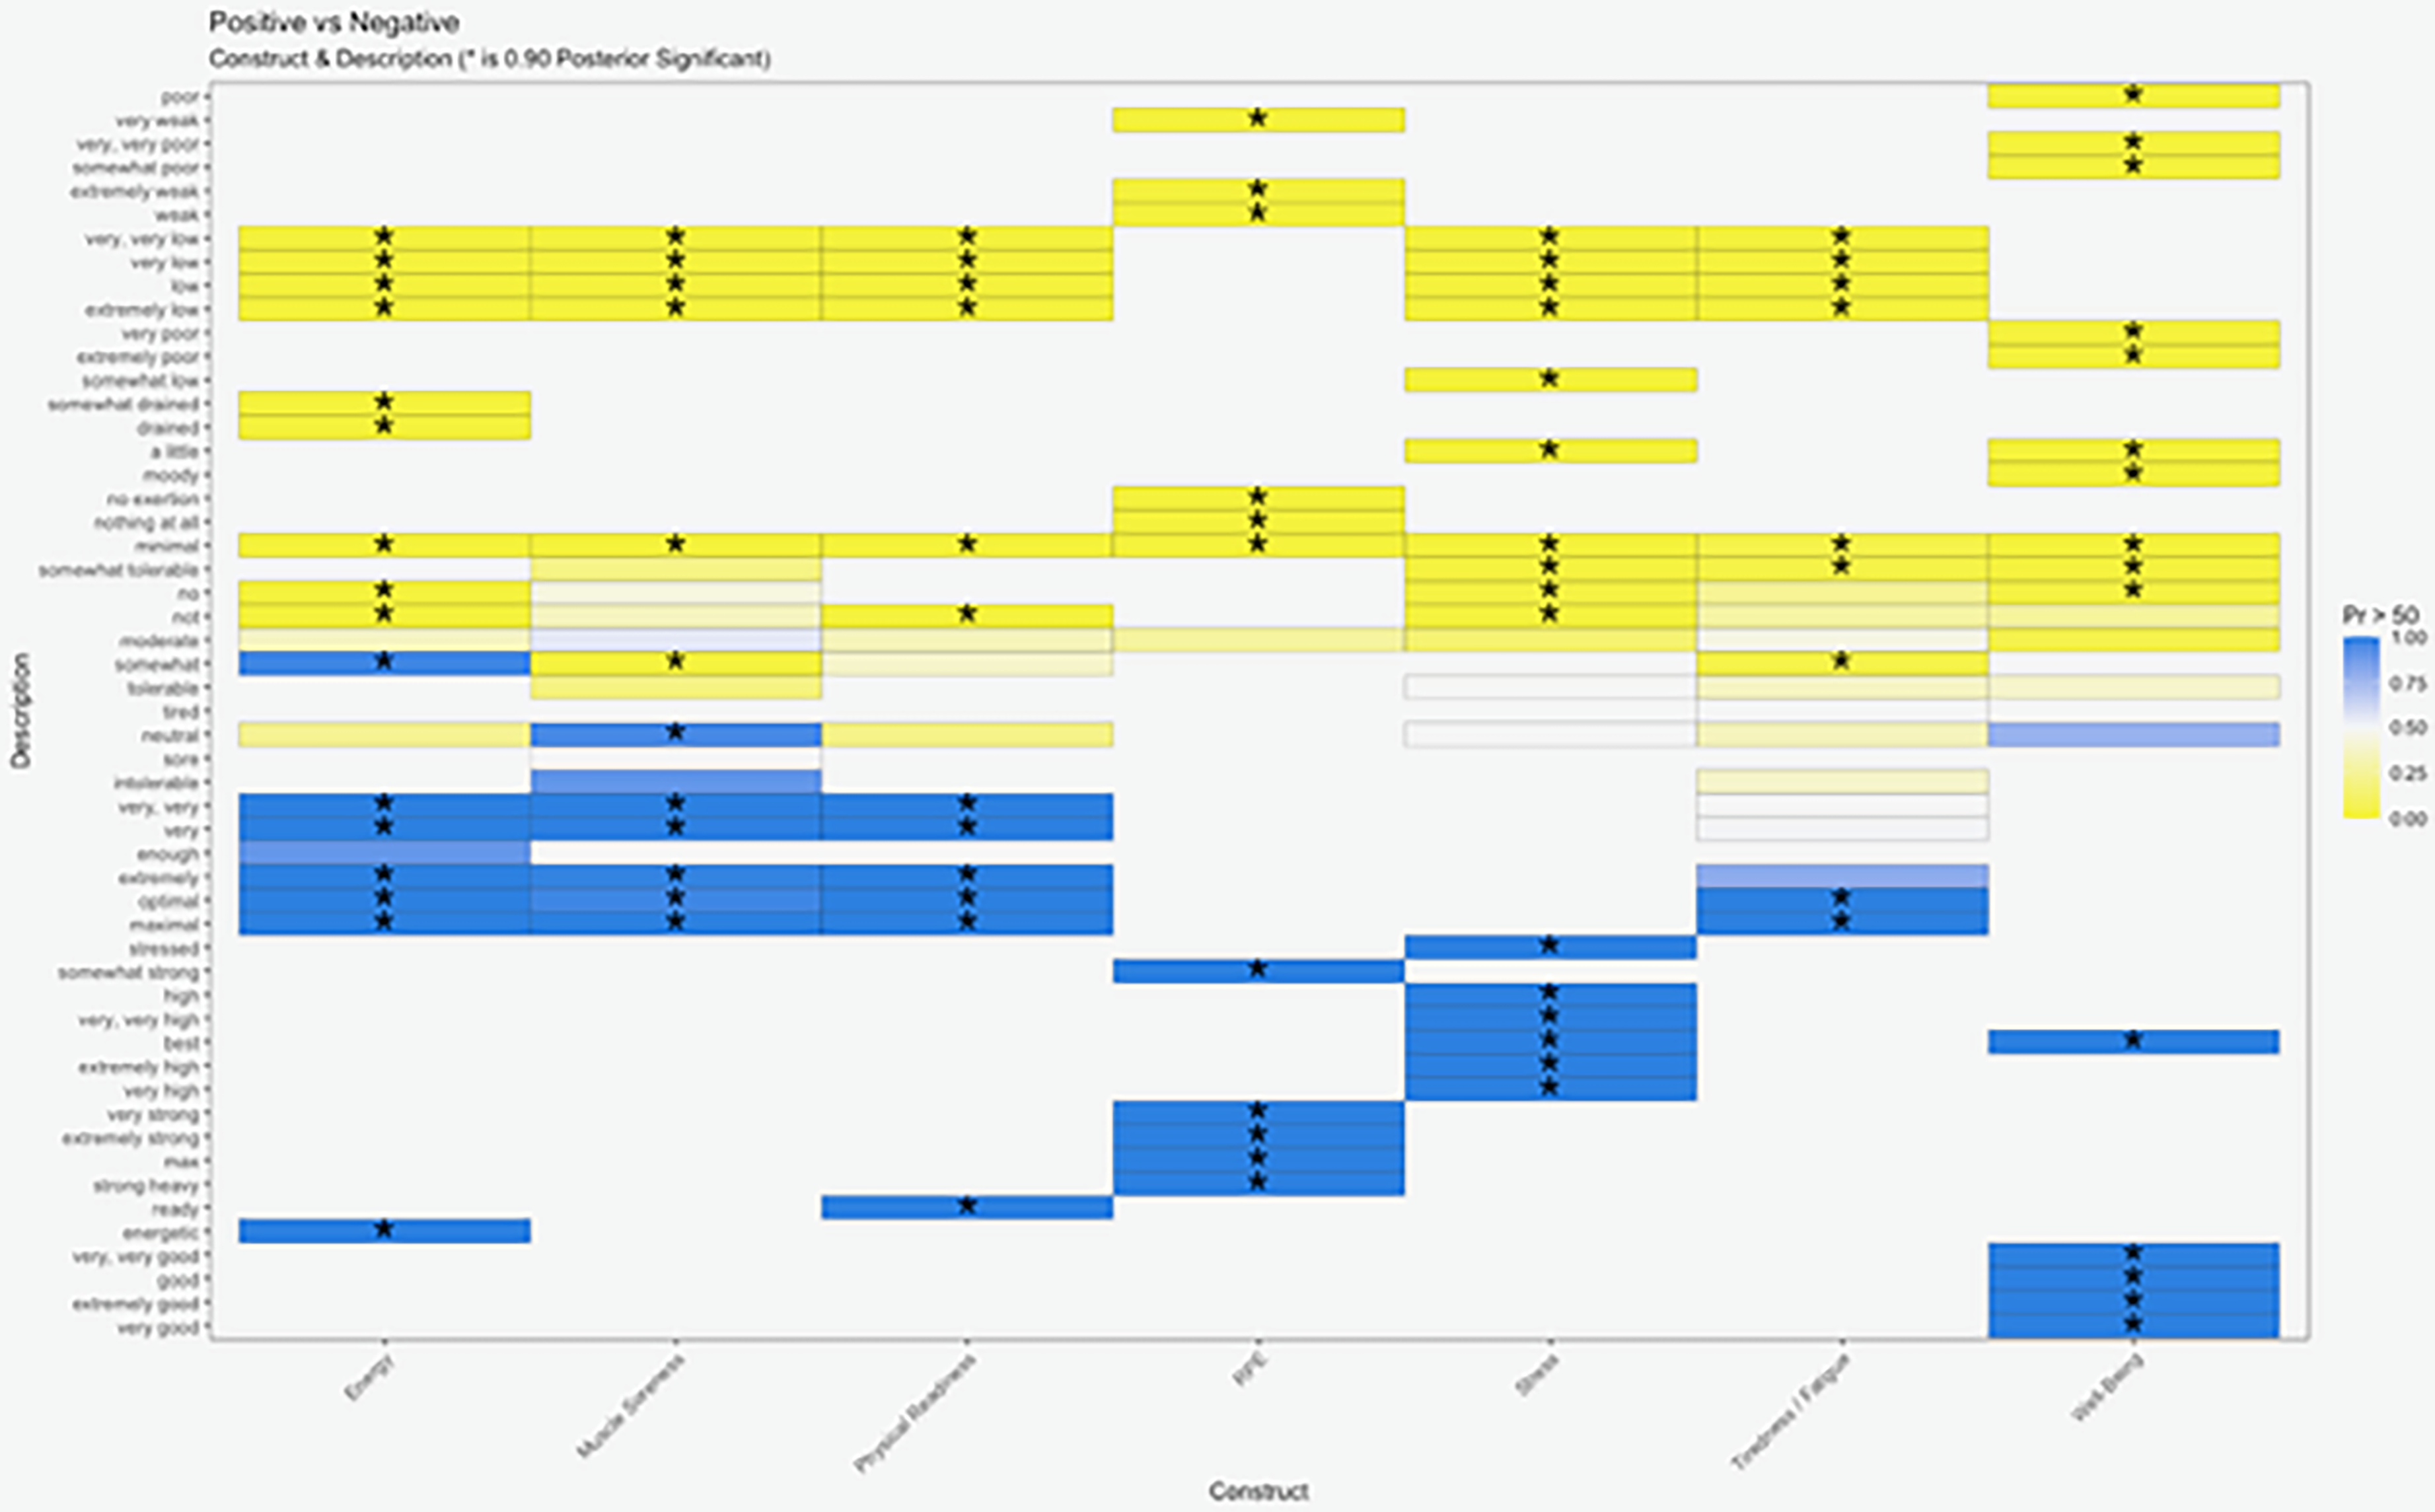
Displays the results from the Bayesian logistic regression; the posterior probability that a descriptor is above or below 50. Descriptors that were determined to be lower than 50 are highlighted in yellow, those higher than 50 are highlighted in blue. * Denotes a posterior probability in which the 90% credible interval is greater than or less than 50.
Dendrogram of the hierarchical cluster model for both fatigue/tiredness and energy.
Dendrogram of the hierarchical cluster model for both muscle soreness and physical readiness.

Dendrogram of the hierarchical cluster model for both stress and well-being.
Figure 5 displays the elbow plot of inertia, which indicates ∼5 clusters to be the elbow point for each cluster. The number of clusters that had the lowest inter-cluster variation are displayed within Figure 6. These results indicate that for Muscle Soreness and Physical Readiness the number of clusters is 6. For the tiredness/fatigue construct the number of identified clusters with the lowest SD was 5. Stress displayed 7 clusters to have the lowest inter-cluster variation. Energy and Well-Being both displayed a larger number of clusters (12 & 13 respectively) reflecting greater variability in the number of clusters. An overview of the associated clusters for each descriptor and the adjusted value on the scale within each construct is supplied within Supplementary Material C.
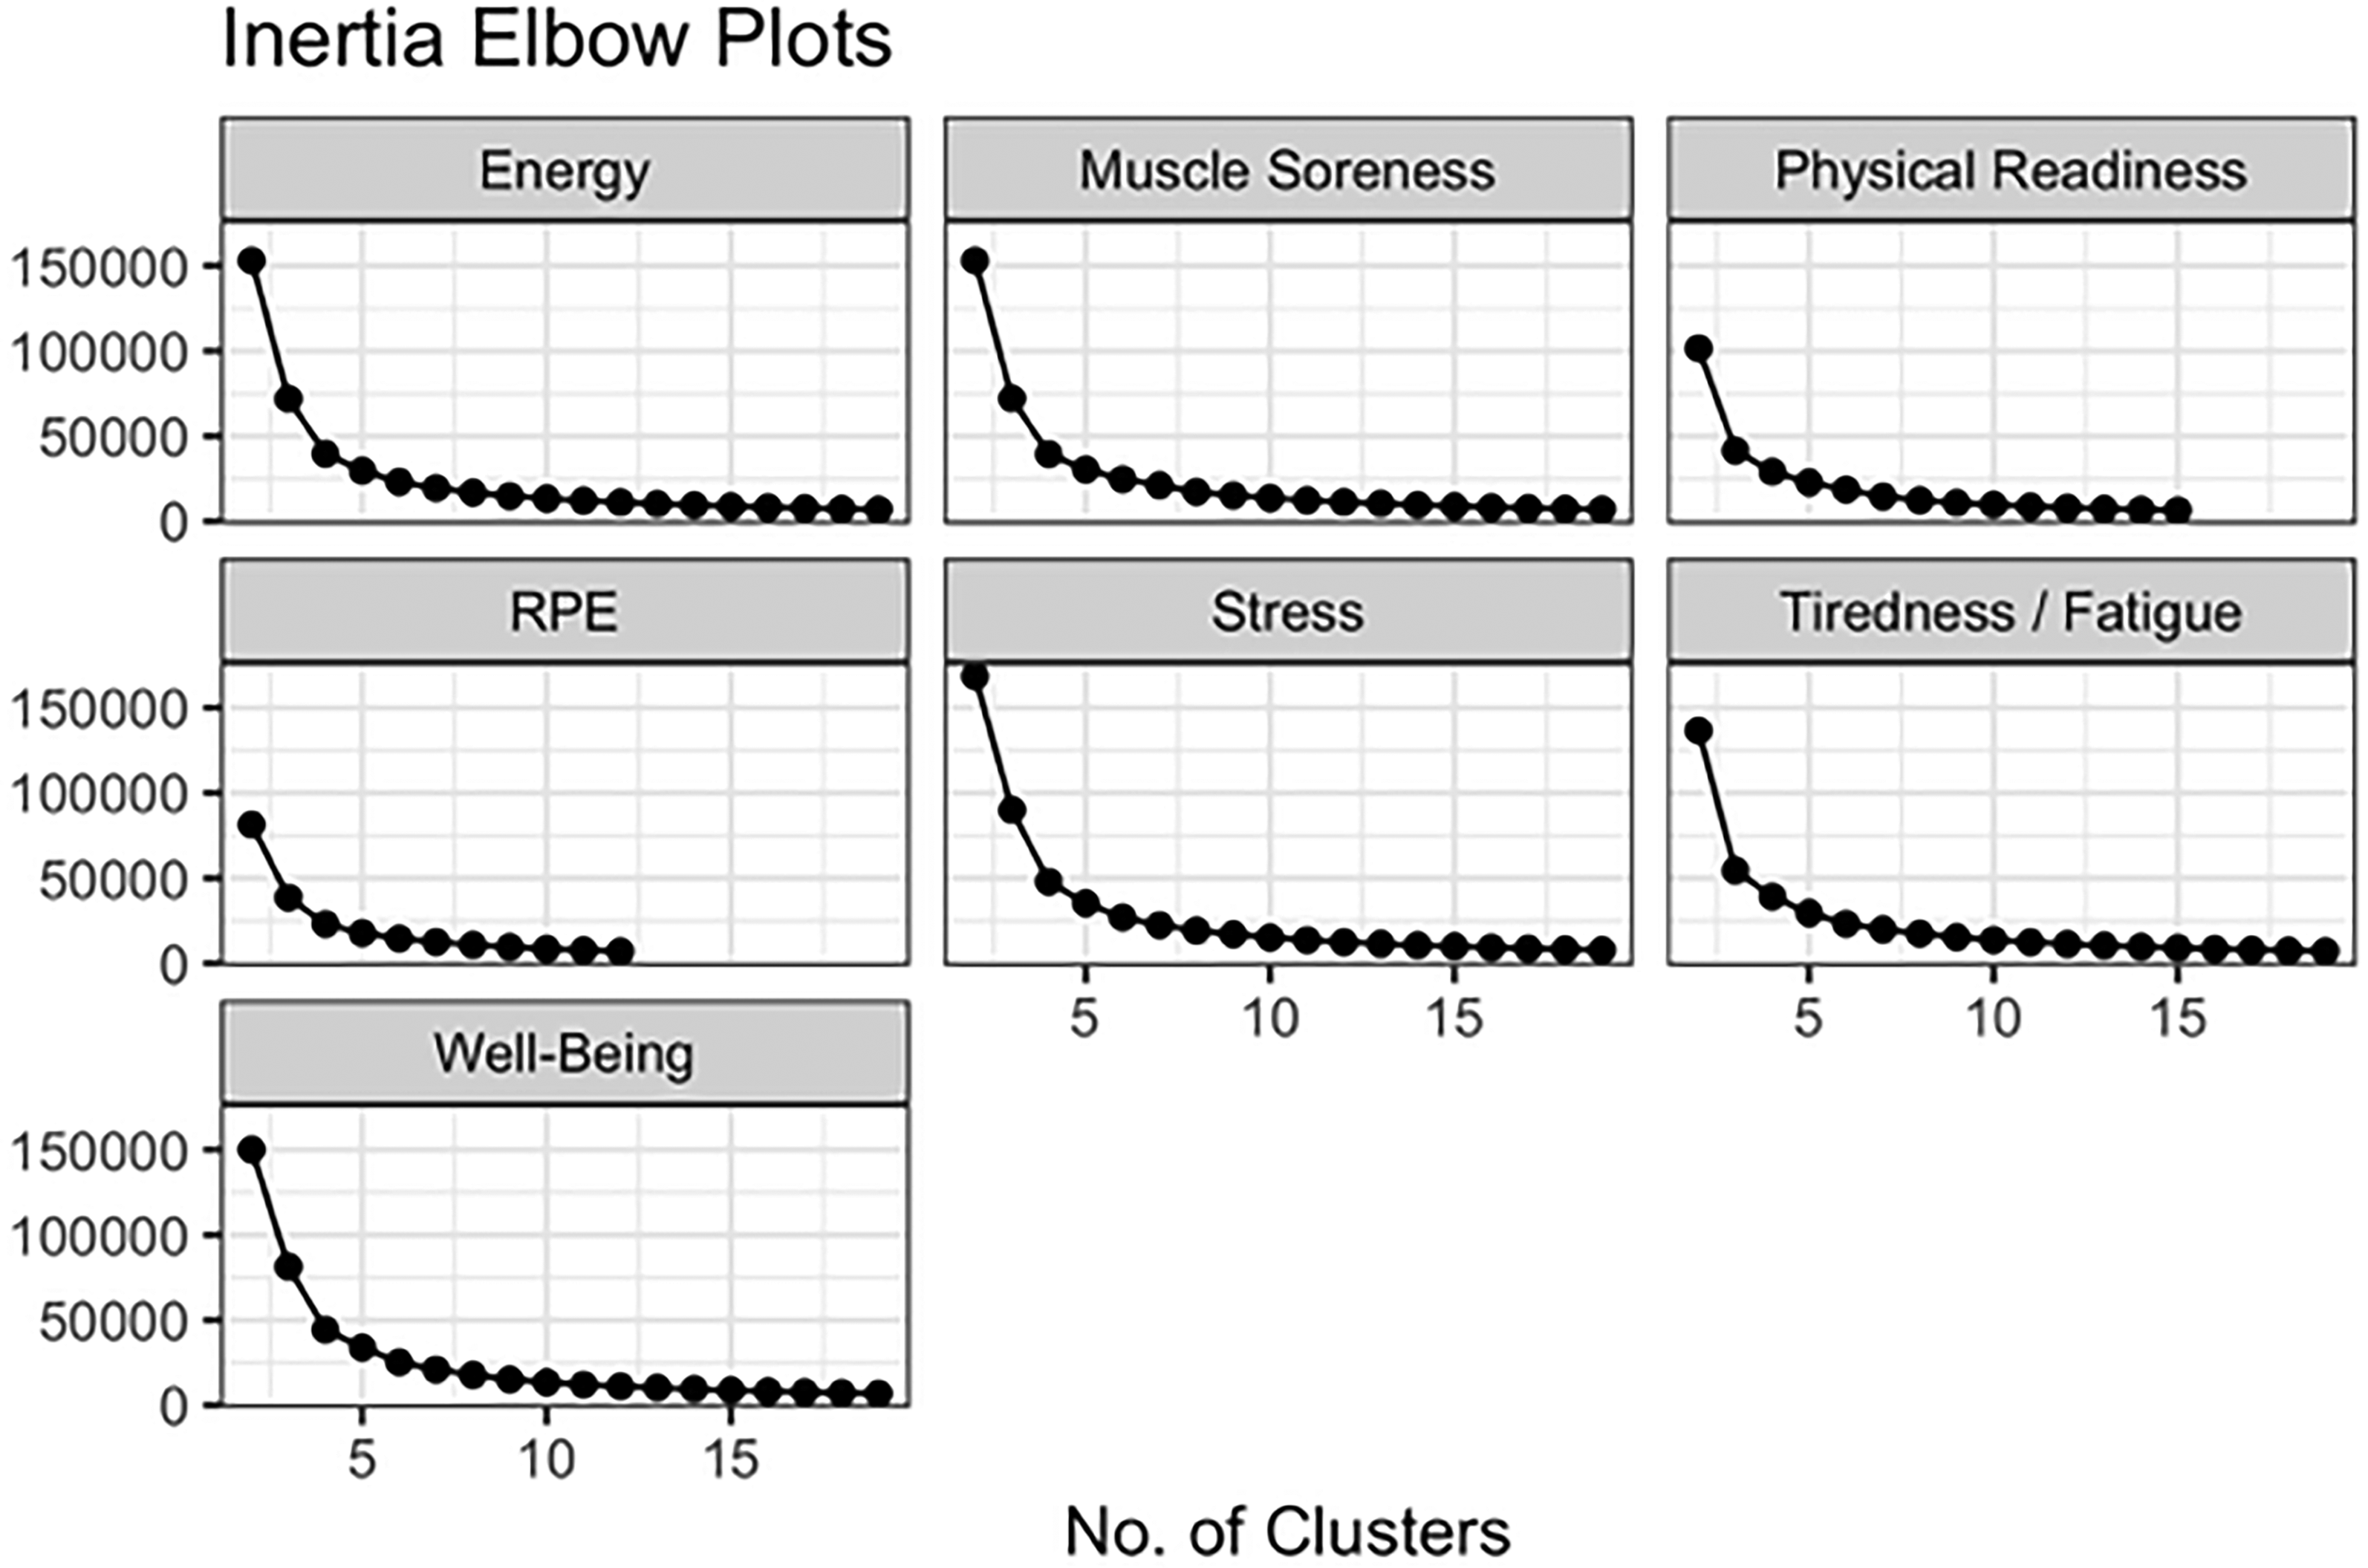
Displays the elbow plot of inertia for each construct.
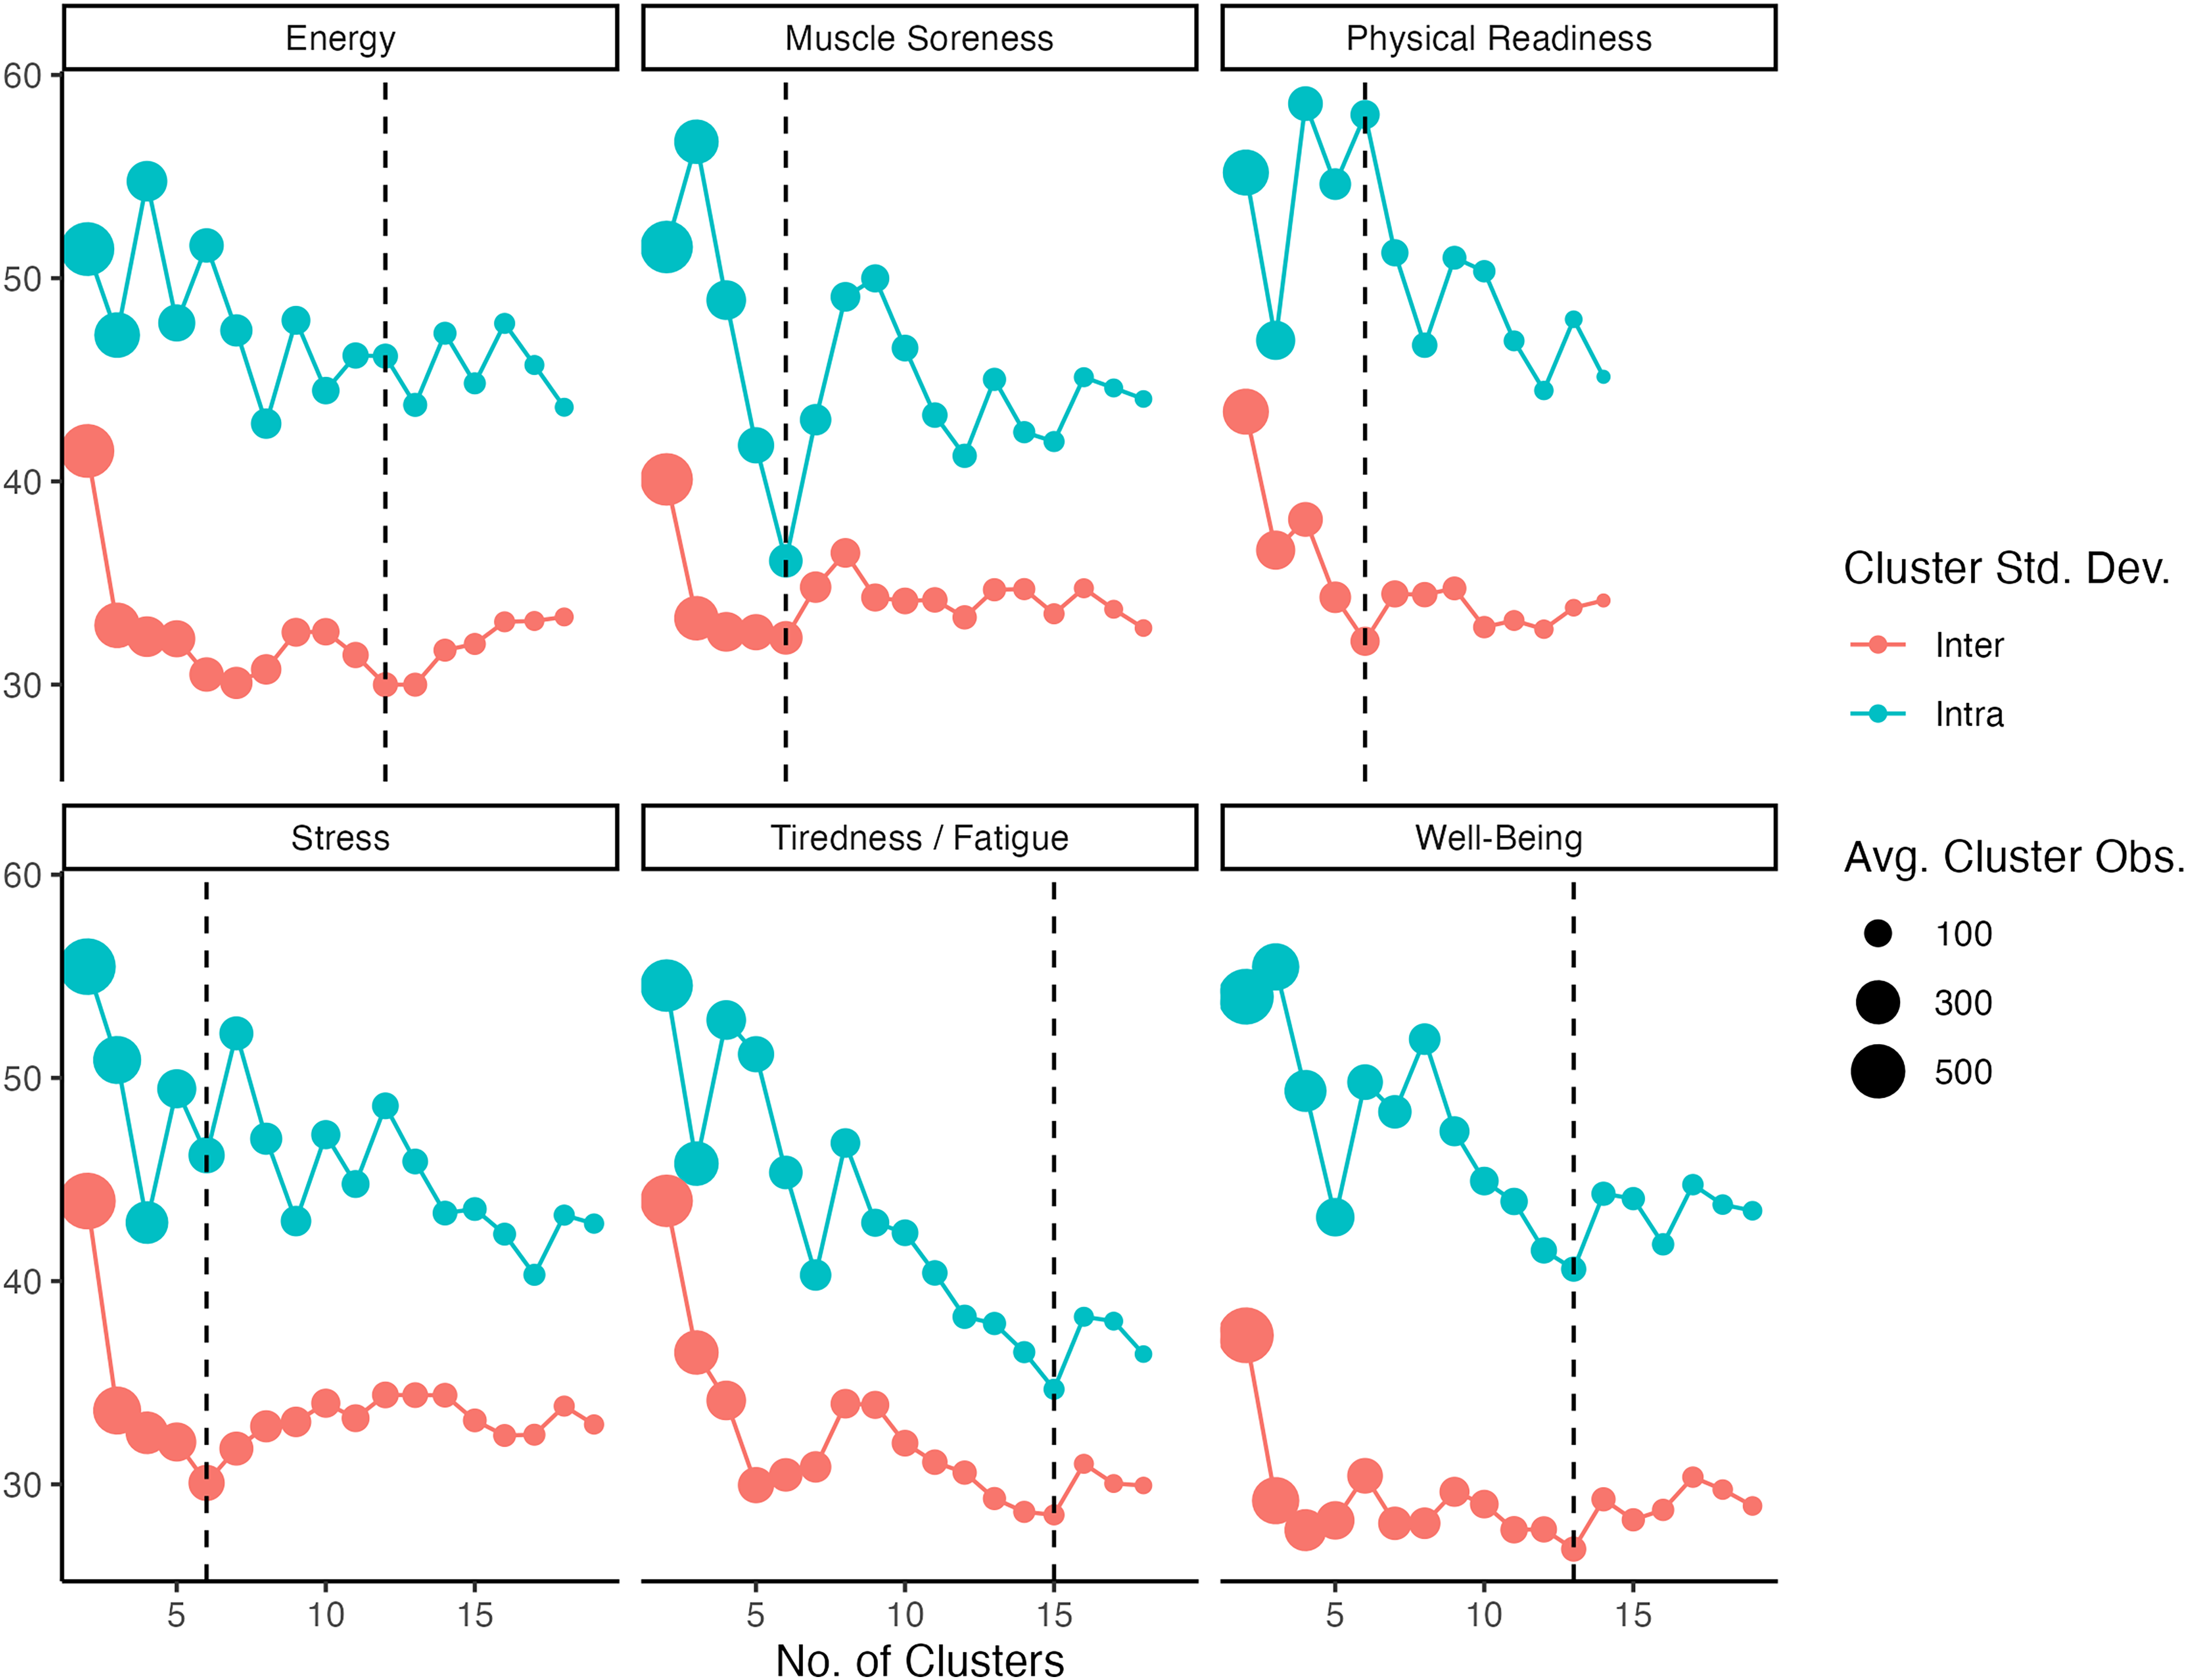
Displays the intra and inter cluster sd for each construct. The black dashed line denotes the number of clusters with the lowest inter-cluster variability (sd of clusters means).
Discussion
The study demonstrates the use of a visual analog scale (VAS) and how the perceptions of various descriptors are distributed across the 100pt scale for the given construct being measured (i.e., Energy, Fatigue/Tiredness, Muscle Soreness, Physical Readiness, Stress and Well-Being) within Division I Collegiate Athletes. The results provide insights into the directionality of such descriptors, the distribution on the scale and the relationships (clustering) between descriptors, assessing commonalities between participant responses. These results highlight key considerations regarding descriptor selection and can be used to potentially inform anchor point selection (for the descriptor within the respective readiness construct) when constructing an ASRM questionnaire.
Despite the popularity, Likert scales may present disadvantages in comparison to other types of scales when attempting to assess constructs of readiness (e.g., respondents are inclined to select middle response categories and the ordinal type data can be difficult to analyze in the applied setting).20,26,28 As such VAS scales have been suggested as a practical solution for this type of measurement, providing interval type data which is applicable to more common statistical approaches.20,29 The current study explored the distribution of responses on a VAS Scale (using an approach similar to the construction of a visual analog scale for rating, ranking and paired comparisons VAS-RRP 20 ) in an attempt to refine the VAS and identify the number of potential unique anchor points for each construct. Such an approach allowed for the “perception of perceptions” of collegiate athletes, to understand how these individuals place various descriptors associated to different constructs of readiness on a VAS scale. An important finding here is that for each of the constructs neutral terms were determined to be at or near 50, which is an important point to distinguish on VAS scales. 20 For most of the adjectives the directionality (i.e., the probability above or below 50) was similar across constructs, despite the participant's not being provided with the extreme ends of the VAS scale. Such a finding provides support to the utility of the majority of individuals being able to consistently identify lower or higher placement scores related to their perception of the descriptor of that specific construct.
Another advantage to this type of modified VAS scale is the determination of what anchors to use and how to scale these. In contrast during the construction of Likert Scales, typically arbitrary choices are made on the appropriate number of anchor choices, with there being no general consensus on an optimal way to form these questionnaires.30,31 In this study using a novel approach, the participants responses offered a means to calculate the distribution of their perceptions of these descriptors to demonstrate central tendency of the responses. Through hierarchical clustering the relationships between these responses were then assessed. While there is no one correct way to identify the appropriate number of clusters within each construct, through the determination of inter cluster variation it would seem between 5–7 clusters would be appropriate for the constructs of fatigue/tiredness, muscle soreness, stress and physical readiness. It should be noted that for the constructs of energy and well-being, the inter-cluster variation was relatively higher than the other constructs and suggested the number of clusters which reduced this variability would be between 13 and 14 respectively. Such results could be due to the differences between participants in describing the ideal placement of the descriptors with the construct, which may be also in part due to the understanding how to describe the construct (i.e., there are more points needed on the scale for participants to differentiate their feelings of energy and well-being). However, we chose to cut these clusters with 7 possible groups to remain consistent with the other constructs. Given that tiredness/fatigue and stress could arguably inform an individual's energy and well-being (as these form the inverse constructs of energy and well-being), it could be suggested that they may be more appropriate in this case for the administration of this type of ASRM to remain consistent on scaling and not over saturating the scale with verbiage.
Supplementary Material C provides an overview of the clusters within each construct and the associated descriptors within each cluster. The central tendency for the adjusted rating for the descriptor is also provided. Practitioners and researchers can use these values as a guide to determine the position of an anchor point along the refined VAS and the selected verbiage to describe the cluster within that construct. Such information can prove useful when determining a custom readiness questionnaire as these values reflect the perceived location of athlete participants.
While this study offers a unique perspective on the construction of ASRM to monitor readiness responses, it is not without limitations. Firstly, this study was intended as an exploratory analysis, as such a sample of ∼50 male and ∼50 female participants was targeted. A larger sample of participants would provide greater indication of the distribution of responses and central tendency for each descriptor across the scale, as well as improve the potential to identify the “optimal” number of clusters between the descriptors. Additionally in this study the participants were not provided with the polar ends of the scales, which was done in an attempt to keep any bias from influencing point selections and to understand which end the participants perceived the scales to start and finish from. However, from the results of the initial observations there are indications as to which side of 50 specific descriptors should fall on as well as how the polarity should be determined. Therefore, future analysis may look to provide the two end anchors to assess the additional accuracy of placement of the subsequent descriptors replicating the approach in the current study. Within the current analysis repeated measures were not performed, this is likely an important next step to determine whether the same individual is consistent in their placement of the same descriptor on the scale and provide a measure of reliability to the constructed scale. Such analysis may be more appropriate with descriptors that represent the global cluster associated with the construct, as determined in this analysis to reduce the selection burden placed on participants. Lastly, upon constructing a readiness questionnaire using this scale, the sensitivity of the scale would need to be determined (i.e., does this scale respond in relation to the response of training and competition) and therefore needs to be investigated to provide further construct validity.
Conclusion
This study is the first to assess the perceptions of Division I Collegiate Athletes and their responses of locations of descriptors, related to different readiness constructs typically employed in sport, along a VAS scale. The results of this exploratory analysis suggest the appropriate direction (above or below 50) and the commonalities between various adjectives used to describe readiness constructs. This information provides new insights into the development of an appropriate scale to assess different constructs of readiness in the applied setting using a scale developed through athlete's perceptions.
Practical implications
A refined Visual Analog Scale has been investigated to aid practitioner collection of readiness information and circumvent challenges typically associated with this type of measurement through other popular ASRM scales (e.g., Likert scales).
The results of the current study provides indication of the different response categories, the verbiage associated to those categories and the suggested location based on the target demographic perceived responses of the likely location of these descriptors.
Such information can help guide practitioners when wanting to implement such readiness measures through a custom scale approach by providing the appropriate selection of anchors and the scaling of these anchors to form the VAS scale.
Supplemental Material
sj-docx-1-spo-10.1177_17479541251388425 - Supplemental material for Perception of perceptions: Exploring A new approach to determine self-reported measures of readiness in division I collegiate athletes
Supplemental material, sj-docx-1-spo-10.1177_17479541251388425 for Perception of perceptions: Exploring A new approach to determine self-reported measures of readiness in division I collegiate athletes by Craig M Whitworth-Turner, Adam Thompson, and Paul Sabin in International Journal of Sports Science & Coaching
Footnotes
Acknowledgements
The authors of this study received no financial remuneration nor have any conflicts of interest to declare regarding the conduction of this study. The authors would like to thank the cooperation of the student athletes at the University of Pennslyvania and the staff of the department of athletics for providing their time and energy to administer the study procedures.
Supplemental Material
All supplemental material mentioned in the text is available in the online version of the journal.
References
Supplementary Material
Please find the following supplemental material available below.
For Open Access articles published under a Creative Commons License, all supplemental material carries the same license as the article it is associated with.
For non-Open Access articles published, all supplemental material carries a non-exclusive license, and permission requests for re-use of supplemental material or any part of supplemental material shall be sent directly to the copyright owner as specified in the copyright notice associated with the article.