
Abstract
Potential estimation (PE) in rugby union traditionally emphasizes physical, anthropometric, and biological attributes to distinguish between playing positions. Forwards are typically characterized by greater strength and power, whereas backs rely more on speed and agility. However, how these differentiators evolve across developmental stages remains underexplored. This study aimed to examine age-related changes in discriminative variables influencing positional differentiation across U14, U16, and U18 categories. A total of 139 national level male rugby players were assessed: U14 (n = 64), U16 (n = 51), and U18 (n = 24). Anthropometric data (height, body mass, body mass index (BMI)), maturity status (Y-PHV, MO), sprint performance (T10, T30), and horizontal force-velocity (F-v) profiling were collected. ANOVAs and post hoc analyses explored differences across age and position. Decision tree models identified key discriminative variables, and a feature importance analysis was performed, complemented by a recurrence analysis. Findings revealed significant age- and position-related differences (p < 0.05). BMI and maturity variables were the most relevant at U14, while sprint and F-v metrics gained importance with age. In U18, physical performance indicators such as peak power, theoretical maximal horizontal force, and slope force velocity emerged as dominant. These results suggest a transition from anthropometric to performance-based differentiation across age groups, offering key insights for refining PE strategies in youth rugby.
Introduction
Rugby union is a high-intensity collision sport characterized by its various physical and anthropometric demands, particularly at the professional level. The game is structured around distinct playing positions, primarily divided into forwards and backs, each with distinct roles and physical requirements. Forwards are typically taller, heavier, and exhibit greater body mass (BM) and fat mass than backs. These characteristics enhance their strength and absolute power but are associated with reduced speed and lower aerobic fitness levels.1,2 In addition, these physical characteristics enable forwards to dominate in contact situations, such as scrummaging and rucking, where greater BM and power confer a distinct advantage. 2 In contrast, backs exhibit higher levels of aerobic fitness, speed, and agility, enabling them to excel in open field play where quick accelerations and spatial awareness are crucial. 3 Elite level players exhibit superior physical characteristics compared to those at lower competitive levels, including greater body mass, lower body fat percentages, and higher levels of strength and speed. 4
Recent studies in youth rugby have confirmed that such positional differences are already present in early development stages. Peeters et al. 5 reported that U16, U18, and U20 French elite rugby players show progressive increases in height, body mass, and strength with age, while positional differences between forwards and backs remain evident across all categories. Similarly, Zabaloy et al. 6 observed that U17 and U19 forwards displayed greater body mass and lean mass compared with backs, whereas backs achieved better sprint and jump performances. Within this environment, anthropometric characteristics such as skinfolds and fat mass strongly correlate with key fitness attributes, including power, speed, and aerobic fitness, highlighting their importance in positional differentiation and performance optimization. 1 Physical and fitness characteristics reflect the distinct demands of each position and underscore the importance of understanding how they manifest across age groups and competitive levels during the player development process in rugby union.
While numerous studies have described the physical and anthropometric differences between forwards and backs at the elite level,3,7 little is known about how these distinctions emerge and evolve throughout youth development in relation to biological maturation. The interaction between growth, maturation, and positional demands plays a decisive role in shaping the physical and performance profiles of young rugby players. Research in youth rugby league has shown that age, maturity status, and playing position interact to influence body mass, strength, speed, and power, with early-maturing players typically displaying advantages in absolute strength and size, whereas later-maturing players often demonstrate superior relative power and speed capacities.7–9 These maturational effects may bias positional allocation and talent identification, yet such interactions remain underexplored in rugby union. A clearer understanding of how maturation modulates anthropometric and performance relationships across positions is therefore essential to refine potential estimation (PE) frameworks and ensure that player evaluation reflects long-term potential rather than transient maturational advantages.
PE in rugby union aims to identify players with the potential to excel at higher competitive levels by assessing a range of physical, anthropometric, and physiological attributes. These assessments often target positional differentiation, emphasizing the specific demands of forwards and backs.2,7 Research suggests that successful rugby players possess a combination of attributes rather than excelling in a single domain, highlighting the interplay between BM, speed, strength, and agility.7,10
Given the dynamic nature of youth development, effective PE must account for both growth and maturation processes, as these factors significantly influence performance metrics in adolescents.11,12 A key phase across biological development is the peak height velocity (PHV), 13 a critical period of rapid growth and physiological transformation during puberty. During this time, individuals experience accelerated increases in somatic growth, accompanied by hormonal fluctuations, tissue remodeling, and metabolic adjustments.11,14 These changes, however, occur at different chronological ages across individuals, with variations in biological development reaching up to three years.15–17 Such variability profoundly affects athletic performance, particularly in metrics like sprinting, coordination, and power, which are closely related to maturity. 18 Acceleration capacity is a crucial performance parameter in rugby union, distinguishing elite players from those at lower levels. 19 Beyond its significance in gameplay, sprint performance also serves as a reliable predictor of talent in younger athletes. 20 While linear sprint times provide a valuable baseline, a more thorough understanding of an athlete's physiological capabilities requires an analysis of mechanical variables derived from the force-velocity (F-v) relationship. 21 The peak power (Pmax) which quantifies an athlete's ability to generate force and power in sprinting, reflects the increasing importance of physical performance with age. 22
This study aimed to examine how anthropometric characteristics, sprint and power performance, and F-v capabilities during sprinting contribute to positional specialization in youth rugby. The objective was to identify the key physical determinants that align young players with specific playing positions, to improve PE and player evaluation processes. By comparing the physical profiles of forwards and backs across different age categories, the study hypothesized was that the significance of anthropometric variables remains constant with age, whereas sprint performance becomes increasingly important in determining playing position.
Methods
Participants
This cross-sectional study aimed to analyze the physical and anthropometric determinants of positional specialization in junior rugby players. A total of 139 male junior rugby players from national-level categories were included: under 14 years old (U14): (n = 64 with 34 forwards and 30 backs), under 16 years old (U16): (n = 51 with 29 forwards and 22 backs), and under 18 years old (U18): (n = 24 with 15 forwards and 9 backs). Participants were selected based on active enrollment in their respective clubs.
Inclusion criteria required participants to actively compete at the national level, train regularly, and be injury-free at the time of testing. All players engaged in at least 3 to 5 training sessions per week, encompassing both technical training and physical conditioning, including sprint training, speed endurance, and high-intensity aerobic workouts. Training sessions typically lasted 90 to 120 min, and competitive matches were scheduled on weekends. Testing was conducted during the pre-season period (August-September) to assess athletic and speed profiles under standardized conditions.
Exclusion criteria included notable or systemic illnesses and prior lower limb surgeries or injuries reported within three months before testing. All participants were thoroughly informed about the study's goals and procedures. The study protocols were approved by the National Ethics Committee of Sport Sciences (IRB00012476-2022-08-04-173), with informed and parental consent obtained.
The sample size for this study was not based on an a priori statistical power calculation. Conversely, the study's participants were comprised exclusively of the rugby academy's eligible players. This inclusive approach ensured that the data represented the entire population of youth players training and competing at the highest national level within the club.
The total sample (n = 139) employed in this study was comparable to, or larger than, those utilized in analogous studies examining positional differentiation and PE in youth rugby.7,23,24 This consistency lends support to the relevance and generalizability of the results obtained.
Anthropometric measurements
Anthropometric measurements included standing height, seated height, BM, and body mass index (BMI) collected using standardized procedures with calibrated equipment. Standing and seated heights were measured to the nearest 0.1 cm using a stadiometer (The Leicester Height Measure, Tanita Corp., Japan), while BM was recorded to the nearest 0.1 kg using a clinical scale (Tanita UM-076, Tanita Corp., Japan) without footwear. BMI was calculated as BM (kg) divided by height squared (m²). Leg length (LL) was calculated as the difference between standing and seated heights.
Maturity status was estimated using the maturity offset (MO) method described by Mirwald et al., 13 which estimates year from PHV (Y-PHV) based on stature, seated height, LL, BM, and date of birth. Participants were categorized into three maturity stages: Pre-PHV (←1.0 years), Mid-PHV (−1.0 to 1.0 years) and Post-PHV (>1.0 years).
Sprint acceleration test
Sprint performance was measured over 10 m and 30 m using electronic timing gates (Witty Microgate, Bolzano, Italy). To evaluate sprinting abilities, each participant performed two maximal 30-m sprints, which also served for the determination of the F-v profile. All sprints were performed on a covered synthetic turf surface, with a standardized 15-min warm-up led by the team's strength and conditioning coach. A 5-min rest period was provided between trials to ensure adequate recovery. 25
The radar system (Stalker ATS II, TX) was positioned 5 m behind the starting line at a height of 1 m, approximating the participants’ center of mass, 26 and captured velocity-time data at a frequency of 46.9 Hz. To prevent the first timing gate from being triggered prematurely, players began their sprints from a position of 0.3 m behind the starting line. 27 Environmental conditions, including wind speed, air temperature and barometric pressure were measured with a weather station (Bresser, Germany) to standardize the testing environment and adjusted for aerodynamic drag forces. 15 The 10 m distance was chosen to represent the average sprint distance observed during rugby matches, 28 while the 30 m distance allowed for the assessment of maximal sprint speed 29 and conditions necessary for F-v profiling.
Data processing and analysis
The timing gates recorded sprint times for the 0-10 m (T10) and 0-30 m (T30) intervals to evaluate sprint performance. Separately, velocity-time data captured by the radar system were processed to derive mechanical parameters of the F-v relationship using the validated modeling method of Samozino et al. 21 Key variables included theoretical maximal horizontal force (F₀, N), maximal velocity (v₀, m.s−1), relative maximal peak power (Pmax, W·kg−1), the slope of the F-v relationship (SFV), and the maximum value of the ratio of force (RFmax). Force and power variables were also expressed relative to body mass to account for differences in body size.
Statistical analyses
The normality of the data distribution was assessed using the Shapiro-Wilk test, and the homogeneity of variances was verified with Levene's test, confirming that the data were normally distributed and suitable for parametric analyses.
For the primary analysis, a one-way analysis of variance ANOVA was conducted to identify differences in anthropometric and physical performance variables across age categories and playing positions. Post-hoc Tukey tests were performed to determine specific group differences, providing detailed pairwise comparisons between categories. Effect sizes (d, Cohen's d) and their 95% confidence intervals were calculated to quantify the magnitude and precision of between-group differences. These indices were reported in addition to p-values to improve the interpretability of the findings.
A decision tree analysis was used to identify discriminative variables and thresholds for classifying players by position. The Gini index was employed to measure the importance of each variable in the classification process. The model was validated using k-fold cross-validation (k = 10) to ensure robustness and minimize overfitting. This approach provided interpretable thresholds and rankings for the most impactful variables.
A feature importance analysis was performed to quantify the relative contribution of each anthropometric and physical performance variable to player classification. 30 A recurrence table was created to summarize the frequency with which variables were identified as key moderators across age categories, highlighting the most consistent indicators of positional specialization.
Additionally, radar plots were used to visualize the evolution of key discriminative variables across U14, U16, and U18. For each category, feature importance scores were extracted from the decision tree model, and variables were normalized using Min-Max Scaling to ensure comparison. This normalization was applied as follows:
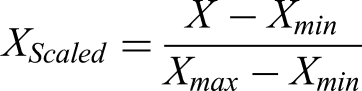
Radar plots were constructed using a polar coordinate system, where each axis represented a discriminative variable, and the plotted values corresponded to the normalized feature importance scores. Separate radar plots were generated for U14, U16, and U18, enabling a comparative analysis of anthropometric and physical performance attributes across age groups.
To systematically rank the most relevant discriminative variables, a point-based ranking system was implemented based on their recurrence and relative importance in the classification process. Variables that were identified as discriminative across all three age categories (U14, U16, and U18) were assigned 3 points, reflecting their consistency as key indicators of positional differentiation. Those that appeared in two age categories received 2 points, while variables that were only relevant in one age category were awarded 1 point. Additionally, a bonus point was granted to variables ranked among the Top 3 in feature importance for at least one age category, further emphasizing the most influential attributes in player classification. This ranking system provided a structured and objective approach for identifying the key variables that contribute most significantly to positional differentiation in youth rugby.
All statistical analyses were conducted using Python (version v2024.14.1), using Statsmodels for ANOVA and post-hoc tests, Scikit-learn for decision tree modeling and feature importance ranking, and Matplotlib for visualization. The significance threshold was set at p < 0.05.
Results
Anthropometric and sprint performance
Forwards displayed greater BM than backs in U14 (d =−0.94 [-1.46; −0.43], p < 0.001), U16 (d =−0.79 [-1.36; −0.21], p < 0.01), and U18 (d =−1.53 [-2.48; −0.59], p < 0.001) (Table 1). BMI showed a similar pattern, with large differences favoring forwards in U14 (d =−1.07 [-1.59; −0.54], p < 0.001), U16 (d =−0.98 [-1.57; −0.40], p < 0.001), and U18 (d =−1.96 [-2.96; −0.95], p < 0.001). Height was significantly greater in forwards at U16 (p < 0.05, d =−0.12 [-0.67; 0.44]) and U18 (p < 0.05, d =−0.53 [-1.37; 0.31]), but not at U14 (d =−0.65 [-1.15; −0.14], p > 0.05). Significant positional differences were observed for MO (p < 0.001) and Y-PHV (p < 0.05) at U14, while no differences were found in U16 or U18.
Descriptive statistics for anthropometric variables by poste and category.
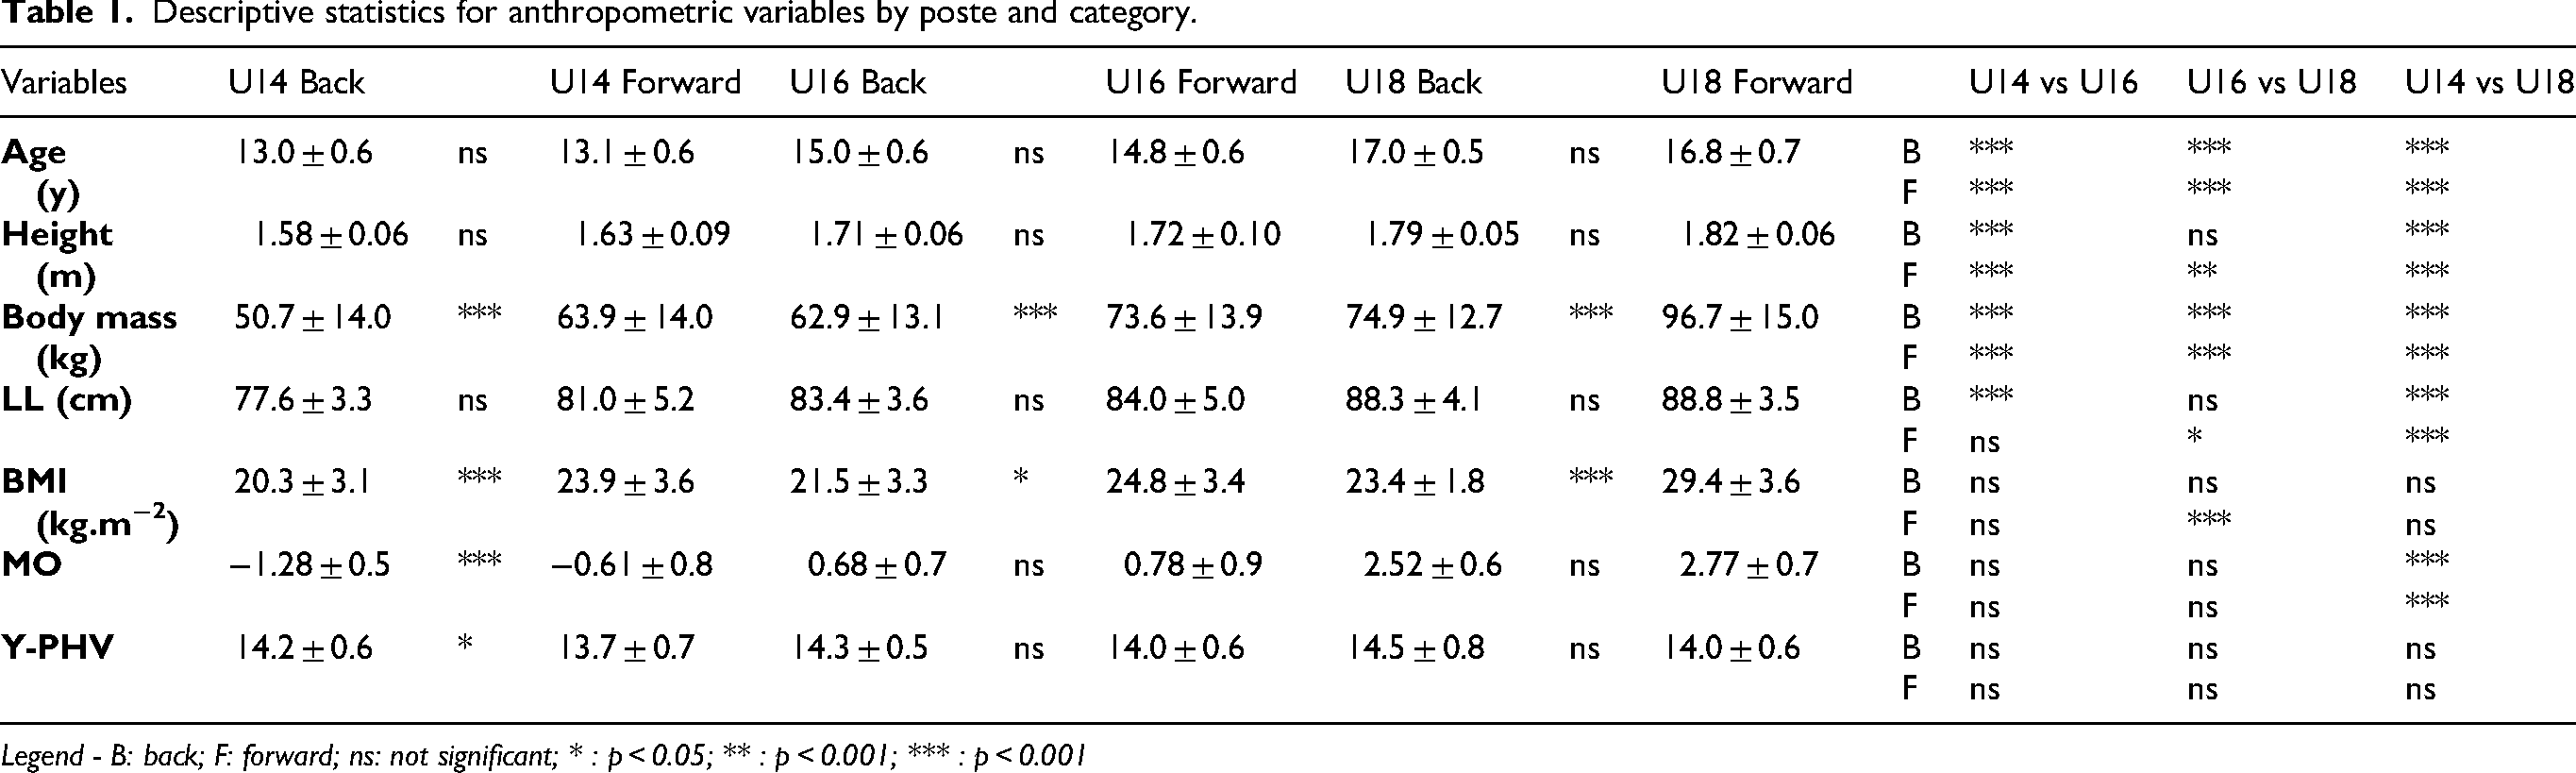
Legend - B: back; F: forward; ns: not significant; * : p < 0.05; ** : p < 0.001; *** : p < 0.001
Backs consistently outperformed forwards in sprint performance across all age groups (Table 2). T10 was significantly faster in backs in U14 (d =−0.48 [-0.98; 0.02], p < 0.001), U16 (d =−0.39 [-0.95; 0.18], p < 0.001), and U18 (d =−1.31 [-2.22; −0.40], p < 0.001). Similar differences were observed for T30, with backs achieving lower times in U14 (d =−0.58 [-1.08; −0.08], p < 0.001), U16 (d =−0.59 [-1.15; −0.02], p < 0.001), and U18 (d =−2.45 [-3.55; −1.36], p < 0.001). Vmax was also higher in backs, with moderate effects in U14 (d = 0.43 [-0.06; 0.93], p < 0.05) and U16 (d = 0.54 [-0.03; 1.10], p < 0.05), and a very large difference in U18 (d =−2.58 [-3.71; −1.45], p < 0.001).
Descriptive statistics for physical capabilities by poste and category.
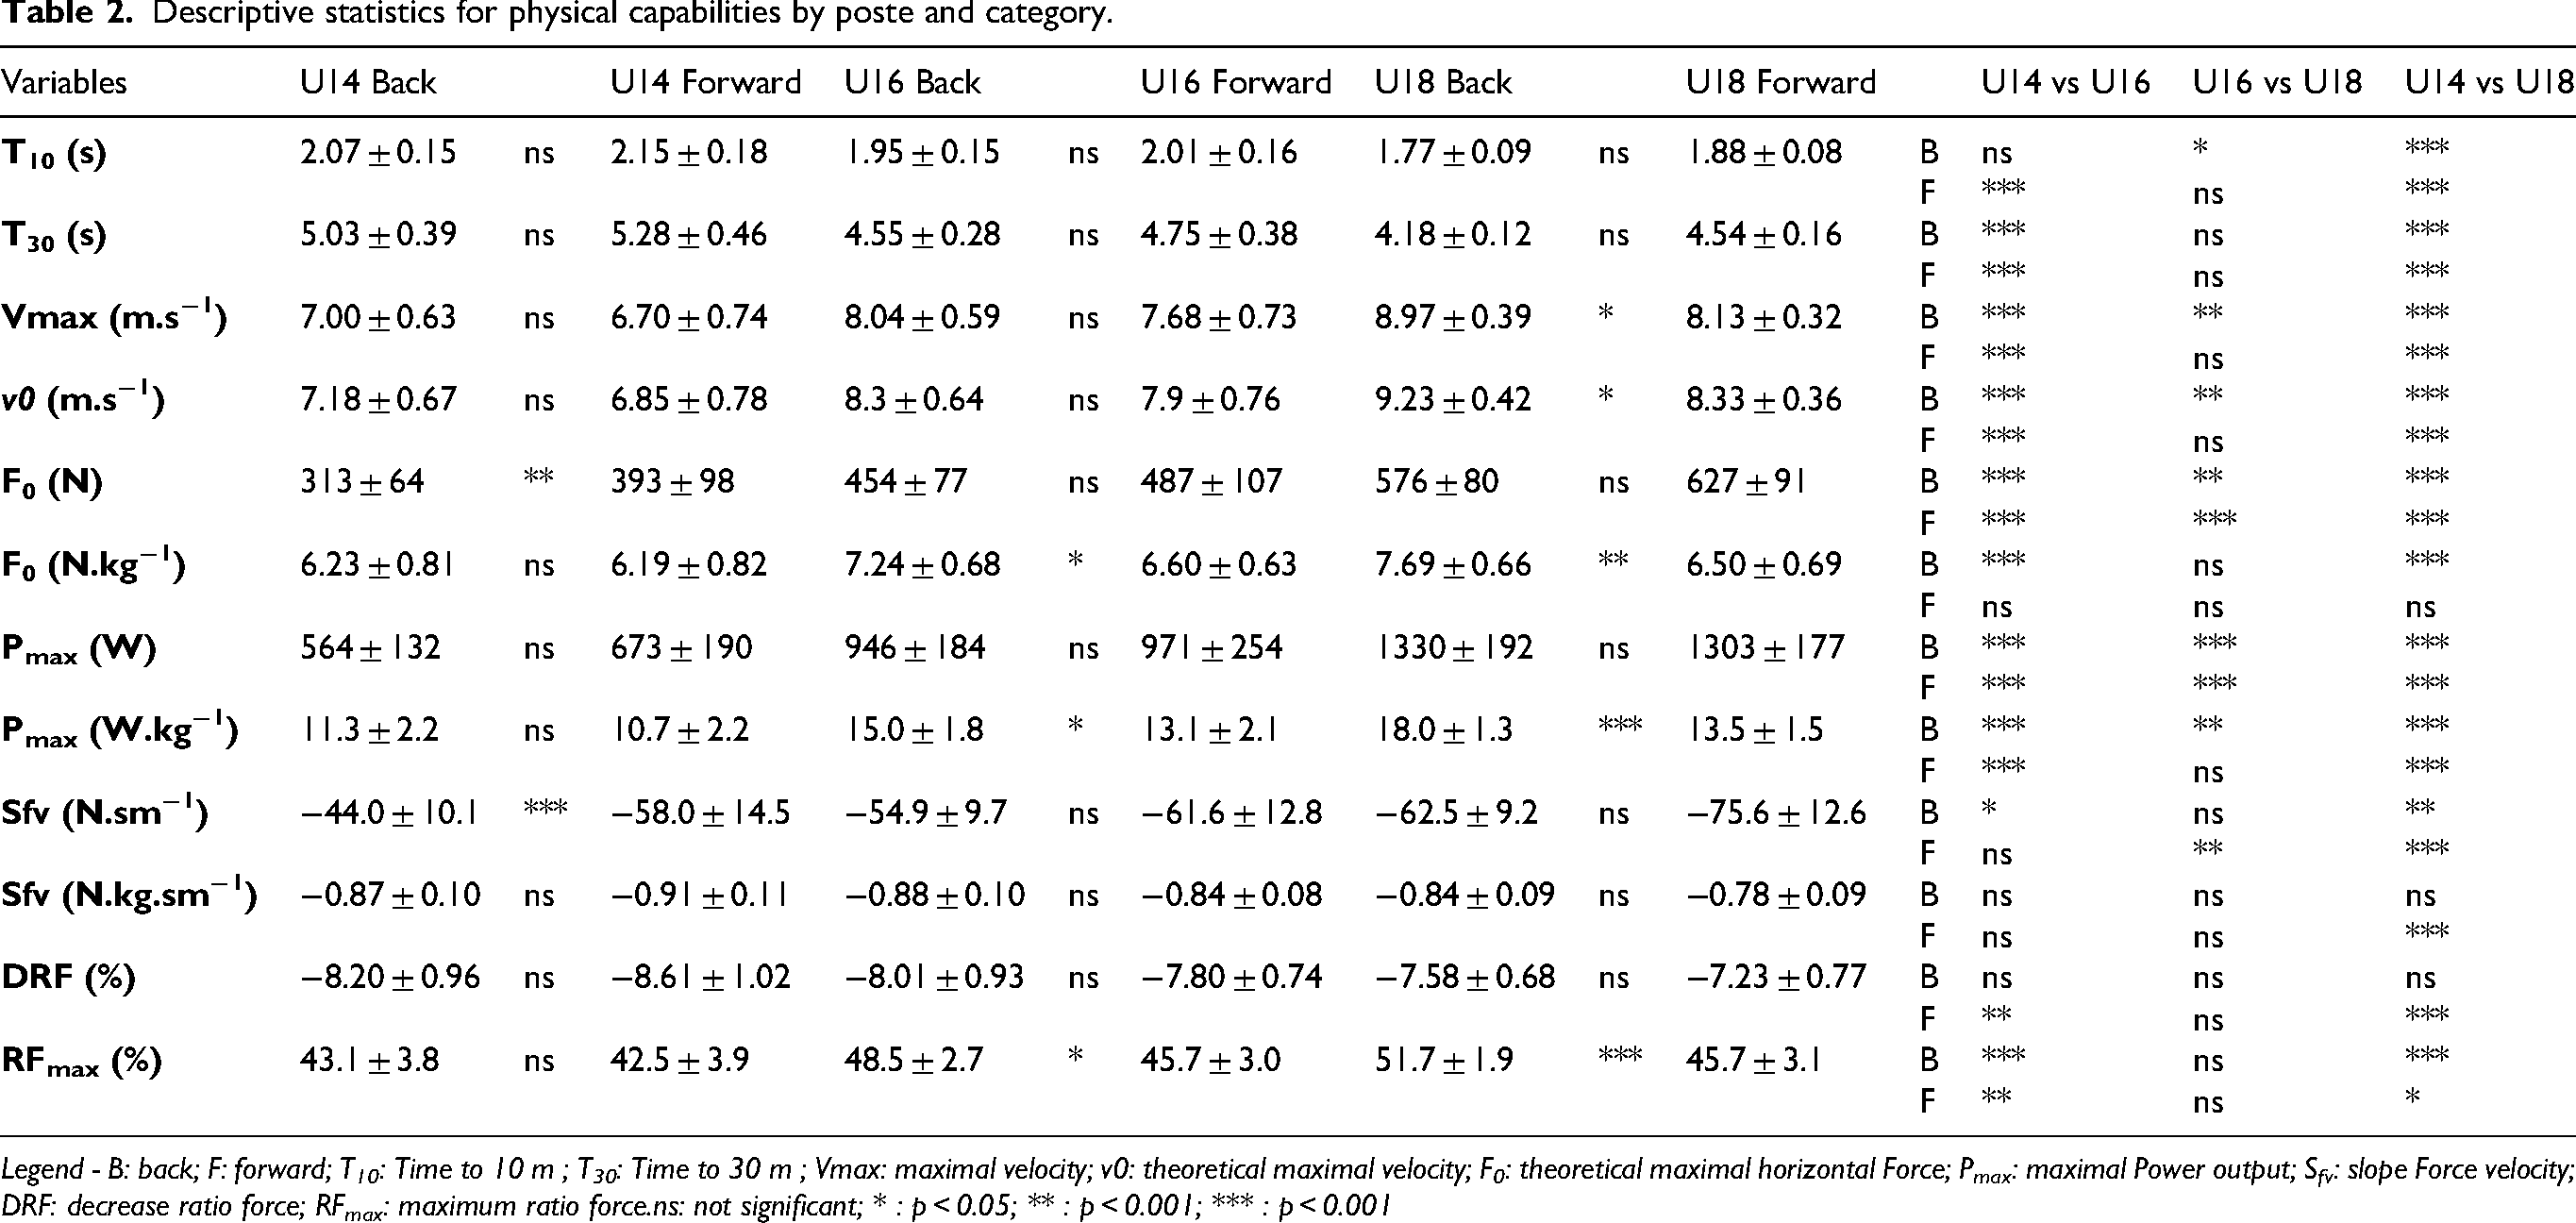
Legend - B: back; F: forward; T10: Time to 10 m ; T30: Time to 30 m ; Vmax: maximal velocity; v0: theoretical maximal velocity; F0: theoretical maximal horizontal Force; Pmax: maximal Power output; Sfv: slope Force velocity; DRF: decrease ratio force; RFmax: maximum ratio force.ns: not significant; * : p < 0.05; ** : p < 0.001; *** : p < 0.001
For F₀, forwards showed higher values in U14 (d =−0.95 [-1.47; −0.44], p < 0.001), with smaller differences in U16 (d =−0.35 [-0.90; 0.21], p < 0.05) and U18 (d =−0.58 [-1.43; 0.26], p < 0.05). Pmax showed small between-position differences in U14 (d =−0.66 [-1.16; −0.15], p < 0.05) and U16 (d =−0.11 [-0.67; 0.45], p > 0.05), and no meaningful difference in U18 (d = + 0.15 [-0.68; 0.98], p > 0.05). SFV values were higher in backs at all ages, with moderate to large effects (U14 d = + 1.10 [0.58; 1.62], p < 0.05; U16 d = + 0.57 [-0.01; 1.14], p < 0.05; U18 d = + 1.09 [0.25; 1.93], p < 0.01). RFmax was greater in backs in U16 (d = + 0.97 [0.39; 1.56], p < 0.01) and U18 (d = + 2.20 [1.15; 3.25], p < 0.001), with a trivial difference in U14 (d = + 0.16 [-0.34; 0.65], p > 0.05) Table 2.
Decision tree analysis
The decision tree analysis identified BMI as the primary discriminative variable for classifying players by position across all age categories (threshold = 23.81 kg.m−2, Figure 1). Players with BMI below this value were mainly classified as backs, while those above were classified as forwards. For players with BMI < 23.81 kg.m−2, MO and T10 sprint time contributed to further classification. Less mature players (lower MO) and those with faster T10 times were more frequently classified as backs. For players with BMI > 23.81 kg.m−2, classification was mainly influenced by T30 sprint time and height, with faster players and shorter stature more often classified as backs. In U18, absolute power (Pmax ≥ 829.4 W) and maximal force (F₀) were also important discriminative variables, mainly associated with forwards. These findings describe differences between players already assigned to their positions.

Decision tree for rugby player position (forwards vs backs).
Radar charts for feature importance
Radar plots (Figure 2) illustrate the relative contribution of anthropometric, sprint, and mechanical variables to positional differentiation in U14, U16, and U18 players. In U14, the most influential discriminative variables were primarily anthropometric, including BMI, BM, height, and Y-PHV, while sprint-related variables such as T10 and T30 showed lower importance values. In U16, the feature importance rankings indicated an increased contribution of performance-based variables. Although BMI remained among the most relevant anthropometric indicators, T10, T30, and F-v profile variables such as Pmax and F₀ displayed higher relative weights compared to U14. In U18, mechanical and power-related variables showed the highest feature importance, with Pmax, F₀, and SFV emerging as the strongest discriminators, whereas the contribution of anthropometric and maturation-related variables (e.g., BMI and Y-PHV) was reduced. The total number of discriminative variables decreased with age, from six in U14 (BMI, BM, height, Y-PHV, T10, T30) to four in U18 (Pmax, F₀, SFV, BMI) Figure 2.

Radar charts feature importance for U14, U16, and U18 rugby players. This figure illustrates the relative importance of anthropometric, physical performance, and maturation-related variables in distinguishing playing positions (forwards vs. backs) across the U14, U16, and U18 categories. T10: time to 10 m ; T30 : time to 30 m ; Vmax: maximal velocity; v0: theoretical maximal velocity; F0: theoretical maximal horizontal force ; Pmax: maximal power output; Sfv: slope force velocity; DRF: Decrease Ratio Force ; RFmax: Maximum Ratio Force); LL: Leg Length; BMI: body mass index; MO: maturity offset; Y-PHV: years from peak of height velocity; BM: body mass.
Recurrence analysis
The recurrence analysis (Figure 3) quantified the frequency with which each variable contributed to positional differentiation across the three age categories. BMI and BM were identified as recurrent discriminative factors in all categories and received the highest recurrence scores. Mechanical variables derived from the force-velocity profile, particularly SFV and Pmax (W.kg−1), were identified in two of the three categories, indicating a consistent contribution to positional classification. Sprint performance metrics (T10 and T30) appeared in multiple categories, highlighting their repeated role in distinguishing positions across developmental stages. In contrast, maturation-related variables such as Y-PHV and MO were less frequently observed, appearing mainly in younger players (U14).

Frequency of key variable importance across age categories (U14, U16, U18). T10: time to 10 m ; T30 : time to 30 m ; F0: theoretical maximal horizontal force ; Pmax: maximal power output; Sfv: slope force velocity; BMI: body mass index; MO: maturity offset; Y-PHV :years from peak of height velocity; BM: body mass.
Discussion
The findings of this study demonstrate the progressive shift in key discriminative variables influencing positional differentiation in youth rugby players across different age categories (U14, U16, and U18). Anthropometric characteristics were the most significant discriminators in the U14 and U16 categories, whereas physical performance variables became predominant in U18 players.
In the U14 category, the current findings show that anthropometric characteristics such as body mass (BM), body mass index (BMI), and predicted peak height velocity (PHV) emerged as the most relevant factors in distinguishing forwards from backs. The strong influence of PHV at this stage is consistent with previous research indicating that maturity status is a critical determinant of athletic performance in early adolescence. 13 This suggests that, at younger ages, biological growth rather than physical performance primarily dictates positional differentiation, as players undergo rapid changes in stature, body composition, and musculoskeletal development. 14 As players progress through age categories, positional differentiation appears to transition from this anthropometric-based model in U14 to a more performance-driven framework in U18, where speed, power, and force production become critical factors distinguishing roles on the field. This trend mirrors observations in other youth team sports such as football, where maturation heavily influences positional profiles during early adolescence, but is progressively supplanted by neuromuscular and technical performance markers as players approach elite levels.31,32
However, as players mature, the influence of PHV progressively declines, giving way to physical performance metrics such as sprint times (T10, T30) and F-v profiling variables (Pmax, F₀, SFV). This transition becomes particularly evident in U16 and U18, where Pmax emerges as a key factor for positional differentiation. This shift likely reflects neuromuscular adaptations and force development, which become increasingly critical in rugby, especially for backs relying on explosive speed and acceleration factors. The nature of key discriminative variables shifted from U14 to U18, 4 anthropometrics plus 2 performance variables to 4 performances plus 2 anthropometric variables, respectively, illustrating a progressive refinement of positional specialization with age.
Positional differentiation is further reinforced by the changing importance of force and power variables. While forwards consistently exhibit higher values of F₀ and Pmax, backs show a stronger reliance on relative power (W/kg) and sprint performance. These trends align with the positional demands of rugby, where forwards require greater absolute force for scrummaging, tackling, and rucking, while backs emphasize speed, agility, and acceleration for open-field play. 33
As players were already assigned to their positions by coaches before testing, the present results should be interpreted as descriptive of existing positional profiles rather than as determinants of positional allocation.
The observed evolution of discriminant variables also provides insights into the impact of long-term specialization and sustained participation in high-level rugby. The progressive transition from maturation-driven differentiation to performance-based specialization suggests that early PE models should prioritize biological maturity, while later assessments should integrate physical performance metrics to refine positional assignments. Additionally, these findings reflect the long-term adaptations of players who have remained in competitive rugby. The fact that players in this study continued their practice at a high level implies that those with favorable anthropometric and physical traits for their position were more likely to persist in the sport. 34 This aligns with previous studies highlighting the role of early specialization and physical development in long-term success in rugby.7,19
However, while specialization is a key component of high-performance development, it is crucial to ensure that positional assignments remain flexible during the early stages of growth. Given the variability in maturation rates and physical development, overly rigid specialization at young ages may limit player adaptability and long-term progression. Therefore, training programs should incorporate a balance between positional-specific skill development and a broad athletic foundation, allowing for progressive adaptation to the evolving physical and tactical demands of the sport. 35
This study focused on analyzing players already assigned to their respective positions, allowing for a direct comparison of the key discriminative variables between backs and forwards within each age category. Rather than exploring the position allocation process itself, our approach enabled the identification of the most influential anthropometric and physical performance variables differentiating playing positions across development stages.
This methodological choice is particularly relevant in high-performance contexts, where early position assignments are often based on physical attributes, tactical roles, and developmental trajectories. 36 The results highlight how these initial classifications are reinforced over time through progressive specialization and physiological adaptations, with an increasing emphasis on speed, power, and force production in older age categories.
These findings raise important questions regarding the impact of early position assignments on long-term development strategies. While larger and stronger players tend to be placed in forward positions at younger ages, it remains crucial to assess whether this approach maximizes overall player potential. Although this strategy aligns with immediate performance requirements, it could also influence the development of broader physical and technical attributes, potentially affecting future playing versatility and adaptability.
This study has been conducted on players who had already been assigned to their respective positions within competitive rugby structures. This means that the study is not implicated in the selection or classification process but examines more specifically the differences between players who have already been positioned as forwards or backs. This approach ensures that the results reflect the natural differentiation that occurs in environments where selection is based on a combination of physical attributes, tactical roles, and coaching decisions. By analyzing the characteristics of already classified players, this study allows us to identify the most relevant discriminative factors for positional specialization at different stages of development. Importantly, the current findings do not suggest that position allocation is pre-determined from an early age. While players are assigned to positions based on observable traits, their roles may continue to vary with respect to their physical development, skill acquisition, and tactical understanding of the game.
Several limitations must be acknowledged. First, the study employed a cross-sectional design, which restricts causal interpretation regarding the developmental evolution of discriminative variables. A longitudinal approach would be necessary to confirm whether the observed trends persist as players mature. Second, the sample was restricted to male athletes from a single elite academy, which may limit the generalizability of results to broader rugby populations, including female players or athletes from different competition levels. Third, while this research focused on physical and mechanical determinants, other key components of performance such as technical, tactical, and cognitive skills were not assessed but likely contribute to positional specialization.
Future research should aim to address these limitations by conducting long-term follow-ups to monitor changes in discriminative variables throughout the maturation process. Integrating technical and tactical assessments, as well as considering psychological and perceptual factors, would provide a more holistic understanding of player specialization and development. Expanding this approach to include female rugby players and different training environments could also enhance the applicability of the findings to the wider rugby community.
Conclusion and practical considerations
This study identified the key anthropometric and physical performance variables that differentiate forwards and backs across youth rugby age categories. The findings demonstrated a gradual shift from anthropometric dominance in younger players (U14-U16) to performance-based differentiation at U18, where mechanical and power-related variables such as Pmax, F₀, and SFV became the main discriminators. BMI and body mass (BM) remained consistent indicators across all age groups, highlighting their continued relevance in positional profiling.
These results emphasize that positional differentiation evolves progressively with player development, reflecting both physical growth and the increasing influence of performance capabilities.
From a practical perspective, these findings can inform PE and player development strategies in youth rugby. Coaches and strength & conditioning practitioners should account for biological development when assessing young players, ensuring that selection processes do not overemphasize body size at the expense of developing speed and power capacities. Training programs for younger categories (U14 and U16) should focus on fundamental movement skills, general strength, and sprint mechanics, while progressively integrating power- and velocity-oriented work in older players (U18). Continuous monitoring of force-velocity profiles can support individualized conditioning programs, helping players align their physical development with the positional demands of the game.
Implementing these strategies could improve long-term player development and optimize the transition from junior to senior performance levels.
Footnotes
Acknowledgements
The authors would like to express their sincere gratitude to the RCT Association and RCT SASP for their invaluable support and collaboration throughout this study. In addition, we would like to express our deepest gratitude to all the players who participated in the research for their commitment and enthusiasm. Their involvement was integral to the successful completion of this work.
Funding
The authors received no financial support for the research, authorship, and/or publication of this article.
Declaration of conflicting interests
The authors declared no potential conflicts of interest with respect to the research, authorship, and/or publication of this article.