
Abstract
In professional tennis, converting broadcast footage into tactical intelligence remains limited by labor-intensive manual logging and subjective observation. Automated methods still struggle with fine-grained stroke perception because of fast ball motion, occlusion, and broadcast variability. We present a video-based tactical intelligence pipeline that uses an ensemble YOLO detector (YOLOv8s + YOLOv10n) with weighted boxes fusion to identify six near-side semantic targets: tennis ball, player, forehand, backhand, ready position, and serve. From these detections, nine coach-interpretable indicators are derived across five tactical dimensions: hitting-type distribution, time-series rhythm, state transitions, serve initiative, and fatigue dynamics. The detector was trained on 14,892 annotated images from 360 competitive points across three court surfaces and achieved a test mAP@0.5 of 0.863, outperforming the individual YOLO models (+7.5%), Faster R-CNN, and DETR. Rally-level analysis of 36 ATP players from the 2025 Rome Masters, Shanghai Masters, and Wimbledon Championships, grouped into elite, mid-level, and lower-ranked tiers (n = 12 per tier), revealed consistent tier differentiation across all indicators (all p < 0.001, Cohen's d > 2.5) and clear surface-related variation in stroke selection and serve initiative. Expert validation showed strong agreement between AI-derived and coach-annotated indicators (ICC > 0.85). The main contribution is the integrated detection-to-indicator framework. The ensemble detector is a practical engineering solution rather than a methodological advance. Current limitations include near-side-only analysis, single-view broadcast input, and a moderately sized dataset.
Introduction
Post-match review and pre-match scouting have long been considered essential components of competitive tennis preparation, as they enable coaches and players to identify habitual patterns in an opponent's game, such as serve placement tendencies, rally construction preferences, and decision-making behaviour under pressure.1,2 Despite their importance, transforming raw match footage into meaningful tactical insights remains a labour-intensive process. Conventional approaches typically depend on manual notational analysis, subjective expert observation, and fragmented statistical summaries, all of which are time-consuming, inconsistent across analysts, and difficult to scale when coaches require timely feedback across multiple opponents and match contexts.3,4 These practical limitations highlight the central problem motivating this study: how to develop a systematic, data-driven framework capable of automatically extracting tactical semantics from match videos to support efficient tactical skill analysis and informed decision-making.
Over the past decade, tennis analytics research has progressed along several complementary directions. Empirical studies have examined match-type characterization through performance indicators such as serve effectiveness, rally length distributions, and point-winning probabilities across different court surfaces.5,6 Systematic reviews have synthesized findings on tactical skill development, including anticipation, situational awareness, and strategic knowledge acquisition at varying competitive levels.3,7 Concurrently, machine learning has enabled novel tennis applications ranging from match outcome prediction and talent identification to spatial pattern recognition. 4 On the computer vision front, specialized algorithms have been developed for tracking small high-speed objects like tennis balls and for estimating court geometry through homography-based registration.8–11 More recent work in sports video analysis has moved toward integrated pipelines that combine multi-object tracking, ball trajectory modeling, and pose-based action recognition within a unified framework, as demonstrated in soccer and badminton analytics.9,12 Self-supervised and multimodal approaches, such as contrastive learning from unlabeled video and joint audio-visual event detection, have also emerged as promising directions for reducing annotation costs and improving generalization in sports domains.13,14 Despite these advances, individual approaches tend to address isolated subtasks rather than providing an integrated representation that connects observable events with their tactical significance. In practice, tactical analysis demands the fusion of player positioning, ball trajectory, court geometry, and stroke semantics into a coherent framework, yet existing pipelines exhibit gaps in semantic completeness, generalizability across broadcast conditions, and accessibility for coaching workflows.1,15
The emergence of deep learning has reshaped sports performance analysis by enabling automated extraction of fine-grained spatio-temporal information from video at scale. 15 End-to-end architectures combining object detection, multi-object tracking, and court registration have demonstrated feasibility in related domains where large annotated datasets and benchmark challenges have accelerated progress.9,12 For tennis, however, a critical gap persists: beyond constructing accurate perception modules, there remains a need for a framework that (a) operationalizes tactics into structured semantic categories amenable to quantitative analysis, (b) derives interpretable indicators linking these semantics to coaching-relevant constructs, and (c) maintains robustness under realistic broadcast conditions, varying camera angles, partial occlusions, and lighting variability, while remaining practical for coaching integration. 4 Existing tactical semantics in tennis are largely defined through coaching heuristics (e.g., offensive/neutral/defensive phases) rather than formal computational models; bridging this gap requires connecting domain-specific coaching theory with quantitative indicator frameworks grounded in observable match events. A further challenge is domain shift: models trained on one broadcast environment may not generalize well to other venues due to differences in camera placement, production style, and lighting conditions, an issue that has received limited attention in the tennis analytics literature.
In this study, we present a video-based tactical intelligence framework for tennis, organized as a modular pipeline from raw match footage to quantitative tactical performance indicators. By coupling fine-grained visual perception with domain-specific tactical computation, the framework enables systematic analysis of near-side player behavior from broadcast-style video data. The perception module detects six action-relevant categories, namely Tennis Ball (Te), Player (Pl), Forehand Shot (FS), Backhand Shot (BS), Ready Position (RP), and Serve (Sv), and the resulting detections are further used for indicator extraction and tactical pattern analysis. An ensemble detection scheme combining YOLOv8s, YOLOv10n, and Weighted Boxes Fusion is employed to improve detection robustness for downstream tasks. This framework offers a practical pathway toward automated, interpretable, and scalable tennis tactical analysis.
Datasets and methods
The workflow of this research
The overall workflow of this study is illustrated in Figure 1 and consists of four sequential modules. First, raw broadcast match videos were manually annotated using six near-side semantic categories, including Tennis Ball (Te), Player (Pl), Forehand Shot (FS), Backhand Shot (BS), Ready Position (RP), and Serve (Sv). Only the player located closer to the broadcast camera was labeled, whereas the far-side opponent was excluded because the image resolution was insufficient for reliable stroke classification. In parallel, each match was segmented into individual rally clips, with each clip corresponding to a single point and labeled as won or lost. Second, the annotated images were used to train two complementary detection models, YOLOv8s and YOLOv10n, and their predictions were fused using Weighted Boxes Fusion to improve detection robustness across the six target categories. Third, the frame-level detection results were converted into nine coach-interpretable tactical indicators spanning five dimensions, namely hitting-type distribution (FBR, STE), time-series rhythm (ART), state transitions (ATM, ODTR), serve initiative (FSFAS, SPOE), and fatigue dynamics (SFDR, RSRT). Finally, the rally-level indicators were aggregated across matches and match phases to generate player-level tactical profiles and to support comparative analyses across competitive tiers (elite, mid-level, and lower-ranked) and court surfaces (clay, hard, and grass).

The workflow diagram of this research.
Dataset construction
YOLO model training dataset
The data for this study were sourced from publicly available professional tennis match videos (ATP/WTA Tour). We selected 360 point videos, encompassing hard courts (120), clay courts (120), and grass courts (120). Through key frame extraction, a total of 14,892 images were ultimately obtained for annotation. Given that the camera in the videos is positioned behind one player, facing vertically towards the center net, it provides a clear view of the half court nearest to the camera. Therefore, only the objects within this half court were annotated, including six categories (Te, Pl, BS, FS, RP, Sv).
Six object categories were defined for annotation based on tennis match analysis requirements. The ball class captures the tennis ball when visible within the frame, annotated with the minimum enclosing rectangle around the spherical object. The player class identifies the near-court athlete with a bounding box encompassing the full body from head to feet. For stroke action recognition, we defined four mutually exclusive action states: Forehand_shot and Backhand_shot represent the respective groundstroke executions, annotated with bounding boxes covering the upper body including the racket-holding arm during the hitting phase; Ready_position denotes the split-step waiting stance between strokes, with annotations covering the player's full body; and Serve captures the complete service motion sequence, annotated to include both the player's full body and the racket trajectory throughout the serving action.
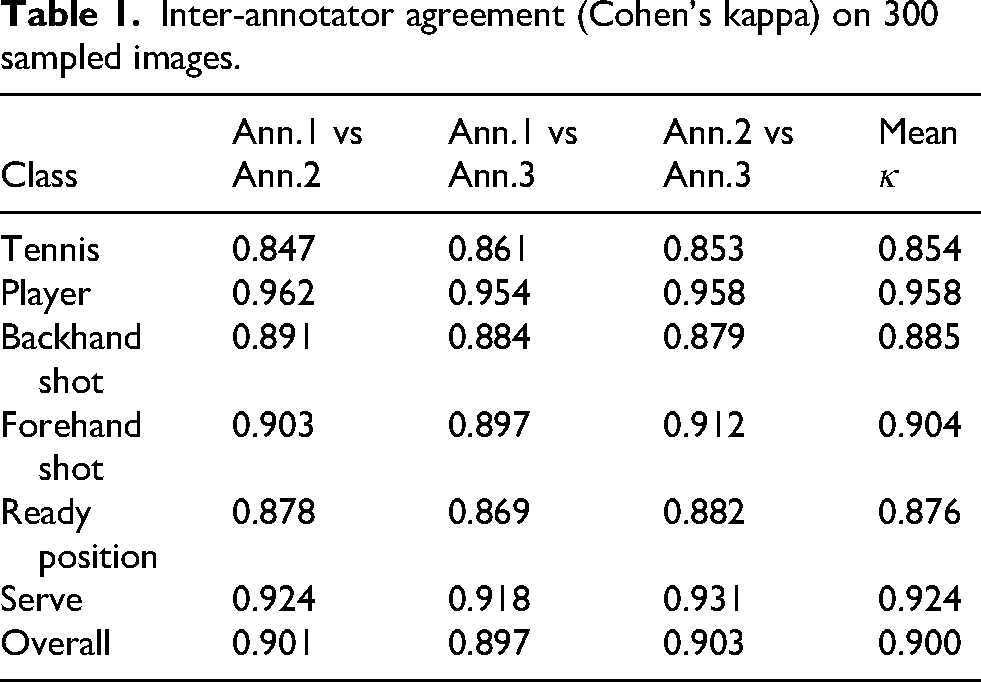
To ensure annotation reliability, we implemented strict annotation quality control. A subset of 300 images was randomly sampled from the expanded dataset of 14,892 images, and three trained annotators independently labeled all six object categories. Inter-annotator agreement was evaluated using Cohen's Kappa coefficient (κ). As shown in Table 1, all classes achieved “Almost Perfect” agreement levels (κ > 0.81) according to the Landis and Koch interpretation guidelines. The Player class exhibited the highest consistency (mean κ = 0.958), attributed to its distinct visual features and larger bounding box area. The Ball class showed relatively lower but still excellent agreement (mean κ = 0.854), which can be attributed to challenges in detecting small, fast-moving objects, particularly during motion blur situations. Action classes including Backhand_shot, Forehand_shot, Ready_position, and Serve demonstrated consistent agreement levels ranging from 0.876 to 0.924, indicating that the annotation criteria for distinguishing between different stroke phases and states were well-defined and reproducible across annotators. The overall inter-annotator agreement of κ = 0.900 confirms the high quality and reliability of our annotation protocol.
Inter-annotator agreement (Cohen's kappa) on 300 sampled images.
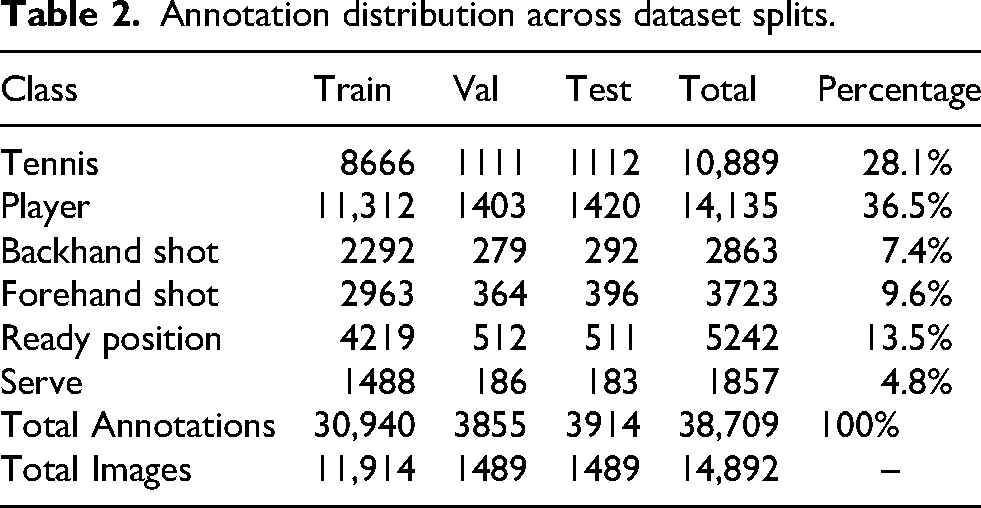
The final dataset comprises 14,892 annotated images extracted from 360 competitive points across three court surface types: hard court (120 points), clay court (120 points), and grass court (120 points). Key frames were extracted at critical moments during each point, yielding an average of 41.4 images per point. Notably, clay court matches produced the highest frame count (45.1 images/point) due to the characteristically longer rallies on this surface, while grass court matches yielded fewer frames (37.1 images/point), reflecting the faster-paced play. The dataset contains 38,709 total annotations distributed across six classes: Player (36.5%), Tennis (28.1%), Ready position (13.5%), Forehand shot (9.6%), Backhand shot (7.4%), and Serve (4.8%). This distribution reflects realistic match dynamics, where player instances and ball appearances are most frequent, ready positions occur regularly between strokes, forehand shots are more common than backhand shots, and serve events are naturally limited to point initiations. The dataset was partitioned into training (80.0%, 11,914 images), validation (10.0%, 1489 images), and test (10.0%, 1489 images) sets with stratified sampling to maintain consistent class distributions across splits, as shown in Table 2.
Annotation distribution across dataset splits.
To assess dataset sufficiency, we performed a learning curve analysis by training the ensemble model on 50%, 75%, and 100% of the training data (mAP@0.5: 0.838, 0.856, 0.863), which showed convergence behavior. Five-fold cross-validation yielded a mean mAP@0.5 of 0.858 ± 0.007. While these results suggest adequate training signal for the current six-category task, we acknowledge that the dataset scale remains moderate, and expanding it to encompass a wider range of tournaments, broadcast formats, and player demographics would further strengthen generalizability.
Tactical analysis dataset
For the tactical analysis, we curated match video data from three major 2025 ATP events played on different court surfaces: the Rome Masters (outdoor clay), the Shanghai Masters (outdoor hard court), and the Wimbledon Championships (outdoor grass). From each tournament, twelve players representing distinct ranking tiers were selected: four ranked within the ATP Top 1–16 (Elite), four ranked 30–60 (Mid-level), and four ranked 80 and above (Lower-ranked), yielding a total of 36 players (12 per tier). For each athlete, we extracted the full video of their final match in the event, yielding a representative sample of competitive play across skill levels.
To facilitate fine-grained behavioral analysis, each match video was further segmented into individual scoring rallies, defined as discrete sequences of play culminating in a point being won or lost. For every rally clip, we recorded whether the near-side player won or lost the point (“1” or “0”). This labeled rally dataset served as the unit of analysis for subsequent tactical indicator computation. By organizing the data at the rally level with associated point outcome labels, we enabled a granular, point-by-point examination of player behavior that underpins the computation of performance metrics in this study.
Ensemble detection framework
The first step in the methodological framework involved identifying base detection models capable of providing complementary performance characteristics in the context of tennis-specific object detection. To this end, we systematically evaluated 6 YOLO model variants, including YOLOv8n/s, 16 YOLOv10n/s, 17 and YOLOv12n/s, 18 under identical training and evaluation protocols. These models were chosen because of their proven efficiency in real-time object detection tasks and their architectural diversity, which enhances the effectiveness of subsequent ensemble fusion.
All models were initialized with COCO pre-trained weights to leverage rich visual representations learned from large-scale datasets. Fine-tuning was then performed on the tennis-specific dataset. The input image resolution was standardized at 640 × 640 pixels to balance accuracy and computational load. Training was conducted with a batch size of 16 using the AdamW optimizer, with an initial learning rate of 0.001 and a cosine annealing schedule over 100 epochs. Data augmentation techniques-including Mosaic, Mixup, horizontal flipping, and color jittering-were applied to increase generalization capacity and simulate variability encountered in broadcast tennis footage. Automatic mixed precision was employed during training to improve computational efficiency without compromising numerical stability. All training and evaluation experiments were conducted on NVIDIA RTX 4090 GPU.
The Weighted Boxes Fusion strategy aggregates predictions through confidence-weighted coordinate averaging. For overlapping box clusters (IoU> 0.5), the algorithm computes weighted averages where each box's contribution is proportional to its confidence score, preserving complementary spatial and confidence information from both architectures. In the fusion configuration, YOLOv8s and YOLOv10n were assigned weight coefficients of 0.55 and 0.45, respectively, based on their relative mAP@0.5 performance on the validation set. The IoU threshold for box clustering was set to 0.5, and the confidence threshold for filtering was set to 0.01.
Tactical indicator extraction framework
Hitting type distribution index
The forehand backhand ratio (FBR) is defined as:
Shot type entropy (STE) is used to quantify the diversity and balance of a player's use of action types such as forehand, backhand and serve in the game. The higher the entropy value, the richer the shot selection and the more difficult to predict (more comprehensive). The lower the entropy value, the more concentrated the shot type and the more single playing method.
20
Here, it is defined as:
Time series mode index
Average ready time (ART) is defined as: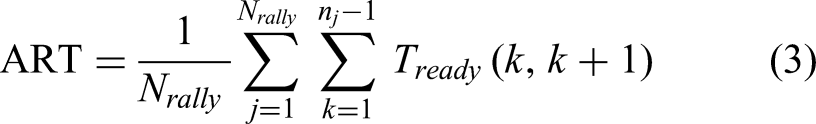
State transition indicator
Let S = {FS, BS, RP, Sv} denote the set of discrete action states assigned to the near-side player at each frame. The Action Transition Matrix (ATM) is a |S| × |S| matrix where each entry ATMi,j = P(St + 1 = j|St = i) represents the conditional probability of transitioning from state i to state j on consecutive action segments. Transition probabilities are estimated by maximum likelihood: ATMi,j = ni→j/Σ
k
(ni→k), where ni→j} is the observed count of state i followed by state j across all rally sequences in a match. In tennis coaching theory, play is commonly broken into offensive, neutral, and defensive phases.
22
The ATM provides a quantitative Markov representation of how players move between these tactical states:
In addition, the first-order Markov assumption is a simplification of tennis rally dynamics, which involve strategic planning and context-dependent decisions. Comparative analysis of first-, second-, and third-order Markov models (Supplementary Figure S1a) showed the second-order model provided modestly improved prediction accuracy (0.748 vs. 0.721) and lower BIC (3724 vs. 3780), while the third-order model overfitted (BIC: 3820). The first-order model was retained for parsimony and interpretability.
Offense defense transition rate (ODTR), a specific metric derived from the ATM focusing on how frequently a player switches between offensive and defensive roles.
24
Specifically, ODTR was computed from YOLO-derived ready→stroke events. Each frame was processed to detect the action state St∈{ready, forehand, backhand, serve} together with the bounding boxes of the ball and player. After short-term temporal smoothing and segment merging, we extracted the n-th ready→stroke event en and defined its stroke type an∈{FS, BS}. Ball speed 

Service related indicators
First stroke forehand after serve (FSFAS) is used to quantify the server's propensity to actively seek and continue an attack with a forehand shot during the “serve+1” (third stroke) phase, reflecting their tactical approach of gaining early control of the rally's rhythm by leveraging forehand advantages.
25
Specifically, the FSFAS quantifies the propensity of the near-court player to execute a forehand as the first post-serve stroke (i.e., the “serve+1” stroke). Let 
Serve plus one efficiency (SPOE) is used to evaluate the ability of the server to transform the service advantage into instant suppression (or even quick end of the round) in the key window of “serve+1”.
26
For each valid service point where a “+1” stroke occurs, define if the point terminates in favor of the server at or before the completion of the server's first post-serve stroke (i.e., the rally ends immediately after the “+1” shot. Let 
Fatigue and rhythm index
Stroke frequency decay rate (SFDR) quantifies the relative change in the player's stroke production rate across match progression. For each set i, the average stroke frequency is defined as:

SFDR pacing by capturing whether the player's capacity to sustain repeated high-intensity actions across sets declines, which aligns with evidence that prolonged tennis match-play induces progressive physiological/neuromuscular fatigue and alters performance-related outputs.27,28
Ready state ratio trend (RSRT) characterizes how the proportion of time that the player remains in a “ready” posture evolves over the course of a match, based on YOLO frame-wise action labels. For each temporal window of duration t (sliding), RSRT is defined as:
RSRT is meaningful in tennis because the “ready/split-step” preparation phase is a key determinant of subsequent movement initiation and response speed; tracking its time proportion can therefore reflect how players regulate readiness and recovery demands as match constraints evolve.29,30
Results and analysis
YOLO models performance
To enable fine-grained automatic perception of the near-court player's stroke actions and states in broadcast tennis videos, this study targeted six categories (Te, Pl, FS, BS, Sv, and RP) and conducted a systematic evaluation of multiple YOLO variants on a unified test set. Detection performance was assessed using mAP@0.5 and the more stringent mAP@0.5:0.95 to jointly capture localization and classification quality, complemented by Precision, Recall, and F1-score to characterize the trade-off between false positives and missed detections, an essential consideration for downstream tactical statistics. As shown in Table 3, the tested models exhibited interpretable differences across scales and architectural generations. Lightweight nano variants offered lower parameter overhead (3.4–4.2 M) but were more prone to missed detections under challenging conditions such as complex backgrounds, fast motion, and pose variation. Among the nano models, YOLOv10n achieved the highest mAP@0.5 (0.802), slightly outperforming YOLOv8s (0.798) despite having fewer parameters (3.8 M vs. 6.6 M), likely reflecting YOLOv10's more efficient feature aggregation for small-object detection, a relevant strength given that the tennis ball constitutes 28.1% of all annotations and remains the most challenging target. Mid-sized small variants (v8s, v10s, v12s) achieved a more balanced performance, with YOLOv8s and YOLOv10s showing notable complementary strengths in precision (0.876) and recall (0.798), respectively.
Performance comparison of YOLO variants on test set.
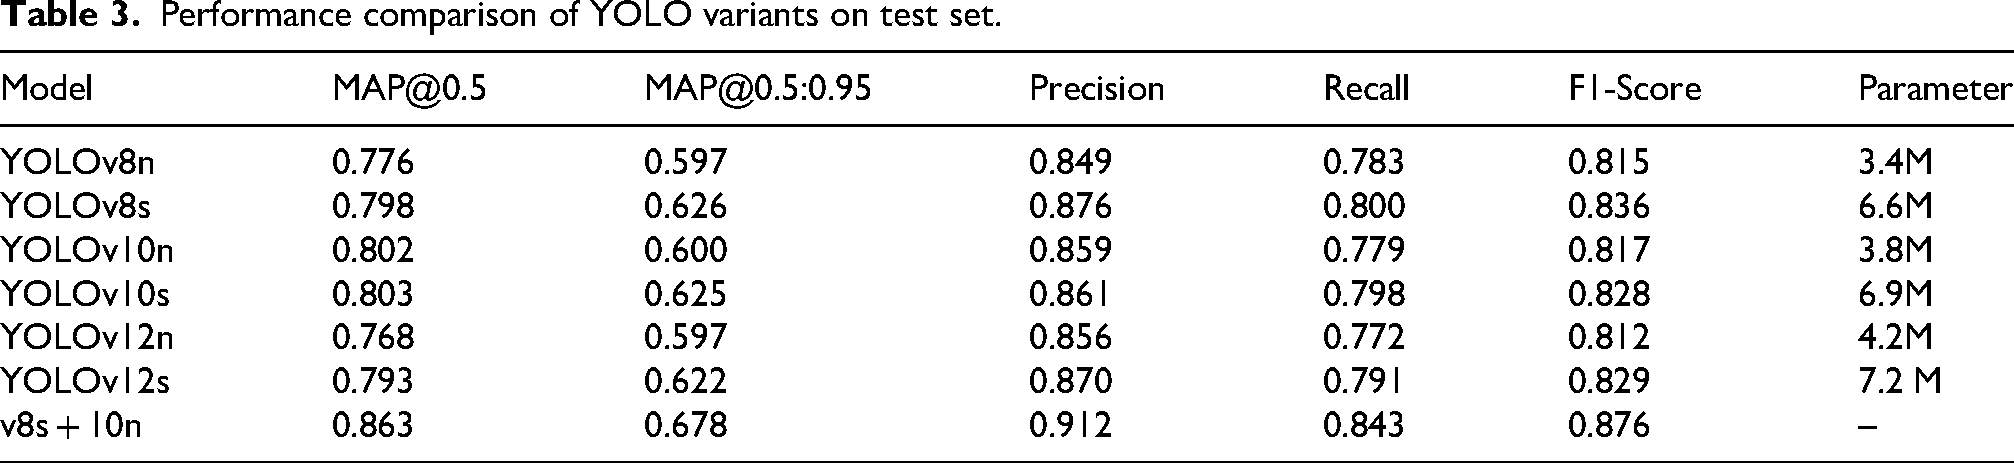
Leveraging this complementary behavior, we employed a YOLOv8s + YOLOv10n (v8s + v10n) weighted fusion strategy via Weighted Boxes Fusion to reduce single-model bias toward specific scenes and classes. YOLOv8s contributes higher precision and more stable localization for action categories, while YOLOv10n provides superior sensitivity to the small, fast-moving tennis ball. The fused detector achieved an mAP@0.5 of 0.863, with concurrent gains in mAP@0.5:0.95 (0.678), Precision (0.912), Recall (0.843), and F1-score (0.876). These improvements over the best individual model (+7.6% mAP@0.5 relative to YOLOv10n) suggest that the performance gain reflects genuinely more coherent multi-scale representations rather than incidental threshold effects, providing a reliable detection foundation for rally-level tactical analysis.
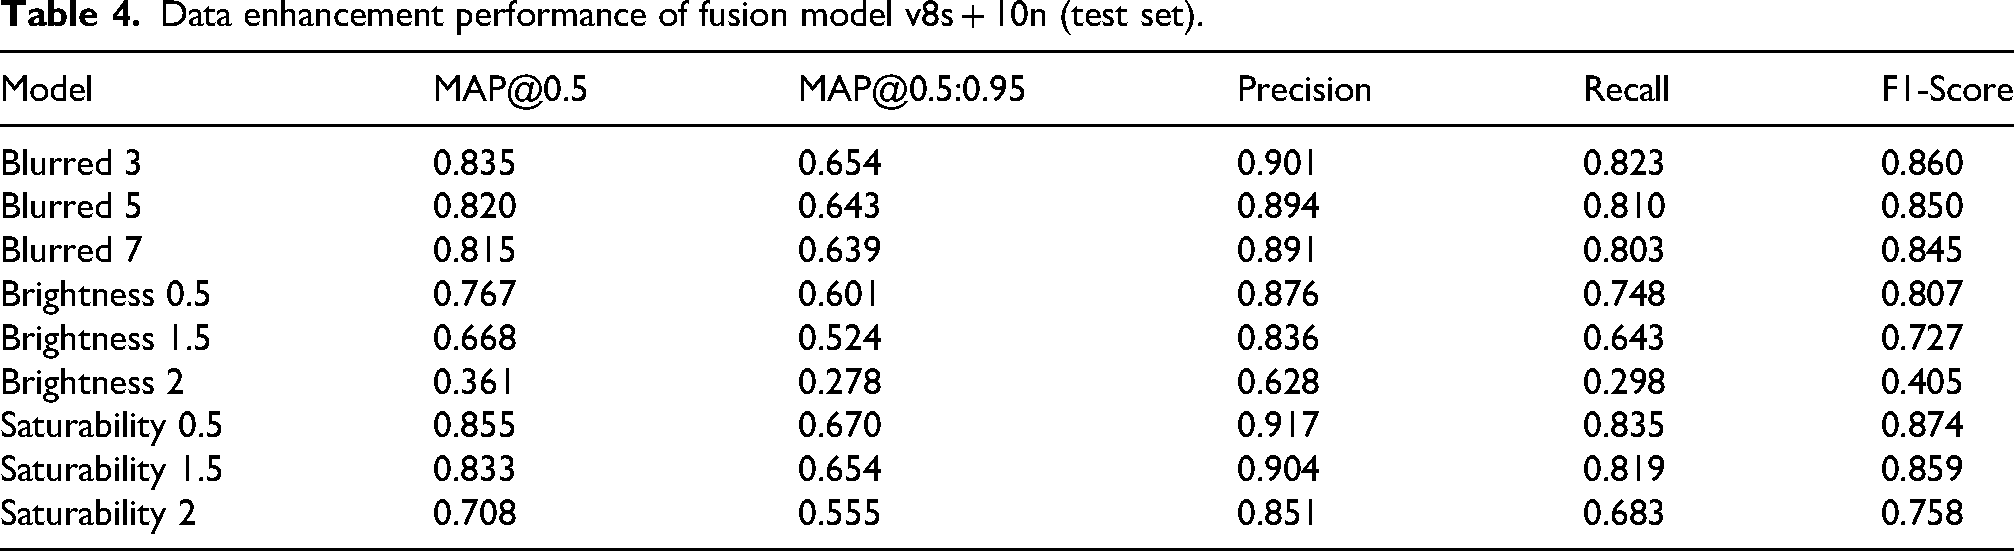
To evaluate the practical usability of the fused detector in real-world tennis footage, we conducted robustness tests under the most common imaging perturbations observed in broadcast scenarios, including varying degrees of Gaussian blur (to emulate high-speed motion and mild defocus), brightness scaling (to reflect backlighting, shadows, and exposure fluctuations), and saturation shifts (to account for camera/viewpoint differences and white-balance variation), as shown in Figure 2. As shown in Table 4, relative to the baseline performance on the unperturbed test set (mAP@0.5 = 0.863), detection quality remained high under mild-to-moderate blur and saturation perturbations (e.g., mAP@0.5 = 0.855 at γ = 0.5 and 0.835 at k = 3), indicating good tolerance to motion-induced blur and color variability typical of tennis broadcasts. The expanded training set, which spans hard, clay, and grass courts with inherently different lighting and color profiles, likely contributed to the improved saturation tolerance compared to single-surface training. By contrast, performance deteriorated sharply under severe brightness perturbation (mAP@0.5 decreased to 0.361 at β = 2.0), confirming that extreme overexposure remains a primary challenge. This is expected, as brightness saturation destroys the pixel-level contrast on which both ball detection and stroke-phase classification depend. Overall, within the perturbation ranges consistent with typical match recording conditions (k ≤ 5, 0.5 ≤ β ≤ 1.5, 0.5 ≤ γ ≤ 1.5), the proposed model maintains mAP@0.5 above 0.80, providing reliable inputs for subsequent vision-based tactical analysis.
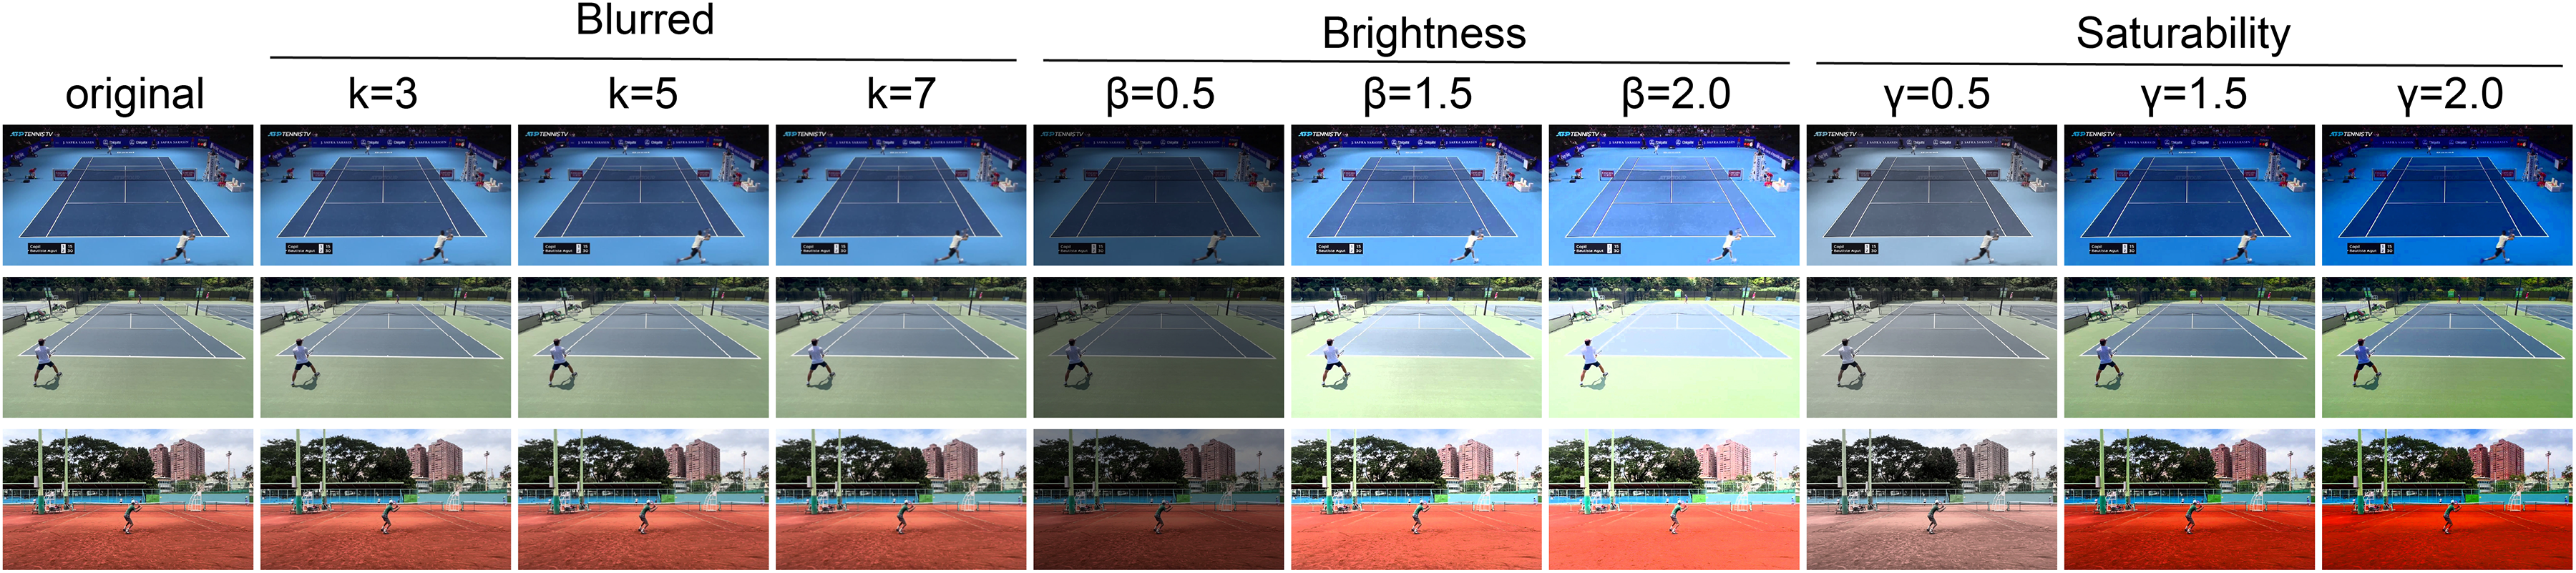
Data enhancement styles that simulate real scenes.
Data enhancement performance of fusion model v8s + 10n (test set).
Beyond synthetic perturbations, we further evaluated robustness under realistic camera behavior conditions encountered in broadcast footage (Supplementary Figure S2a). Performance remained stable during steady wide-angle shots (mAP@0.5 = 0.870) and slow panning (0.858), both of which characterize the majority of rally-phase footage. However, detection quality declined during fast camera tracking (0.798, −7.5%) and zoom transitions (0.782, −9.4%), where rapid changes in scale and framing reduce the temporal consistency of bounding box predictions. Replay cuts produced the sharpest decline (0.721, −16.5%), as abrupt scene changes introduce transient frames with atypical viewpoints and graphic overlays. These results indicate that the detection pipeline maintains adequate performance (mAP@0.5 > 0.78) under the camera behaviors that account for the large majority of match footage, while camera transitions and replay segments, which are typically excluded during rally segmentation, represent a secondary degradation factor rather than a systematic threat to tactical indicator computation.
To contextualize detection performance, we compared the proposed ensemble against four alternative methods (Supplementary Table S1; Supplementary Figure S2b). The ensemble achieved the highest mAP@0.5 (0.863), outperforming the best single model (YOLOv10s, 0.803) by 7.5%, as well as Faster R-CNN (0.774) and DETR (0.787), which were limited by imprecise small-object proposals and slower convergence on moderately sized datasets, respectively.
To identify systematic detection weaknesses, we categorized all errors by failure scenario (Supplementary Figure S2c, d). The most prevalent failure modes were small or distant ball detection (18.4% miss rate), camera transitions (14.8%), and partial occlusion (11.5%). Action misclassification was highest between forehand and backhand strokes (4.8%), concentrated in the ambiguous racket preparation phase where the two strokes share similar initial postures. A 5-frame temporal smoothing window was adopted to suppress frame-level classification flicker (Supplementary Figure S2e), yielding an action classification accuracy of 0.917 with a temporal lag of 0.17 s.
Hitting type distribution analysis
Using the proposed framework, we analyzed hitting-type patterns in 36 players, with 12 players in each tier from the Rome Masters, Shanghai Masters, and Wimbledon Championships. As shown in Figure 3(a), elite players showed a lower forehand proportion and a higher backhand contribution than lower-ranked players, while serve proportion remained similar across tiers. This pattern was also reflected in the forehand-to-backhand ratio, where the elite group was closest to the balanced reference line of 0.5 and the lower-ranked showed the highest FBR (Figure 3(b)). These results suggest that higher-level players rely less on one dominant side and use forehand and backhand more evenly during rallies. Shot-type entropy followed the same tiered pattern, with the elite group showing the highest values and the lower-ranked the lowest (Figure 3(c)), indicating that stronger players used a broader and less predictable mix of actions. This pattern matches the demands of high-level tennis, where rally control depends on both stroke quality and flexible shot selection across changing match situations.

Hitting-type distribution analysis across competitive tiers. (a) Mean shot-type composition for elite, mid-level, and lower-ranked players, showing the proportions of forehand, backhand, and serve events. (b) Boxplots of forehand-to-backhand ratio (FBR) across tiers; the dotted line marks FBR = 0.5. (c) Boxplots of shot-type entropy (STE) across tiers. (d) Correlation between FBR and STE for all players; colors indicate tier and marker shapes indicate surface. (e) Radar plot of normalized tactical indicators across tiers, including STE, win percentage, serve percentage, rally length, and balanced FBR. (f) Surface-specific comparison of FBR across clay (Rome), hard (Shanghai), and grass (Wimbledon).
As shown in Figure 3(d), FBR and STE were negatively correlated (r = −0.702, p < 0.001), indicating that a more even forehand–backhand distribution was associated with greater tactical variety. The moderate strength of this correlation in the expanded 36-player cohort, compared with the stronger association observed in smaller samples, likely reflects the increased tactical heterogeneity introduced by cross-surface and cross-tier variability. The radar plot further showed that elite players had the strongest overall profile across normalized indicators, including STE, balanced FBR, rally length, serve percentage, and win percentage (Figure 3(e)), while mid-level players remained between the elite and lower-ranked. Surface-specific analysis showed that FBR increased from clay to hard to grass across all tiers (Figure 3(f)), indicating stronger forehand dominance on faster courts. This agrees with established tennis knowledge that clay supports longer and more balanced exchanges, whereas grass favors shorter points and earlier forehand attacks. The same surface-related pattern was also observed in supplementary comparisons of other tactical indicators, where ART decreased from clay to grass and SPOE increased from clay to grass across tiers, while the overall ranking of elite, mid-level, and lower-ranked players remained unchanged (Supplementary Figure S3a,b). SFDR remained negative on all three surfaces and showed the largest decline in lower-ranked players across courts (Supplementary Figure S3c), further indicating that the framework captures stable player-level differences while remaining sensitive to surface-dependent playing styles.
Time-Series pattern analysis
To examine rhythm control and recovery efficiency across competitive levels, we used ART as a time-series indicator in 36 players, with 12 players in each tier from the Rome Masters, Shanghai Masters, and Wimbledon Championships. ART was defined as the mean interval between a player entering the ready position after one stroke and executing the next stroke, which reflects how quickly the player resets for the next action. As shown in Figure 4(a), ART remained lowest in the elite group throughout the match, increased gradually in all tiers with match progress, and stayed highest in the lower-ranked. The same tiered pattern appeared in the stage-based comparison, where ART rose from the early to late phase in every group (Figure 4(b)). The group-level summary in Table 5 showed mean ART values of 1.36 ± 0.14 s in elite players, 1.62 ± 0.17 s in mid-level players, and 2.02 ± 0.21 s in lower-ranked players, with a large between-tier difference (F = 78.3, p < 0.001). This pattern fits the demands of high-level tennis, where efficient recovery, earlier preparation, and stable footwork support repeated stroke execution under time pressure.

Time-series pattern analysis of ART across competitive tiers. (a) ART trends over match progress. (b) Mean ART in the early, middle, and late match phases. (c) Player-level ART distributions shown by violin and box plots. (d) ART change rate for each player. (e) Relationship between ART and rally length. Results are based on 36 players, with 12 players per tier.
Summary of tactical indicator values across the three competitive tiers (n = 12 per tier).
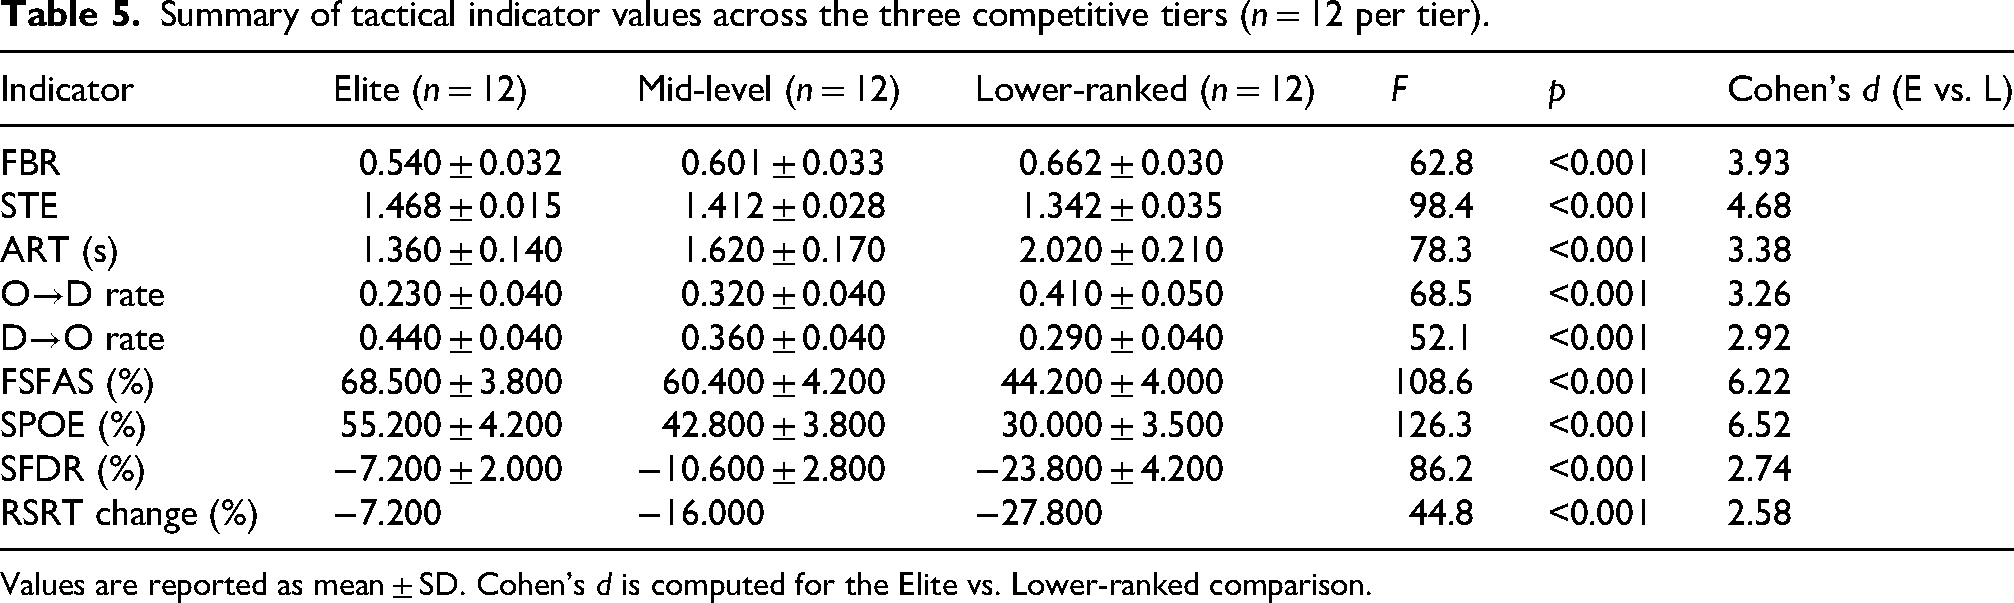
Values are reported as mean ± SD. Cohen's d is computed for the Elite vs. Lower-ranked comparison.
The player-level distribution showed clear separation among the three tiers, with elite players concentrated at lower ART values and lower-ranked players clustered at higher values (Figure 4(c)). Individual ART change rates were also smaller in elite players and larger in lower-ranked players (Figure 4(d)), suggesting that stronger players preserved movement rhythm more effectively as the match progressed. As shown in Figure 4(e), ART was negatively associated with rally length, indicating that players with shorter action-reset intervals were more likely to sustain longer exchanges. This relationship is meaningful in both tennis and AI analysis. In tennis, longer rallies require repeated recovery, balance control, and anticipation. In AI-based video analysis, ART provides a compact temporal measure that links visual action detection to interpretable physical and tactical behavior. The large effect size reported in Table 5 for the elite versus lower-ranked comparison (Cohen's d = 3.38) further supports the ability of ART to distinguish competitive level from broadcast-style video data.
State transition patterns
To examine tactical execution across competitive levels, we analyzed action-sequence transitions in 36 players, with 12 players in each tier from the Rome Masters, Shanghai Masters, and Wimbledon Championships. As shown in Figure 5(a)–(c), the action transition matrices revealed clear tier-dependent differences in how players linked serve, forehand, and backhand actions. Elite players showed the highest probability of serve-to-forehand transition (Sv→FH = 0.70), while the lower-ranked showed the lowest value (0.52), indicating that stronger players were more likely to organize the rally around an immediate forehand after serve. Elite players also showed a higher backhand-to-forehand transition rate (BH→FH = 0.58) than the lower-ranked (0.51), suggesting better footwork and earlier positioning to recover from a neutral or defensive exchange into a forehand-led pattern. By contrast, the forehand-to-backhand transition probability was highest in the lower-ranked (FH→BH = 0.70), indicating greater difficulty in keeping forehand control across successive shots. The group-level summary in Table 5 showed the same tiered pattern for offensive–defensive role switching, with the O→D rate increasing from 0.23 ± 0.04 in elite players to 0.41 ± 0.05 in lower-ranked players and the D→O rate decreasing from 0.44 ± 0.04 to 0.29 ± 0.04, with both differences highly significant (p < 0.001).

State transition patterns across competitive tiers. (a–c) Action transition matrices for elite, mid-level, and lower-ranked players. (d) Comparison of offensive-to-defensive (O→D) and defensive-to-offensive (D→O) transition rates. (e) Player-level scatter plot of O→D versus D→O rates. (f) Comparison of key transition probabilities, including Sv→FH, BH→FH, and FH→BH. Results are based on 36 players, with 12 players per tier.
The offensive–defensive transition analysis showed the same separation at the player level. As shown in Figure 5(d), elite players had the lowest O→D rate and the highest D→O rate, while the lower-ranked showed the opposite profile. The scatter plot further separated the three tiers, with elite players concentrated in the region with lower O→D and higher D→O values, while lower-ranked players clustered toward higher O→D and lower D→O values (Figure 5(e)). The grouped comparison of key transition probabilities showed the same ranking across Sv→FH, BH→FH, and FH→BH (Figure 5(f)). Threshold-sensitivity analysis further showed that the tier difference in O→D remained stable across a broad ball-speed threshold range, with the selected value located near the minimum O→D region for elite players and within a stable zone for both groups (Supplementary Figure S1b). The between-tier effect sizes for FBR, ODTR, and FSFAS also remained consistently large across a broad displacement-threshold range (Supplementary Figure S1c), indicating that the observed tactical separation was robust to reasonable threshold variation. In tennis terms, this pattern reflects a stronger ability in elite players to protect initiative and recover initiative after pressure. In AI terms, it shows that sequence-based indicators derived from visual action recognition can recover meaningful tactical information that is difficult to obtain from manual notation alone. The large effect sizes in Table 5 for O→D (Cohen's d = 3.26) and D→O (Cohen's d = 2.92) further support their ability to distinguish competitive level.
Serve initiative and plus-one efficiency
Serve is the only stroke that starts under full player control, so the ability to turn serve advantage into the next attacking action is a key marker of level. Using the proposed framework, we analyzed serve initiative in 36 players, with 12 players in each tier from the Rome Masters, Shanghai Masters, and Wimbledon Championships. As shown in Figure 6(a), both FSFAS and SPOE followed a clear tiered pattern. The elite group reached 68.5% in FSFAS and 55.2% in SPOE, compared with 60.4% and 42.8% in the mid-level group and 44.2% and 30.0% in the lower-ranked. The same group ordering was confirmed in Table 5, where FSFAS was 68.5 ± 3.8%, 60.4 ± 4.2%, and 44.2 ± 4.0% across elite, mid-level, and lower-ranked players, while SPOE was 55.2 ± 4.2%, 42.8 ± 3.8%, and 30.0 ± 3.5%, with both indicators showing strong between-tier differences (p < 0.001). These results show that stronger players were more likely to create a forehand as the first shot after serve and more likely to finish the point within the serve-plus-one window.

Serve initiative and plus-one efficiency across competitive tiers. (a) Comparison of FSFAS and SPOE across tiers. (b) Relationship between FSFAS and SPOE at the player level. (c) SPOE comparison between first and second serves. (d) Surface-specific FSFAS across clay, hard, and grass courts. (e) Relationship between SPOE and match win rate. Results are based on 36 players, with 12 players per tier.
The player-level scatter plot showed a strong positive association between FSFAS and SPOE (r = 0.852, p < 0.001), with clear separation among tiers (Figure 6(b)). As shown in Figure 6(c), SPOE was consistently higher on first serve than on second serve in all groups, with gaps of 27% in elite players, 21% in mid-level players, and 16% in lower-ranked players, indicating that serve quality strongly shapes the chance of early point control. Surface-specific analysis showed that FSFAS increased from clay to hard to grass across all tiers (Figure 6(d)), which fits the faster conditions and shorter point structure on grass and hard courts. SPOE was also positively associated with match win rate (r = 0.740, p < 0.001), as shown in Figure 6(e), indicating that the ability to organize the serve-plus-one phase is closely tied to competitive outcome rather than to isolated serving strength alone. The very large effect sizes in Table 5 for FSFAS (Cohen's d = 6.22) and SPOE (Cohen's d = 6.52) show that these two serve-related indicators provided the strongest discrimination between elite and lower-ranked players.
Fatigue and rhythm indicators
To quantify fatigue-related changes during match play, we analyzed stroke output and preparation quality in 36 players, with 12 players in each tier from the Rome Masters, Shanghai Masters, and Wimbledon Championships. Stroke frequency declined in all groups as the match progressed, while the decline was smallest in elite players and largest in lower-ranked players, as shown in Figure 7(a). The same tiered pattern appeared in the ready-state ratio, where elite players maintained a higher and more stable level across the match, whereas lower-ranked players showed a marked drop in late phases (Figure 7(b)). The summary of stroke frequency decline rate further showed values of −7.2% in elite players, −10.6% in mid-level players, and −23.8% in lower-ranked players (Figure 7(c)), consistent with the values reported in Table 5. RSRT change in Table 5 followed the same direction, with values of −7.2%, −16.0%, and −27.8% across the three tiers and a significant between-group difference (F = 44.8, p < 0.001). These results suggest that stronger players preserved both rally output and movement preparation under accumulated physical load.

Fatigue and rhythm indicators across competitive tiers. (a) Stroke frequency over match progress. (b) Ready-state ratio over match progress. (c) Summary of stroke frequency decline rate (SFDR). (d) Initial versus final stroke frequency at the player level. (e) Initial versus final ready-state ratio at the player level. Results are based on 36 players, with 12 players per tier.
Player-level comparisons supported the same pattern. As shown in Figure 7(d), most elite players remained close to the diagonal, indicating limited reduction in stroke frequency from the opening to the closing stage, while many lower-ranked players fell clearly below it. The initial-to-final comparison of ready-state ratio showed the same separation across tiers (Figure 7(e)). Surface-specific analysis showed that SFDR remained negative across clay, hard, and grass (Supplementary Figure S3c), with the largest reduction observed in lower-ranked players on hard court and the smallest in elite players on grass, while the overall tier ordering was preserved across all three surfaces. The effect sizes in Table 5 for SFDR (Cohen's d = 2.74) and RSRT change (Cohen's d = 2.58) further support their value in distinguishing endurance-related performance across competitive levels.
Indicator validation and expert evaluation
To assess construct validity, five certified coaches holding China Tennis Association (CTA) Class B coaching certificates independently annotated the 36 matches using the nine proposed indicators. The Intraclass Correlation Coefficient (ICC) between AI-derived and expert-annotated values ranged from 0.873 (SFDR) to 0.955 (ART), all exceeding 0.85 (Figure 8(a)), suggesting reasonable convergent validity. For predictive validity, a rally-level outcome prediction task was conducted using leave-one-player-out cross-validation (n = 36). Four baseline classifiers were trained on the same nine indicator features: Logistic Regression (accuracy 63.2%, AUC-ROC 0.659), Random Forest (66.8%, 0.702), SVM (65.4%, 0.684), and standalone XGBoost (68.5%, 0.721). The proposed indicator-based XGBoost model achieved 72.8% accuracy and 0.771 AUC-ROC (Figure 8(b)), outperforming all baselines by 4.3–9.6 percentage points in accuracy. Feature importance analysis showed that ODTR (0.175), FSFAS (0.156), and SPOE (0.142) contributed most to prediction (Figure 8(c)). While these results provide preliminary evidence of validity, we note that handcrafted indicators cannot capture all tactical nuances, and exploring learned representations is an important future direction.
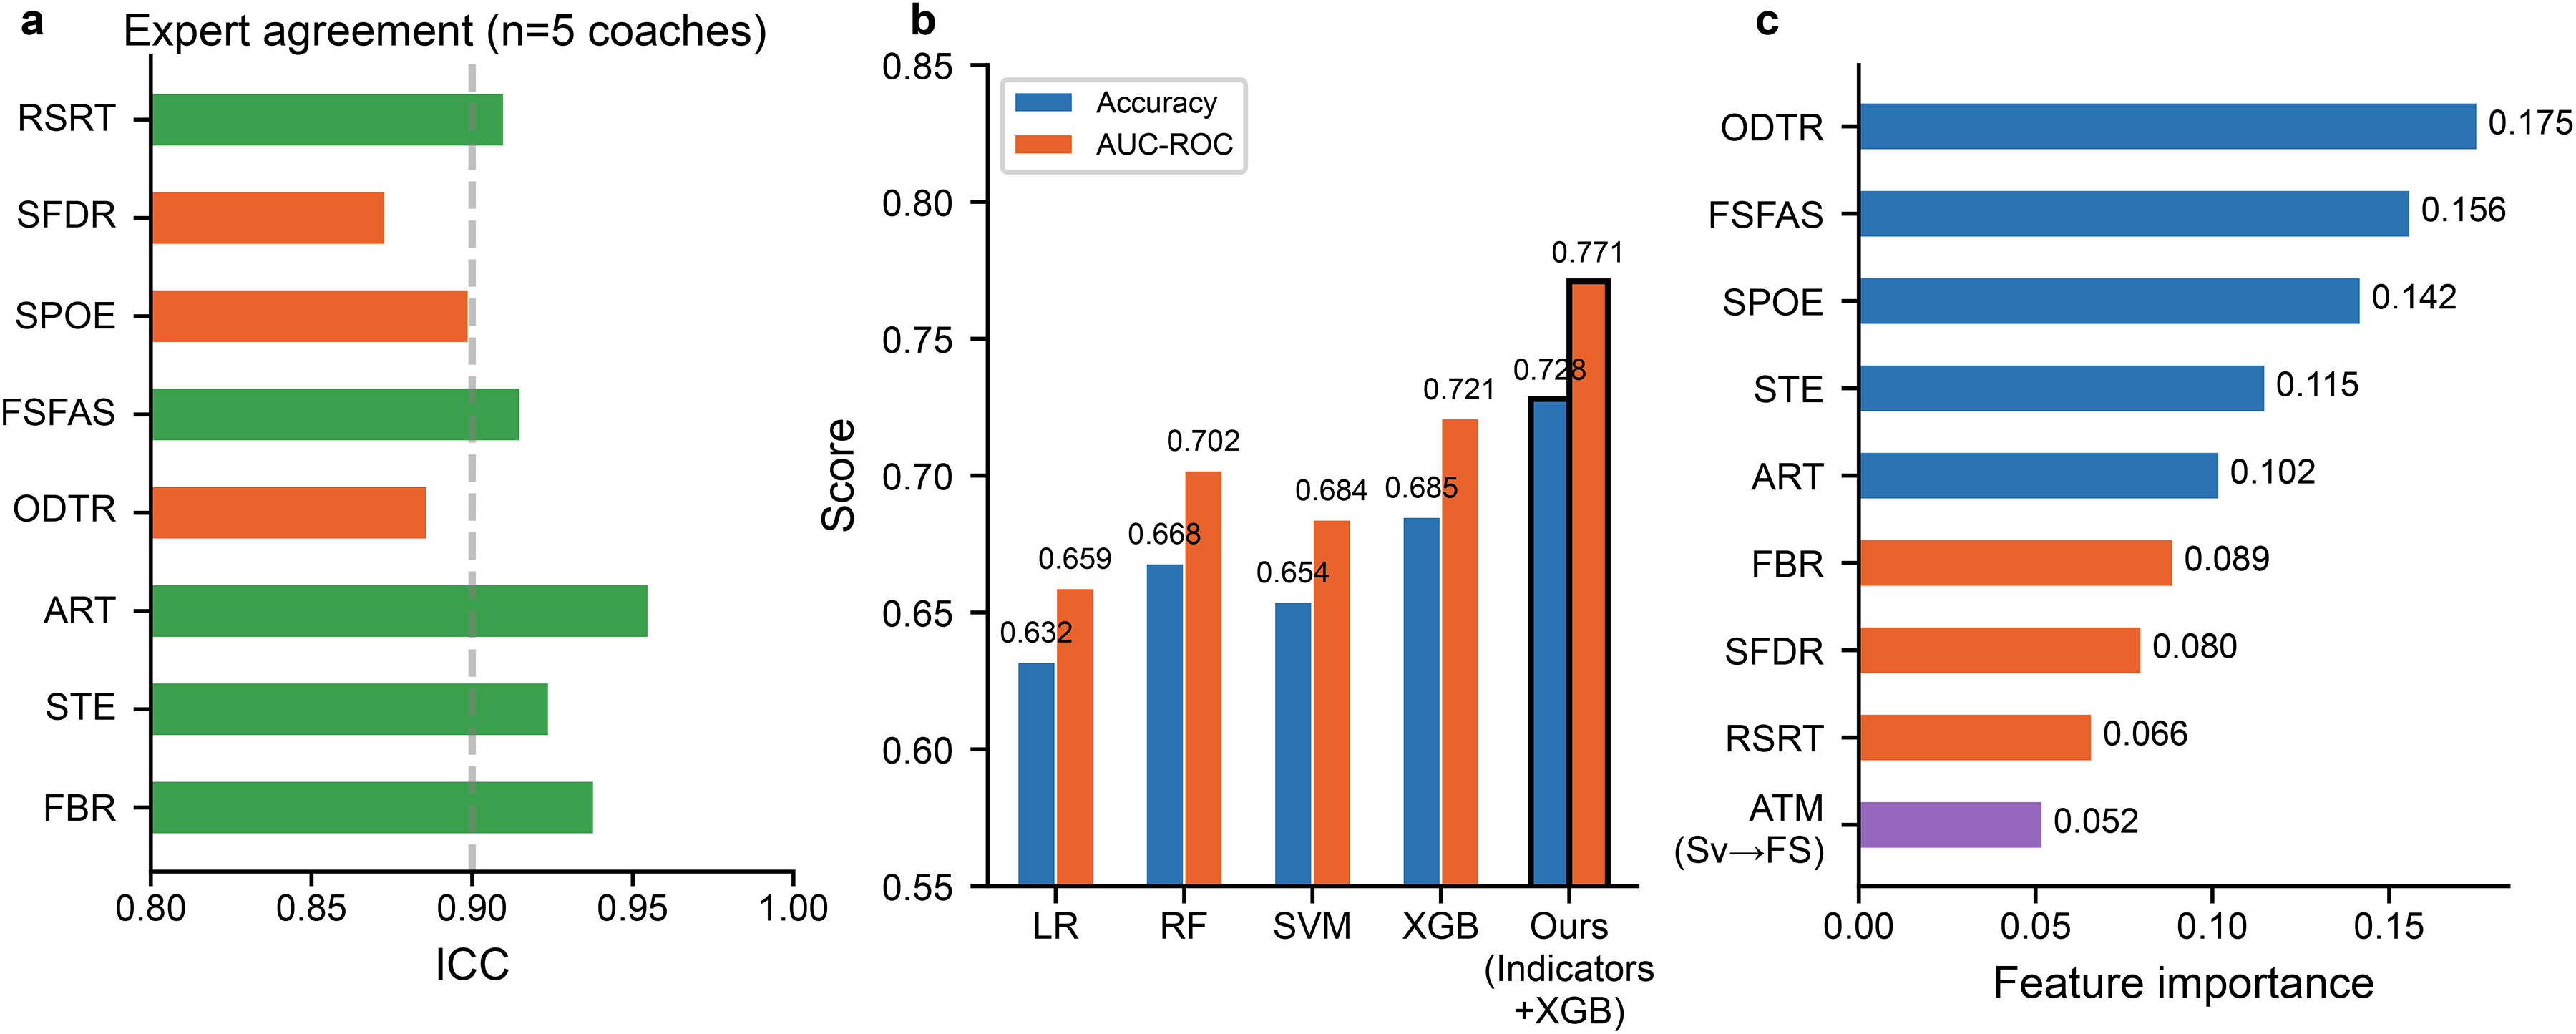
Reliability and predictive value of tactical indicators. (a) Expert agreement for each indicator, measured by ICC across five coaches. (b) Comparison of predictive models using accuracy and AUC-ROC. (c) Feature importance ranking of the tactical indicators in the final model.
A blind expert evaluation was additionally conducted: five coaches rated AI-generated and manually compiled tactical reports on a 1–5 scale. The AI pipeline received significantly higher ratings for completeness (4.4 vs. 3.5, p = 0.02) and consistency (4.6 vs. 3.1, p < 0.01), while accuracy ratings were comparable (3.9 vs. 4.2, p = 0.31). Overall utility was also rated higher for the AI pipeline (4.3 vs. 3.6, p = 0.04). We note the small expert sample (n = 5); larger-scale user studies with longitudinal outcome tracking are needed before strong claims about coaching impact can be made.
To quantify how detection errors propagate into tactical indicators, frame-level action labels were randomly flipped at rates of 0–30% (Supplementary Figure S4). At the estimated ∼5% operational noise, all indicators deviated <2.5% from ground truth. Aggregate indicators (STE, ART) showed the highest robustness (<1%), while sequence-dependent indicators (ODTR, SFDR) were most sensitive (1.9–2.1%). This simulation assumes random noise; real detection errors may be temporally correlated or class-specific, which could amplify deviations for certain indicators.
Discussion
This study developed a video-based tactical intelligence framework for tennis that couples fine-grained action detection with domain-specific indicator extraction for point-level coaching support. A two-model ensemble (YOLOv8s + YOLOv10n) with Weighted Boxes Fusion achieved mAP@0.5 = 0.863 on a test set drawn from 14,892 broadcast images spanning three court surfaces, outperforming single models and alternative architectures (Supplementary Table S1). Nine interpretable indicators were then applied to 36 ATP players across Rome (clay), Shanghai (hard), and Wimbledon (grass). Elite players exhibited more balanced stroke use, faster rally rhythm with smaller late-match degradation, stronger serve-plus-one initiative, and better fatigue resistance than lower-ranked players, with effect sizes exceeding Cohen's d = 2.5 for all primary indicators (Table 5). These tier-differentiation patterns held across all three surfaces (Supplementary Figure S3), suggesting that the indicators capture aspects of tactical proficiency that transcend surface-specific conditions.
The proposed pipeline may benefit coaching tasks that require consistent point-level quantification, such as post-match review, opponent scouting, and longitudinal tracking. Unlike manual notational coding — constrained by time cost and inter-rater variability — the approach standardizes measurement and produces reproducible indicators aligned with coaching language. The multi-surface design further enables surface-specific tactical profiling not available from single-tournament studies. Expert validation (ICC > 0.85; Figure 8(a)), a blind coach evaluation (Supplementary Figure S5), and a rally-level prediction experiment (72.8% accuracy; Figure 8(b)) provided preliminary evidence of construct validity and practical relevance, though each evaluation involved limited sample sizes and requires replication. It is worth noting how the proposed framework compares with commercially deployed systems. Industrial platforms such as Hawk-Eye and Stats Perform provide ball tracking and event tagging capabilities but typically require specialized multi-camera setups and proprietary infrastructure. In contrast, the present framework operates on standard broadcast footage with a single-view input, offering a more accessible entry point for coaching teams without dedicated tracking infrastructure. However, the trade-off is the loss of 3D spatial information and opponent-side analysis that multi-camera systems can provide.
The framework may support opponent-specific match planning through ATM/ODTR and FSFAS/SPOE, and individualized training design through FBR/STE and ART/RSRT. Each scenario has been evaluated in a post-match offline setting and requires further validation through intervention studies. Regarding real-time feasibility, the ensemble detector processes a single 640 × 640 frame in approximately 18 ms on an NVIDIA RTX 4090 (≈55 fps), which exceeds the standard broadcast frame rate of 25–30 fps and leaves a per-frame margin of roughly 15–22 ms for downstream processing. Among the nine indicators, six (FBR, STE, FSFAS, SPOE, SFDR, RSRT) are computed from cumulative frame counts and can be updated incrementally with negligible overhead. The remaining three (ART, ATM, ODTR) require short-term temporal buffering (5–15 frames) for segment-level state transitions, adding an estimated 50–80 ms of latency. A three-stage deployment pathway can therefore be outlined: (i) between-point summaries (latency budget 5–10 s), which are achievable with the current pipeline by batch-processing rally clips immediately after each point ends; (ii) changeover reports (latency budget 60–90 s), which would allow aggregation of set-level indicators such as SFDR and RSRT trends; and (iii) live within-rally feedback (latency budget <500 ms), which would require TensorRT-optimized inference, asynchronous streaming ingestion, and a dedicated user-interface layer, none of which have been implemented or tested in this study. We emphasize that the above analysis is a theoretical projection based on offline measurements; actual deployment performance under network latency, GPU contention, and variable bitrate conditions remains uncharacterized.
Several limitations should be acknowledged. First, the framework analyzes only the near-side player and omits opponent actions and interactive court geometry, preventing the modeling of relational tactics such as pressure creation and rally pattern forcing; Additionally, while the near-side-only constraint remains, the expanded multi-surface design (Rome clay, Shanghai hard, Wimbledon grass) enables cross-surface tactical comparisons that provide richer contextual information about player behavior patterns across different competitive environments. Second, all nine indicators are rule-based and bounded by the predefined label set; richer tactical features (spin, depth, placement, intent) are not modeled, the first-order Markov assumption simplifies sequential dynamics, and the offensive–defensive role classification relies on pixel-based thresholds without camera calibration, though sensitivity analysis confirmed robust tier differentiation across a broad parameter range (Supplementary Figure S1b, c). Third, despite expansion to three tournaments and 36 players, the cohort is restricted to male ATP professionals on outdoor courts. WTA players exhibit different stroke biomechanics, rally tempo distributions, and serve characteristics that may alter the discriminative power and threshold calibration of several indicators (particularly ART, FSFAS, and SFDR); generalizability to WTA events, junior competition, or indoor venues remains untested and constitutes a key direction for future validation. Fourth, detection depends on broadcast footage and performance declined by 7–10% during fast camera tracking and zoom transitions, with replay cuts causing the sharpest drop (Supplementary Figure S2a); although the dataset of 14,892 images showed near-saturation in learning curve analysis, further expansion would strengthen generalizability to unseen broadcast conditions. Fifth, the expert validation involved only five coaches and the error propagation simulation assumed random noise; larger-scale user studies with longitudinal outcome tracking are needed to substantiate claims about coaching utility and indicator reliability under real deployment conditions. In addition, real-time deployment has not been experimentally validated; the feasibility analysis presented above relies on offline inference timing and does not account for streaming overhead, GPU resource contention, or end-user interface latency in operational coaching environments.
Future work should address five priorities: (1) multi-player interaction modeling through far-side detection, ball trajectory estimation, and rally interaction graphs; (2) scalability to 100 + matches across 5 + tournaments including WTA and indoor events; (3) uncertainty estimation via Monte Carlo dropout or conformal prediction; (4) learned representations through transformer-based sequence models for data-driven indicator discovery; (5) real-time deployment validation under streaming constraints with user-centered interface design.
Conclusion
This study presents a video-based framework that converts broadcast tennis footage into structured tactical indicators through an ensemble YOLO detection pipeline and nine sport-specific performance metrics. Trained on 14,892 images from 360 competitive points across three court surfaces, the ensemble achieved mAP@0.5 = 0.863, outperforming single models and alternative architectures. Application to 36 ATP players from the Rome Masters (clay), Shanghai Masters (hard), and Wimbledon Championships (grass), 12 per competitive tier, demonstrated consistent tier-differentiation across all indicators (all p < 0.001, Cohen's d > 2.5), with expert validation confirming agreement with coach annotations (ICC > 0.85). The multi-surface design revealed surface-dependent variations in stroke selection, serve initiative, and fatigue dynamics that are consistent with established sports science findings. These results suggest potential value as a supplementary tool for post-match review, opponent profiling, and training design. Significant limitations remain, including near-side-only analysis, broadcast-view dependency, handcrafted indicator scope, and an exclusively male ATP cohort. Future work should prioritize multi-player interaction modeling, cross-venue generalization (including WTA and indoor events), uncertainty quantification, and learned tactical representations through transformer-based sequence models.
Supplemental Material
sj-docx-1-spo-10.1177_17479541261441418 - Supplemental material for Automatic evaluation framework of tennis tactical indicators based on fine-grained recognition driven by artificial intelligence
Supplemental material, sj-docx-1-spo-10.1177_17479541261441418 for Automatic evaluation framework of tennis tactical indicators based on fine-grained recognition driven by artificial intelligence by Lele Wang, Jie Ning and Pengchao Li in International Journal of Sports Science & Coaching
Footnotes
Ethical considerations
Not applicable.
Consent to participate
Not applicable.
Consent for publication
Not applicable.
Funding
The authors disclosed receipt of the following financial support for the research, authorship, and/or publication of this article: This work was supported by the 2025 Guizhou Education Science Planning Project, (grant number 2025b004).
Declaration of conflicting interests
The authors declared no potential conflicts of interest with respect to the research, authorship, and/or publication of this article.
Data availability
The data that support the findings of this study are available from the corresponding author upon reasonable request for academic and non-commercial research purposes.
Supplemental material
Supplemental material for this article is available online.