
Abstract
Ice hockey in the United Kingdom (UK) spans from grassroots participation to elite and international levels, yet limited data exists on the physical development of youth players. This study aimed to model the development of off-ice, physical performance measures in UK-based male youth ice hockey players, according to both chronological (CA) and biological age (BA). A total of 347 players (mean age 13.7 ± 1.4 years) from U12 to U16 age groups, attending a national showcase event, completed off-ice assessments including anthropometrics, countermovement jump, seated medicine ball throw, 20 m sprint, and pro-agility test. Generalized additive models for location, scale and shape (GAMLSS), with penalized B-splines, were used to the non-linear developmental trajectories between 11 and 16.5 years and derive centile curves for both CA and BA. Results demonstrated a general trend of higher physical performance with increasing CA, while analysis, based on BA, revealed a concentrated period of development between ∼12.5 and 15 years. These findings highlight the non-linear nature of physical development and the importance of accounting for biological maturation in youth athlete assessment. This study provides the first descriptive dataset for competitive UK youth male ice hockey players, offering valuable insights into age and maturity-related performance trends. The reference values support more equitable talent identification and development strategies, aligning with national governing body objectives.
Introduction
Ice hockey is an intermittent, high-intensity collision sport characterised by repeated short bursts of maximal effort, rapid acceleration, frequent changes of direction, and substantial upper- and lower-body power demands.1–3 The contact nature of play further elevates the importance of strength and robustness.4,5 Off-ice testing batteries are therefore widely used across systems, including the National Hockey League (NHL) Combine, to profile these physical performance measures for talent identification and to monitor long-term development.1,6
In the United Kingdom (UK), participation is established, but comparatively modest within the global landscape. The most recent International Ice Hockey Federation (IIHF) survey reports that Great Britain ranked 11th in overall participation numbers with 13,327 registered players (4538 junior players), compared to the highest participation of 675,253 (473,822 junior players) in Canada. For further context Sweden ranked fourth for participation with 86,412 players of which 61,180 were juniors. 7 Analysis of the UK-based Elite Ice Hockey League (EIHL) suggest the proportion of British-born players typically remains below one-third of league rosters, highlighting limited domestic progression to the highest national level. Infrastructure is also comparatively constrained relative to hockey-dense nations, potentially limiting access and sustained development opportunities. 7 Together, these factors underline the practical need for UK-specific, developmentally sensitive benchmarks to support objective assessment and planning, to maximise the attainment of those participants within the system.
Selection and progression in youth collision-based sports are strongly influenced by biological maturation, such that more biologically advanced athletes often gain advantage due to size, strength, and speed, 8 which has been evidenced in youth ice hockey. 9 Glaude-Roy and Lemoyne 10 demonstrated that skating performance and force–velocity characteristics differ significantly across maturational stages, with post-PHV players showing advantages in acceleration and maximal velocity. In youth ice hockey, selection and exposure can also be influenced by relative age effects (RAE), whereby athletes born earlier within an age-band are disproportionately represented in higher tiers11–13; furthermore, RAE may also interact with maturational advantages during adolescence. 14 Recognising these selection dynamics reinforces the need for developmentally sensitive benchmarking and highlight the need for maturity-adjusted profiling in youth ice hockey.
Grouping by chronological age (CA) alone assumes homogeneous, linear development; yet the growth and maturation literature consistently shows large inter-individual differences in the timing and tempo of maturation, 15 producing substantial CA–BA incongruence among same-age peers, particularly around the adolescent growth spurt.16,17 Although maturity-related considerations, such as bio-banding,18–20 are increasingly recognised as a way to mitigate maturity bias in youth sport, most normative profiling studies in team sports still report CA-indexed values 21 and include maturity information inconsistently, limiting equitable benchmarking within and between age groups. These evidence gaps are especially salient in ice hockey as descriptive work on youth players originates primarily from North America and Northern Europe1,9,22–24 and is typically based on CA groupings alone.
Research specifically generating centile data often focuses on single test constructs such as aerobic capacity, 25 jumping performance, 26 and speed 27 without maturity-indexed norms.25,26,28 To our knowledge, no published study has produced BA indexed reference curves for off-ice performance in youth ice hockey, nor delivered multi-test benchmarks spanning speed, power, and change-of-direction that practitioners can apply assessment and evaluation that includes biological maturity. Accordingly, the present study integrates CA and BA to model developmental trajectories in UK youth male ice hockey players and to generate practitioner-ready centiles and Z-scores for multiple off-ice performance tests. Through a GAMLSS framework 29 to produce smoothed centile curves, an approach consistent with contemporary youth reference-curve methodology and its application in paediatric fitness surveillance, while acknowledging known limitations of anthropometry-based maturity estimates in early and late maturers.15,30 By providing paired CA- and BA-indexed reference values for sprinting, countermovement jump (CMJ) height, upper-body power and change of direction speed (CoDS), these data offer coaches and practitioners a more equitable basis for benchmarking, longitudinal monitoring, and the integration of bio-banding principles within UK talent identification and development pathways.
The aim of this study was to model the development of off-ice physical performance in UK youth male ice hockey players by CA and age BA, and to generate sport-specific reference centiles and Z-scores for sprinting, jumping, upper-body power, and change-of-direction that can inform coaching, monitoring, and selection within the UK system and comparable emerging pathways internationally.
Materials and methods
Research design
This study used a cross-sectional design that recruited 11–16.5-year-old community-level ice hockey players attending the annual England Ice Hockey (EIH) showcase (May, 2024). Participation in the showcase event was through invite by their domestic team coaches, based on perceived merit throughout the season, on ice performance being one contributing factor. The event was self-funded and was not part of any national talent identification and development programme, nor were any further selections made resulting from attendance and performance at the event. As such the sample maybe considered quasi-competitive and more indicative of the higher performing players within the youth community ice hockey population, in the UK.
Four physical performance test were identified, representing general athletic motor abilities 31 and had been previously used in ice hockey research.2,22,23,32,33 These included: rapid force production in the lower body (countermovement jump (CMJ)), and upper body (seated 3-Kg medicine ball throw (MBT)), sprinting speed (20 m sprint) and CoDS (pro-agility test, (PAT)). The testing battery was integrated into a dense two-day period of competition for each age group. To mitigate the influence of fatigue all testing was performed on the participants first day and before any other physical activity, such as scrimmages or competitive games.
Prior to the event, participants and guardians were provided with a study information sheet and assent form to complete prior to participation. EIH acted as the gatekeeper for the assent process. Ethical approval was gained from the Leeds Beckett University institutional ethics committee (Ref: 131647) and was performed in accordance with the standards of ethics outlined in the Declaration of Helsinki.
Participants
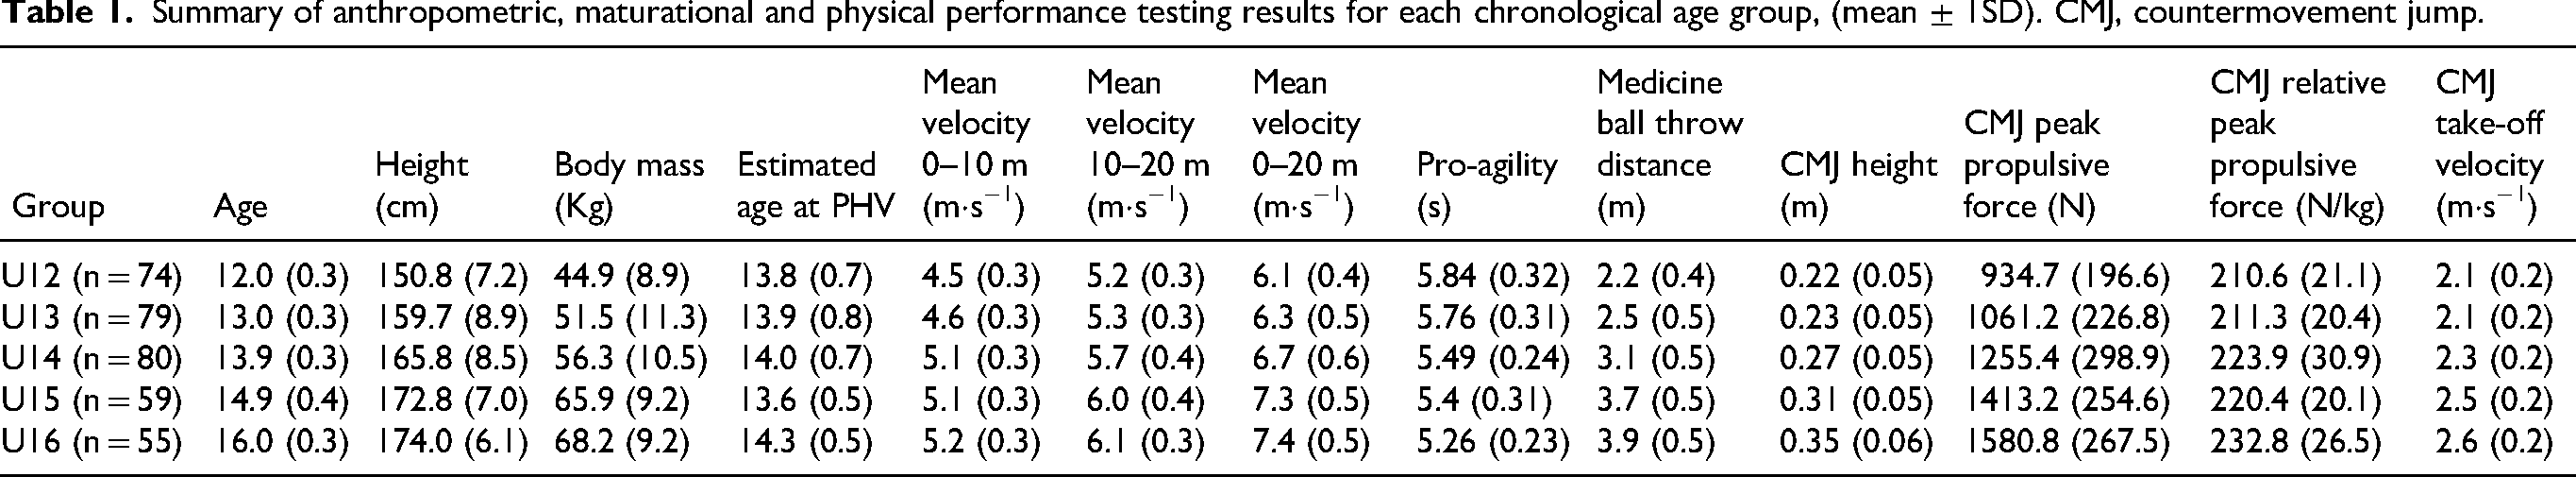
A total of 347 youth male ice hockey players organised into five chronological age categories (under 12 s, 13 s, 14 s, 15 s, and 16 s), participated in the study. Descriptive statistics of the participants’ height, mass and maturity status are provided in Table 1.
Summary of anthropometric, maturational and physical performance testing results for each chronological age group, (mean ± 1SD). CMJ, countermovement jump.
Procedures
Testing was conducted on the first day of the showcase for each age group, prior to any on-ice activities, which were scheduled from Saturday to Monday. A standardised warm-up of jogging, and dynamic and static stretching was conducted prior to any testing. Full instructions and demonstrations were provided by the research team for each individual test. All anthropometric and performance data was collected by the research team.
Relative age effect
To contextualise potential selection skews, birth months were grouped into quartiles relative to the governing body's age-group cut-off (Q1–Q4), and frequencies were tabulated overall and by squad (U12–U16); these descriptives are provided for context only in Supplementary file 5. and were not incorporated into any further analysis.
Anthropometry
Standing and seated height were both taken using a stadiometer (SECA Alpha, Birmingham, UK) to the nearest 0.1 cm. For standing height, participants stood with feet together, with a neutral posture, on the fixed base. For seated height, participants sat on the floor with their head in a neutral position. Body mass was taken using calibrated electronic scales (SECA Alpha770, Birmingham, UK) to the nearest 0.1 kg. Participants were required to remove shoes for all anthropometric testing.
Maturation
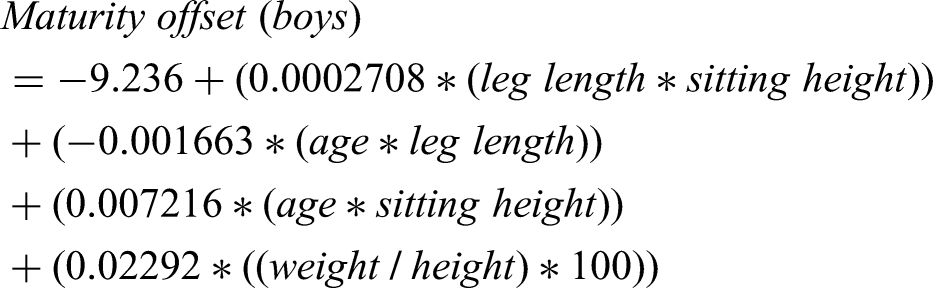
Maturation was determined based on the estimated maturity offset (MO) (estimated time span from the participants’ peak height velocity (PHV) at the time of testing) and estimated age of peak height velocity (APHV). These values were calculated using the spreadsheets provided by Towlson et al.
34
which applied the modified Mirwald equation with a prediction error of ≈±0.5 years in average maturing boys and girls.
30
Maturation was determined based on the estimated maturity offset (MO) (estimated time span from the participants’ PHV at the time of testing) and estimated APHV. These values were calculated using the spreadsheets provided by Towlson et al.
34
which applied the modified Mirwald equation with a prediction error of ≈±0.5 years in average maturing boys and girls.
30
Those participants whose age was <1 year from the sample mean APHV (13.7 years) were classified as early maturers and those whose APHV was >1 year from the mean APHV were considered late maturers. Participants who had an APHV within ±1 year of the sample mean were classified as ‘on time’.
Maturity status was interpreted as the participant's MO, either pre- (←1 years), circa- (±1 year) and post-PHV (>1 years). 30 These three maturity categories (pre, circa, post) reflect the accuracy of the prediction equation; however, to reflect the organisation of the sample into five CA groups of one year, the same number groups were used to divide the sample by MO, using the boundaries, from APHV, these were designated as groups A,B, C, D and E, respectively, for ease of reporting.
Finally, estimated BA was calculated as the sample mean APHV + participants MO (e.g., 13.7 + 1.1 = BA of 14.8 years) to standardise an approach for analysing the impact of biological maturation on the change in performance variables. This approach was to provide an accurate representation of a participant's physical development at any given time point. MO is an estimate of time from APHV, yet this reference point is not fixed across participants, so MO alone does not allow for a comparison of biological differences between participants. Using a fixed APHV (sample mean) and calculating biological age from this value, an estimation can be made irrespective of a participants timing of APHV.
Lower body rapid force production: CMJ
A CMJ with no arm swing jump was measured using two portable force plates (Hawkins Dynamic, ME, USA). Participants started in a tall standing position, with equal weight distribution between limbs while standing on the force plates. Hands were placed on hips throughout the test. Once a period of quiet standing had elapsed the command to jump was given and participants dropped into a countermovement position at a self-selected depth. This was immediately followed by a maximal effort vertical jump and landing on the force plates. Participants were instructed to jump as high as possible, using the desired technique, no further cues were given. Participants reset their position and repeated the test a total of three times consecutively, with minimal recovery between trials. The trial which achieved the largest jump height was used for analysis. If participants removed their hands from their hips during the test or did not land on the force plates, the jump was invalid and repeated. 35 From the metrics generated through the proprietary software, jump height (impulse-momentum), peak force, relative peak force and take-off velocity were used as measures of jump characteristics. These metrics have been demonstrated to have high between day reliability (coefficient of variation, CV, <10%, Intraclass correlation coefficients, ICC, >0.9). 36
Upper-body rapid force production: MBT
Participants were in a long sitting position with their legs extended on the ground in front and their back supported against a wall. All participants used the same 3-kg medicine ball, which was thrown horizontally as far as possible, with hands on both sides of the ball and the forearms positioned parallel to the ground whilst back maintained contact with the wall. The initial landing position was recorded to the nearest 0.1 m, with participants conducting three trials, 37 the trial with the furthest distance was used for analysis.
Speed and change-of-direction speed: 20m sprint & PAT
Linear overground sprinting speed was assessed over 20 m, which was selected based on the accelerative nature of intermittent team sport match play and the facility constraints for the testing battery. The 20 m sprint is a measure of speed (distance/time), but because participants may not reach maximal velocity, the test is more indicative of acceleration. The test was recorded with an interval at 10 m to differentiate between early (0–10 m) and later, flying (10m-20 m) accelerative phases.
Two trials of the were performed, the first being initiated with a turn to the left and the second trial to the right. Three cones were placed along a straight line five yards (4.57 meters) apart each with an accompanying timing gate. Participants began on centre cone and accelerated 5 yards to the first cone (either to their left or right), changed direction and accelerated 10 yards to the opposite cone, changed direction again and accelerated 5 yards to return to the cone, terminating the test. To be classified as a valid test, the participant's lead hand and foot must have made contact with each line when changing direction.
The 20 m sprint and PAT tests were conducted on an indoor athletics track. Each test was measured using the Witty timing system (Microgate, Italy) with the height of the gates set approximately to the height of participants’ hip. The heights of the gates were visually inspected at the start of each age groups testing session to ensure they were adjusted to the appropriate height. For both the 20 m sprint and PAT participants were given a standing start 0.5 m behind the first timing gate, the researchers initiated the test with the command “three, two, one, go”. The start of each trial was determined when the participants passed the first timing gate. A total of three attempts were completed for the linear sprint and two attempts per direction of the PAT (four total), with a 2-min rest between all efforts. All test times were recorded to the nearest 0.01 s, the trial with the lowest time to complete was carried forward for analysis.
Statistical analysis
Descriptive statistics are presented as mean ± SD. Between-group differences across CA squads were examined using a one-way ANOVA, with assumptions of normality and homogeneity of variance checked via Shapiro–Wilk and Levene's tests, respectively. Omnibus effects were expressed as ω2 (ANOVA) and partial η2 (ANCOVA). Statistical significance was set at α = 0.05 and 95% confidence intervals (CI) were reported where appropriate. Where significant main effects were detected (p < 0.05), Tukey HSD post-hoc tests were applied. Effect sizes for omnibus and pairwise comparisons were calculated using ω2 and Cohen's d, interpreted using conventional thresholds 38 and with 95% CI.
To examine maturational effects independent of CA, performance outcomes were compared across maturity offset groups using ANCOVA with CA included as a covariate. Group × age interactions were tested to confirm the assumption of homogeneous regression slopes, and age-adjusted marginal means were compared using Tukey-adjusted post-hoc tests.
Non-linear age-related changes in performance were modelled using Generalized Additive Models for Location, Scale and Shape (GAMLSS), with age (CA and BA) included as a smooth term. The BCCG distribution family was selected to generate smoothed centile curves at 0.1-year intervals for each performance measure. Model selection followed standard GAMLSS procedures, with smoothing parameters optimised using penalised likelihood criteria. From these models, age-specific percentiles and z-scores were derived for both CA and BA.
Paired CA- and BA-derived z-scores were compared using linear mixed-effects models, with age type (CA vs BA) specified as a fixed effect and participant ID as a random effect. Standardised mean differences and 95% CI were used to interpret the magnitude of differences.
An enhanced explanation of the statistical approach is provided in the supplementary file 1. All analyses were conducted in R (RStudio version 4.0.2), 39 the full analysis script is provided in the Supplementary file 2.
Results
Mean predicted age at PHV (APHV) was 13.7 ± 1.0 years (range 11.0–15.5 years). Based on APHV timing relative to the sample mean, 15.3% were classified as early maturers, 67.1% as on-time, and 17.6% as late maturers. When grouped by proximity to PHV, 36.3% were pre-PHV, 31.4% were circa-PHV, and 32.3% were post-PHV.
Relative age effect
Birth-quartile distributions for the cohort showed an over-representation in Q1–Q2 relative to Q4 (overall Q1 = 31.3%, Q2 = 28.6%, Q3 = 22.1%, Q4 = 18.0%; Supplementary Appendix Sx, Table Sx; Figures Sx-1 and Sx-2)
Age group analysis
Table 1 summarises anthropometric characteristics, predicted maturity timing, and off-ice performance outcomes across the five chronological age squads (U12–U16). Height and body mass increased progressively from U12 (150.8 ± 7.2 cm; 44.9 ± 8.9 kg) to U16 (174.0 ± 6.1 cm; 68.2 ± 9.2 kg), alongside modest variation in predicted age at PHV (13.6–14.3 years). One-way ANOVA demonstrated significant between-squad differences for all key performance outcomes. Specifically, 20 m sprint mean velocity increased with age (U12: 6.11 ± 0.46 m·s−1; U16: 7.38 ± 0.52 m·s−1) with a large overall effect (F (4, 349) = 75.96, p < 0.001, ω2 = 0.48 (0.42, 1.00). Upper-body power (MBT distance) also increased substantially from U12 (2.2 ± 0.4 m) to U16 (3.9 ± 0.5 m), showing the largest between-squad effect (F (4, 350) = 161.73, p < 0.001, ω2 = 0.64 (0.60, 1.00)). Lower-body jump performance increased across squads (CMJ height: U12 0.22 ± 0.05 m; U16 0.35 ± 0.06 m), with a large effect (F (4, 346) = 72.91, p < 0.001, ω2 = 0.45 (0.38, 1.00), and post-hoc comparisons indicated no meaningful difference between U12 and U13 for CMJ height. PAT time generally decreased across squads (U12: 5.84 ± 0.32 s; U16: 5.26 ± 0.23 s) and differed significantly between squads overall (F (4, 361) = 15.45, p < 0.001, ω2 = 0.34(0.27, 1.00)), although several adjacent squad comparisons were not significant in post-hoc testing.
Maturational group analysis
Table 2 summarises anthropometric and maturity characteristics for players grouped by proximity to PHV (Pre-PHV, Circa-PHV, Post-PHV). The groups differed as expected in chronological age and body size, with values increasing from Pre-PHV (12.4 ± 0.6 y; 151.6 ± 6.7 cm; 44.3 ± 7.3 kg) through Circa-PHV (13.7 ± 0.7 y; 167.5 ± 6.3 cm; 58.4 ± 9.1 kg) to Post-PHV (15.4 ± 0.7 y; 173.9 ± 6.6 cm; 68.0 ± 9.4 kg). One-way ANOVA confirmed large between-group differences for chronological age (F (2, 349) = 604.60, p < 0.001, ω2 = 0.77), standing height (F(2, 349) = 375.64, p < 0.001, ω2 = 0.68), and body mass (F (2, 349) = 232.59, p < 0.001, ω2 = 0.57). Biological age also differed markedly between PHV-proximity groups (F(2, 349) = 1621.24, p < 0.001, ω2 = 0.90). Predicted age at PHV differed between groups with a small effect (F(2, 349) = 13.10, p < 0.001, ω2 = 0.06); post-hoc comparisons indicated this difference was primarily driven by the Pre-PHV group, whereas Circa-PHV and Post-PHV did not differ meaningfully.
Summary of anthropometric and maturational data for each group relative to onset of PHV (mean ± 1 standard deviation).
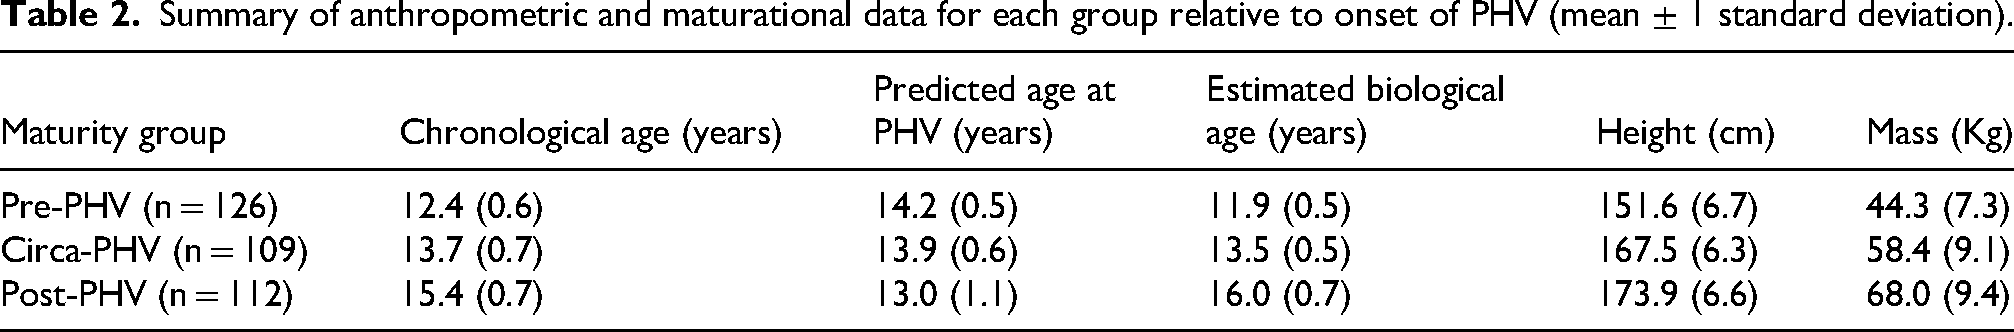
Table 3 summarises anthropometric, maturational and performance characteristics when players were grouped by maturation timing (Early, On time, Late). One-way ANOVA indicated that CA did not differ significantly between timing groups (F(2, 349) = 2.23, p = 0.109, ω2 = 0.01), whereas standing height (F(2, 349) = 17.16, p < 0.001, ω2 = 0.08) and body mass (F(2, 349) = 26.13, p < 0.001, ω2 = 0.12) differed significantly between groups. Age at PHV differed strongly across timing groups (F(2, 349) = 129.78, p < 0.001, ω2 = 0.42), with a smaller but significant difference observed for biological age (F(2, 349) = 10.32, p < 0.001, ω2 = 0.05). For performance outcomes, MBT distance differed significantly between timing groups (F(2, 349) = 13.36, p < 0.001, ω2 = 0.07), whereas 20 m sprint mean velocity (F(2, 347) = 1.71, p = 0.182), CMJ jump height (F(2, 345) = 0.33, p = 0.719), and pro-agility time (F(2, 348) = 0.80, p = 0.448) did not differ significantly (trivial ω2 values), indicating broadly comparable sprint, jump and change-of-direction performance across timing groups within this cross-sectional sample.
Summary of anthropometric, maturational and physical performance testing results for each maturational timing group, (mean ± 1SD).
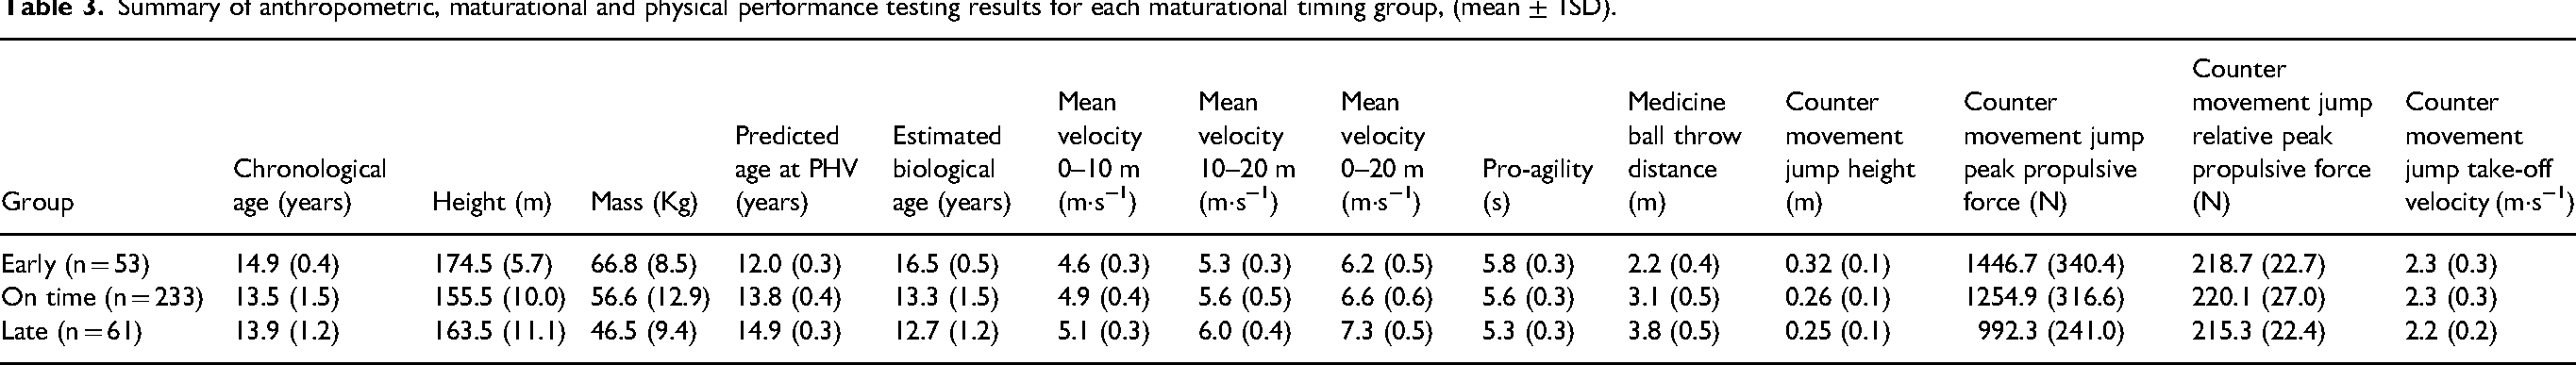
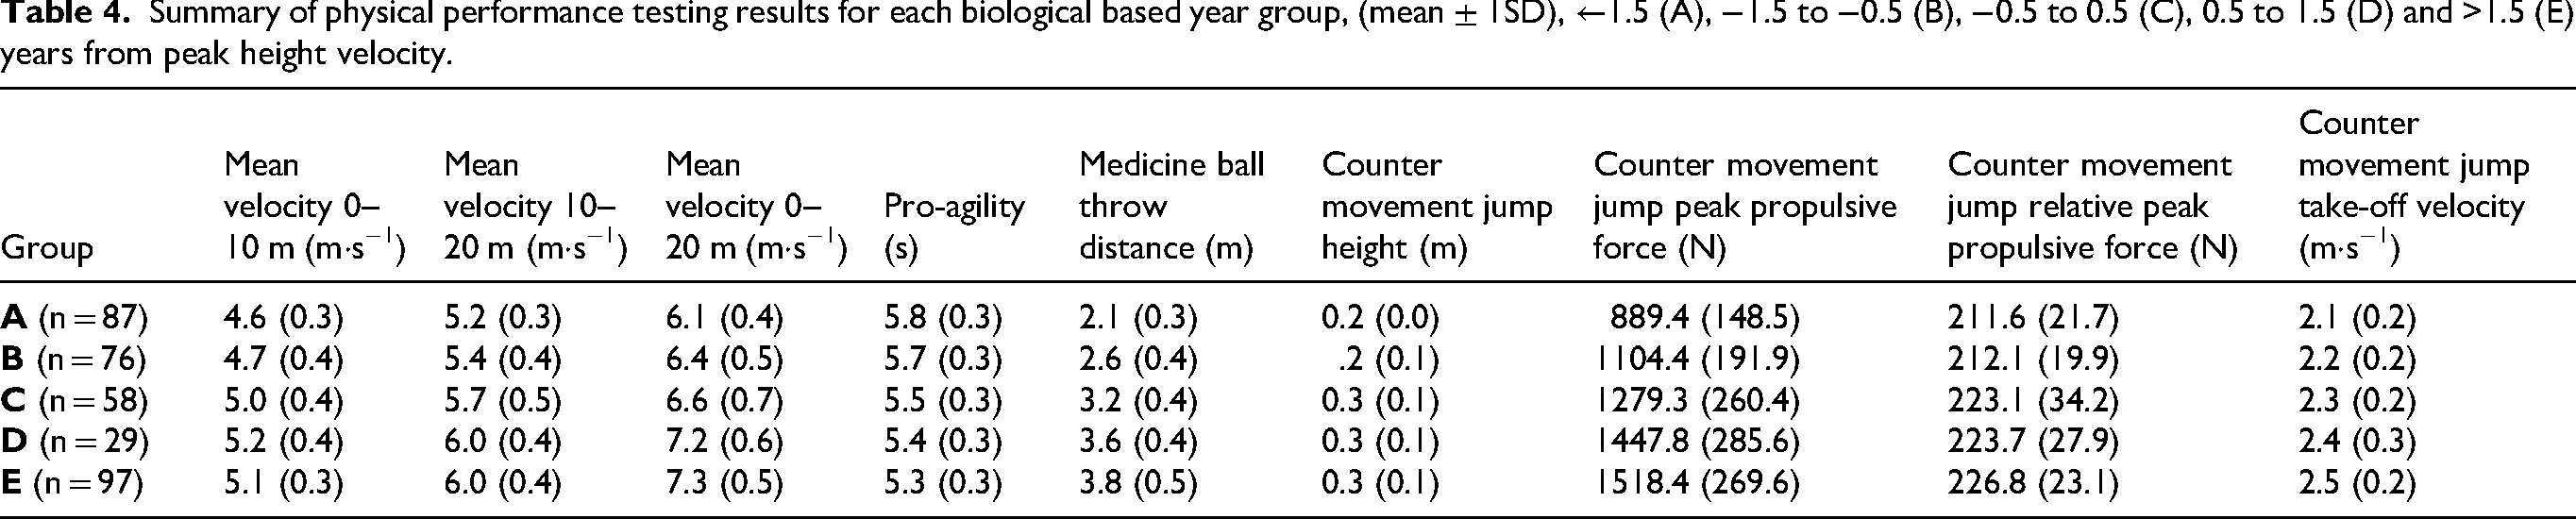
Table 4 summarises off-ice performance outcomes across groups based on one-year maturity offset boundaries (A–E; from < −1.5 to > 1.5 years from PHV). Across these groups, there was a clear maturity-related trend of higher performance, with mean 20 m sprint velocity increasing from 6.12 ± 0.42 m·s−1 (A) to 7.33 ± 0.50 m·s−1 (E), MBT distance increasing from 2.12 ± 0.34 m (A) to 3.83 ± 0.49 m (E), and CMJ jump height increasing from 0.22 ± 0.04 m (A) to 0.33 ± 0.05 m (E); pro-agility time decreased across maturity bands (A: 5.74 ± 0.68 s; E: 5.34 ± 0.28 s). ANCOVA analysis confirmed significant between-band differences for 20 m sprint velocity (F(5, 341) = 67.81, p < 0.001, η2 = 0.49 (0.43, 1.00)), CMJ jump height (F(4, 343) = 58.69, p < 0.001, η2 = 0.42 (0.36, 1.00)), MBT (F(4, 347) = 223.00, p < 0.001, η2 = 0.73 (0.69, 1.00)) and PAT (F(4, 346) = 14.55, p < 0.001, η2 = 0.31 (0.25, 1.00)). Post-hoc comparisons (provided as supplementary materials) indicated that differences were most pronounced from earlier to mid-maturity bands, whereas band D vs E was not significantly different for 20 m velocity and CMJ jump height, suggesting attenuation of improvements beyond ∼1.5 years post-PHV within this cross-sectional sample.
Summary of physical performance testing results for each biological based year group, (mean ± 1SD), ←1.5 (A), −1.5 to −0.5 (B), −0.5 to 0.5 (C), 0.5 to 1.5 (D) and >1.5 (E) years from peak height velocity.
Distribution of participant ages
Figure 1 presents an X–Y scatter plot of chronological age (CA) against biological age (BA) for all participants in the sample (11.0–16.5 years). The red dashed identity line (BA = CA) enables visual assessment of maturity timing: points above the line represent individuals who are biologically younger than their CA, whereas points below indicate biologically advanced individuals.
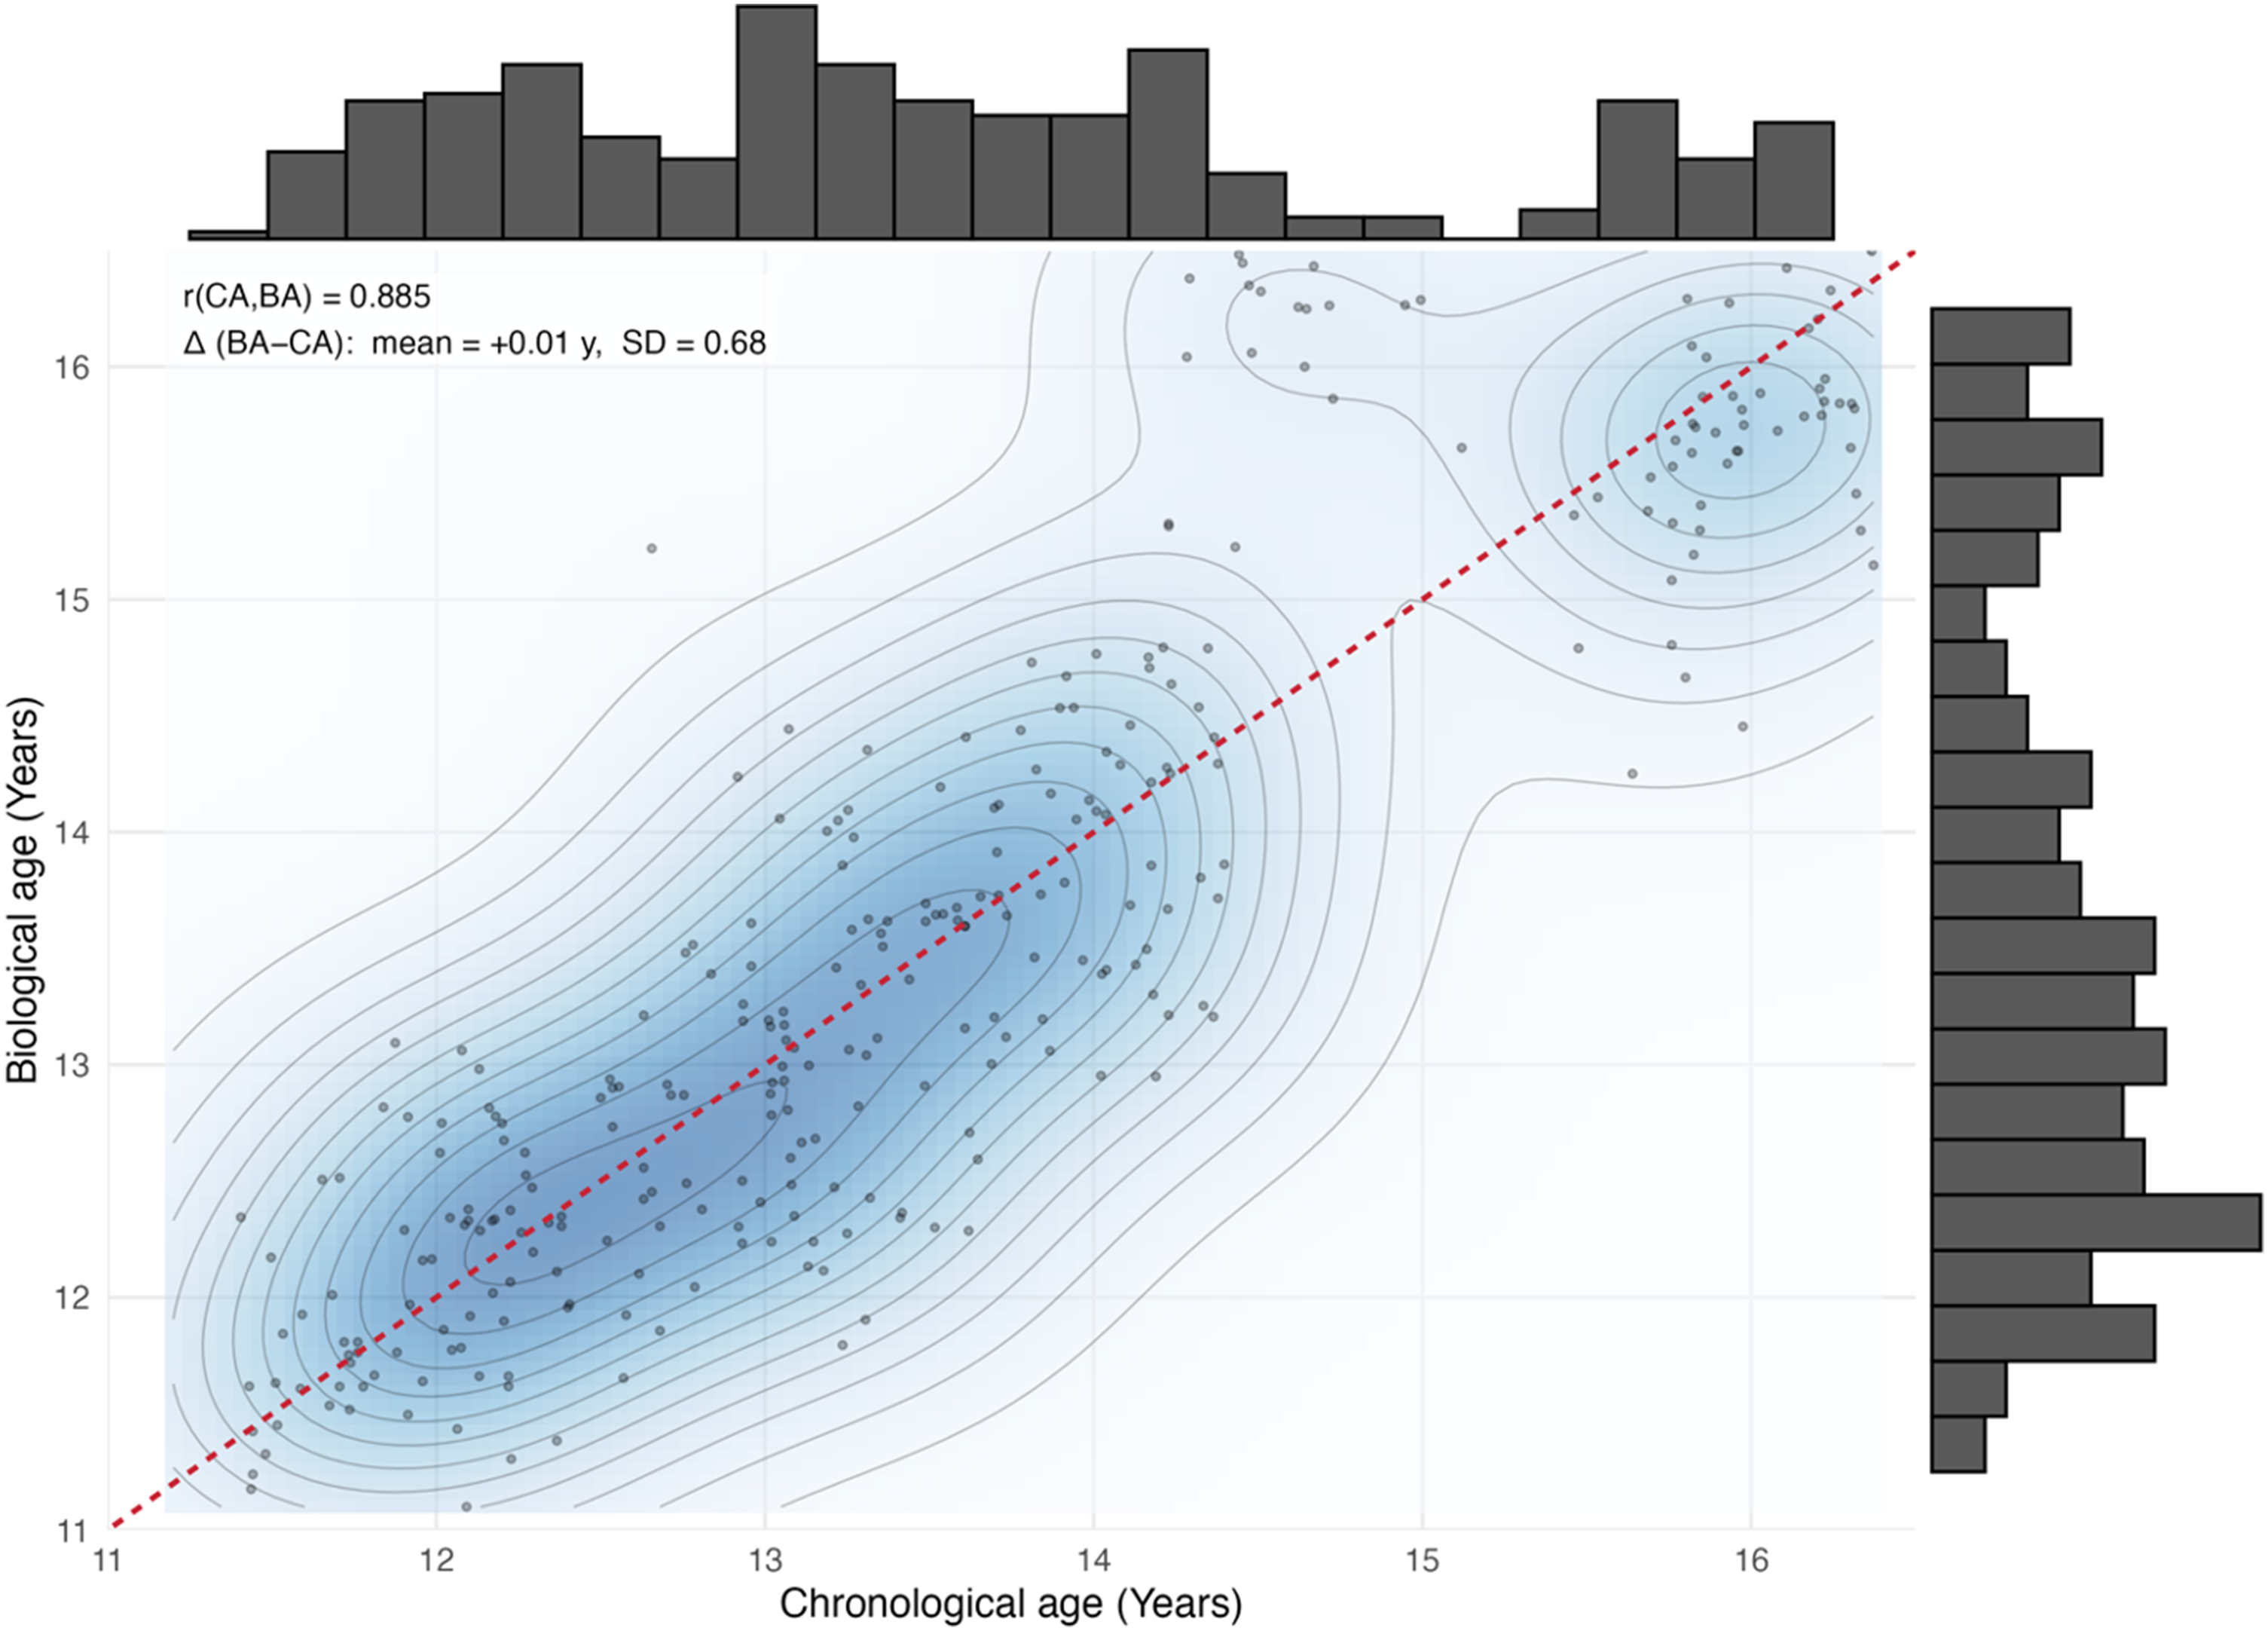
Scatter plot of chronological age (CA, x-axis) against biological age (BA, y-axis) for players within the presentation window 11.0–16.5 y. (The dashed red identity line marks BA = CA; points above/below indices the dashed red identity line marks BA = CA; points above/below indicate relatively advanced/delayed maturity. A blue kernel density background and thin contours show regions of higher joint concentration. Inset reports the correlation and maturity offset. Transparency is used to mitigate over plotting; axes ticked at integer years. The margins are populated with histograms of participant ages.
A strong correlation was observed between CA and BA (r = 0.89), but the density distribution reveals important non-uniformities in the sample. The darker regions between approximately 12.0 and 13.5 years indicate a densely populated area where CA and BA are well aligned, providing greater confidence in GAMLSS estimates across this age band. In contrast, participant density decreases markedly between 15 and 16 years, and although there is a small cluster between 16 and 16.5 years, these individuals tend to be biologically younger relative to their CA. These sparser regions imply greater uncertainty in the fitted models at older ages.
The marginal histograms further illustrate an asymmetrical age distribution. CA shows a higher concentration of participants between ∼12.0 and 13.5 years, whereas BA demonstrates a shift toward greater density between ∼13.0 and 14.5 years. This pattern suggests that, on average, the sample is biologically more advanced than their chronological ages alone would indicate.
GAMLSS modelling
Using centile trajectories, model diagnostics, and predictive accuracy metrics (supplementary file 6), clear conclusions emerge about different developmental trajectories between physical performance tests and secondly differences within outcomes when indexed to different age constructs. Taking an overall perspective, all outcomes improve with age, be that CA or BA, but the shape, timing, and variability of improvement differ by physical quality. The analysis undertaken affords the opportunity to explore how each quality, in the tests used, change with age and how these changes vary between them. Such an analysis is an important consideration for the coaches of adolescents, as it helps them understand the nature of each quality as unique and removes assumptions about possibly uniform development of physical performance over time. Considering the information provided by the range of GAMLSS conducted it could be stated that CA describes average trends of physical development, whereas biological age identifies more of the individual variability in this development.
Figure 2 presents the GAMLSS for each of the four different physical tests against CA, indicating that running velocity, jump height and MBT difference all increase markedly from circa 13 years, with increasing centile separation at this point. This trend continues for the MBT, whereas development appears to plateau from ∼15 years in running velocity, jump height and pro-agility time.
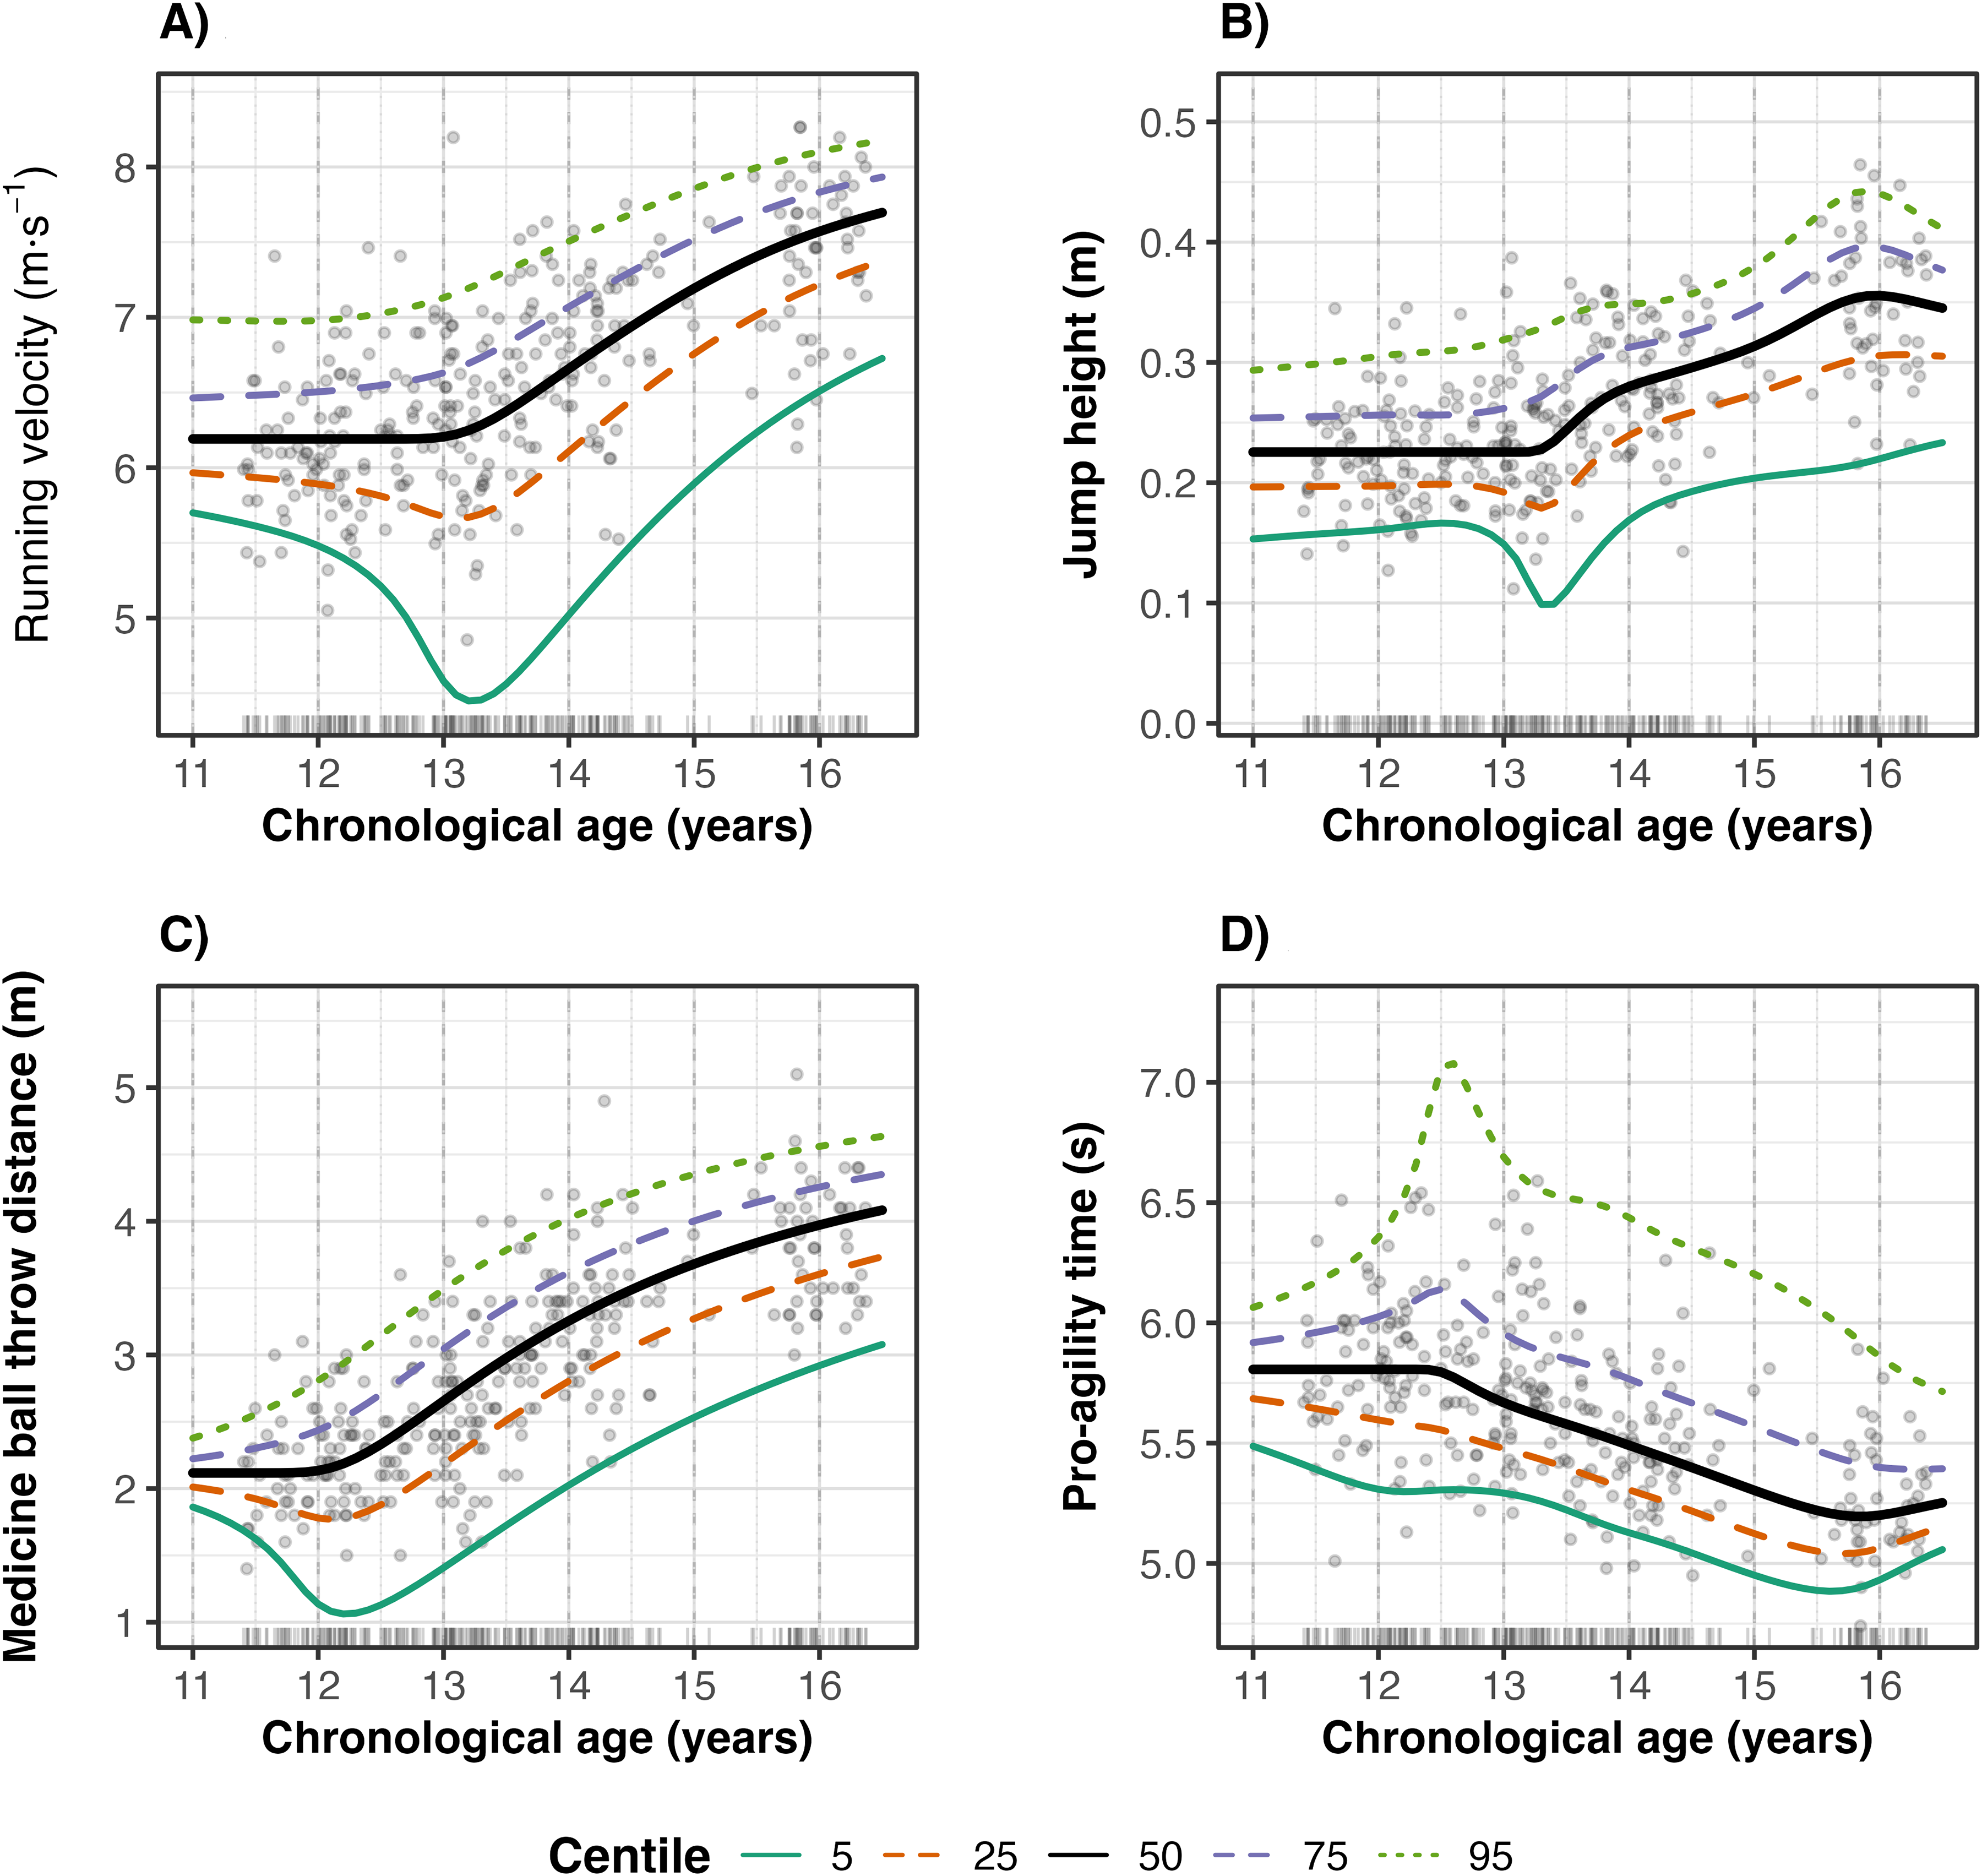
Illustration of the GAMLSS models with increasing chronological age, showing 5th, 25th, 50th, 75th and 95th percentiles for A) mean sprinting velocity (0–20m) B) Countermovement jump height, C) Medicine ball throw distance and D) Pro-agility test time.
Figure 3 shows the GAMLSS based on BA and illustrates an acceleration in performance ∼12.5–15, coinciding with the anticipated accelerated period of somatic growth around PHV and subsequent peak weight velocity (PWV). This acceleration is accompanied by a widening of the gap in centiles, suggesting greater individual variation between participants circa and post PHV, brought about by the timing and tempo of maturation. Post 15 years, greater variation in developmental trends can be observed. Running velocity maintain an upwards trajectory up to 16.5 years, Pro-Agility time stabilizes whereas MBT and Jump height show signs of decline. The full list of centile values for all physical performance tests, using both CA and CA can be found in supplementary file 7.
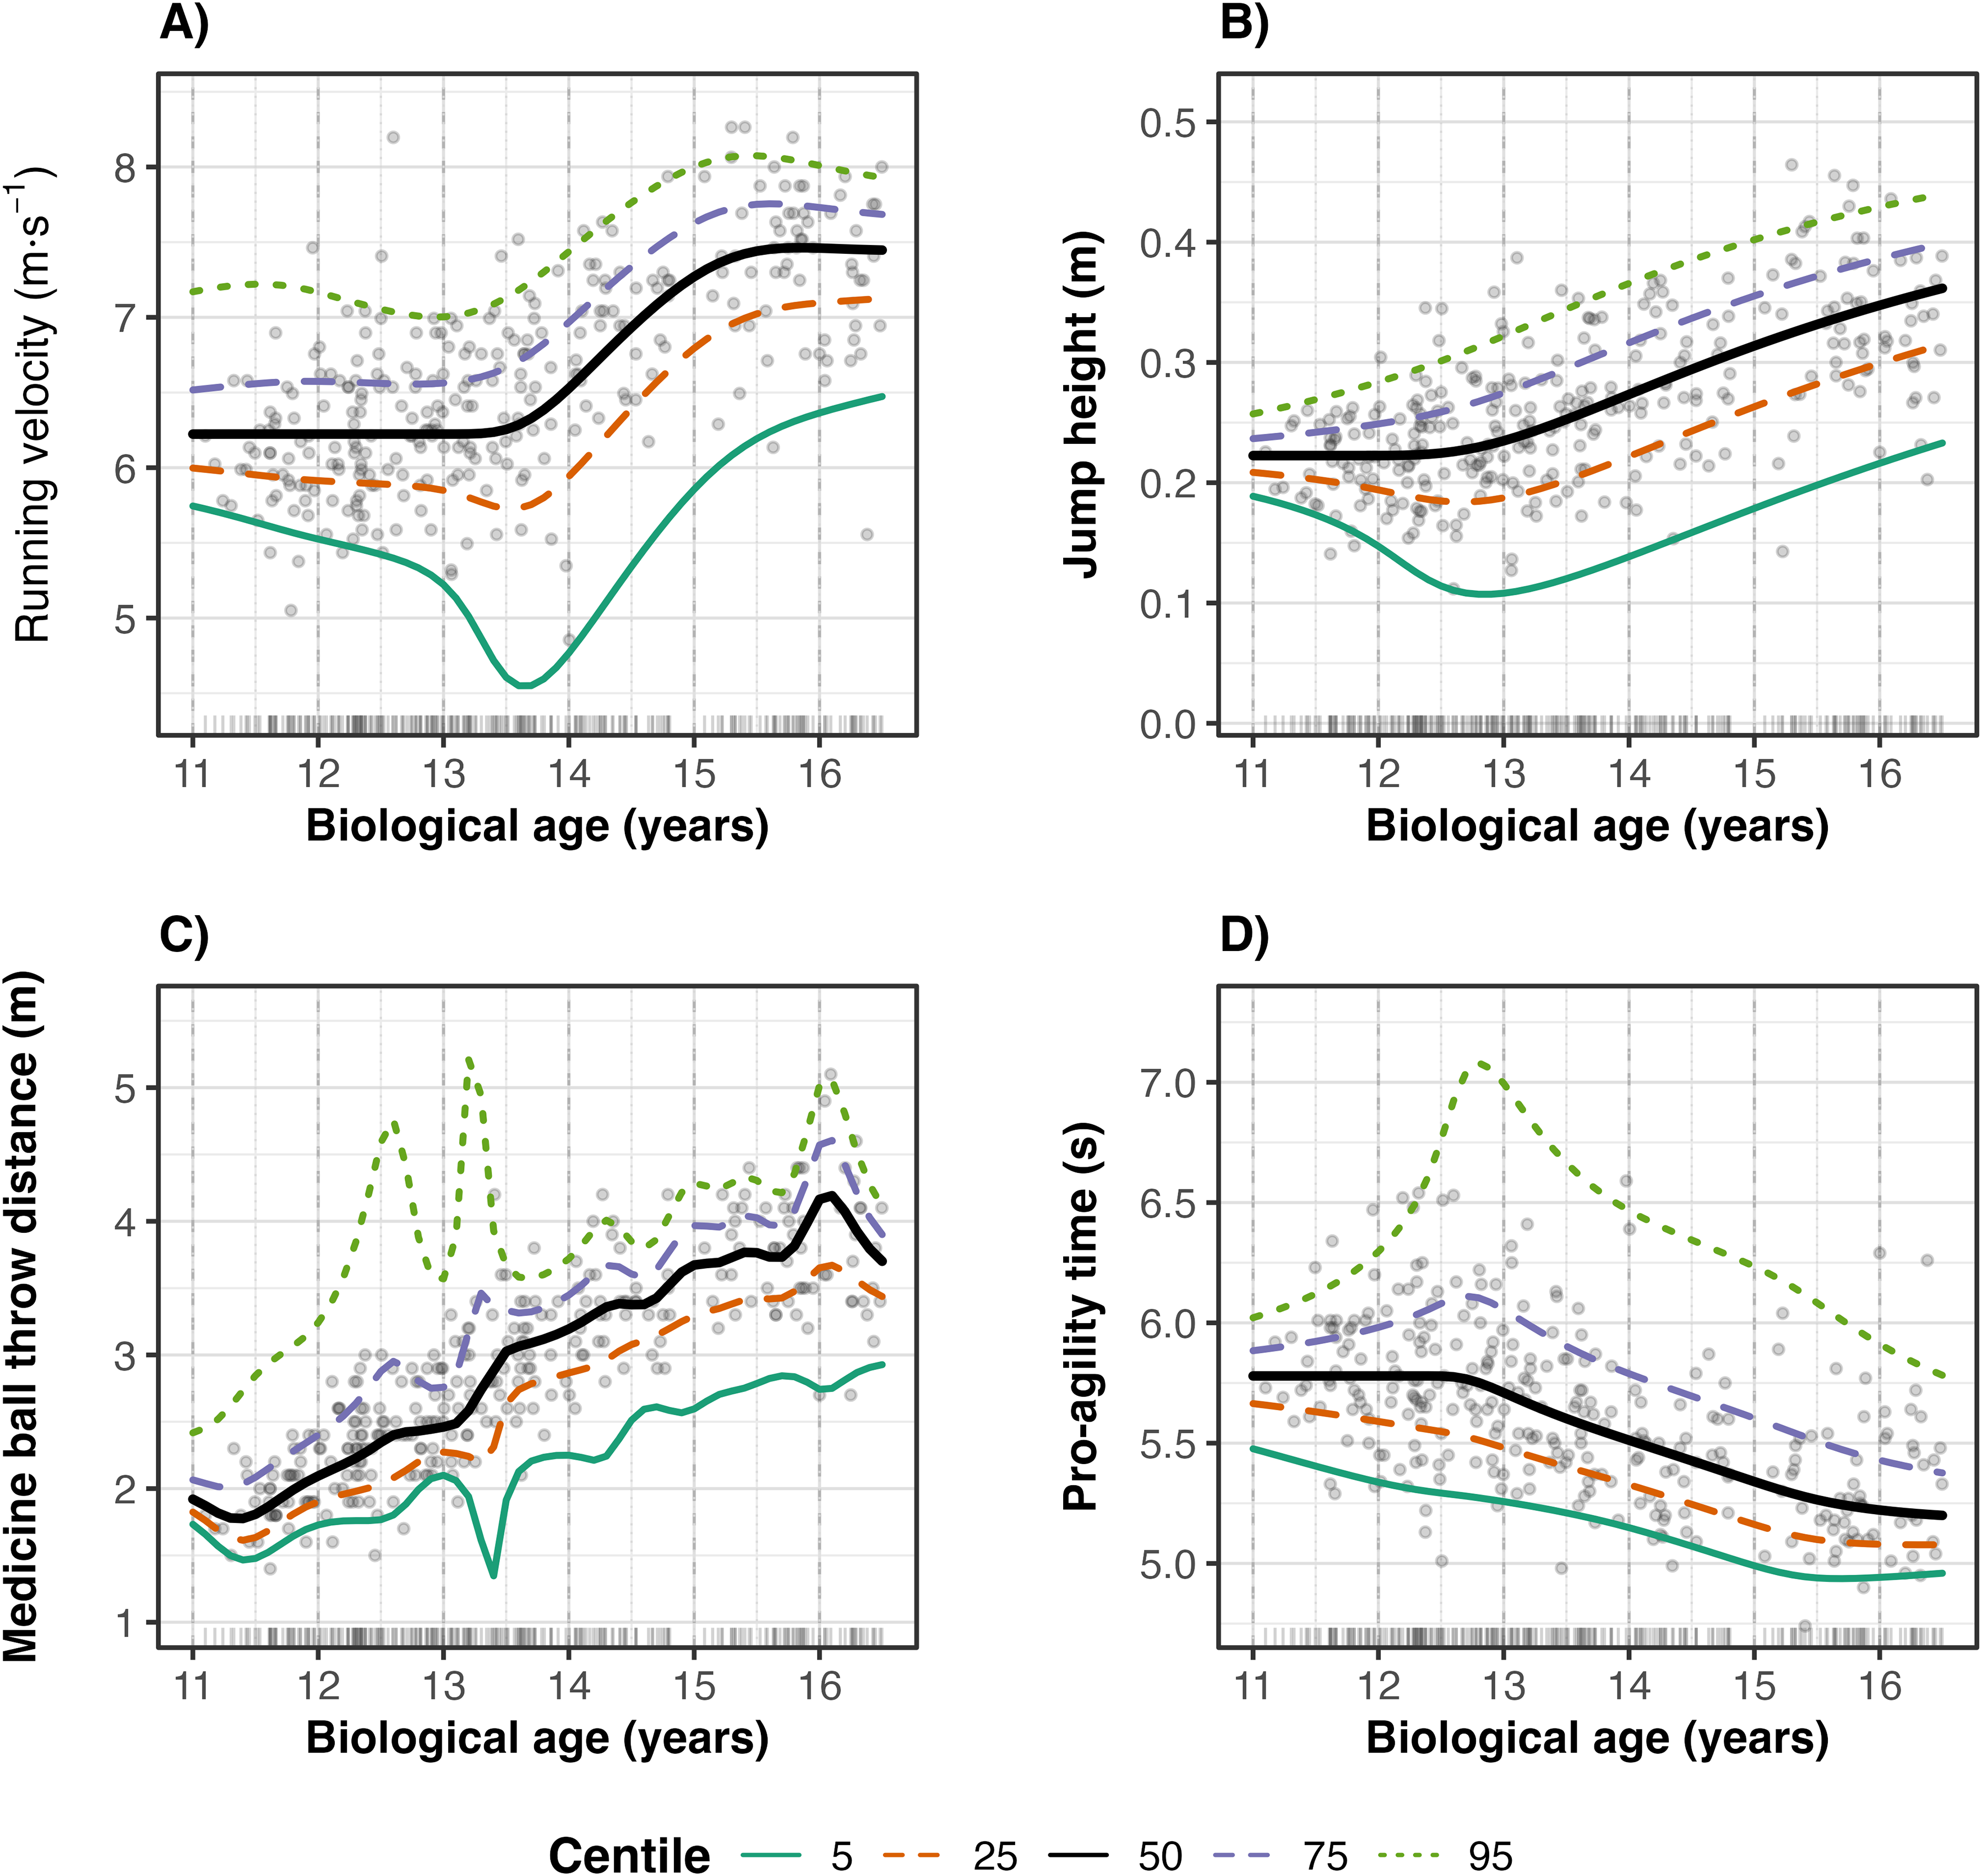
Illustration of the GAMLSS models with increasing biological age, showing 5th, 25th, 50th, 75th and 95th percentiles for A) mean sprinting velocity (0–20m) B) Countermovement jump height, C) Medicine ball throw distance and D) Pro-agility test time.
Z score analysis
Figure 4 visualizes paired CA and BA z-scores with points and connecting lines to highlight within-participant differences, accompanied by the results of the between age differences in z- scores of the participants. No statistical differences were observed in z-scores when derived by CA and BA, (p > 0.05, SMD < 0.2, in a all four tests). However, at the extremities of z-scores, there were individuals who had visually noticeable shifts in score between age types, suggesting these outliers are those individuals with greater scope for change when analysed by either CA or BA. Large shifts between Z scores across all four tests and were highlighted (increased CA to BA in blue, decreased CA to BA in green) in in Figure 4 to indicate individuals most sensitive to maturity adjustment. Inspection of Figure 4 does illustrate that many individuals, particularly at the outer ranges experienced large differences between CA and BA scores, with implications with how each value may be interpreted. The full list of participant z-scores for all physical performance tests, using both CA and CA can be found in supplementary file 8.
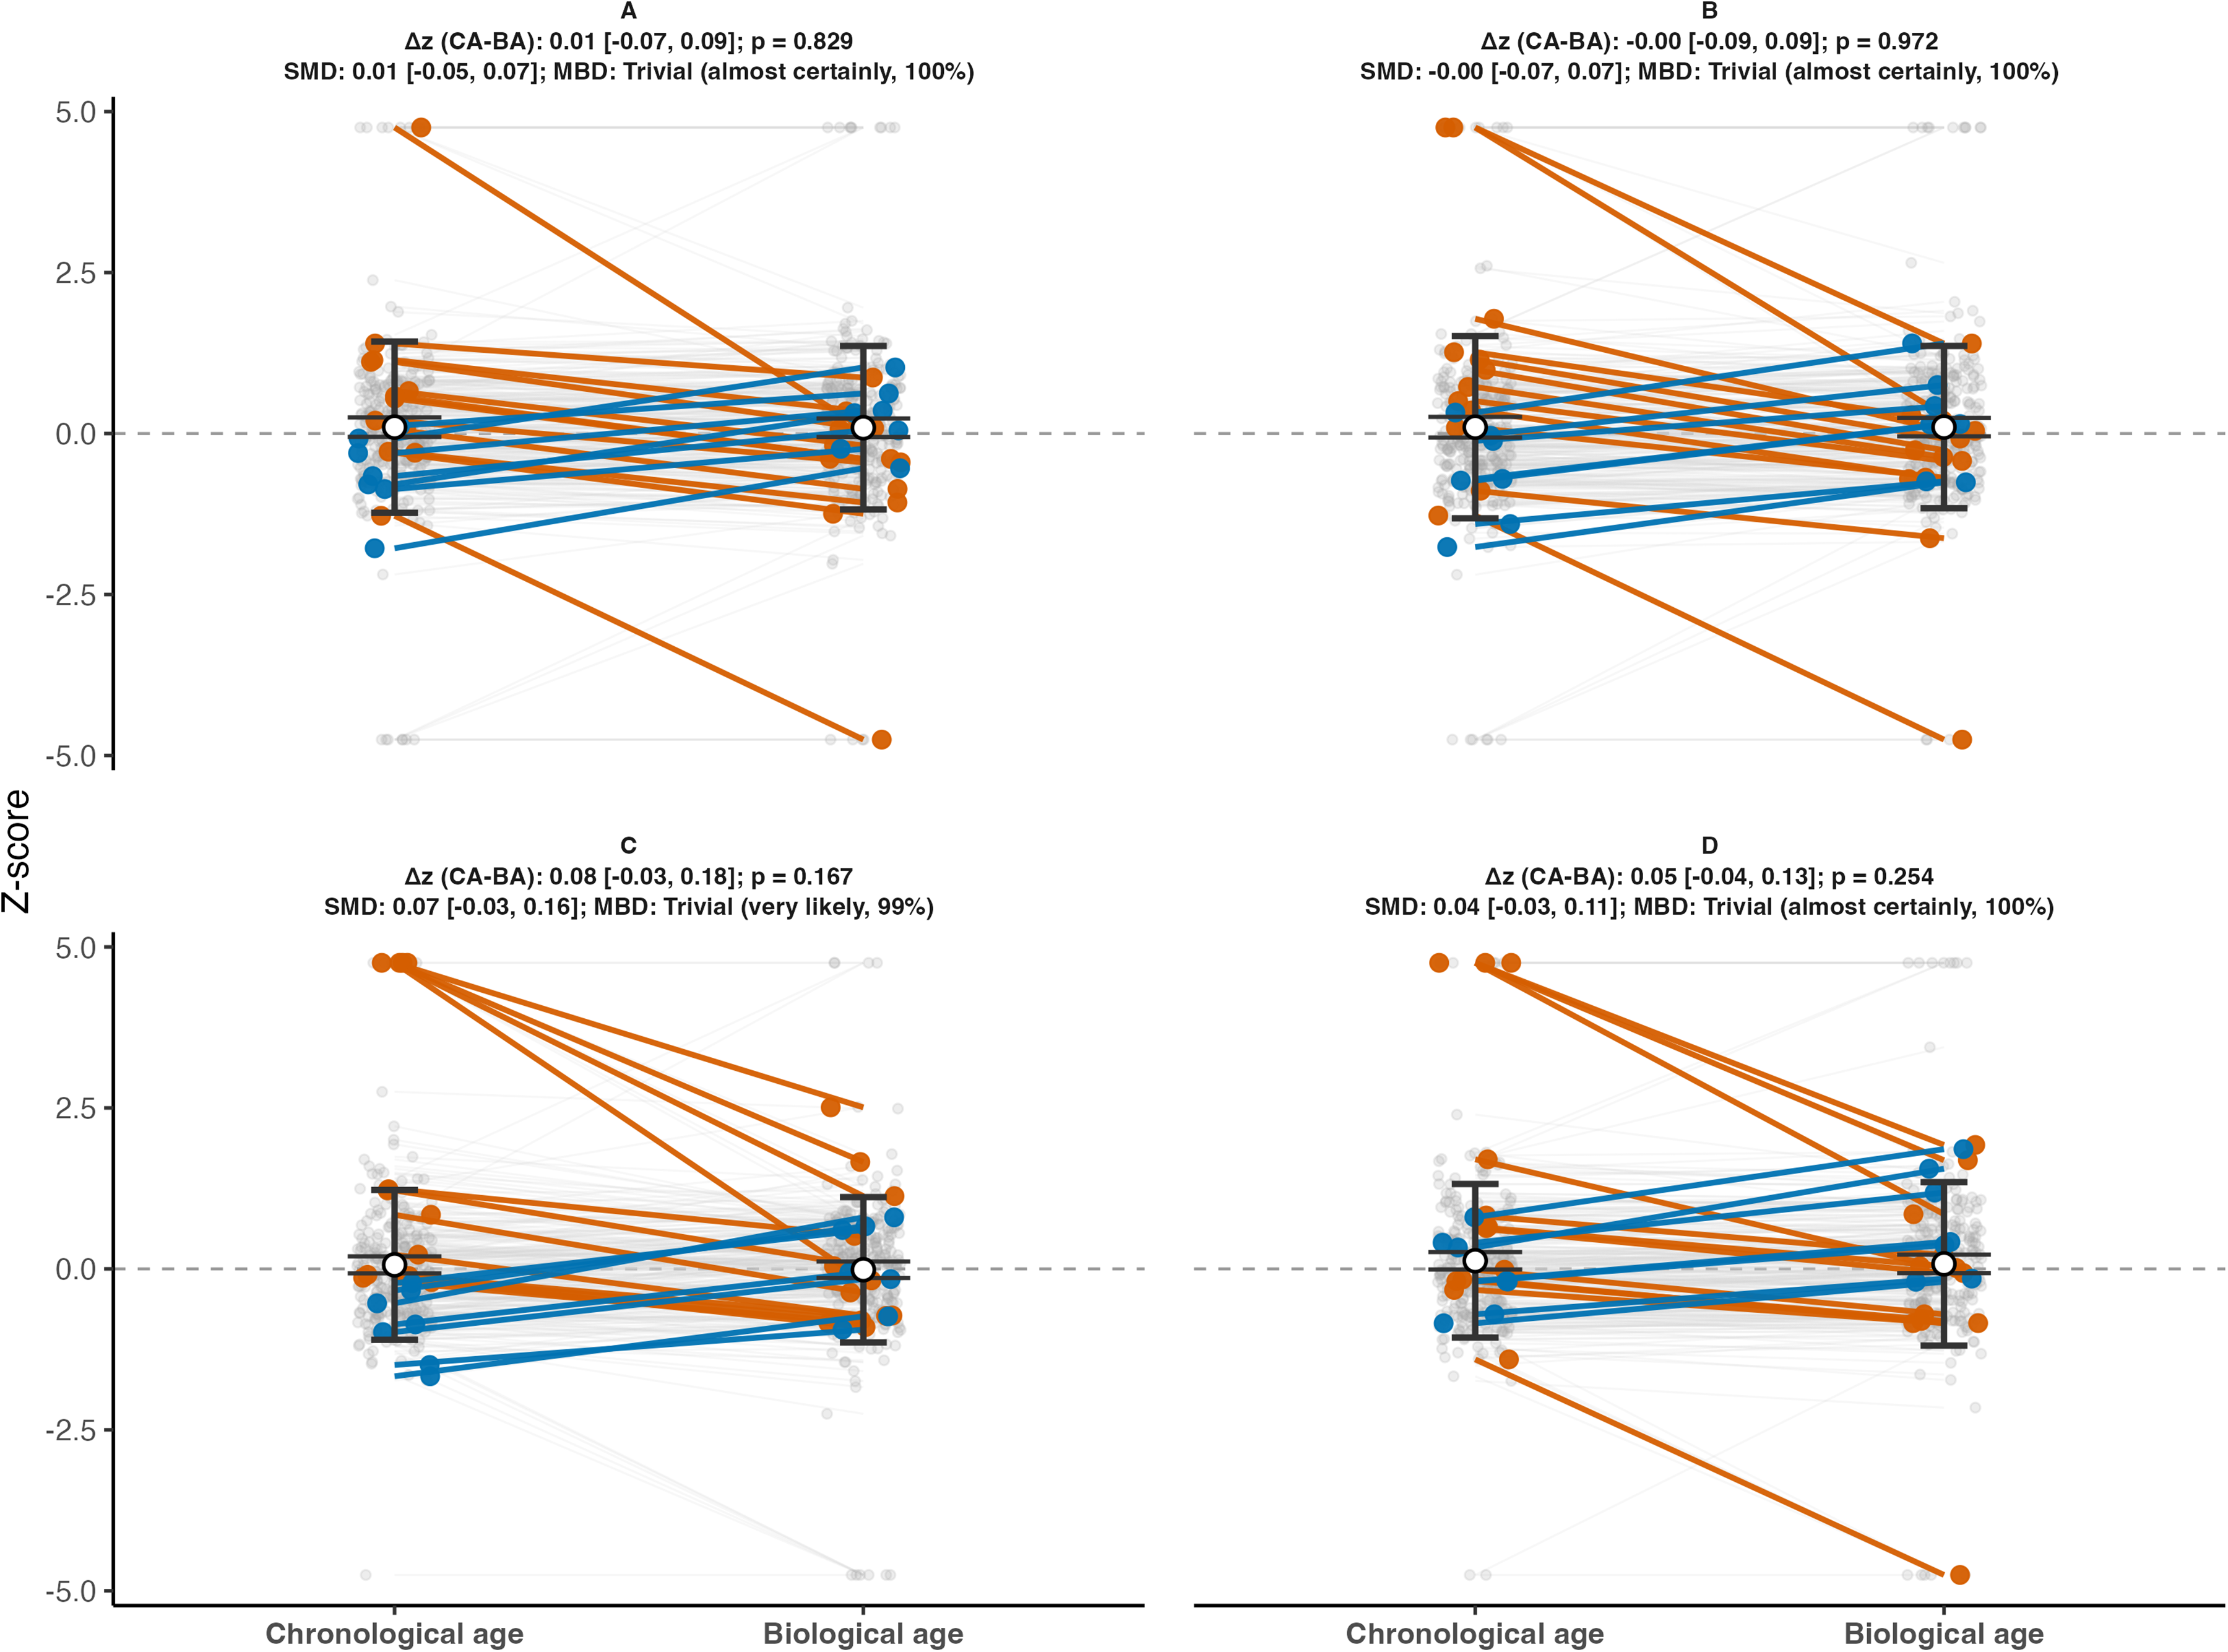
Comparison of performance z scores derived from chronological-age (CA) and biological-age (BA) reference curves across the whole sample, including magnitude-based decision summaries. Mixed-effects model estimate of the mean z score difference (Δz = CA − BA) with 95% confidence intervals (CI) and p value; the second line reports the standardised mean difference (SMD; Cohen's d using pooled SD) with 95% CI, and a magnitude based decision summary indicating the most likely region (meaningfully CA>BA, trivial, or meaningfully BA>CA) and its qualitative likelihood (based on the probability that ∣Δz∣exceeds the smallest worthwhile change). A) mean sprinting velocity (0–20m) B) Countermovement jump height, C) Medicine ball throw distance and D) Pro-agility test time.
Discussion
This is the first study to model the influence of age and maturation on off-ice physical qualities in UK-based youth male ice hockey players. The study makes two novel and notable contributions to the field. Firstly, it provides descriptive and benchmarking data for UK ice hockey players. Second, the study modelled the development of four commonly used physical tests, using both CA and BA, through adolescent maturation, which had not been previously reported. As such, this study makes a novel and valuable contribution to UK and international ice hockey, as well as to the broader field of youth athletic development.
Similar to previous research in youth athletes25,26,28 this study found general trends of improvement in physical qualities across both CA and BA from 11 to 16.5 years. The pattern of development of all four physical qualities with CA and BA were non-linear and varied between quality and age calculation. Analysis of age group differences found significant differences in all four measures from U12 to U15, but not between U15 and U16. This is shown in Figure 2, which models the development of each physical test, with CA and there is a visual plateau or decline from ∼15.5 years, with the exception of MBT distance. Figure 1C shows a continued upward trend in the MBT, through to 16.5 years; however, non-significant differences (p = 0.61, U15 = 3.7 ± 0.5 m, U16 = 3.9 ± 0.5 m) were found between the U15 and U16 groups during post-hoc testing, suggesting that these visual indicator of progression was markedly slower in these later ages.
Figure 3 replicates the trend observed in Figure 2 showing the progression of 20 m mean velocity and MBT during adolescence. Similarly to MBT by CA, there were non-significant differences in maturational groups D and E (p = 0.98, D = 7.2 ± 0.5 m·s−1, E = 7.3 ± 0.6 m·s−1), indicating a slower rate of increase, if at all. Collectively, the results from this sample provides clear evidence that whilst maturation does increase performance, in a range of physical qualities, the nature of the magnitude, timing and tempo vary between them. Furthermore, visual inspection of the centile differences in Figures 2 and 3 shows greater separation in BA models compared to CA. This separation between centiles suggests greater inter-individual variation when participants are categorised by BA, rather than CA, providing further evidence for considering maturity status when interpreting youth physical testing data.
A scientific theory emerges from the literature that age and maturation drive continued physical development in adolescent boys.25–28 These studies report continued development in boys VO2 max, CMJ26,28 standing long jump,26,28 flexed arm hang 25 and agility runs, 25 through to the age of 18. However, Ruf et al. 27 observed that sprint times improved with both CA and skeletal age until ∼15.5 years, with a plateauing apparent thereafter in both 5 m and 30 m distances. Tingelstad et al. 21 reviewed 176 studies which tracked the development of physical performance in adolescent team sport players (both males and females); however, none of these studies included ice hockey players. Similar to the findings of the current study, the results of the summarised data showed that boys continued to show increases in sprint speed, jump height, upper and lower strength, change of direction and aerobic fitness with age. When taken into consideration with the research conducting longitudinal modelling in non-sport specific, school-based participants.25–28 However, the studies cited above, with the exception of Ruf et al. 27 used only CA to model their data, where the novel contribution of the current study is a combined approach of using CA and BA to model four different physical qualities. From this modelling, an incongruence in evidence emerges between the findings of the current study and those that the prior theory may predict, warranting further exploration.
Two broad explanations exist for the diverse findings of the current study and prior literature, relative to the physical development after ∼15 years (both in CA and BA). The first could be one of falsification, such that this study provides data which disproves a potential theory of development, post 15 years. Philosophically speaking, the research community should be open minded about this as a possibility and not seek to dismiss evidence that does not corroborate the proposed theory. The second explanation is that there are some differences between this study and the prior research which would explain the incongruence, which is not to engage in a process of corroboration, but acknowledge how methods influence data. Variations in the nature of the sample, physical qualities measured and the tests used may all influence how the data presents itself, notwithstanding the manner in which the data is analysed. For example, prior studies generated reference curves using the LMS procedure, the centiles in this study were derived using an LMS-type GAMLSS framework (BCCG). However, these methodological differences are unlikely to fully explain the divergence in late-adolescent trends, unless there was a difference in the nature of the samples measured.
Figure 1 illustrated that there was an uneven distribution of participants, with respect to ages. More specifically, it is more densely populated between the ages of 11 and 14 and less so between 15 and 16. Of those participants who were >15 years, there were a higher proportion who were biologically younger than their CA. These participants were therefore more likely to perform to a lower level than those who are more biological advanced than their CA, thus creating the appearance of plateau or negative trend. The second issue that potentially creates this trend, and may be different from other similar modelling approaches,25–28 is the behaviour of the model when there is sparse data at the extremities of the model. Cole 40 has shown, that both sample size and sample composition across ages materially affect the precision and stability of reference centiles, when using GAMLSS modelling, and that uneven age distributions can alter the effective information supporting the curve at specific ages. The pattern of age distribution, shown in Figure 1, indicates that the oldest ages in the model window are supported by substantially fewer data points, which increases uncertainty in the fitted centiles and makes the shape of the curve beyond ∼15y more vulnerable to sampling variability and smoothing choices. The previous research in this area have not provided a similar method displaying the data and so no certainty can be had as to whether the variation in the shape of development between studies can be explained by sample distribution and composition, but it does seem plausible.
Whilst explanations exist for the apparent plateau or decline in performance at the upper end of the age range, such as sparse sampling, this does not render the reference curves “wrong.” Instead, it clarifies their meaning. The fitted centiles provide an internally consistent, smoothed summary of the showcase cohort, with model diagnostics indicating generally acceptable fit: z-score residual means were near zero, variances near one, and Filliben correlations high (≈0.96–0.997), supporting approximate normality. Test-set prediction errors were moderate (CA RMSE ≈6–23%; BA RMSE ≈5–20%) suggesting the curves capture central tendencies reasonably well. However, residual kurtosis values indicate greater uncertainty in the tail, particularly in the CA models, where kurtosis exceeded the Gaussian benchmark for 20 m sprint velocity (4.53), medicine-ball throw (6.74), and pro-agility (3.91), with CMJ height closer to normal-like behaviour. These heavier tails imply that extreme centiles, and any subtle late-age flattening, should be interpreted cautiously, especially because older ages were supported by fewer observations and are more prone to smoothing “edge effects.” Accordingly, the curves serve as valid normative benchmarks for this specific event sample, while acknowledging that the late-age trajectory may be less generalisable if older participants were under-sampled or unrepresentative, an important interpretive nuance in normative-curve research.
Limitations
The sample comprised 347 youth male ice hockey players who attended an end-of-season EIH showcase via coach-led invitation, which was reportedly based on season performance. Although the showcase was not part of a formal national talent identification programme, the invitation-based process is likely to favour players perceived as higher performing within their teams and therefore may over-represent relatively older athletes within annual-age groups (RAE) and/or more biologically mature players. This selection skew can inflate upper centiles in youth cohorts and temper generalisability beyond this competitive tier. Consequently, the centile curves generated in this study should be interpreted as reference values for this competitive showcase cohort rather than population-representative normative data for all UK youth ice hockey players. Generalisation beyond this competitive context, either to the wider participation base or to nationally selected elite populations, should therefore be made cautiously. Future research should seek to replicate these models within samples with clearly defined competitive standards, stratify reference curves by playing level where possible, and validate the curves in an independent cohort.
The GAMLSS diagnostics suggested broadly adequate fit, elevated kurtosis in some outcomes indicates heavier tails and greater uncertainty in extreme centiles, and prediction errors were moderate for certain measures This is likely do to the cross-sectional design and recruitment from a single, fee-based showcase event, used in this study, introducing a bias to the composition of the sample. Consequently, these factors reduce the generalisability beyond the observed cohort of UK youth male players aged ∼11–16.5 years. Developmental curves therefore describe age-graded differences between athletes rather than within-athlete change, and the upper end of the age range is supported by fewer observations, increasing susceptibility to boundary effects in smoothed centile modelling. To address this shortcoming, repeating this process yearly to enlarge the data set and collect repeat measures on those selected on multiple occasions adds a longitudinal element to the study.
The study estimated maturity status was using maturity offset/APHV equations that have known limitations, 41 especially for early and late maturers, meaning biological-age inferences should be interpreted cautiously. Other methods of maturity assessment are possible such as skeletal age and the Khamis-Roche equation. 42 Although determination of skeletal age provides greater accuracy, it is not feasible (time, resources, expertise, etc.) in most sport science settings. Future work should consider somatic maturity indicators based on percentage of predicted adult height (PAH%), such as the Khamis–Roche method, 42 which predicts adult stature without skeletal age and enables maturity classification via PAH%. This may offer a useful alternative to maturity-offset equations, which show systematic error particularly in early and late maturing youth. 15
Finally, the testing battery was constrained by the showcase context and did not include access to on-ice or broader physiological measures, limiting inference about performance transfer and the full determinants of physical development in youth ice hockey. Future iterations of this research should consider the scheduling constraints of the event and seek to incorporate tests of additional qualities such as upper and lower body maximal strength, due to the time demands and fatiguing nature of the tests, aerobic and anaerobic tests would not be feasible. However, it may be possible to include one on-ice test, such as a test linear skating speed.
Practical applications
This study provides UK-based ice hockey coaches and physical performance staff with the first reference benchmarks for linear sprint speed, CoDs, upper- and lower-body rapid force production, to profile 11–16.5-year-old players. Crucially, the provision of both CA and BA percentiles and Z-scores enables practitioners to assess physical abilities relative to either developmental metric, offering a more equitable and developmentally sensitive approach to athlete evaluation.
To demonstrate the practical importance of considering both CA and BA when benchmarking and monitoring player development, a representative case study (Participant X) is presented. Participant X was a U16 male player with a chronological age of 15.64 years and a biological age of 14.25 years, indicating delayed biological development relative to his CA. His predicted age at PHV was 15.37 years, placing him circa-PHV at the time of testing. Figure 5 illustrates how his performance ranking changes considerably when indexed to BA.
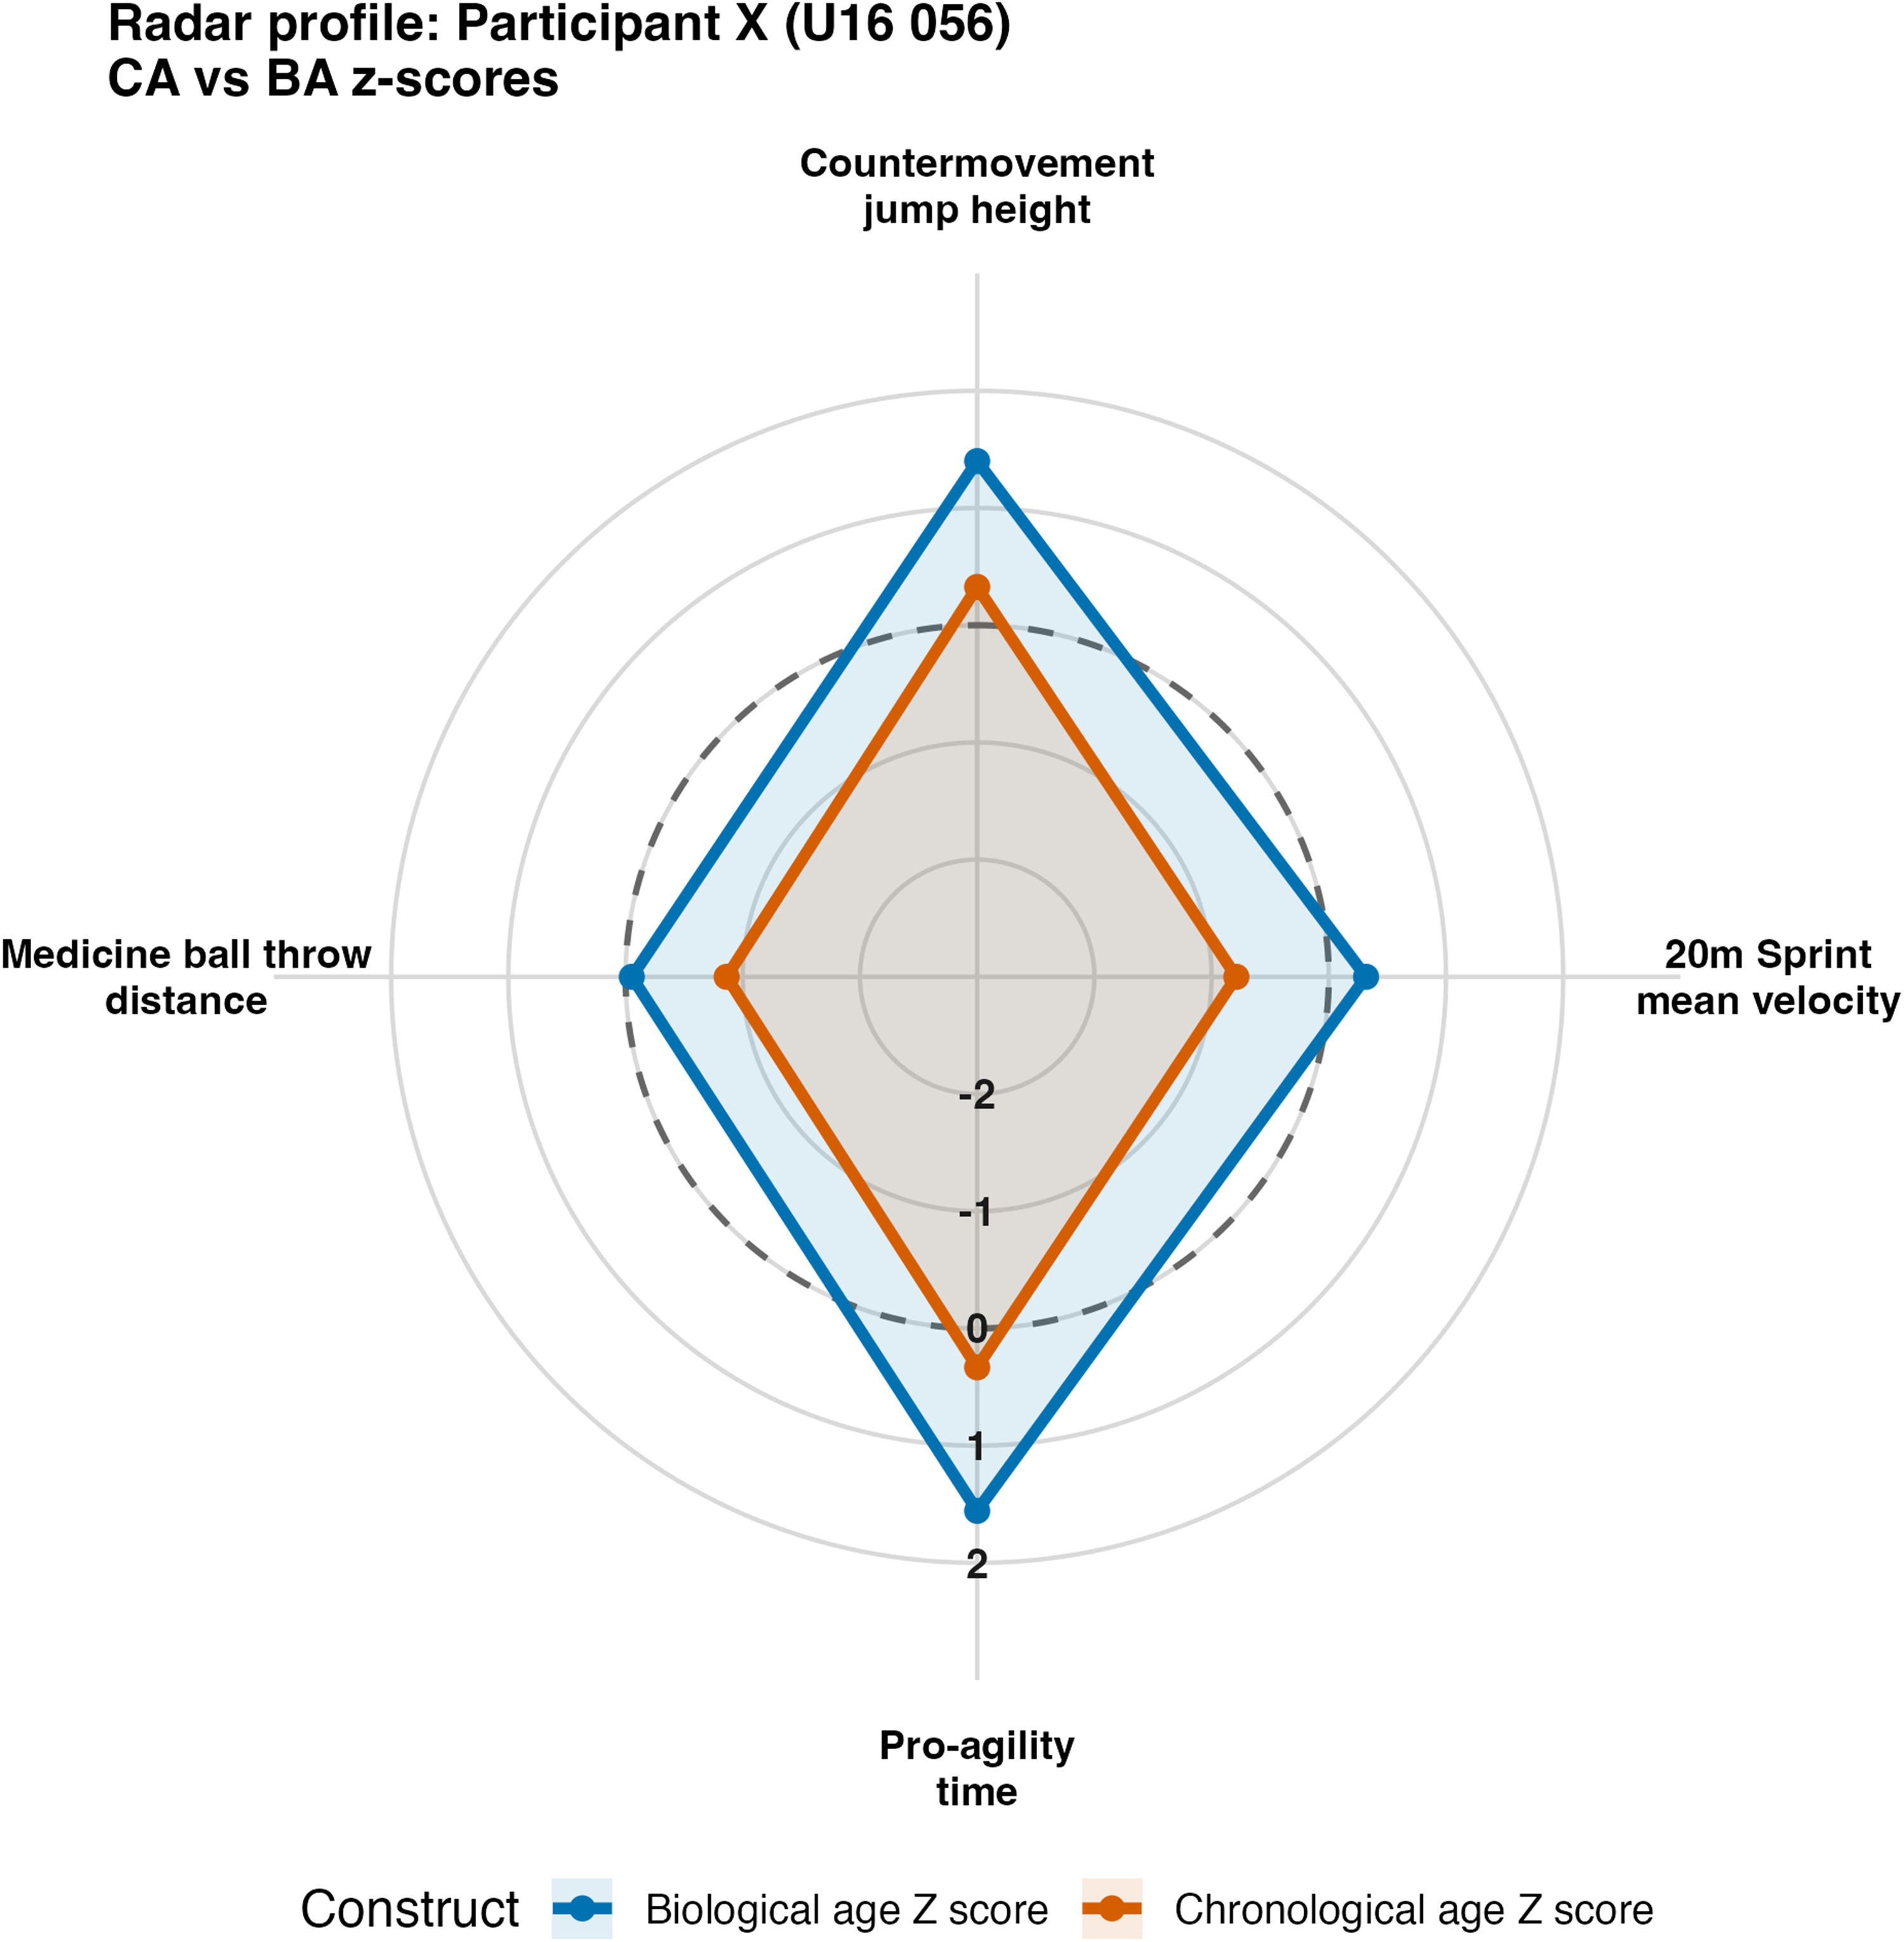
A radar plot illustrating the variance in Z scores for Participant X in the four physical tests, when analysed by both chronological and biological age.
Participant X recorded a 20 m sprint mean velocity of 6.94 m·s−1, a CMJ height of 0.368 m, a 3.3 m seated MBT, and a pro-agility time of 5.12 s. When benchmarked against CA-based reference values, his performance appeared mixed, ranging from the 19th percentile (MBT) to the 63rd percentile (CMJ). However, when the same performance was referenced to BA-based benchmarks, his percentiles increased across all measures, placing him between the 62nd and 94th percentiles. Consequently, Participant X shifted from being perceived as one of the lower performers in his CA group to one of the strongest performers among biologically similar peers.
From an applied perspective, this case highlights how CA-only profiling can lead to misinterpretation of an athlete's physical abilities, particularly in speed and upper-body power, when biological maturation lags behind CA. For Participant X, BA-adjusted benchmarking reveals that his movement skill and change-of-direction capabilities are strengths relative to biological peers, and that perceived CA-based “deficits” may instead reflect normal maturation timing. To supplement the practical utility of this data a shinyapp has been produced which reproduces each participants data, as shown in Figure 5, along with their test data (https://dr-mark-helme.shinyapps.io/spider_app/)
Practically, these insights support avoiding negative selection decisions based solely on CA and emphasise the value of ongoing monitoring and targeted development (e.g., progressive strength and power training, sprint mechanical efficiency, and maintenance of COD quality) as athletes progress through maturation.
Conclusions
This study provides the first reference dataset describing off-ice physical performance in UK youth male ice hockey players and uniquely models their development using both CA and BA. The findings demonstrate clear, non-linear improvements across sprinting, jumping, throwing, and change-of-direction performance, with the most rapid progression occurring around the timing of PHV. By applying GAMLSS modelling, the study highlights how biological maturation meaningfully shifts athletes’ relative standing, underscoring the importance of integrating biological age into assessment and development practices. These insights offer a robust evidence base to support more equitable and developmentally informed talent identification and development within UK youth ice hockey.
Supplemental Material
sj-docx-1-spo-10.1177_17479541261453049 - Supplemental material for Modelling the development of physical qualities in UK youth male ice hockey players by chronological and biological age
Supplemental material, sj-docx-1-spo-10.1177_17479541261453049 for Modelling the development of physical qualities in UK youth male ice hockey players by chronological and biological age by Ashley Jones, Rupert Quiney, Sam Kelvey, Eleanor Travis, Ieuan Cranswick, Chris Brogden, Joey Eisenmann, Kevin Till and Mark Helme in International Journal of Sports Science & Coaching
Supplemental Material
sj-R-2-spo-10.1177_17479541261453049 - Supplemental material for Modelling the development of physical qualities in UK youth male ice hockey players by chronological and biological age
Supplemental material, sj-R-2-spo-10.1177_17479541261453049 for Modelling the development of physical qualities in UK youth male ice hockey players by chronological and biological age by Ashley Jones, Rupert Quiney, Sam Kelvey, Eleanor Travis, Ieuan Cranswick, Chris Brogden, Joey Eisenmann, Kevin Till and Mark Helme in International Journal of Sports Science & Coaching
Supplemental Material
sj-pdf-3-spo-10.1177_17479541261453049 - Supplemental material for Modelling the development of physical qualities in UK youth male ice hockey players by chronological and biological age
Supplemental material, sj-pdf-3-spo-10.1177_17479541261453049 for Modelling the development of physical qualities in UK youth male ice hockey players by chronological and biological age by Ashley Jones, Rupert Quiney, Sam Kelvey, Eleanor Travis, Ieuan Cranswick, Chris Brogden, Joey Eisenmann, Kevin Till and Mark Helme in International Journal of Sports Science & Coaching
Supplemental Material
sj-pdf-4-spo-10.1177_17479541261453049 - Supplemental material for Modelling the development of physical qualities in UK youth male ice hockey players by chronological and biological age
Supplemental material, sj-pdf-4-spo-10.1177_17479541261453049 for Modelling the development of physical qualities in UK youth male ice hockey players by chronological and biological age by Ashley Jones, Rupert Quiney, Sam Kelvey, Eleanor Travis, Ieuan Cranswick, Chris Brogden, Joey Eisenmann, Kevin Till and Mark Helme in International Journal of Sports Science & Coaching
Supplemental Material
sj-pdf-5-spo-10.1177_17479541261453049 - Supplemental material for Modelling the development of physical qualities in UK youth male ice hockey players by chronological and biological age
Supplemental material, sj-pdf-5-spo-10.1177_17479541261453049 for Modelling the development of physical qualities in UK youth male ice hockey players by chronological and biological age by Ashley Jones, Rupert Quiney, Sam Kelvey, Eleanor Travis, Ieuan Cranswick, Chris Brogden, Joey Eisenmann, Kevin Till and Mark Helme in International Journal of Sports Science & Coaching
Supplemental Material
sj-xlsx-6-spo-10.1177_17479541261453049 - Supplemental material for Modelling the development of physical qualities in UK youth male ice hockey players by chronological and biological age
Supplemental material, sj-xlsx-6-spo-10.1177_17479541261453049 for Modelling the development of physical qualities in UK youth male ice hockey players by chronological and biological age by Ashley Jones, Rupert Quiney, Sam Kelvey, Eleanor Travis, Ieuan Cranswick, Chris Brogden, Joey Eisenmann, Kevin Till and Mark Helme in International Journal of Sports Science & Coaching
Supplemental Material
sj-xlsx-7-spo-10.1177_17479541261453049 - Supplemental material for Modelling the development of physical qualities in UK youth male ice hockey players by chronological and biological age
Supplemental material, sj-xlsx-7-spo-10.1177_17479541261453049 for Modelling the development of physical qualities in UK youth male ice hockey players by chronological and biological age by Ashley Jones, Rupert Quiney, Sam Kelvey, Eleanor Travis, Ieuan Cranswick, Chris Brogden, Joey Eisenmann, Kevin Till and Mark Helme in International Journal of Sports Science & Coaching
Supplemental Material
sj-xlsx-8-spo-10.1177_17479541261453049 - Supplemental material for Modelling the development of physical qualities in UK youth male ice hockey players by chronological and biological age
Supplemental material, sj-xlsx-8-spo-10.1177_17479541261453049 for Modelling the development of physical qualities in UK youth male ice hockey players by chronological and biological age by Ashley Jones, Rupert Quiney, Sam Kelvey, Eleanor Travis, Ieuan Cranswick, Chris Brogden, Joey Eisenmann, Kevin Till and Mark Helme in International Journal of Sports Science & Coaching
Footnotes
ORCID iDs
Ethical considerations
Ethical approval was gained from the Leeds Beckett University institutional ethics committee (Ref: 131647) and was performed in accordance with the standards of ethics outlined in the Declaration of Helsinki.
Consent to participate
All parents of participants were provided information prior to the study and gave written informed consent prior to participating.
Consent for publication
All parents of participants were provided information prior to the study and gave written informed consent for their anonymised data to be published.
Author contributors
Funding
The authors received no financial support for the research, authorship, and/or publication of this article.
Declaration of conflicting interests
The authors declared no potential conflicts of interest with respect to the research, authorship, and/or publication of this article.
Declaration of generative AI and AI-assisted technologies in the writing process’
During the preparation of this work the author(s) used Microsoft CoPilot in order to edit and proof the quality of English of the manuscript and support the generation of the R script. After using this tool/service, the author(s) reviewed and edited the content as needed and take(s) full responsibility for the content of the publication.
Data availability
A copy of the data set has been made available in the Leeds Beckett Data repository.
Supplemental material
Supplemental material for this article is available online.
References
Supplementary Material
Please find the following supplemental material available below.
For Open Access articles published under a Creative Commons License, all supplemental material carries the same license as the article it is associated with.
For non-Open Access articles published, all supplemental material carries a non-exclusive license, and permission requests for re-use of supplemental material or any part of supplemental material shall be sent directly to the copyright owner as specified in the copyright notice associated with the article.