
Abstract
This study aimed to investigate the effects of different saddle height setting methods and fatigue on lower limb kinematics during indoor cycling in recreational cyclists. Twelve recreational male cyclists completed indoor cycling randomly using three saddle height setting methods—trochanteric length method (TLM), LeMond method (LMM) and knee angle method (KAM)—performed a fatigue protocol. Sagittal-plane ankle, knee and hip kinematic data were collected. Extracted ankle, knee and hip angles at top dead center (TDC), bottom dead center (BDC) and range of motion (ROM) for data analysis. A two-way repeated-measures ANOVA was conducted to examine the main effects of saddle height, fatigue and their interaction. This study found that saddle height setting methods significantly influenced ankle and knee kinematics. Compared with KAM and LMM, TLM resulted in greater ankle (p = 0.01) and knee (p = 0.01) ROM, as well as reduced knee flexion at TDC (p = 0.01) and reduced knee extension at BDC (p = 0.01). Fatigue significantly reduced ankle (p = 0.02) and hip (p = 0.01) angles at TDC but did not affect knee kinematics. A significant saddle height × fatigue interaction was observed only for hip range of motion (p = 0.04), with a post-fatigue increase occurring exclusively under LMM condition. Saddle height setting methods substantially influence lower-limb kinematics during cycling, while fatigue induces joint-specific adaptations. Recreational cyclists should consider that different setting methods produce distinct effective heights that influence joint responses to fatigue.
Introduction
Indoor cycling (IC) has become a popular cardiovascular training modality, yet both recreational and competitive cyclists are prone to overuse injuries of the lower extremities—such as patellofemoral pain, quadriceps tendinopathy, medial tibial stress syndrome, chronic exertional compartment syndrome and metatarsalgia 1 —largely due to biomechanical inefficiencies. Improper bicycle setup, particularly inappropriate saddle height setting methods, is a key contributor as it alters joint loading patterns and pedaling mechanics.2,3 For recreational cyclists, who may lack professional fitting guidance, the risk of suboptimal saddle configuration is especially high. Therefore, evidence-based saddle height prescription is critical for minimizing injury risk and promoting efficient cycling mechanics.
Saddle height setting is a critical determinant of lower limb biomechanics during cycling, and several methods have been developed to determine it. The most widely used include the Trochanteric Length Method (TLM), LeMond Method (LMM), and Knee Angle Method (KAM). The TLM sets saddle height at 100% of the vertical distance from the greater trochanter to the floor, 4 the LMM uses 88.3% of the inseam length, 5 and KAM adjusts saddle height to achieve approximately 30° of knee flexion when the pedal is at bottom dead center (BDC), 6 which defined as the 6 o’clock position of the crank cycle. These methods differ fundamentally in their theoretical basis: TLM and LMM are static, anthropometry-based formulas, whereas KAM is a dynamic, biofeedback-oriented approach that directly targets joint angle. Consequently, they yield different effective saddle heights for the same individual. Previous studies examining the effects of saddle height on kinematics have reported inconsistent findings. For example, Nordeen-Snyder 4 and Price and Donne 7 found that increasing saddle height led to decreased knee flexion and increased ankle angles, while hip joint remained largely unaffected. Sanderson and Amoroso 8 also reported increased ankle and knee range of motion (ROM) with higher saddle heights. In contrast, Bini et al. (2010) observed greater ankle ROM at lower saddle heights but limited effects on hip and knee angles. 9 However, these studies have primarily manipulated saddle height as a continuous variable, rather than comparing the specific setting methods—with its underlying theoretical basis—has an effect on lower-limb kinematics beyond that attributable to height alone. Furthermore, prior research has largely been confined to non-fatigue, steady-state conditions, leaving a gap on how different saddle-height prescription methods influence kinematics under fatigue conditions.
Fatigue is an inevitable physiological response during prolonged or high-intensity cycling, particularly in time trials, hill climbing or interval training. Sessions exceeding 30 minutes have been shown to induce significant muscular fatigue,10,11 which may impair neuromuscular control and alter joint coordination patterns,12,13 potentially compromising movement efficiency and increasing injury risk. From a neuromuscular perspective, fatigue-induced impairments in proprioception 14 and motor unit recruitment 15 can lead to decreased joint stiffness and increased joint laxity, potentially manifesting as greater joint excursions during the pedaling cycle. Previous studies have demonstrated that fatigue can modify lower-limb kinematics during cycling, although the direction and magnitude of these changes appear to be joint-specific. For example, fatigue during cycling has been associated with increased ankle dorsiflexion and hip ROM, whereas knee joint kinematics remain relatively stable during submaximal cycling tasks.12,16 These fatigue-related changes are generally small to moderate in magnitude but may reflect compensatory strategies aimed at maintaining pedaling effectiveness and power output as muscular fatigue develops. Similarly, Bini and Diefenthaeler (2010) observed kinematic changes in the lower extremities during incremental cycling to exhaustion, indicating that fatigue may affect pedaling mechanics and joint coordination. 16 As fatigue develops, the reduced capacity of the muscles to generate force and stabilize the joints may require cyclists to adopt compensatory movement strategies to maintain power output and pedaling effectiveness. 15 In addition, posture-related joint configurations have also been associated with fatigue perception during cycling. For instance, Priego et al. (2017) reported that larger knee flexion angles in KAM conditions were associated with reduced trunk comfort and greater perceived fatigue. 17 Meanwhile, Hamley and Thomas demonstrated that adjusting saddle height (e.g., to 109% of inseam) may extend time to exhaustion. 18 However, the effects of saddle-height prescription setting methods (TLM, KAM and LMM) on lower-limb kinematics under fatigued conditions remain largely unexplored. Most previous studies have examined joint kinematics under non-fatigue conditions, overlooking the potential interaction between saddle-height setting methods and fatigue.
Therefore, this study aimed to examine the isolated and combined effects of different saddle-height setting methods (TLM, LMM and KAM) and fatigue on lower-limb kinematics during indoor cycling in recreational cyclists. We hypothesized that the TLM would result in smaller knee flexion angles at BDC compared with the LMM and KAM. Additionally, we hypothesized that fatigue would primarily influence ankle and hip joint kinematics during pedaling, whereas knee joint kinematics would remain relatively stable throughout the crank cycle.
Method
Participants
12 health male recreational cyclists (age: 26.08 ± 3.50 years; body height: 1.72 ± 0.04 m; body mass: 67.96 ± 5.65 kg) volunteered to participate in this study. Subjects were included if they had at least 1 year of experience in IC practice (with a training frequency of at least twice a week), had no lower-limb injuries in the six months prior to testing, and did not use orthotics. Participant sample size followed the example of 8–12 participants used in similar past research.9,19–21 Prior to testing, each participant was informed of the procedures, methods, benefits, and possible risks associated with participation in the research trial, was personally interviewed about their training history, completed a Physical Activity Readiness Questionnaire (PAR-Q) 22 and signed an informed consent form. The study protocol was approved by the local university ethics board. (Approval number: HSEARS20240603003) and met the requirements of the Declaration of Helsinki for research on human beings.
Instruments
For this study, an air-braked stationary cycle ergometer (air resistance from level 1 to 10) was used (Mad Bike Ergometer, China) for all tests. Calibration was undertaken as per the manufacturer's guidelines. A nine-camera motion analysis system (Vicon Motion Analysis Inc., UK) was used to capture the 3D kinematic data simultaneously during the cycling tests at 100 Hz. Participants were required to wear same tight shorts and traditional training shoes (Little White, Qingdao Doublestar Ltd, Qingdao, China). To prevent the feet from shifting during cycling, they were secured with the ergometer's shoe covers, and the straps on both sides were fastened by the same researcher. In addition, one reflective marker (14 mm diameter) was placed at the center of the outside edge of the pedal to locate the pedal position. 23
Protocol
The participants reported to the laboratory on three separate occasions (at least 1 day rest between tests to assure recovery). First arriving at the laboratory, informed consent was obtained from all participants after the details of experiment were explained to participants. Body height and body mass were measured followed by kinematic data collection. An anthropometric tape (unit: 0.1 cm) was used to measure saddle height, trochanteric length, 4 inseam length and arm length by the same researcher. 3 The saddle height, handlebar, and seat were adjusted in proportion to each subject's leg and arm length. The horizontal handlebar distance was adjusted to a 70–90° angle between the torso and upper arms, while the vertical height was set level with the saddle. 24 The crank length was 170 mm.
Participants were tested under three saddle heights: (1) TLM: the length from the most prominent bony surface of the greater trochanter to the floor, settings of 100% of trochanteric length have been reported 4 ; (2) KAM: a knee angle of 30° with the pedal at the bottom dead center and the cyclist seated on the saddle, 6 (3) LMM: calculated 88.3% of the inseam length as the distance between the top of the saddle and the center of the bottom bracket. 5 To standardize the comparison, the same researcher measured the distance from the top of the saddle to the center of the bottom bracket across three conditions. The TLM was the highest saddle height (71.8 ± 3.2 cm; 100% trochanteric height), followed by the LMM (69.1 ± 2.3 cm; 96.25 ± 2.09% trochanteric height) and KAM (68.0 ± 2.7 cm; 94.79 ± 2.24% trochanteric height) respectively. Randomization was achieved using a computer-generated random sequence of three saddle heights (www.randomizer.org) prior to testing, and allocation was performed by an independent researcher not involved in data collection to ensure blinding.
Before data collection, participants completed a 10-minute warm-up on a cycle ergometer at a self-selected saddle height, pedaling at 60 RPM with the lowest air resistance (level 1). 16 retroreflective markers with 14 mm diameter 25 were then attached to anatomical landmarks according to the Plug-in Gait Reference Guide. 26 Wherever possible, markers were placed directly on the skin. Heel and toe markers were mounted on the participants’ shoes, and pelvic markers were secured to the shorts. All markers were fixed using elastic therapeutic tape to minimize soft-tissue artifact and prevent displacement during cycling. Followed by a static calibration of the motion capture system before participants were seated on the ergometer. The saddle height was previously set at random. After this process, participants performed cycling at 60 RPM with level 1 air resistance for 2 minutes. Following a 5-minute seated rest, 27 participants were required to gradually increase their cadence to a maximal level in 10 seconds while seated and exerting maximal effort, air resistance was set to level 1. After 10 seconds, air resistance level was set to level 10 immediately, 28 participants continued pedaling at maximal effort until fatigue, defined as cadence dropping below 70 RPM,29,30 Finally, participants performed cycling at 60 RPM with level 1 air resistance for 2 minutes with no rest.
Data processing
Vicon Nexus software (version 2.15.0) was used to manually process reflective marker data. First, the marker trajectories were manually labeled, checked for breaks caused by marker occlusion, missing data was interpolated, and correctness was visually verified. 31 Second, the trajectory data was smoothed and filtered using a fourth-order Butterworth filter with cut-off frequency of 12 Hz. Then,
dynamic data was subjected to the anthropometric characteristics that were retrieved from the static position. The extracted anthropometric parameters obtained from the static position were subsequently applied to the dynamic data. Finally, export the processed data in CSV format for each trial. To reduce human error, all of the data output from Vicon Nexus was loaded into MATLAB R2021b (MathWorks, Natick, Massachusetts, USA) for further processing using custom-written scripts that automated the extraction of biomechanical parameters. A three-dimensional kinematic analysis of the participants’ right leg was conducted, based on the assumption of symmetrical motion between the left and right limbs. For each trail, the middle 10 pedaling cycles were selected for analysis, during which the ankle, knee and hip joint angles at the TDC and BDC positions were extracted. 32 The mean values across these 10 cycles were used as representative joint angles. Additionally, the maximum joint ROM for the ankle, knee, and hip was calculated over the same 10-cycle period. According to the Plug-in Gait Reference Guide, 26 positive values were defined as hip and knee flexions and ankle dorsiflexion and negative values were defined as hip and knee extensions and ankle plantarflexion in the sagittal plane.
Statistical analysis
Data are presented as mean and standard deviation (mean ± SD). The statistical analyses were performed using SPSS (Version 26, SPSS Inc., Chicago, IL). The data normality and homoscedasticity were verified using the Shapiro-Wilk test and Levene test, respectively. A 2-way repeated-measures design was performed for the comparison. Saddle height setting methods (TLM, KAM and LMM) and fatigue (pre- and post-) were considered as within-subject factors. Effect size (ES) was assessed by means of partial eta squared (η2p). The significance levels in the pairwise comparison were adjusted using the Bonferroni correction. Statistical significance was set at p < 0.05 for all analysis. For significant variables, mean difference (MD) and 95% confidence intervals (CI) are provided to facilitate interpretation of clinical significance. For significant pair differences, ES was assessed using Cohen's d (small: < 0.5; medium: 0.5–0.8; large: > 0.8). 33
Results
All joint kinematics can be referenced in Table 1 and Figure 1.
Descriptive statistics of ankle, knee and hip joint angles in pre- and post-fatigue across three saddle height setting methods, presented as mean (M) ± standard deviation (SD).
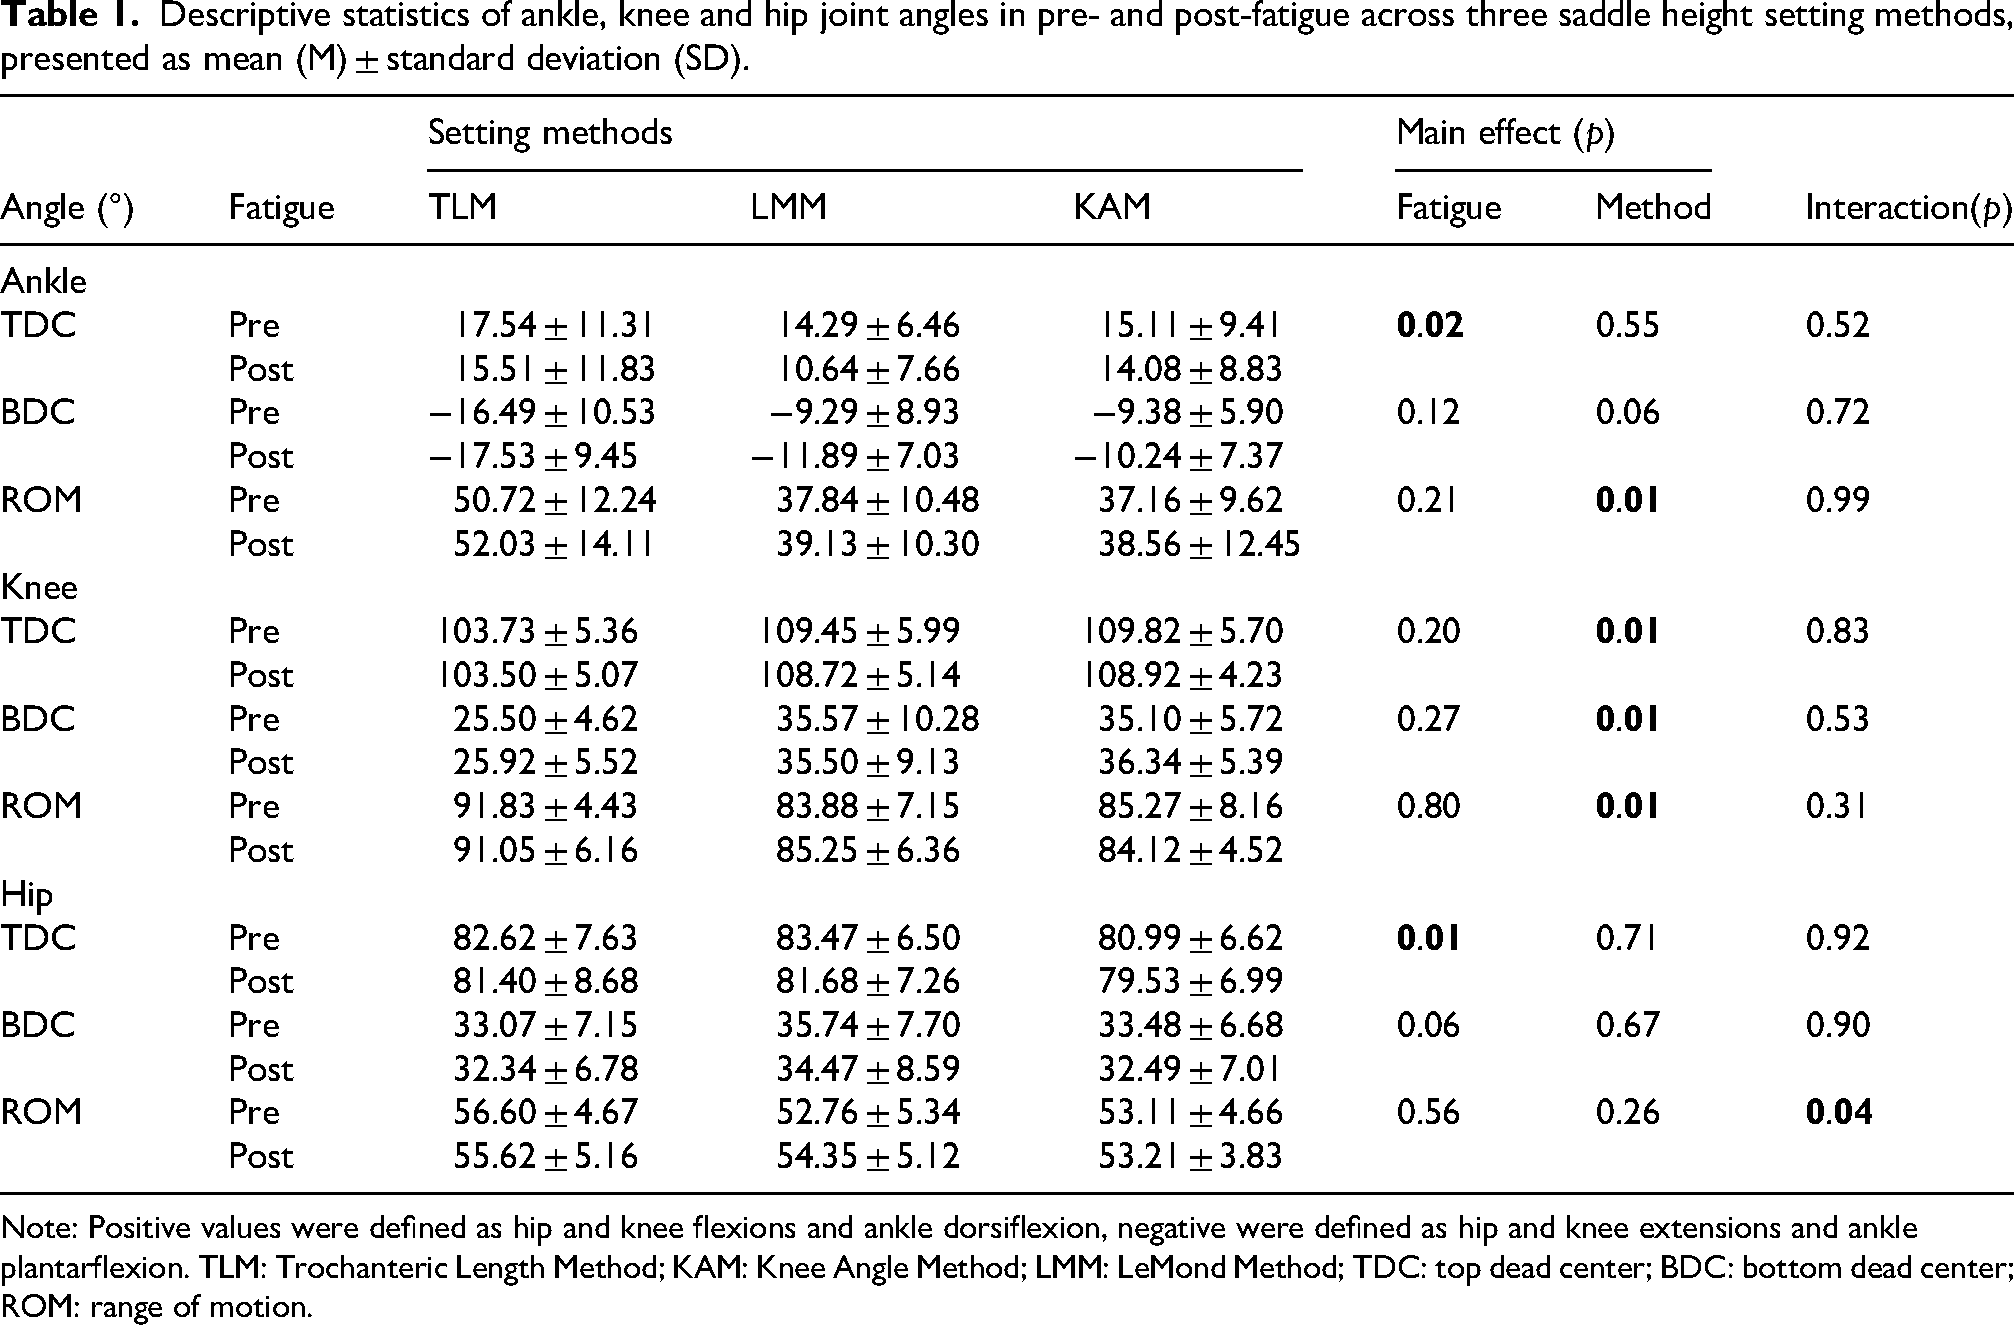
Note: Positive values were defined as hip and knee flexions and ankle dorsiflexion, negative were defined as hip and knee extensions and ankle plantarflexion. TLM: Trochanteric Length Method; KAM: Knee Angle Method; LMM: LeMond Method; TDC: top dead center; BDC: bottom dead center; ROM: range of motion.
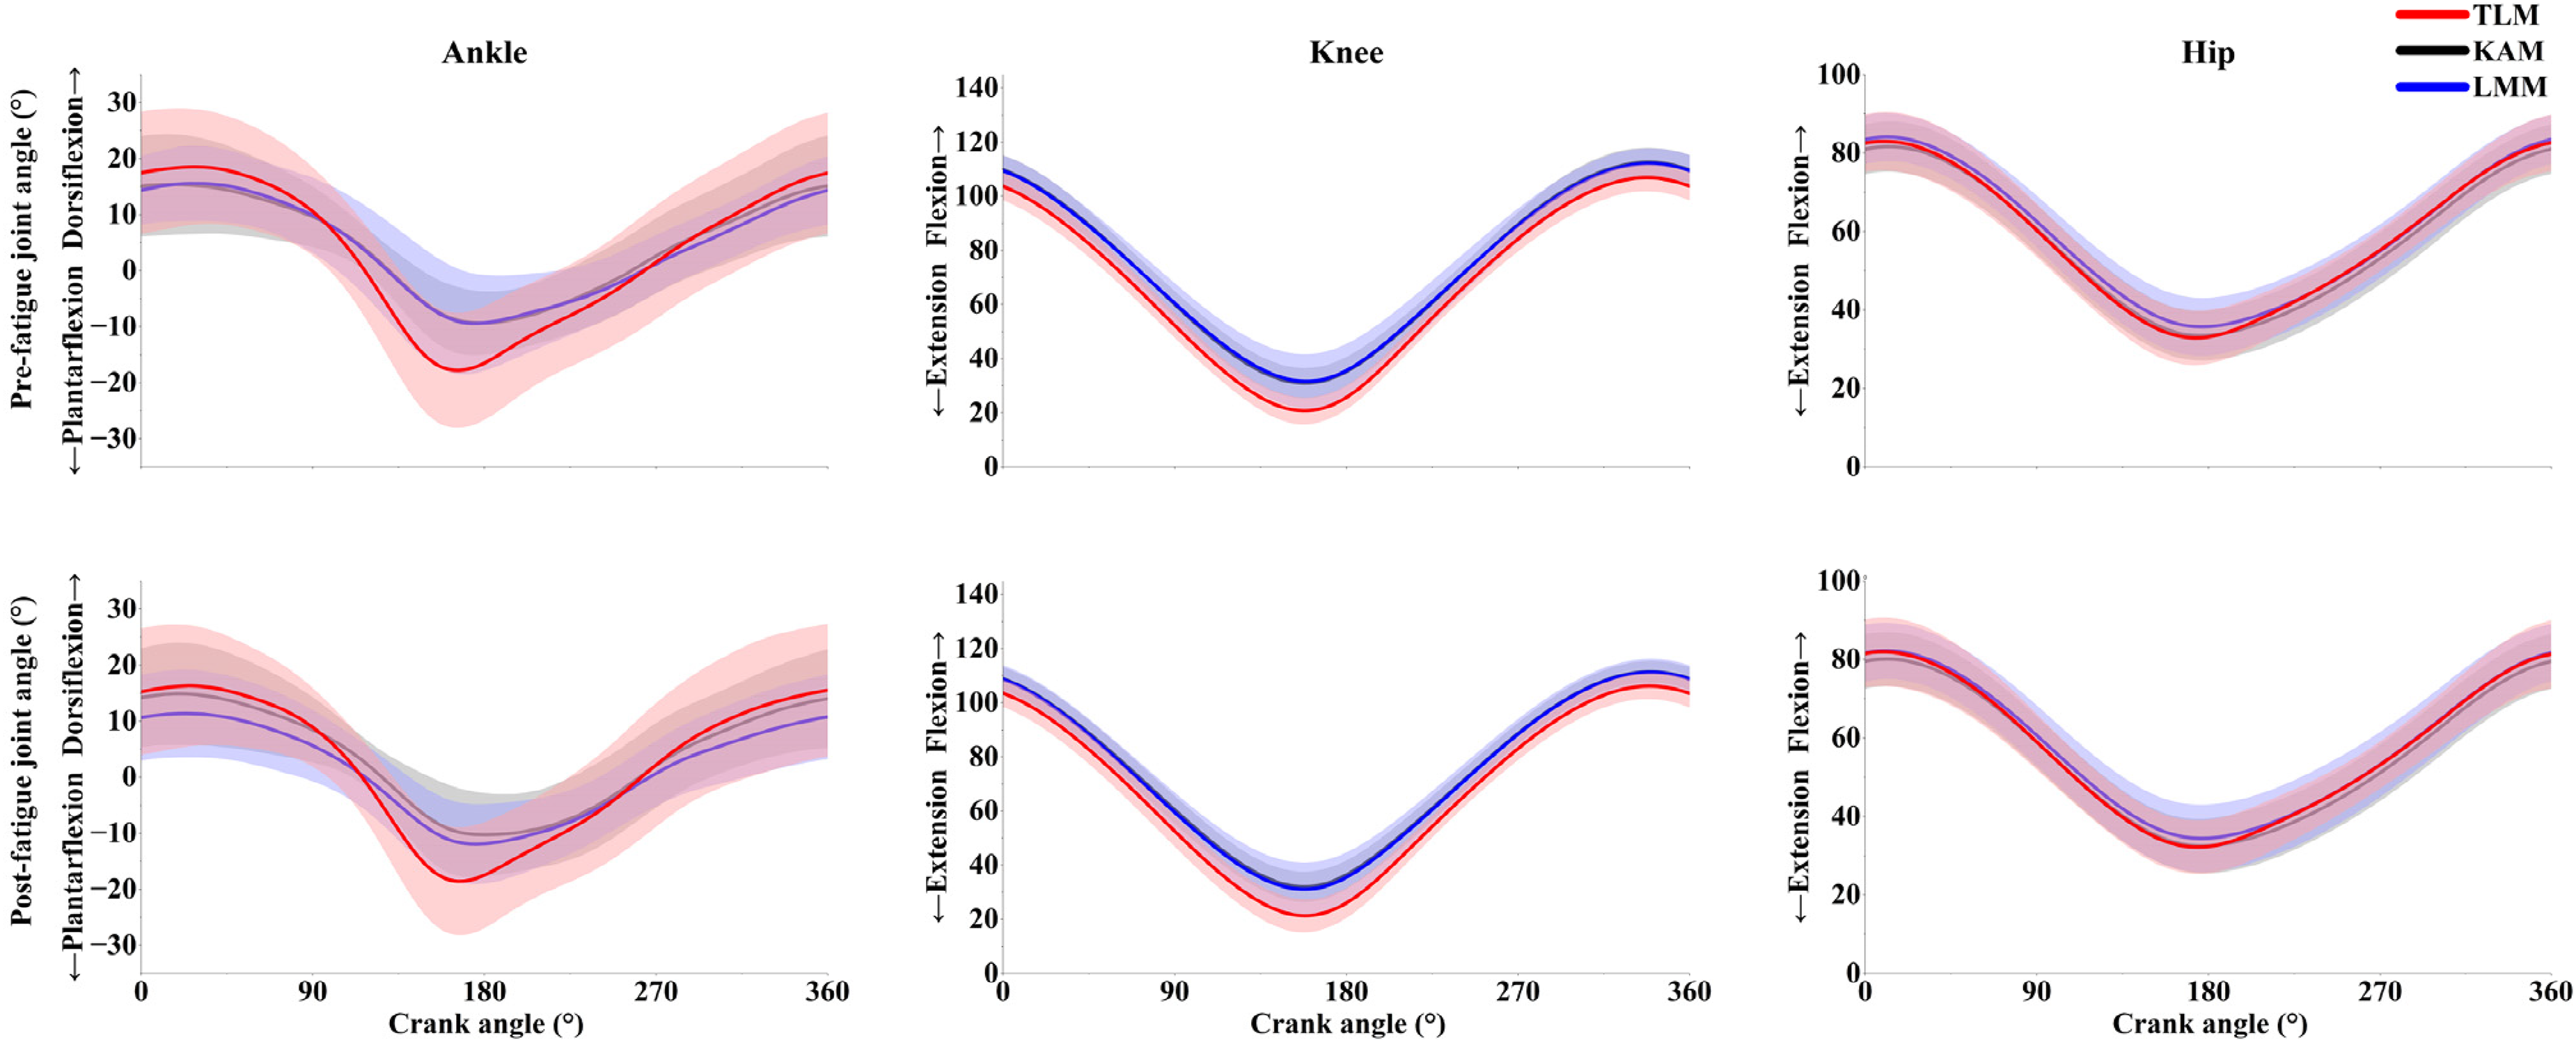
Ankle, knee and hip joints angles in pre- and post-fatigue across three saddle height setting methods. TLM: Trochanteric Length Method; KAM: Knee Angle Method; LMM: LeMond Method.
Effects of setting methods
Two-way repeated measures ANOVA showed no significant main effects of setting methods on ankle and hip angles at TDC or BDC, nor on hip ROM across the crank cycle (p > 0.05). However, significant main effects of setting methods on ROM of ankle (F = 5.57, p = 0.01, η2p = 0.25) and knee (F = 5.34, p = 0.01, η2p = 0.24), as well as knee flexion angles at TDC (F = 4.90, p = 0.01, η2p = 0.23) and knee extension angle at BDC (F = 8.14, p = 0.01, η2p = 0.33). Post-hoc comparisons with Bonferroni correction revealed that TLM exhibited significantly higher ankle ROM than LMM (MD = 12.89, 95% CI 1.36 to 24.42 degrees, p = 0.02, ES = 1.10) and KAM (MD = 13.51, 95% CI 1.98 to 25.04 degrees, p = 0.02, ES = 1.11). Meanwhile, knee ROM was significantly higher in the TLM compared with LMM (MD = 6.88, 95% CI 0.80 to 12.95 degrees, p = 0.02, ES = 1.13) and KAM (MD = 6.75 95% CI 0.68 to 12.82 degrees, p = 0.03, ES = 1.12). In addition, at TDC, knee flexion angle was significantly lower in TLM compared with KAM (MD = 5.76, 95% CI 0.53 to 10.99 degrees, p = 0.03, ES = 1.01) and LMM (MD = 5.48, 95% CI 0.25 to 10.71 degrees, p = 0.04, ES = 1.13). At BDC, knee extension angle in TLM was significantly lower than LMM (MD = 9.83, 95% CI 2.67 to 16.99 degrees, p = 0.01, ES = 1.27) and KAM (MD = 10.01, 95% CI 2.85 to 17.17 degrees, p < 0.01, ES = 1.87).
Effects of fatigue
A significant main effect of fatigue was observed for ankle (F = 5.65, p = 0.02, η2p = 0.15) and hip (F = 7.25, p = 0.01, η2p = 0.18) angles at the position of TDC. Pairwise comparisons revealed that ankle (MD = 2.23, 95% CI 0.32–4.15 degrees, p = 0.02, ES = 0.24) and hip (MD = 1.49, 95% CI 0.37–2.62 degrees, p = 0.01, ES = 0.21) angles at TDC were significantly lower under post-fatigue than pre-fatigue. No significant fatigue effects were observed for ankle angle at BDC or ankle ROM, knee angles at TDC and BDC or knee ROM, or hip angle at BDC and hip ROM across the crank cycle (p > 0.05).
Interaction's effect between setting methods and fatigue
A significant interaction between setting method and fatigue was found in terms of hip ROM (F = 3.30, p = 0.04, η2p = 0.17). Simple effects analysis revealed that hip ROM did not significantly change from pre-fatigue to post-fatigue in the TLM (F = 1.88, p = 0.18, η2p = 0.05) and KAM (F = 0.21, p = 0.89, η2p = 0.01) conditions. However, a significant increase in hip ROM was observed from pre-fatigue to post-fatigue in the LMM condition (F = 5.04, p = 0.03, η2p = 0.13). Additionally, no significant interactions were found for ankle or knee joints, or for other hip variables (p > 0.05).
Discussion
The results of the present study partially supported our hypotheses. As hypothesized, knee joint kinematics were significantly influenced by saddle height setting method, with smaller knee flexion angles observed at BDC under TLM compared with KAM and LMM. Consistent with our hypothesis regarding fatigue, fatigue-related effects were observed primarily at the ankle and hip joints, where ankle and hip angles at TDC were reduced following fatigue, whereas knee joint kinematics remained relatively stable throughout the crank cycle. In addition, a significant interaction between saddle-height setting method and fatigue was observed for hip ROM.
Effects of setting methods
This study demonstrated that saddle height setting methods significantly influenced ankle and knee joint kinematics. Specifically, the TLM condition resulted in greater ankle and knee ROM compared with KAM and LMM, while knee flexion at TDC and knee extension at BDC were lower under TLM. These findings are consistent with previous studies reporting that increasing saddle height reduces knee flexion angles and alters joint ROM during the crank cycle.3,7 In the present study, TLM produced the highest saddle height (71.8 ± 3.2 cm), followed by LMM (69.1 ± 2.3 cm) and KAM (68.0 ± 2.7 cm). Therefore, the observed kinematic differences between methods likely reflect the differences in effective saddle height generated by each method. Nordeen-Snyder 4 reported that ankle plantarflexion at BDC increased by 10% when saddle height was raised from 95% to 105% trochanteric height. This relationship was not observed in the present study, possibly because the saddle heights produced by our three methods did not exceed 100% of trochanteric height (TLM: 100%, LMM: 96.25%, KAM: 94.79%). From a biomechanical perspective, a higher saddle position places the knee closer to full extension at BDC, thereby modifying the sagittal-plane geometry of the lower limb and permitting a larger ROM across the crank cycle. The increased ankle ROM observed under TLM may reflect a redistribution of motion toward the ankle joint when knee flexion is reduced, consistent with previously described patterns of joint coordination within the lower-limb kinetic chain.4,34 The knee and ankle joints showed the most significant adaptations to changes in setting methods. 35 These findings are consistent with studies using clip-less pedals,7,8,36 but differ from those using flat pedals, where significant knee and hip joint modifications have been reported. 4 This discrepancy raises the possibility that pedal type may interact with saddle height effects—a hypothesis warranting future investigation, as the present study used secured footwear that functionally resembled clipless pedals.
Effects of fatigue
Consistent with our hypothesis, fatigue elicited significant effects primarily at the ankle and hip joints, notably reducing ankle and hip angles at TDC, whereas knee kinematics and joint ROM remained largely unchanged. This selective response suggests that fatigue-related kinematic adjustments occurred primarily at the ankle and hip, while knee joint kinematics remained relatively stable, consistent with previous observations of joint-specific adaptations during cycling under fatigue. 37 Reduced ankle dorsiflexion angle has already been identified as a fatigue-related kinematic change during cycling.38,39 This alteration has been attributed to diminished contractile capacity of the ankle musculature under fatigue, which may constrain active dorsiflexion during the downstroke phase. 39 Fatigue-related changes in hip kinematics are plausible given the hip joint's substantial contribution to power generation during cycling, as reported in previous biomechanical analyses. 40 The discrepancy between our findings may be attributable to methodological differences, as Bini and Diefenthaeler 16 analyzed mean hip joint angles across the entire crank cycle, whereas the present study focused on joint angles specifically measured at the position of TDC and BDC. In addition, analysis of the 95% CI indicated that fatigue induced small but consistent reductions in joint angles at TDC. The ankle angle decreased by 2.23 (95% CI: 0.32–4.15 degrees), while the hip angle decreased by 1.49 (95% CI: 0.37–2.62 degrees) from pre- to post-fatigue. Although these changes were statistically significant, the associated effect sizes were small (ankle: ES = 0.24; hip: ES = 0.21), suggesting that fatigue-related kinematic adaptations at TDC were modest in magnitude. The clinical or functional significance of such small angular changes remain unclear, which may represent subtle adjustments that accumulate over prolonged cycling or interact with other factors such as pain or joint loading. Future studies incorporating longer-duration protocols and direct measures of joint kinetics could help clarify these modest kinematic shifts
Interaction between setting methods and fatigue
A significant interaction between saddle height setting methods and fatigue was observed only for hip ROM. Specifically, hip ROM increased following fatigue under the LMM, whereas no significant changes were observed under TLM or KAM. This finding indicates that fatigue-related hip adaptations are influenced by the mechanical configuration imposed by different saddle height setting methods. Previous research on saddle height and hip kinematics has produced conflicting results. Bini et al. reported that lower saddle height setting were associated with greater hip ROM, 9 while Ferrer-Roca et al. found smaller hip ROM at lower saddle height setting. 41 These discrepancies may reflect differences in absolute saddle height ranges: the “lower” condition in Ferrer-Roca's study (102% trochanteric height) was actually higher than all conditions in the present study (94.8–100%), highlighting the importance of considering the specific height range when interpreting hip kinematics. The increase in hip ROM under fatigue in the LMM may reflect a compensatory movement strategy to maintain pedaling effectiveness when neuromuscular function is compromised. Previous research has demonstrated that joints within the lower limb kinetic chain can compensate for one another when mechanical demands change—for example, the ankle joint compensates for reduced knee work at higher height setting. 9 When the mechanical demand on the hip joint is greater under a specific setting method, fatigue-related adaptations may manifest as increased hip motion. Concurrently, the reduced mean hip flexion angle at TDC and BDC observed in the present study has been described as a fatigue effect. 38 The increased ROM and the reduced mean angle would be explained by an attempt to overcome the decrease of contractile properties of muscles, as an effect of fatigue process. 39 This pattern suggests a non-linear relationship between saddle height setting method and fatigue. Although direct EMG or coordination measures were not collected in the present study, these prior observations support the plausibility of differential fatigue effects across joints. Future studies incorporating neuromuscular and coordination measures (e.g., EMG, muscle synergies) could clarify the mechanistic basis of these interaction effects.
The present study had some limitations. First, the sample consisted solely of recreational cyclists, which may limit the generalizability of the findings to elite cyclists. Elite cyclists often exhibit more efficient neuromuscular strategies and joint control under fatigue, which could affect how saddle setting influences kinematics. 35 Second, fatigue was induced through a maximal-effort protocol without direct physiological markers (e.g., blood lactate, electromyography), which may reduce the precision of fatigue quantification. 42 Finally, this study focused exclusively on male participants, and given known sex differences in pelvic structure and joint kinematics, 43 the results may not fully apply to female cyclists. Future studies should expand participant diversity, include more comprehensive kinematic and physiological measurements, and explore long-term adaptations to saddle height changes in various training conditions.
Conclusion
This study found that different saddle-height setting methods (TLM, LMM, KAM) and fatigue influenced lower-limb kinematics during indoor cycling in recreational cyclists. Specifically, the TLM condition produced smaller knee flexion angles at BDC and greater ankle and knee ROM than LMM and KAM conditions. In addition, fatigue reduced ankle and hip angles at TDC without increasing overall joint ROM. Notably, hip ROM increased under fatigue only in the LMM condition, whereas no changes were observed under TLM or KAM. Thus, recreational cyclists should consider that different setting methods produce distinct joint-specific biomechanical responses under fatigued cycling conditions.
Footnotes
Acknowledgements
The authors acknowledge the participants of the present study for their participation.
Ethical considerations
The research was conducted under the approved by the local university ethics board. (Approval number: HSEARS20240603003) and met the requirements of the Declaration of Helsinki for research on human beings.
Consent to participate
The study was conducted in accordance with the Declaration of Helsinki and approved by the Human Research Ethics Committee, The Hong Kong Polytechnic University (HSEARS20240603003). Informed consent was obtained from all subjects involved in the study.
Funding
The author(s) disclosed receipt of the following financial support for the research, authorship, and/or publication of this article: This work was supported by the Research Institute for Sports Science and Technology (RISports), PolyU Academy for Interdisciplinary Research (PAIR) of The Hong Kong Polytechnic University (project account 1-CD3A).
Declaration of conflicting interests
The authors declared no potential conflicts of interest with respect to the research, authorship, and/or publication of this article.
Data availability
The datasets used is available from the corresponding author on reasonable request.