
Abstract
Force–time (F-t) variables derived from the countermovement jump (CMJ) offer insights into neuromuscular performance and may differ across sexes and sports. This study aimed to assess variables from the F–t curve and analyse force profiles by sex and sport. A total of 550 CMJs from 188 elite athletes representing nine sports were analyzed. Principal Component Analysis (PCA) reduced dimensionality and identified latent components describing force production. PCA extracted three components explaining 91.6% of variance: PC1 (propulsive, 38.0%), PC2 (braking, 29.3%), and PC3 (temporal–impulse, 24.3%). Component scores differed significantly across sports in both sexes (all p < 0.001). In males, gymnastics and fencing showed the highest PC1 scores, while triathlon consistently presented the lowest. Badminton displayed superior PC2 and PC3 characteristics. In females, artistic gymnastics exhibited the highest PC1 capacity, whereas taekwondo and triathlon showed the lowest. Badminton and gymnastics outperformed several sports in PC2 and PC3. PCA mapping showed male fencing and judo clustered in high propulsive–high braking profiles, while triathlon athletes showed low braking strategy efficiency. Most female athletes displayed reduced propulsive and braking capacity, except gymnasts and judokas. F–t profiles differentiate neuromuscular strategies across sexes and sports, supporting their application to guide discipline- and sex-specific training interventions.
Introduction
The countermovement jump (CMJ) is a widely used assessment of lower-body neuromuscular function1,2 due to its non-invasive, minimal physiological demand, and time-efficient nature.3,4 It is commonly applied to monitor sports performance, 5 inter-limb asymmetries, 6 neuromuscular fatigue, 7 and the effects of training interventions. 8 The CMJ relies on the stretch–shortening cycle (SSC), which includes a rapid eccentric contraction of the prime movers, a brief transition phase, and a subsequent concentric action.9,10 This coordinated sequence enhances force output through the interplay of elastic energy storage and efficient neuromuscular activation, making the CMJ a highly informative and versatile assessment tool.9,10
Traditionally, jump height has been a primary CMJ performance metric due to its strong relationship with sprinting11,12 and change-of-direction ability. 13 However, force plate data enables a more comprehensive evaluation of CMJ performance and the CMJ movement strategy, allowing practitioners to go beyond jump height and examine variables such as net propulsive impulse (related to force application over time), peak and mean ground reaction forces (representing force production), and movement strategies reflected in phase durations. 4 Segmenting the force–time (F–t) curve into unweighting, braking, propulsion, and landing phases provides contextual insight into how force is generated, modulated, and dissipated throughout the jump.14,15
The F–t curve contains valuable information on the kinetic and temporal characteristics of the CMJ. Its analysis has received growing attention in biomechanics and sport science, 16 with derived metrics like lower-limb stiffness (i.e., the ratio of vertical ground reaction force at the instant of peak negative centre of mass displacement to that displacement value) and the modified reactive strength index (RSI modified; i.e., jump height divided by push off time) emerging as indicators of elastic and reactive muscle properties.17–19 Kinetic variables, such as peak force, mean force, and impulse, are widely used to understand CMJ mechanics, 20 whereas temporal variables (e.g., jump duration, time to peak force, propulsion time) help describe the strategies employed to achieve specific outcomes. Although kinematic data are less frequently reported, 21 both kinetic and kinematic variables contribute to performance and reflect the interplay between mechanical efficiency, elastic properties, and neuromuscular control. 22
F-t analysis has revealed sport- and sex-specific differences in CMJ profiles.23,24 Athletes adapt jump strategies to the mechanical demands of their sport. 25 For instance, high jumpers typically produce high peak forces over short time intervals, 26 whereas volleyball players adopt time-dependent strategies with prolonged force application. 27 In contrast, handball and basketball players often exhibit balanced profiles, combining moderate peak force with sufficient impulse to accommodate more variable movement demands.24,27 Sex differences are also well established, with males generally showing higher jump height,24,28 greater eccentric rate of force development, and higher concentric force production. 24 These differences arise from variations in muscle architecture, such as pennation angle, fascicle length, and muscle thickness.29,30 alongside long-term training exposure and sport-specific mechanical demands. Thus, sex and sport differentiation is essential for optimizing performance.
Given that force plates can generate more than 80 CMJ-related variables, 31 selecting meaningful variables is critical. Principal component analysis (PCA) is a widely used technique for dimensionality reduction,32,33 enabling identification of inter-variable relationships and supporting athlete profiling. It has been applied to distinguish player positions and performance indicators in team sports,34–36 to detect waveform changes following training, 37 and to cluster athletes by waveform similarity. 38 PCA thus offers a clear, sport-specific representation of key physical qualities.
Considering the complexity of CMJ data and the diverse demands across sports and roles, further research is needed to identify the most informative variables for performance profiling.39,40 Therefore, based on this theoretical background, the aim of the present study is to assess the performance predictability of selected variables extracted from the F–t curve and analyze force production profiles stratified by sex and sport to identify potential sex- and sport-specific patterns.
Methods
Study design
This study employed a cross-sectional observational design to examine CMJ performance and movement strategy across athletes from multiple sports and both sexes. All tests were conducted in the morning under standardized conditions at the Performance Analysis Unit of the Madrid High Performance Centre, Spain, during the competitive season (from November 2024 to July 2025), ensuring participants were assessed in peak physical condition. The testing protocol included a standardized warm-up and preparatory exercises, incorporating plyometric drills, followed by CMJ testing using Hawkin Dynamics force plates. Each participant performed three maximal CMJs, with standardized rest intervals between jumps.
Sample
A total of 188 elite athletes (118 male, 70 female) from nine sport disciplines participated in the study. The male sample included badminton (n = 2), fencing (n = 23), artistic gymnastics (n = 2), judo (n = 57), taekwondo (n = 6), table tennis (n = 24), and triathlon (n = 4). The female sample comprised badminton (n = 4), dance (n = 2), fencing (n = 5), artistic gymnastics (n = 28), judo (n = 17), rugby sevens (n = 3), taekwondo (n = 5), and triathlon (n = 6). Male athletes were 25.0 ± 5.9 years old, 181.2 ± 8.2 cm tall, with a BMI of 18.2 ± 2.1 kg/m2 and body mass of 73.8 ± 11.6 kg. Female athletes were 23.1 ± 6.5 years old, 170.1 ± 6.4 cm tall, with a BMI of 19.4 ± 3.2 kg/m2 and body mass of 58.9 ± 12.1 kg. Each athlete completed up to three CMJ repetitions within a single testing session, yielding 564 attempts. Fourteen repetitions were excluded due to technical errors or artefacts, leaving 550 valid repetitions for analysis. Eligibility criteria required athletes to be national-team members competing internationally, familiar with the testing protocol, free of recent musculoskeletal injuries, and with at least one year of training experience at the High-Performance Centre. The study received approval from an institutional ethics committee (University of Extremadura 166/2023). All participants provided written informed consent, and for those under 18, parental or legal guardian consent was also obtained.
Procedures
Participants rested for at least 24 h before testing to minimize fatigue effects. All assessments were conducted in the same facility, using identical equipment and supervised by the same research team to ensure methodological consistency. Testing took place under controlled conditions between 9:00 a.m. and 2:00 p.m. Although assessments occurred throughout the year, only data collected during each athlete's competitive season were included to ensure comparable readiness. Coordinated end-of-season testing was not possible due to differing annual plans across national teams, and off-season assessments would have introduced substantial variability. In-season jump-training volume was not standardized, as each sport has distinct technical and physical demands.
The standardized warm-up lasted 15 min and consisted of 5 min of low-intensity jogging followed by dynamic mobility drills (butt-kicks, A-skips, high-knees, lunge-and-twist, knee-to-chest). Participants then performed CMJs on a dual force plate system sampling at 1000 Hz (Hawkin Dynamics, Westbrook, Maine, USA), 41 positioned on a rigid indoor laboratory floor. The CMJ was executed from a standing position with a rapid countermovement followed by an explosive upward action. 42 Athletes were instructed to jump as high and as quickly as possible with hands on hips. Vertical ground reaction force data were stored via the manufacturer's cloud platform and exported in CSV format for subsequent analysis using external statistical software (Jamovi, v2.4.14).
A total of 18 CMJ variables were extracted (Table 1), following the framework provided by Hawkin Dynamics. 25 In line with prior research,43–45 braking- and propulsion-phase variables included impulse, mean and peak velocity, mean and peak force, and mean and peak power. Time to take-off, take-off velocity, and the modified reactive strength index (RSI-modified; jump height ÷ contraction time) were also assessed. These variables were included to differentiate between braking and propulsion mechanics. Force, power, and impulse metrics were normalized to body mass to allow meaningful comparisons between athletes with different body sizes and morphology.40,46
CMJ variables: definitions and units of measurement.
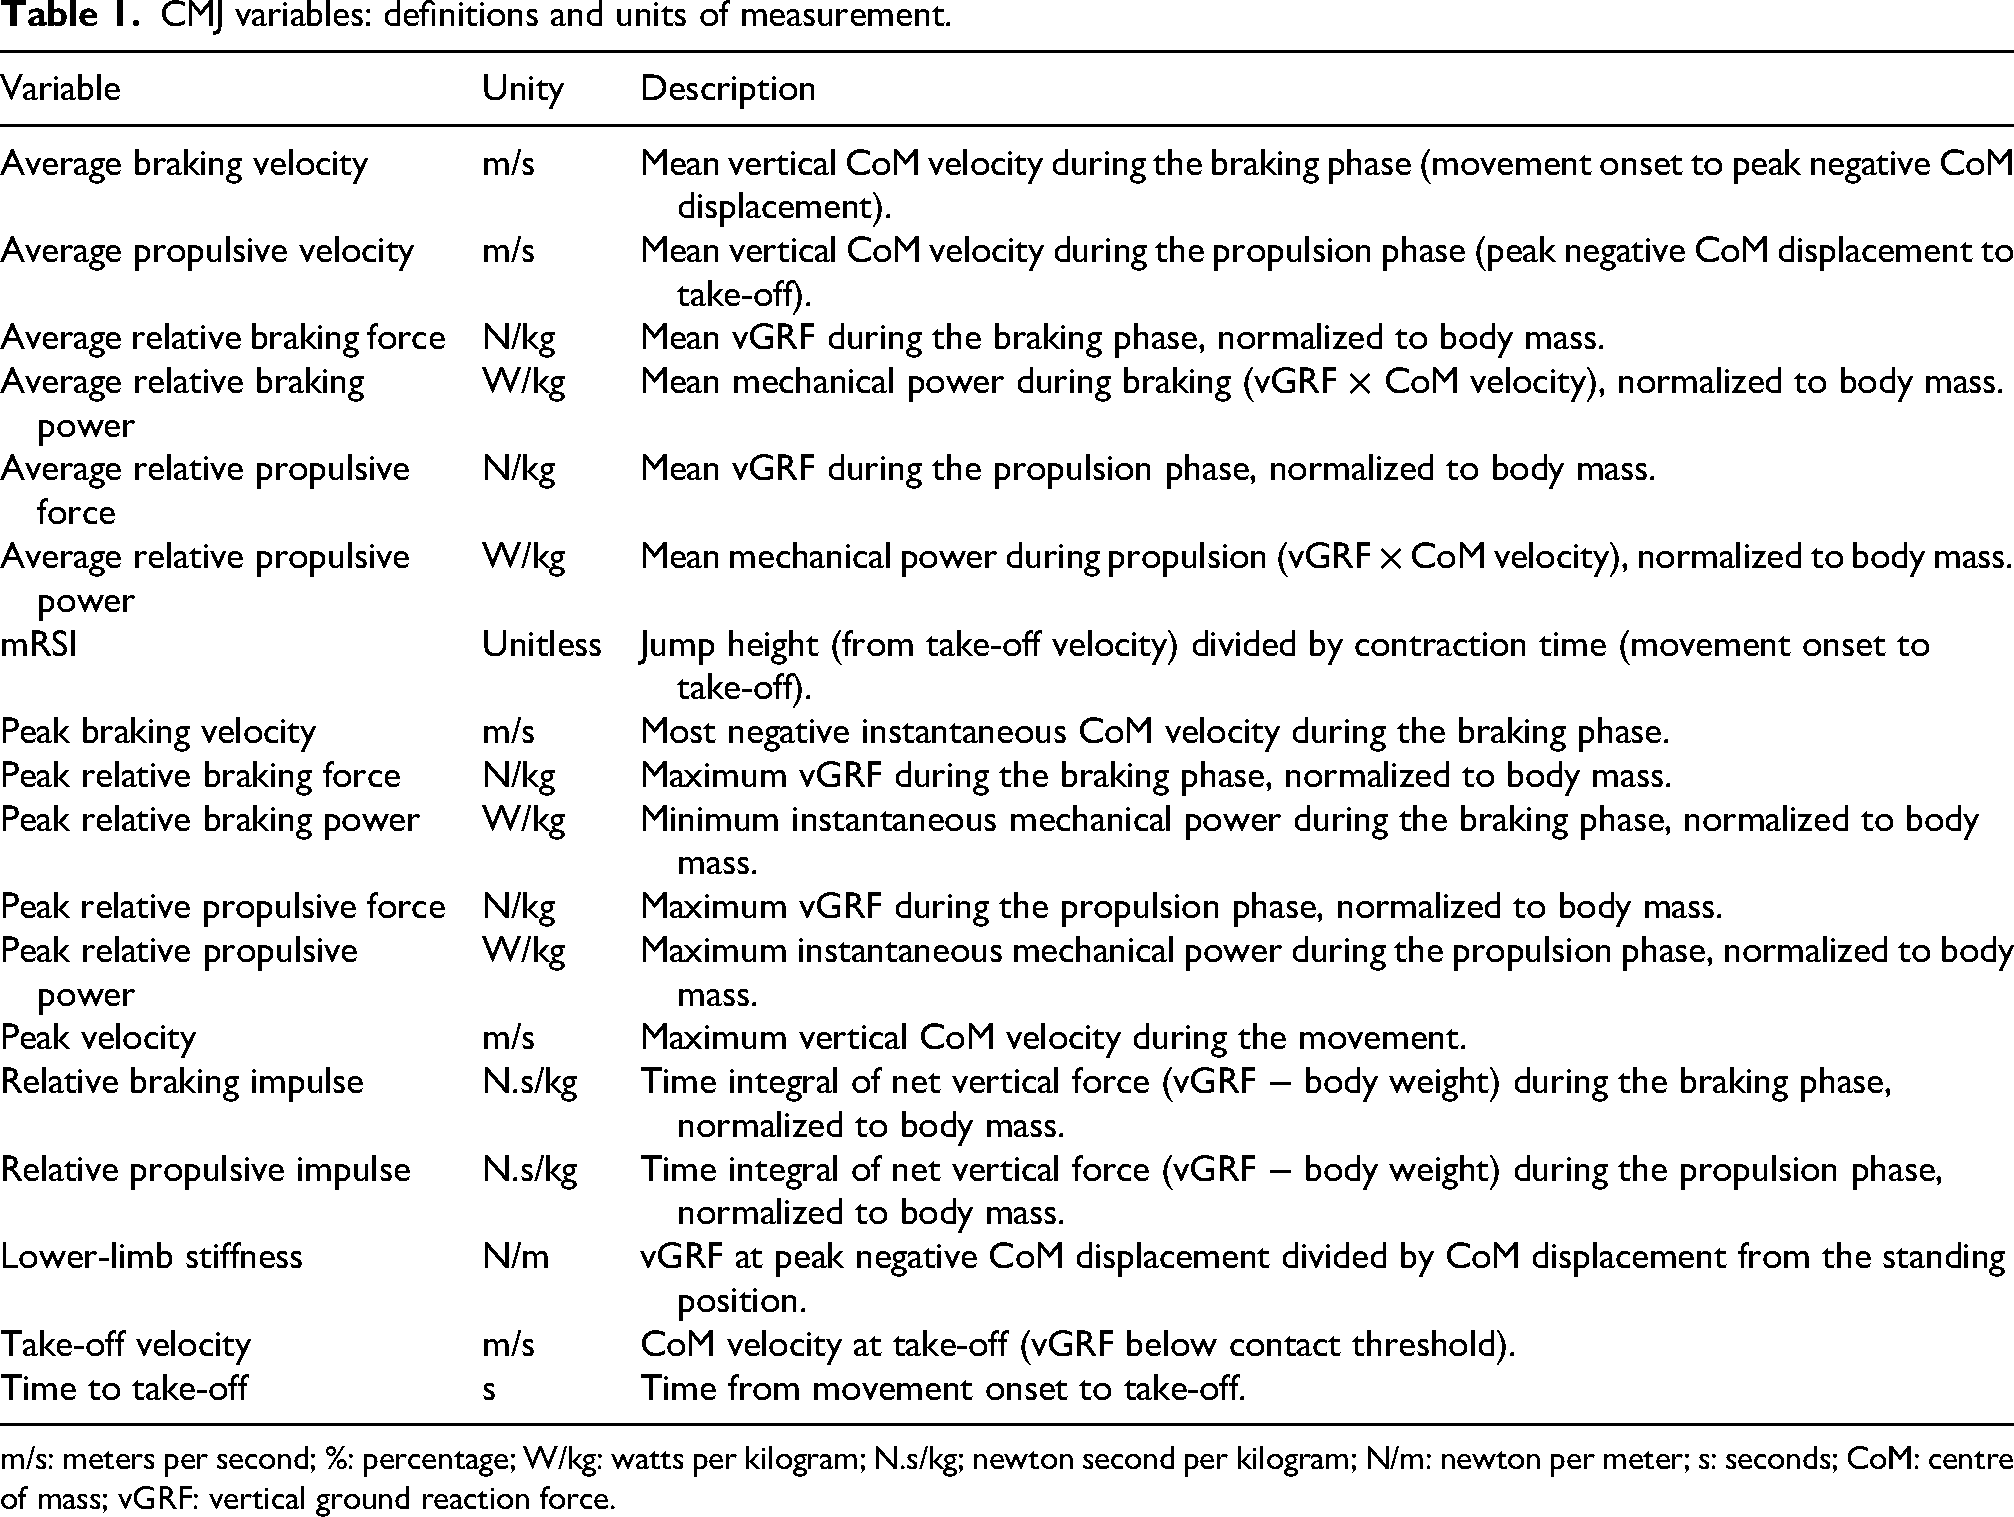
m/s: meters per second; %: percentage; W/kg: watts per kilogram; N.s/kg; newton second per kilogram; N/m: newton per meter; s: seconds; CoM: centre of mass; vGRF: vertical ground reaction force.
Statistical analyses
Before the main analyses, the Shapiro–Wilk test was used to assess data normality, and descriptive statistics were computed for all dependent variables. Within-session repeatability of the vertical jump metrics was evaluated using intraclass correlation coefficients (ICC) through a two-way mixed-effects model with a consistency definition and average measures [ICC(3,k)]. All metrics demonstrated excellent reliability (ICC(3,k) > 0.9; 95% CI: 0.75–0.99), indicating that the average of repeated trials provides a stable estimate. Coefficients of variation exceeded 5%, reflecting low relative variability and confirming the reliability of the measurement protocol.
Sport differences were examined using Welch's t-test. A principal component analysis (PCA) was then applied to data from 178 athletes to identify the components summarizing the 18 variables and to characterize CMJ profiles across sports. All variables were standardized (Z-scores), and because force–time variables (e.g., force, velocity, power) are biomechanically interrelated, substantial correlations were expected. Bartlett's test of sphericity and the Kaiser–Meyer–Olkin (KMO) test were used to confirm the suitability of the dataset for PCA. Bartlett's test indicated sufficient intercorrelation, and KMO values were interpreted following established thresholds (<0.50 unacceptable to >0.90 marvelous). 47
Components were selected using scree-plot inspection and eigenvalues > 1.0, 48 and PCA was conducted following the methodology of Kollias et al. 25 PCA was therefore used to summarize these correlated variables into orthogonal components representing underlying mechanical characteristics of the jump. A VARIMAX (orthogonal) rotation was applied to enhance interpretability and facilitate early labeling of components. Individual averaged jump data were then plotted in a two-dimensional plane defined by the first two components to characterize sport-specific profiles.
A one-way ANOVA was used to compare sport groups within each sex and to assess sex differences in each principal component. When significant effects were present, Bonferroni post-hoc tests identified pairwise differences. Effect sizes were reported using Cohen's d (trivial: 0 ≤ d < 0.2; small: 0.2 ≤ d < 0.5; moderate: 0.5 ≤ d < 0.8; large: d ≥ 0.8). 49
All analyses were performed using Jamovi (v2.4.14) and Microsoft Excel. Visualizations, including sport-specific trend lines, were created using Flourish Studio. Statistical significance was set at p < 0.05.
Results
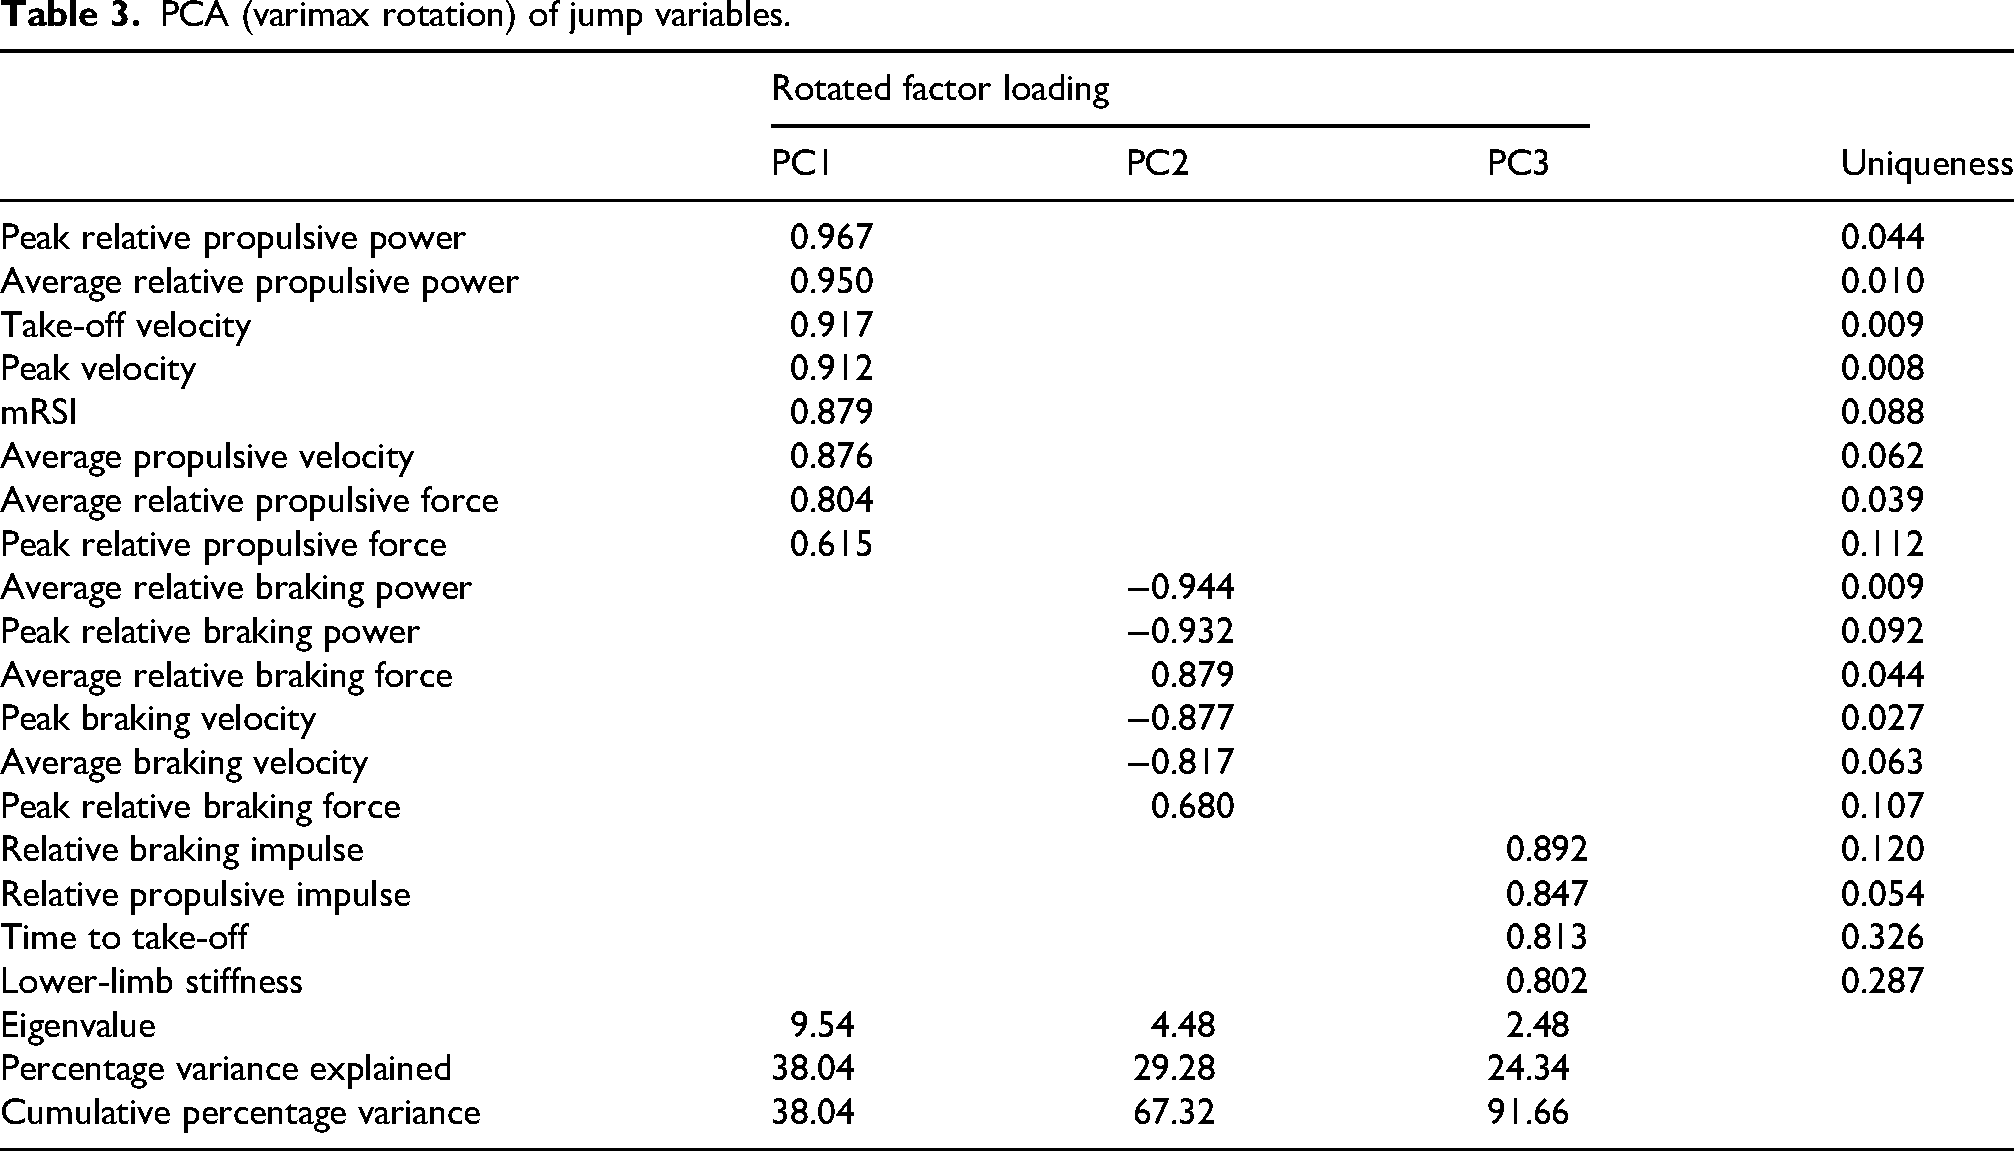
Table 2 presents a descriptive analysis of jumping variables in male and female athletes. Bartlett's test of sphericity indicated that the correlations among variables were sufficient to proceed with factor analysis (χ2(153) = 27,872.69, p < 0.001). The correlation matrix revealed strong interrelationships among several propulsion-phase variables, supporting the use of PCA for dimensionality reduction. Correlation coefficients ranged from r = −0.672 to r = 0.972, with most relationships reaching statistical significance (p < 0.001). PCA extracted three components explaining most of the variance (91.6%). Components were defined by high loadings (> 0.6) and interpreted as: PC1 (propulsive), PC2 (braking), and PC3 (temporal-impulse). PC1 accounted for 38% of the total variance and reflected propulsive capacity, PC2 (29.3%) represented braking mechanics, and PC3 (24.3%) characterized by variables reflecting both the duration of force application (e.g., time to take-off) and impulse-related measures (Table 3).
Descriptive analysis of variables by sex, stratified according to PCA clusters.
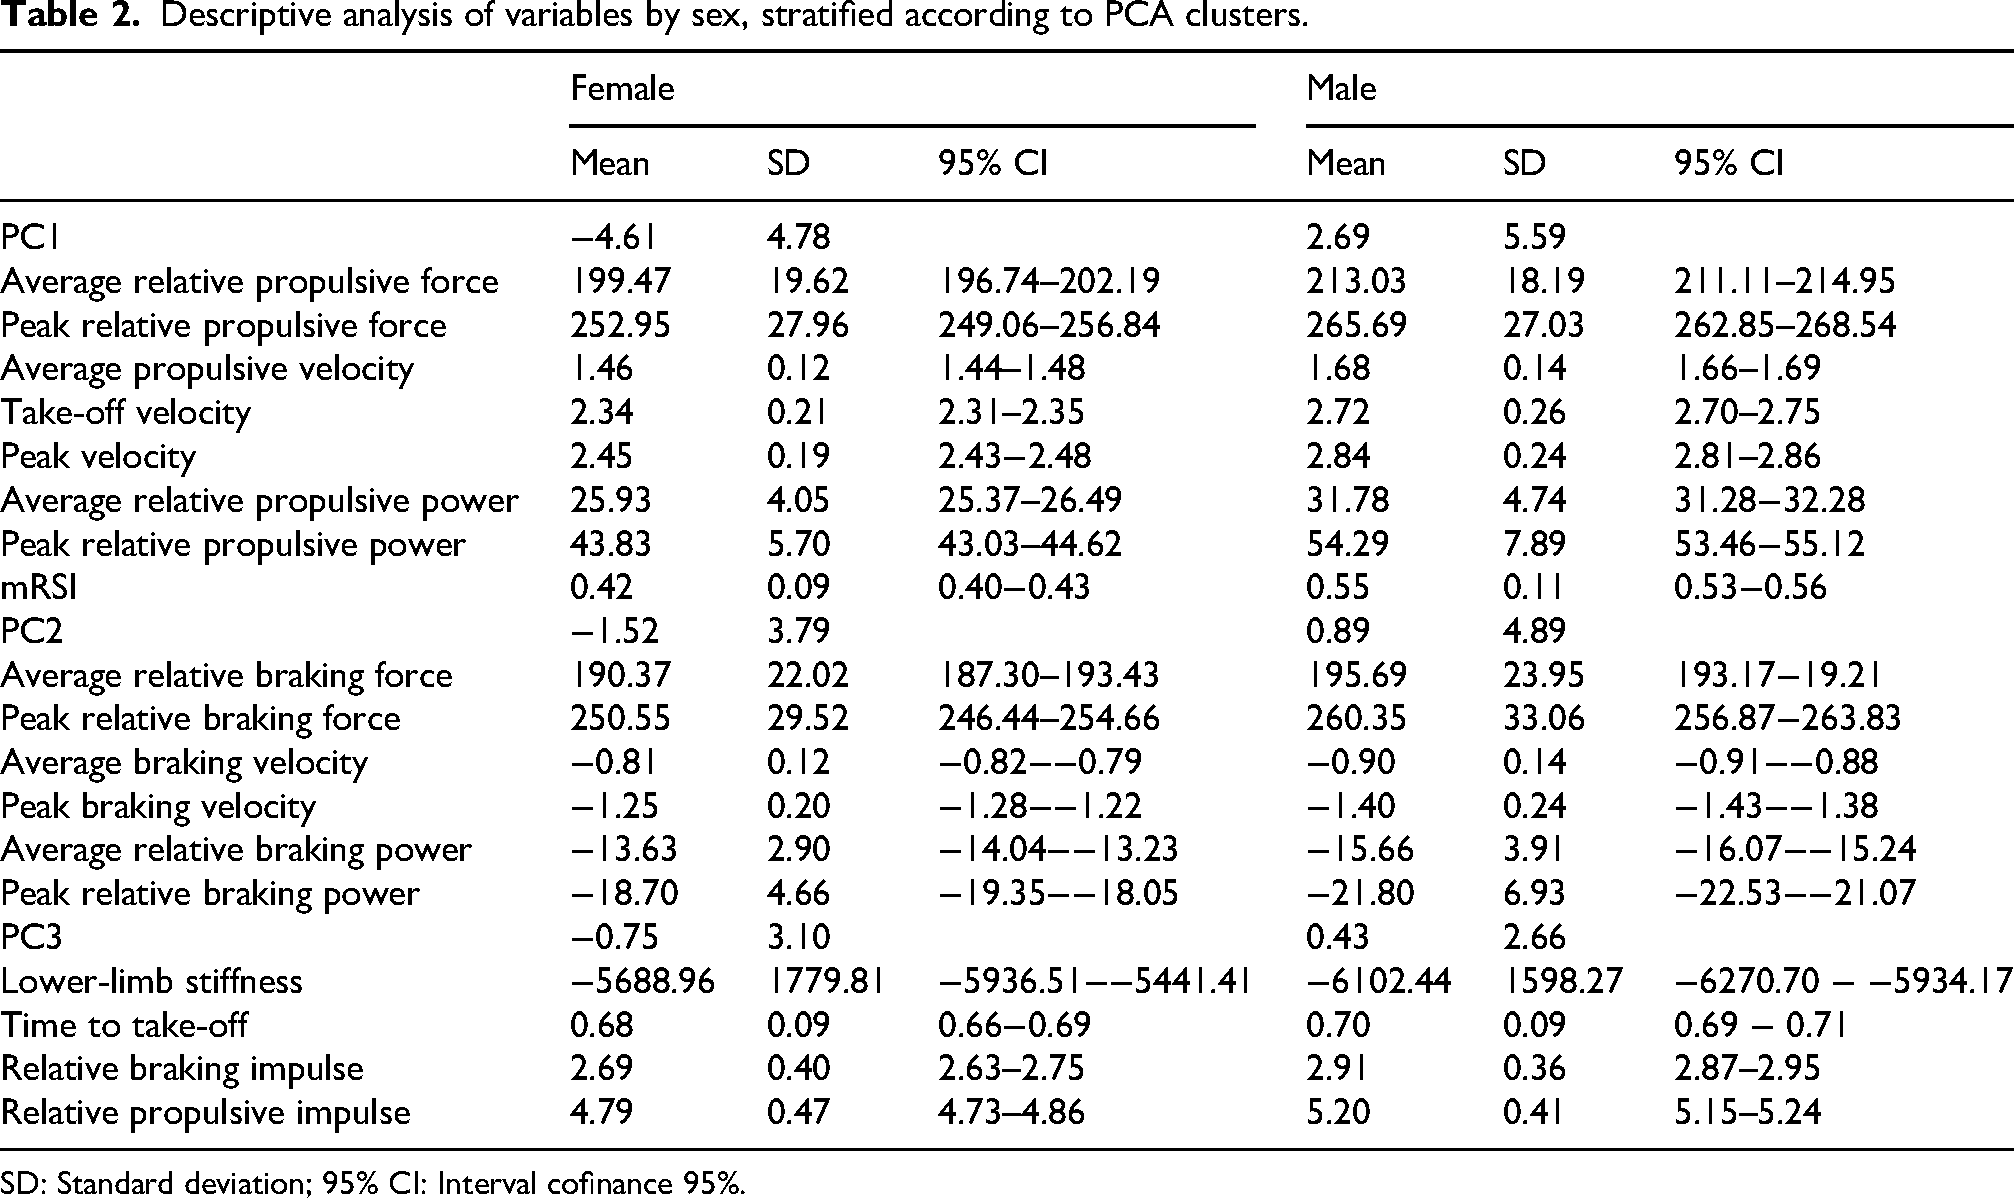
SD: Standard deviation; 95% CI: Interval cofinance 95%.
PCA (varimax rotation) of jump variables.
Principal component scores differed significantly across sport disciplines among male athletes, with mean values representing standardized PCA component scores where higher values indicate a greater expression of the corresponding mechanical characteristic (Table 4). Welch's one-way ANOVAs revealed significant group differences for all components: PC1: F(6, 32.2) = 37.11 (p < 0.001); PC2: F(6, 29.3) = 7.04, (p < 0.001; PC3: F(6, 31.6) = 9.23, (p < 0.001). Gymnastics showed the highest mean score for PC1 (10.70 ± 3.28), followed by Fencing, Badminton, and Judo. For PC2 and PC3, Badminton recorded the highest mean scores (5.94 ± 3.38 and 3.31 ± 1.65, respectively). Triathlon exhibited the lowest scores, particularly in PC1 and PC3. Tukey's post hoc tests for PC1 revealed that Gymnastics scored significantly higher than Judo, Taekwondo, Table Tennis, and Triathlon (p < 0.001). Fencing also outperformed Taekwondo, Table Tennis, and Triathlon (p < 0.001). Triathlon scored significantly lower than Badminton (mean difference = 9.15, p = 0.005), Fencing (10.73, p < 0.001), and Gymnastics (16.28, p < 0.001). For PC2, Badminton and Fencing had significantly higher scores than Judo, Table Tennis, and Triathlon (p < 0.001). Badminton also differed significantly from Judo (mean difference = 5.75, p = 0.048) and Table Tennis (p = 0.022). In PC3, only Triathlon differed significantly from other sports (p < 0.05), showing consistently lower scores. No other significant pairwise differences were observed in this component.
Principal component scores in male athletes by sport discipline.
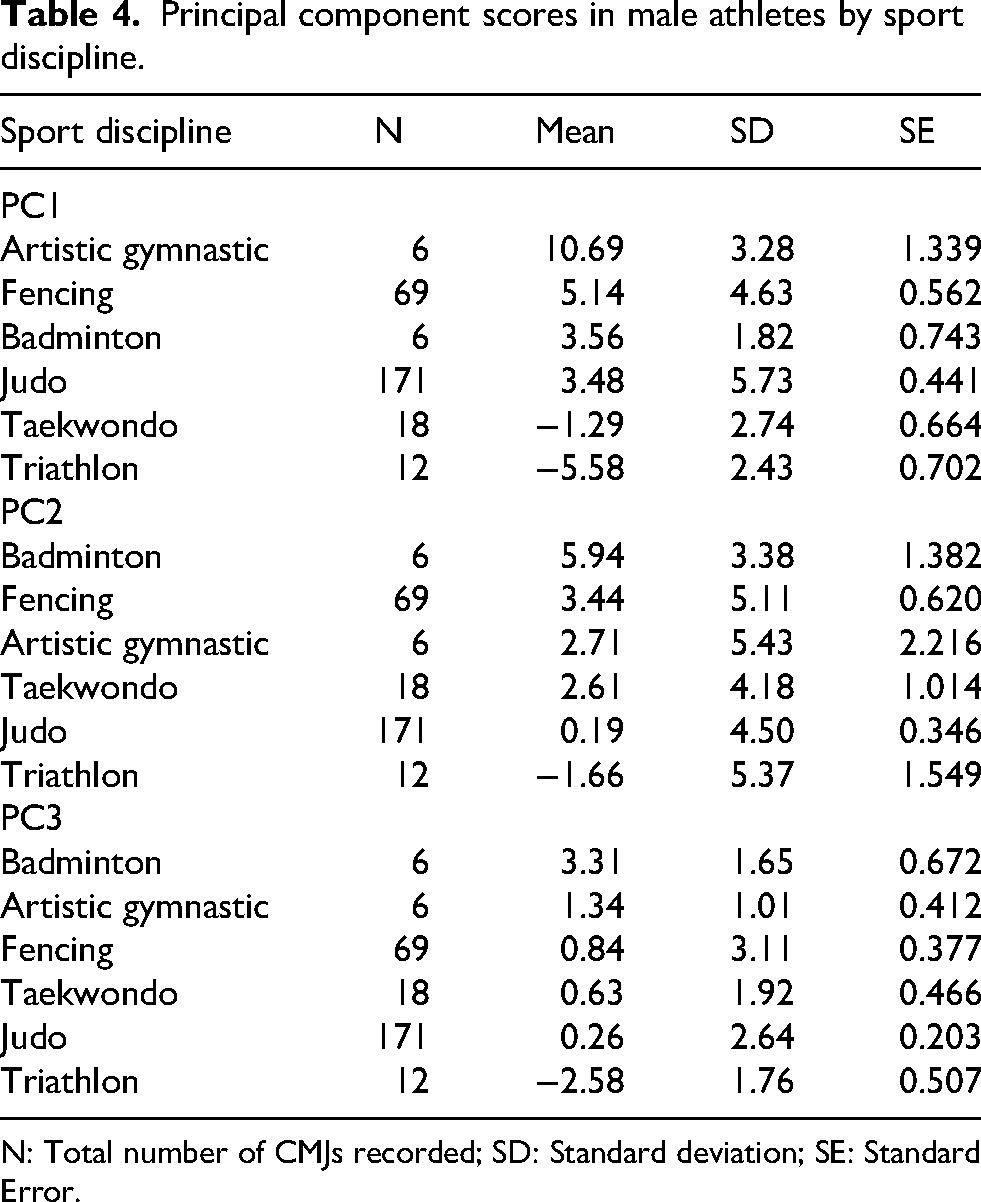
N: Total number of CMJs recorded; SD: Standard deviation; SE: Standard Error.
Principal component scores differed significantly across sport disciplines among female athletes, with mean values representing standardized PCA component scores where higher values indicate a greater expression of the corresponding mechanical characteristic (Table 5). Welch's one-way ANOVAs showed significant effects of sport on all components: PC1: F(7, 31.4) = 12.42, p < 0.001; PC2: F(7, 30.4) = 8.43, p < 0.001; PC3: F(7, 28.9) = 5.76, p < 0.001. For PC1, artistic gymnastics had significantly higher scores than fencing (p = 0.003), judo, taekwondo, and triathlon (p < 0.001). The lowest mean scores were found in taekwondo (−8.3 ± 2.35) and triathlon (−8.88 ± 3.53), contrasting with higher scores in technical and artistic disciplines. In PC2, badminton scored significantly higher than rugby 7 (p = 0.016) and triathlon (p < 0.001). Artistic gymnastics outperformed judo (p = 0.038), rugby 7 (p = 0.002), and triathlon (p < 0.001). Fencing also had higher scores than rugby 7 (p = 0.037) and triathlon (p < 0.001). For PC3, badminton exceeded fencing (p = 0.006), gymnastics (p = 0.012), judo (p < 0.001), and triathlon (p = 0.010). Fencing scored lower than rugby 7 (p = 0.029) and taekwondo (p = 0.001). Gymnastics also outperformed taekwondo (p = 0.002). Additionally, both taekwondo and rugby 7 scored significantly higher than triathlon (p < 0.05).
Principal component scores in female athletes by sport discipline.
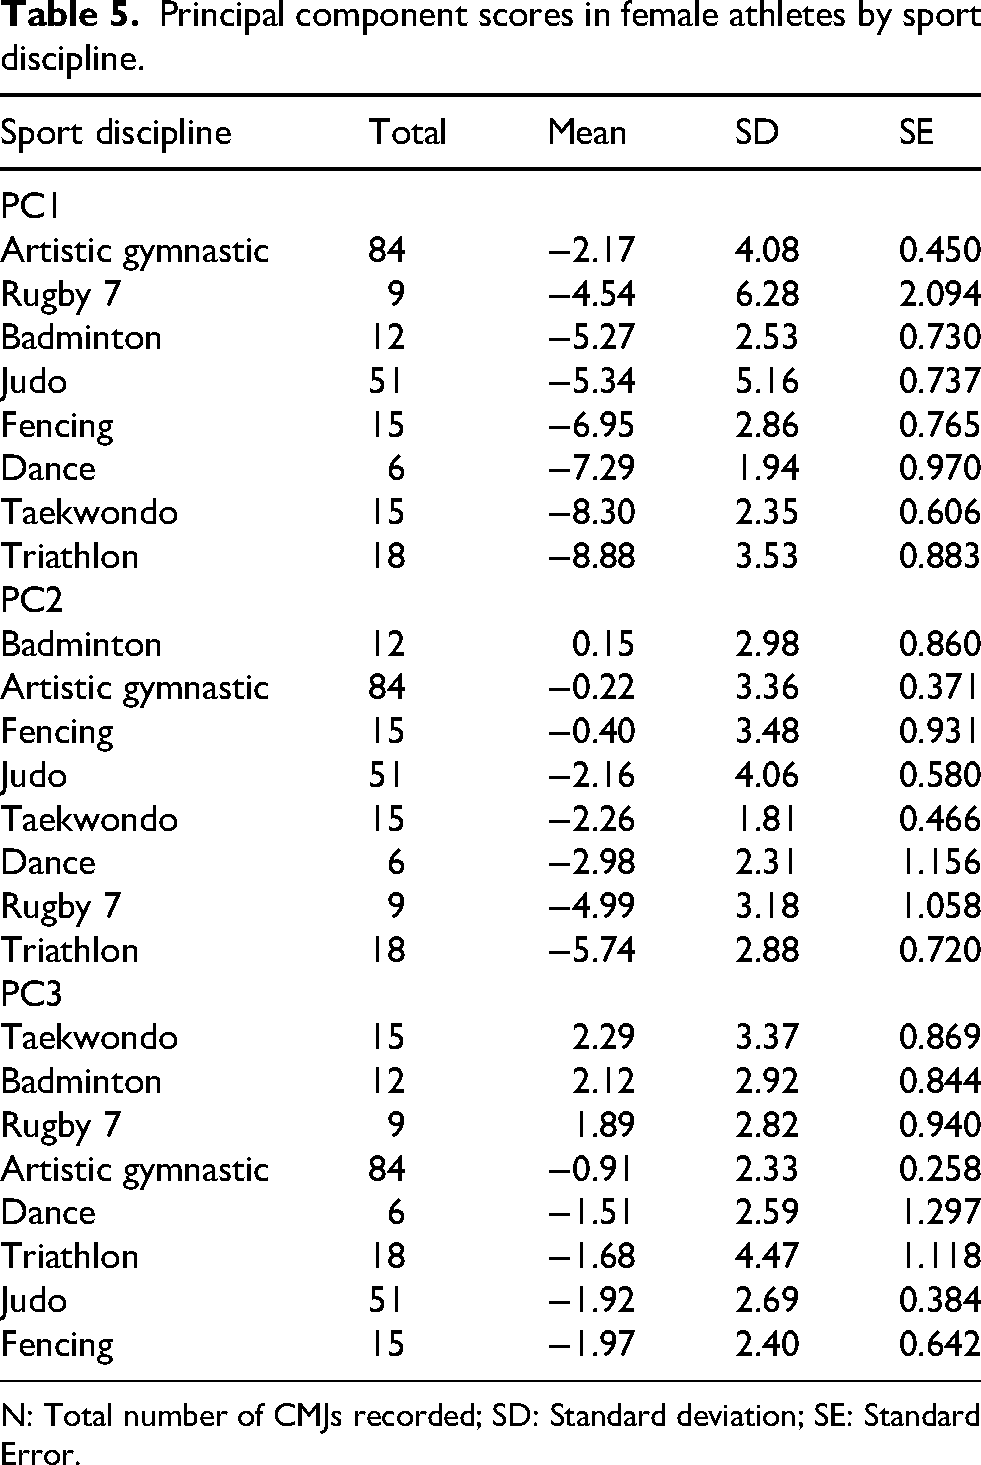
N: Total number of CMJs recorded; SD: Standard deviation; SE: Standard Error.
Figures 1 (male athletes) and 2 (female athletes) illustrate PCA-based differences by sport discipline, representing force application in the CMJ. Sex-based comparisons revealed significant differences in propulsive factor scores (PC1: Welch's t (473.360) = −16.355 (p < 0.001)) and braking factor scores (PC2: Welch's t (503.390) = −6.533 (p < 0.001)). Male athletes were characterized by higher propulsive output and a higher-force braking strategy (PC1 = 2.685; PC2 = 0.891), whereas female athletes showed lower propulsive power and a lower-force braking strategy (PC1 = −4.662; PC2 = −1.547). Among male athletes, fencing and judo showed profiles clustered in Quadrant I, indicating high propulsive output and a well-developed braking strategy. In contrast, taekwondo and particularly triathlon showed patterns associated with Quadrant IV—high propulsive output but a lower-force braking strategy. In female athletes, a minority of artistic gymnastics and judo athletes demonstrated strong jump capacity (Quadrant I), but the majority were characterized by low propulsive output, with most also displaying a lower-force braking strategy.

PCA of male athletes by sport discipline. Quadrant I (top right): high propulsive output and well-developed braking strategy. Quadrant II (top left): low propulsive power and well-developed braking strategy. Quadrant III (bottom left): low propulsive output and lower-force braking strategy. Quadrant IV (bottom right): high propulsive output and lower-force braking strategy.

PCA of female athletes by sport discipline. Quadrant I (top right): high propulsive output and well-developed braking strategy. Quadrant II (top left): low propulsive power and well-developed braking strategy. Quadrant III (bottom left): low propulsive output and lower-force braking strategy. Quadrant IV (bottom right): high propulsive output and lower-force braking strategy.
Discussion
This study provides novel insight into CMJ performance by identifying sport- and sex-specific F–t profiles through dimensional reduction, with the propulsive component emerging as the primary contributor, followed by the braking dimension. A comprehensive set of F–t variables was reduced to three coherent and functionally meaningful dimensions: propulsive, braking, and temporal–impulse. These components offer an integrated framework for profiling neuromuscular performance that extends beyond traditional single-variable approaches. The PCA revealed a propulsive dimension associated with force, power, and take-off velocity; a braking dimension linked to braking strategy; and a temporal-impulse dimension reflecting movement-time characteristics. Sport-specific patterns were evident, with gymnastics showing the highest propulsive scores in both sexes and triathlon consistently presenting the weakest profiles. Badminton and fencing demonstrated strong braking and temporal impulse capacities across sexes, while quadrant-based profiles highlighted balanced force-application patterns in male fencers and judokas and reduced braking strategy in triathletes.
The present findings support the use of PCA-derived variables from the F–t curve as meaningful descriptors of CMJ performance, providing an interpretable structure to assess neuromuscular output. The identification of three principal components (PC1–propulsive, PC2–braking, and PC3–temporal–impulse) suggests that performance is not defined by isolated variables but by the interaction of distinct mechanical capacities.14,15,50 In this context, PC1 reflects the ability to generate high concentric force, velocity, and power, which are consistently associated with jump performance outcomes. 21 Athletes with higher PC1 scores can therefore be characterized as possessing a force-dominant propulsive profile, whereas lower scores may indicate limitations in concentric output.
Complementarily, PC2 and PC3 provide additional layers of performance characterization related to braking strategy and temporal impulse characteristics, respectively. The PC2, which reflects braking strategy, is a critical determinant of effective CMJ mechanic,21,51 and prior studies highlight its importance in differentiating performance levels. 52 Lower PC2 scores indicate reduced braking capacity, suggesting that athletes exhibiting this profile, regardless of sex, may benefit from braking-focused training interventions to enhance force attenuation and subsequent force production. PC3 characteristics, associated with reactive strength and neuromuscular lower-limb stiffness, denote the efficiency of applying force in short time frames. 40 A stiffer leg strategy typically produces shorter contact times and larger, shorter-duration impulses. 2 Taken together this dimensional reduction allows practitioners to move beyond traditional single-metric approaches and instead interpret performance through integrated mechanical constructs that better reflect the complexity of the movement.39,40
Among male athletes, sport-specific CMJ profiles revealed distinct patterns. PC1 was highest in gymnastics, fencing, and badminton, and lowest in judo, taekwondo, and triathlon. These differences align with evidence that neuromuscular profiles reflect sport demands, with indoor team sports showing more time-dependent strategies and outdoor or technical sports demonstrating more force-dominant characteristics. 24 Consistent with this, table-tennis athletes showed lower propulsive performance, 53 reflecting the limited jumping requirements of the sport, whereas badminton 54 and gymnastics 55 demand explosive take-offs, explaining higher PC1 values.
Triathletes, both male and female, recorded the lowest scores across all three components. As this is the first study to characterize CMJ PCA profiles in triathlon, the findings highlight the predominantly endurance-oriented nature of the discipline. Prior work reports that endurance athletes exhibit low squat jump power and velocity, 56 consistent with the present observations for PC1, PC2, and PC3. Although explosive performance is secondary in triathlon, CMJ metrics remain relevant because jump height correlates with middle-distance running performance, 57 and plyometric training can enhance stiffness and running economy, 58 supporting the inclusion of explosive-strength training in endurance programs.
In female athletes, sport-specific trends were similar but less pronounced. PC1 was lowest in taekwondo and triathlon and highest in gymnastics, though the component discriminated less effectively between sports than in male athletes, except for the clear advantage of gymnastics. 59 For PC2, technical sports such as badminton, fencing, and gymnastics showed higher scores than combat and endurance sports, consistent with evidence that braking variables distinguish performance levels in elite sprinters 60 and correlate strongly with CMJ outcomes. 61 PC3 displayed a distinct profile in female athletes: badminton, rugby sevens, and taekwondo exhibited the highest values, whereas gymnastics showed lower ones. Lower PC3 scores were associated with deeper counter movements and prolonged time to take-off, generating higher impulse through slower strategies. This contrasts with findings in elite sprinters, where higher impulse is produced via more effective SSC utilization—shorter contact times, higher stiffness, and enhanced elastic energy reuse. 60 In our sample, lower-limb stiffness did not differ meaningfully across sports, suggesting that higher impulse in some female athletes may result from extended movement durations, which may not be optimal for tasks requiring rapid explosive output.
Despite the findings and their practical implications, several limitations must be considered when interpreting these results. Although the sample was relatively large, all athletes were recruited from the Madrid High Performance Centre, limiting sport diversity and representation. Distribution across disciplines was uneven, with some sports represented by small or single-sex groups, which restricts the strength of sport-specific comparisons.
A key methodological limitation involves normalization of mechanical variables. Outputs were normalized to total body mass rather than fat-free mass (FFM). As females typically present higher relative fat mass, this method may underestimate their true neuromuscular performance. Sex differences reported here should not be interpreted as purely biological or architectural, and using FFM normalization may substantially reduce, or even eliminate, several observed effects. Future studies should incorporate FFM-based normalization to ensure more physiologically meaningful comparisons.
It should also be acknowledged that many CMJ force–time variables are mechanically interdependent due to the impulse–momentum relationship that governs centre-of-mass motion. Although PCA was used to reduce redundancy and extract key mechanical components, future work may benefit from analytical frameworks built explicitly on impulse–momentum or work–energy principles depending on the research aims.
The study also focused solely on CMJ performance. Including complementary tasks such as the drop jump or CMJ rebound would provide insight into reactive strength and stretch–shortening cycle efficiency. Although force–time metrics offer valuable information, there is still no consensus on the most sensitive variables for performance monitoring, and PCA poses challenges regarding interpretation of component-level outputs. Finally, the cross-sectional design prevents conclusions about changes over time; longitudinal studies are needed to evaluate how neuromuscular profiles evolve within and between sports.
Conclusions
Based on these results, we conclude that CMJ performance in elite athletes can be effectively characterized through three underlying mechanical dimensions, propulsive, braking, and temporal impulse, which reveal distinct sport- and sex-specific neuromuscular strategies. By reducing complex force–time data into an interpretable structure, PCA provides a valuable framework for athlete profiling, performance monitoring, and the identification of discipline-specific mechanical characteristics in high-performance sport.
Practical applications
The PCA-derived framework provides practitioners with a practical way to summarize CMJ F-t data into three interpretable mechanical dimensions: propulsive, braking, and temporal–impulse. Rather than relying on isolated F-t variables, coaches can use these dimensions to identify individual athlete profiles and compare them with the typical characteristics observed within a given sport and sex. This approach may help contextualize strengths and limitations in force application strategies and support longitudinal monitoring of neuromuscular performance. However, the present findings should be interpreted as a profiling and assessment tool rather than direct evidence for specific training interventions. Future longitudinal studies should determine whether targeted changes in these PCA-derived dimensions are associated with improvements in sport-specific performance.
Footnotes
Acknowledments
The authors would like to thank all the athletes who participated in this study, as well as their respective sport federations, for their collaboration and support.
ORCID iDs
Ethical considerations
The study was approved by the Ethics Committee of the University of Extremadura (approval number: 166/2023). All procedures were conducted in accordance with the Declaration of Helsinki.
Consent to participate
All participants were fully informed about the purpose and procedures of the study and received and signed written informed consent prior to participation. For participants under 18 years of age, written informed consent was received and signed by their parents or legal guardians.
Consent for publication
All participants (or their legal guardians, where applicable) received and signed written informed consent for the use of their data for research and publication purposes. All data were anonymized prior to analysis and publication.
Funding
The authors received no financial support for the research, authorship, and/or publication of this article.
Declaration of conflicting interests
The authors declared no potential conflicts of interest with respect to the research, authorship, and/or publication of this article.
Data availability
The data are not publicly available due to ethical/privacy restrictions involving participant confidentiality.