
Abstract
The transition from youth academy to professional football requires players to adapt to progressively increasing physical and technical demands, yet simultaneous quantification of these demands across the developmental pathway remains limited. This study employed foot-mounted inertial measurement units (IMUs) to profile the technical and physical performance of 67 male academy football players across three age groups (U16, U18, U20) during training (n = 1808 observations) and competitive matches (n = 606 observations) over a full season. Results demonstrated that the U20 cohort exhibited significantly higher technical involvement (3.84 vs. 3.18 touches/min, p < 0.001) and greater maximum release velocities (16.58 vs. 15.57 m/s right foot, p < 0.001) compared to the U16 group during training. The transition from training to match-play revealed dramatically increased physical intensity (work rate up 110–130%, d > 3.0) alongside a 60–70% reduction in technical actions per minute (d > 1.0), highlighting the unique stress of competition. Speed zone analysis indicated the U20 group covered a significantly higher proportion of total distance at high speeds (>3.6 m/s; p < 0.001). Positional analyses revealed distinct physical and technical fingerprints, with midfielders exhibiting the highest work rates and forwards demonstrating the greatest frequency of intense speed changes. Microcycle analysis confirmed progressive tapering from MD-4 to match day, with the U20 group maintaining higher intensities closer to competition. These findings provide practitioners with age- and position-specific benchmarks for training and match-play, facilitating targeted developmental interventions and evidence-based load management in elite youth football.
Introduction
The development of elite youth football players is a complex, multidimensional process requiring the systematic progressive overload of physical, technical, tactical, and psychological stimuli. 1 As players transition through the academy pathway towards senior professional football, the demands of the game increase exponentially, necessitating a concurrent evolution in the player's physical capacity and technical proficiency. 2 Understanding these evolving demands is critical for coaches and sports scientists who must design appropriate training interventions, manage fatigue and injury risk, and optimise the developmental trajectory of each individual player.
Historically, the quantification of these demands has relied heavily on global positioning systems (GPS) and optical tracking technologies, which provide robust locomotive data – such as total distance covered, high-speed running distance, and sprint counts. While some advanced optical tracking platforms can infer certain technical behaviours, they often face limitations in accuracy and granularity. Consequently, these systems offer limited insight into the technical loading and demands of skills such as passing, receiving, and ball manipulation. 3 This limitation has created a significant blind spot in the monitoring of youth development, where technical progression is critical for academy progression, as the ability to execute high-speed technical actions under pressure often differentiates elite youth from their peers.1,2 Technical development in football encompasses the refinement of ball manipulation, passing, and receiving under varying constraints. These qualities are challenging to quantify using traditional monitoring tools that lack foot-ball interaction data, making IMU technology particularly valuable for addressing this limitation.
Recent advancements in micro-electromechanical systems (MEMS), specifically foot-mounted inertial measurement units (IMUs), have begun to address this limitation by enabling the simultaneous capture of both physical and technical metrics from a single wearable device. 4 These devices, typically worn over the boot, incorporate triaxial accelerometers and gyroscopes to detect foot-ball interactions, quantifying not only how far and how fast a player runs, but also their interaction with the ball, including touch volume, release velocity, bilateral foot proficiency, and possession characteristics.
Research utilising foot-mounted IMUs can be broadly categorised into validation studies, match-play analyses, and investigations of combined physical-technical load. Regarding validation, Lewis et al. 4 and Myhill et al. 15 demonstrated the validity and reliability of foot-mounted IMUs in quantifying high-speed technical actions and velocity in professional populations. This established a robust foundation for their application in youth development contexts. In terms of match-play analysis, Escreet et al. 5 utilised the same technology to compare technical and possession statistics across academy age groups. They reported significant age-related differences in possession frequency and one-touch actions. Examining combined loads, Losada-Benitez et al. 6 further demonstrated the utility of foot-mounted IMUs in quantifying the combined technical and physical load imposed on players during competitive matches. Their work revealed that the integration of these metrics provides a more holistic representation of player workload than either domain alone. However, despite these insights, few studies have integrated both training and match data across multiple youth age groups, a gap this study aims to address.
Despite these advances, several critical gaps remain in the literature. First, the majority of existing studies have focused exclusively on either training or match data, rarely integrating both within the same analytical framework. Training sessions are designed to replicate or exceed match intensities to ensure physical preparedness; however, the chaotic, high-pressure environment of a competitive match often elicits distinct physiological and technical responses that training alone cannot fully simulate. 7 Understanding the magnitude of the discrepancy between training and match demands – and how this discrepancy varies across age groups – is essential for designing training programmes that adequately prepare players for the realities of competition.
Second, while positional differences in physical output have been well documented in senior football, 8 there is a paucity of research examining how positional demands evolve across the youth academy spectrum when both technical and physical metrics are considered simultaneously. Third, the analysis of specific technical actions such as release velocity and bilateral proficiency across developmental stages remains largely unexplored, despite their obvious relevance to player recruitment and development decisions.
Furthermore, the periodisation of training load across the weekly microcycle is a cornerstone of elite football preparation, 9 yet few studies have examined how microcycle loading patterns differ across academy age groups. Recent work by Franceschi et al. 17 highlighted marked fluctuations in daily load across microcycles in late-stage academy players, but understanding whether younger players are exposed to similar periodisation strategies – and whether they respond similarly – has important implications for load management and injury prevention in youth populations.
Therefore, the primary aim of this study was to comprehensively quantify the technical and physical demands of youth academy football across three distinct age groups (U16, U18, U20) using foot-mounted IMUs. Specifically, this study sought to: (1) establish age-specific technical and physical profiles during training; (2) compare these training profiles to competitive match-play demands; (3) investigate positional differences in performance metrics; (4) analyse the evolution of release velocity and bilateral proficiency across the developmental pathway; and (5) characterise the weekly microcycle loading patterns employed for each age group. It was hypothesised that the U20 cohort would demonstrate superior technical efficiency and a more explosive physical profile compared to the younger groups, and that the transition from training to match-play would reveal significant increases in physical intensity alongside reductions in technical output.
Methods
Study design and participants
A prospective, observational, longitudinal study design was employed over the course of a full competitive season at a professional football academy. The academy followed a standardised training curriculum across all age groups, and coaches were blinded to the specific research aims to minimise behavioural bias. Data were collected from 67 male academy outfield football players categorised into three age groups: U16 (n = 21), U18 (n = 18), and U20 (n = 28). Goalkeepers were excluded from the analysis due to their distinct movement and technical profiles. Inclusion criteria required players to be registered members of the academy squad and free from long-term injury at the start of the season. Individual sessions were excluded from the final dataset where incomplete data, device malfunction, or acute injury occurred during the session.
The dataset comprised 2424 individual player-session observations, including 1808 training observations across 163 training sessions and 606 competitive match observations across 23 matches. Players were further categorised by their primary playing position into three broad groups: Defenders (n = 1009 observations across the season), Midfielders (n = 780 observations), and Forwards (n = 635 observations). The detailed positional breakdown included 13 specific roles (e.g., Centre Back, Attacking Midfielder, Right Winger). Dominant foot was recorded for all players, with the vast majority being right-footed. Ethical approval was granted by the institutional review board, and informed consent was obtained from all participants (and their legal guardians for minors under 18 years of age) prior to data collection. All procedures were conducted in accordance with the Declaration of Helsinki. The study attained ethical approval (AUT; 22/353).
Procedures and equipment
Physical and technical performance data were collected using a commercially available, foot-mounted IMU system (Playermaker, Tel Aviv, Israel). The device consists of a 6-axis IMU incorporating a triaxial accelerometer and triaxial gyroscope (MPU-9150 chip), housed within a lightweight silicone strap worn over each boot. The system samples at 1000 Hz and has been previously validated for the quantification of both locomotive and technical actions in professional football, with acceptable levels of reliability (coefficient of variation < 5% for key metrics).4,15 Players wore the same designated pair of devices for all training sessions and competitive matches throughout the data collection period to eliminate inter-device variability. Data were downloaded post-session via the manufacturer's proprietary docking station and processed using their cloud-based analytics platform (software version 7.2). Training sessions were tagged according to their position within the weekly microcycle relative to match day (MD-4, MD-3, MD-2, MD-1, MD + 1), enabling the analysis of periodisation strategies across age groups.
Missing or corrupted data (e.g., due to device battery failure or Bluetooth disconnection) were removed pairwise. Warm-up periods were included in the analysed data to capture the full technical and physical load of each session. All teams typically followed a standard one-match-per-week schedule; atypical weeks involving fixture congestion or rest weeks were excluded from the microcycle analysis to ensure consistency and comparability. Training sessions were not strictly standardised by duration across age groups, necessitating the use of per-minute normalisation for all training data and training-to-match comparisons.
Variables
The analysis encompassed a comprehensive suite of 57 variables spanning technical, possession, physical, and velocity domains. Technical metrics included total touches, left and right leg touches, releases (left and right), touches per minute, and releases per minute. Bilateral proficiency was calculated as the percentage of total touches and releases executed with each foot. Possession characteristics – available primarily for match data (n = 606) – included total possessions, one-touch possessions, short possessions, long possessions, and total time on the ball. Physical metrics included total distance covered (m), work rate (m/min), high-intensity distance (HID; distance covered above 5.28 m/s), sprint distance (SD; distance covered above 6.4 m/s), sprint count, top speed, and intense speed changes (accelerations and decelerations exceeding 2.6 m/s2). Distance covered was further stratified into seven distinct speed zones ranging from Zone 1 (0–1.5 m/s) to Zone 7 (>6.4 m/s). Release velocity metrics included the minimum, maximum, and average velocity of ball releases (m/s) for both the left and right foot independently.
Statistical analysis
All statistical analyses were performed using Python (v3.11) with the SciPy (v1.17) statistical library. Descriptive statistics (mean ± standard deviation) were calculated for all variables, stratified by age group, session type, and position category. Given the non-normal distribution of the majority of variables (assessed via visual inspection of histograms and Shapiro-Wilk tests on subsamples), non-parametric tests were employed throughout. Kruskal-Wallis H tests were used to assess differences between the three age groups and the three position categories, with post-hoc pairwise Mann-Whitney U tests conducted where significant omnibus effects were observed. Mann-Whitney U tests were also utilised for direct comparisons between training and match-day data within each age group. Effect sizes were calculated using Cohen's d to quantify the practical magnitude of observed differences, interpreted according to conventional thresholds: small (d = 0.2), medium (d = 0.5), and large (d = 0.8). 10 Statistical significance was set at p < 0.05 for all analyses. To account for differences in session duration between training and matches, per-minute normalised metrics were used for all training-to-match comparisons. Effect sizes (Cohen's d) are reported for all major pairwise comparisons to facilitate interpretation of practical significance.
Results
Technical balance and volume during training
Analysis of training data revealed significant differences in both technical volume and bilateral proficiency across the three age groups. The U20 cohort demonstrated the highest technical involvement, averaging 3.84 ± 2.37 touches per minute and 1.43 ± 1.01 releases per minute, both significantly greater than the U16 (3.18 ± 1.87 touches/min; 1.05 ± 0.62 releases/min) and U18 (2.93 ± 1.81 touches/min; 1.02 ± 0.72 releases/min) groups (Touches: H = 52.27, p < 0.001, d = 0.30; Releases: H = 73.77, p < 0.001, d = 0.52). In absolute terms, the U20 group accumulated 379.48 ± 253.34 total touches per session compared to 303.84 ± 165.83 for U16 and 287.70 ± 172.24 for U18 (H = 44.95, p < 0.001). The effect size for the U18-U20 comparison in touches per minute was small-to-medium (d = 0.41), while the U16-U20 comparison yielded a small effect (d = 0.30).
Regarding bilateral proficiency, the U18 group exhibited the most balanced touch distribution (Left 42.9%, Right 57.1%), while the U20 group showed the greatest dominant-foot reliance (Left 33.0%, Right 67.0%). The U16 group fell between the two (Left 35.6%, Right 64.4%). The release distribution followed a similar pattern, with the U18 group distributing releases more evenly (Left 38.4%, Right 61.6%) compared to U16 (Left 28.4%, Right 71.6%) and U20 (Left 26.8%, Right 73.2%). Kruskal-Wallis tests confirmed these differences were statistically significant for both touch distribution (H = 46.77, p < 0.001) and release distribution (H = 32.44, p < 0.001). Figure 1 illustrates the bilateral touch and release distributions by age group.
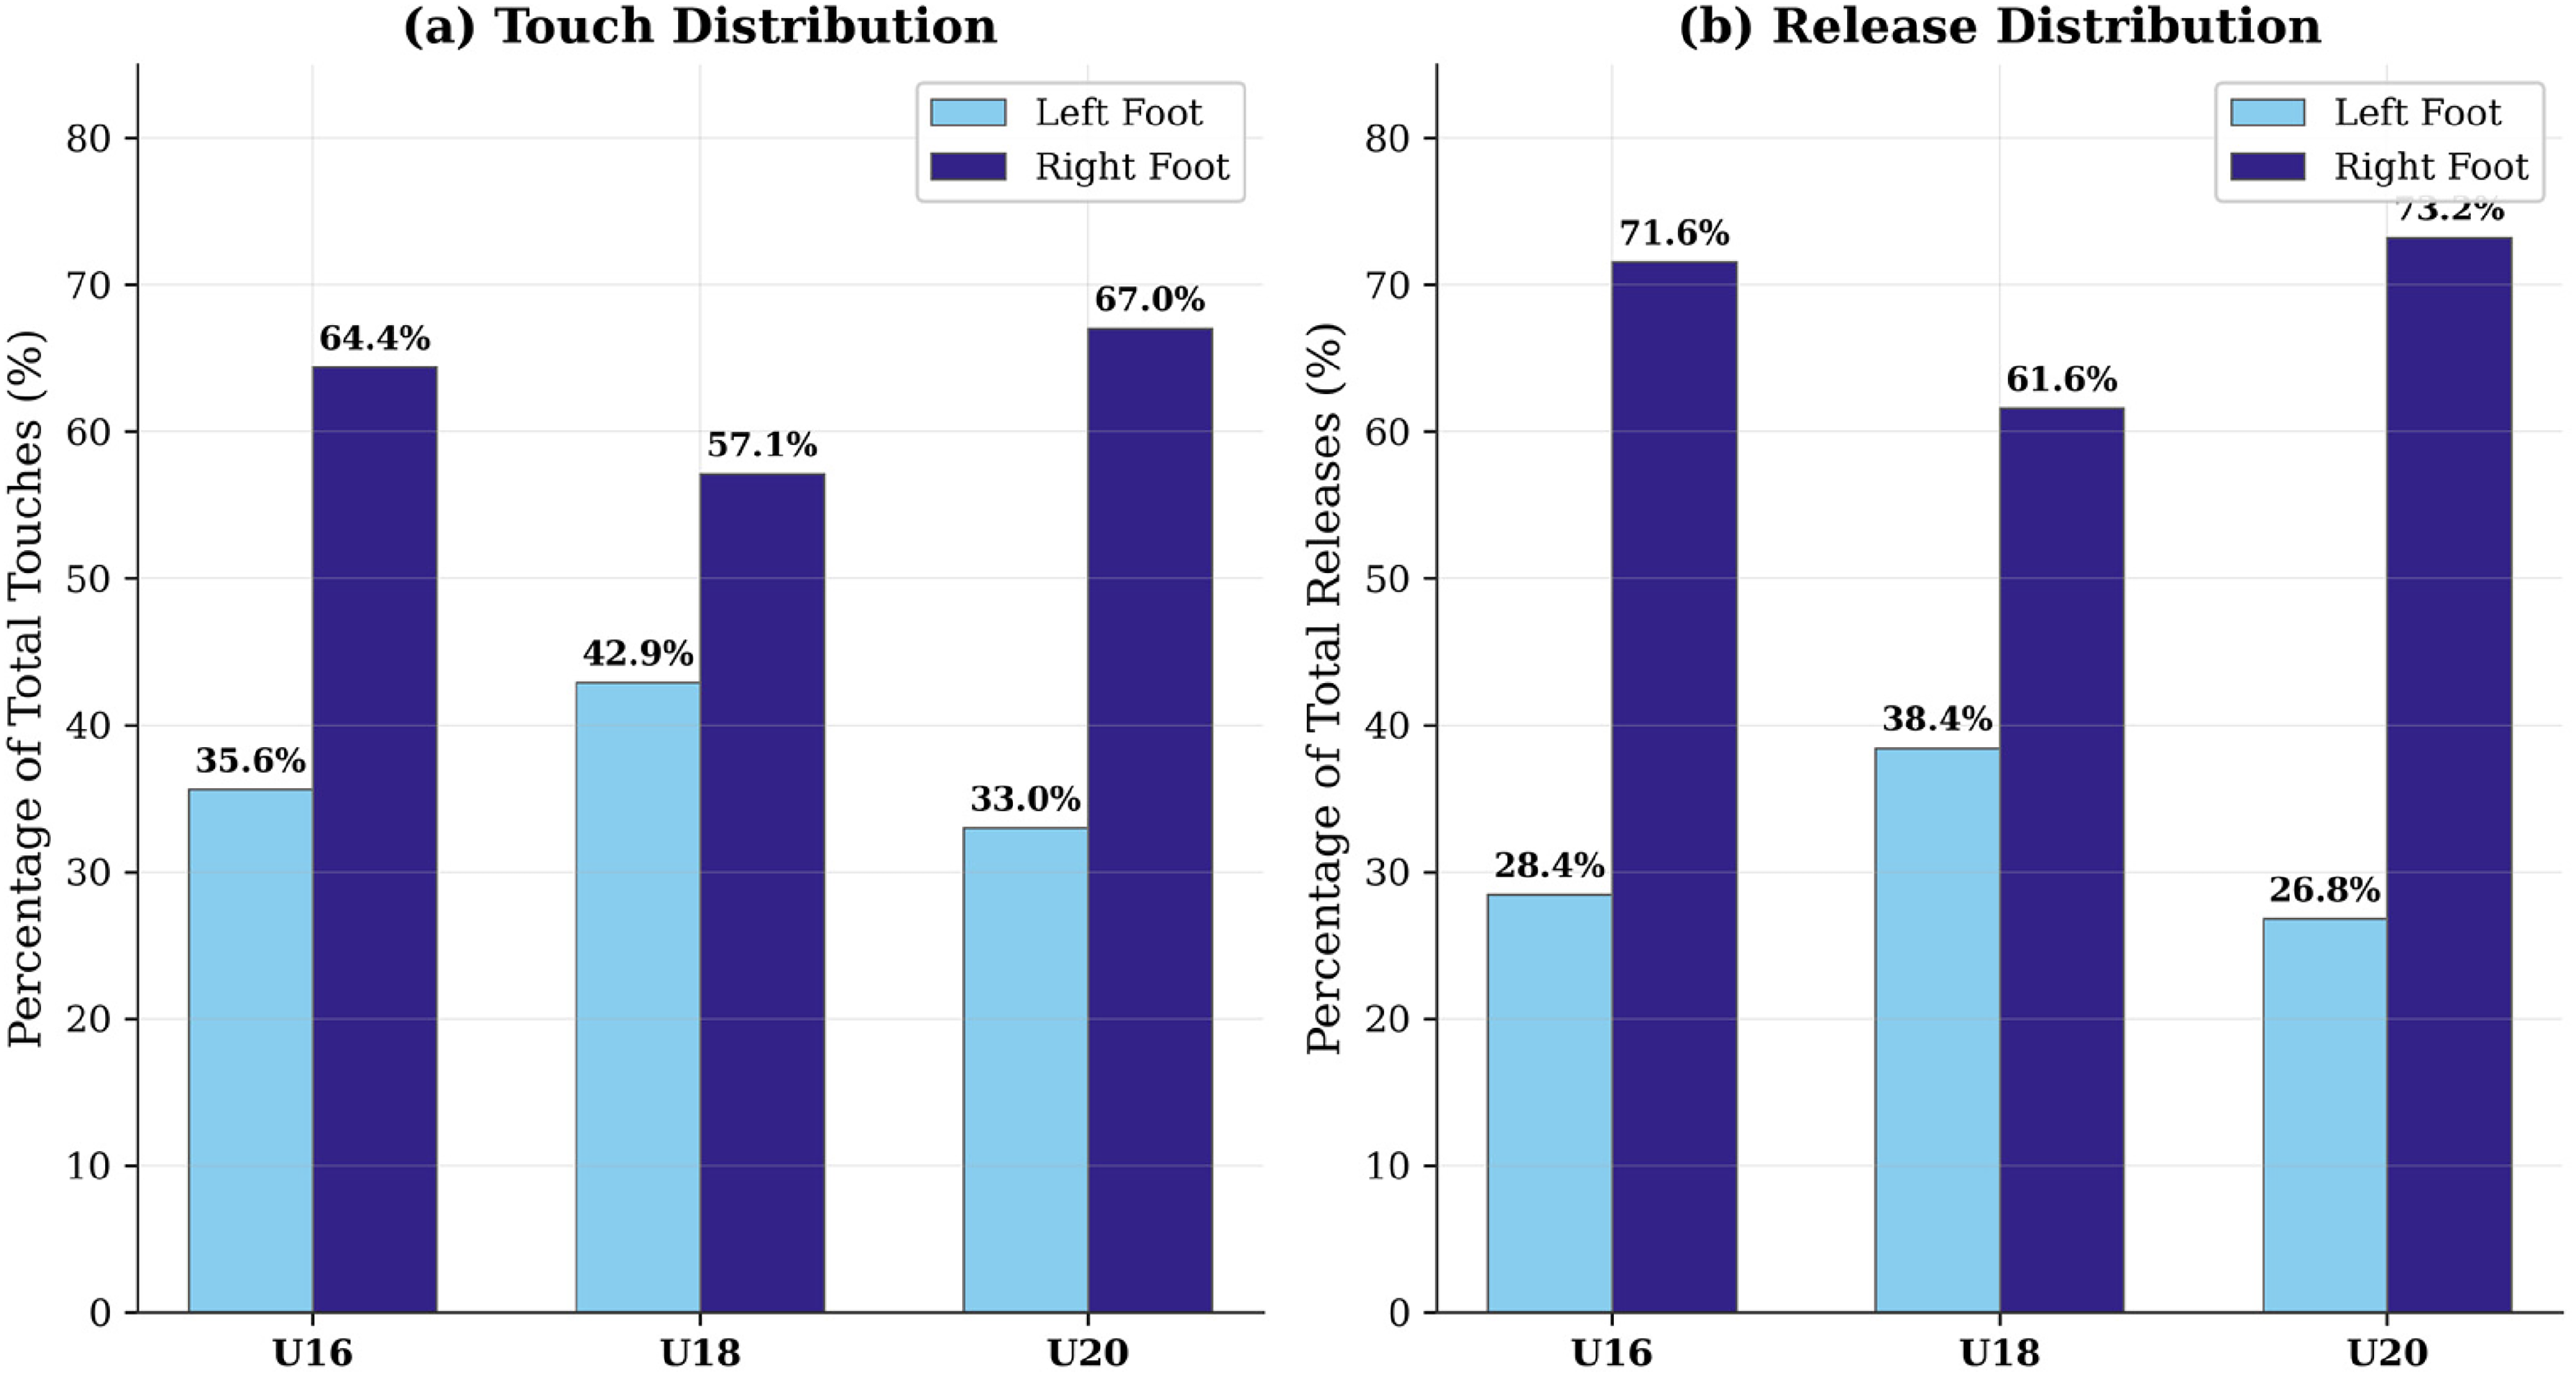
Bilateral technical balance by age group (training). *** p < 0.001 for touch distribution (H = 46.77) and release distribution (H = 32.44) between age groups. Panel (a) displays the percentage of touches with the left and right foot. Panel (b) displays the percentage of releases with each foot. The U18 group exhibited the most balanced bilateral distribution, while the U20 group demonstrated the greatest dominant-foot reliance.
Physical demands during training
The U20 group covered the greatest total distance during training (5089.79 ± 1461.27 m), significantly exceeding both the U16 (4477.42 ± 1485.47 m) and U18 (4669.09 ± 2128.47 m) groups (H = 58.68, p < 0.001, d = 0.42). Work rate followed a similar pattern, with U20 averaging 51.46 ± 13.86 m/min compared to U16 (46.27 ± 14.79) and U18 (45.92 ± 17.47) (H = 36.98, p < 0.001, d = 0.36). The U20 group also recorded the highest top speed (6.18 ± 0.73 m/s), HID per minute (0.81 ± 1.03 m/min), and sprint count (1.27 ± 2.33), all significantly greater than the younger groups. Notably, the rate of intense speed changes per minute did not differ significantly between age groups (U16: 0.49; U18: 0.47; U20: 0.49; H = 0.86, p = 0.65), indicating that the frequency of explosive directional changes during training was similar across the groups.
Training vs. Match-Day Demands
A critical comparison between training and match-day data revealed profound and statistically significant shifts in performance metrics across all age groups. The transition to competitive match-play resulted in a substantial increase in physical intensity, with work rate more than doubling: U16 increased from 46.27 ± 14.79 m/min in training to 95.59 ± 16.39 m/min in matches (d = 3.26); U18 from 45.92 ± 17.47 to 105.34 ± 16.19 m/min (d = 3.49); and U20 from 51.46 ± 13.86 to 108.20 ± 11.37 m/min (d = 4.26). High-intensity distance per minute increased by a factor of 3.5 to 4.5 across the groups, with the U20 cohort exhibiting the greatest match-day HID output (3.64 ± 2.09 m/min vs. 0.81 ± 1.03 in training, d = 2.09). Intense speed changes per minute also increased significantly in matches across all groups (U16: 0.65 vs. 0.49, d = 0.63; U18: 0.57 vs. 0.47, d = 0.38; U20: 0.70 vs. 0.49, d = 0.75), with the U20 group demonstrating the largest match-day values and the largest effect size.
Conversely, technical actions per minute decreased substantially during match-play. Touches per minute fell by 60–70% across all groups: U16 from 3.18 to 0.95 (d = −1.35); U18 from 2.93 to 1.12 (d = −1.20); U20 from 3.84 to 1.19 (d = −1.27). Releases per minute showed a comparable reduction, with training-to-match ratios of 0.32–0.42 across the age groups. All comparisons were statistically significant (p < 0.001). Figure 2 presents the training versus match-day comparison across six key per-minute normalised variables.
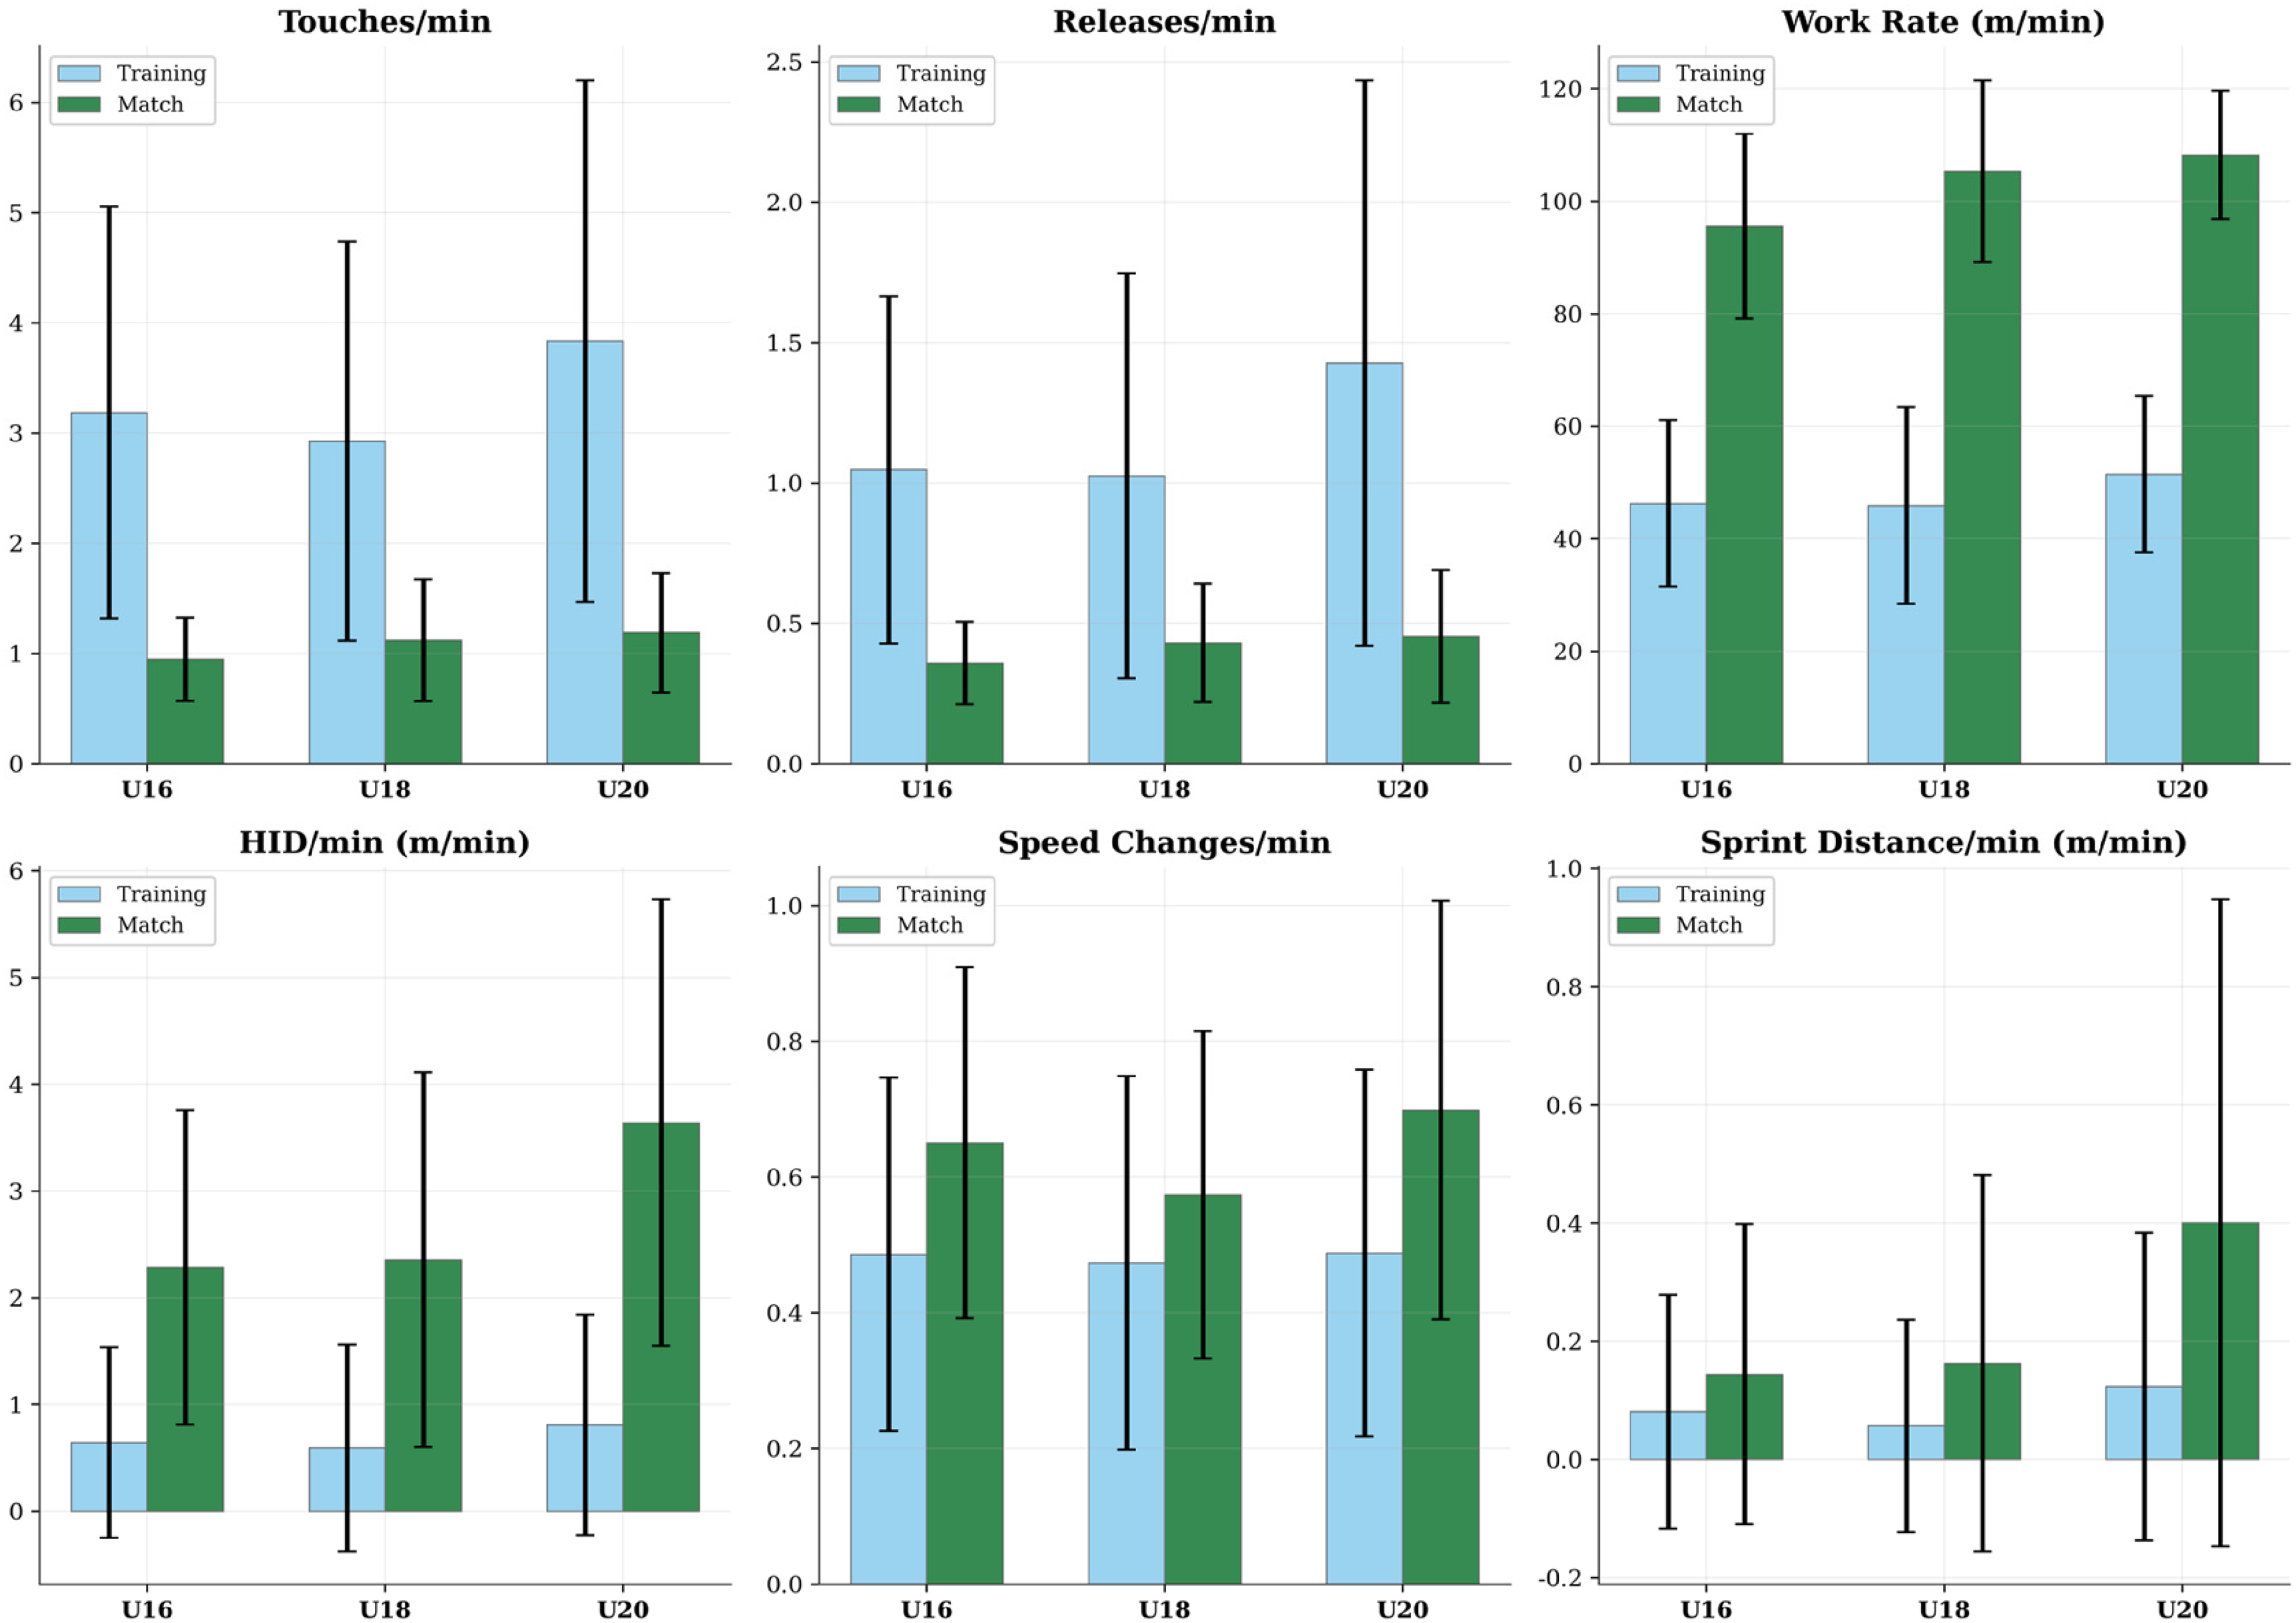
Training vs. Match-Day Demands by Age Group (per minute normalised). *** p < 0.001 for all training vs. match-day comparisons across all age groups and all variables. Upper panels display technical metrics (Touches/min, Releases/min) and Work Rate. Lower panels display high-intensity physical metrics (HID/min, Speed Changes/min, Sprint Distance/min). Error bars represent standard deviations.
Speed zone profiles
The distribution of distance across seven speed zones revealed significant age-related differences in locomotor profiles. While the U16 group spent the largest proportion of their total distance in Zone 1 (0–1.5 m/s; 39.3%), the U20 group allocated a significantly greater proportion to the higher-intensity zones. Specifically, the U20 group covered more distance in Zone 3 (2–3 m/s; 1374 ± 525 m vs. 1116 ± 451 m for U16), Zone 5 (3.6–5.3 m/s; 695 ± 524 m vs. 514 ± 390 m), Zone 6 (5.3–6.4 m/s; 94 ± 101 m vs. 67 ± 80 m), and Zone 7 (>6.4 m/s; 15 ± 27 m vs. 8 ± 20 m). Kruskal-Wallis tests were significant for Zones 1, 3, 4, 5, 6, and 7 (all p < 0.001), but not for Zone 2 (p = 0.26). Figure 3 presents the speed zone profiles, including the proportion of total distance covered at high speeds (>3.6 m/s), which illustrates the differing locomotor profiles between the age groups.
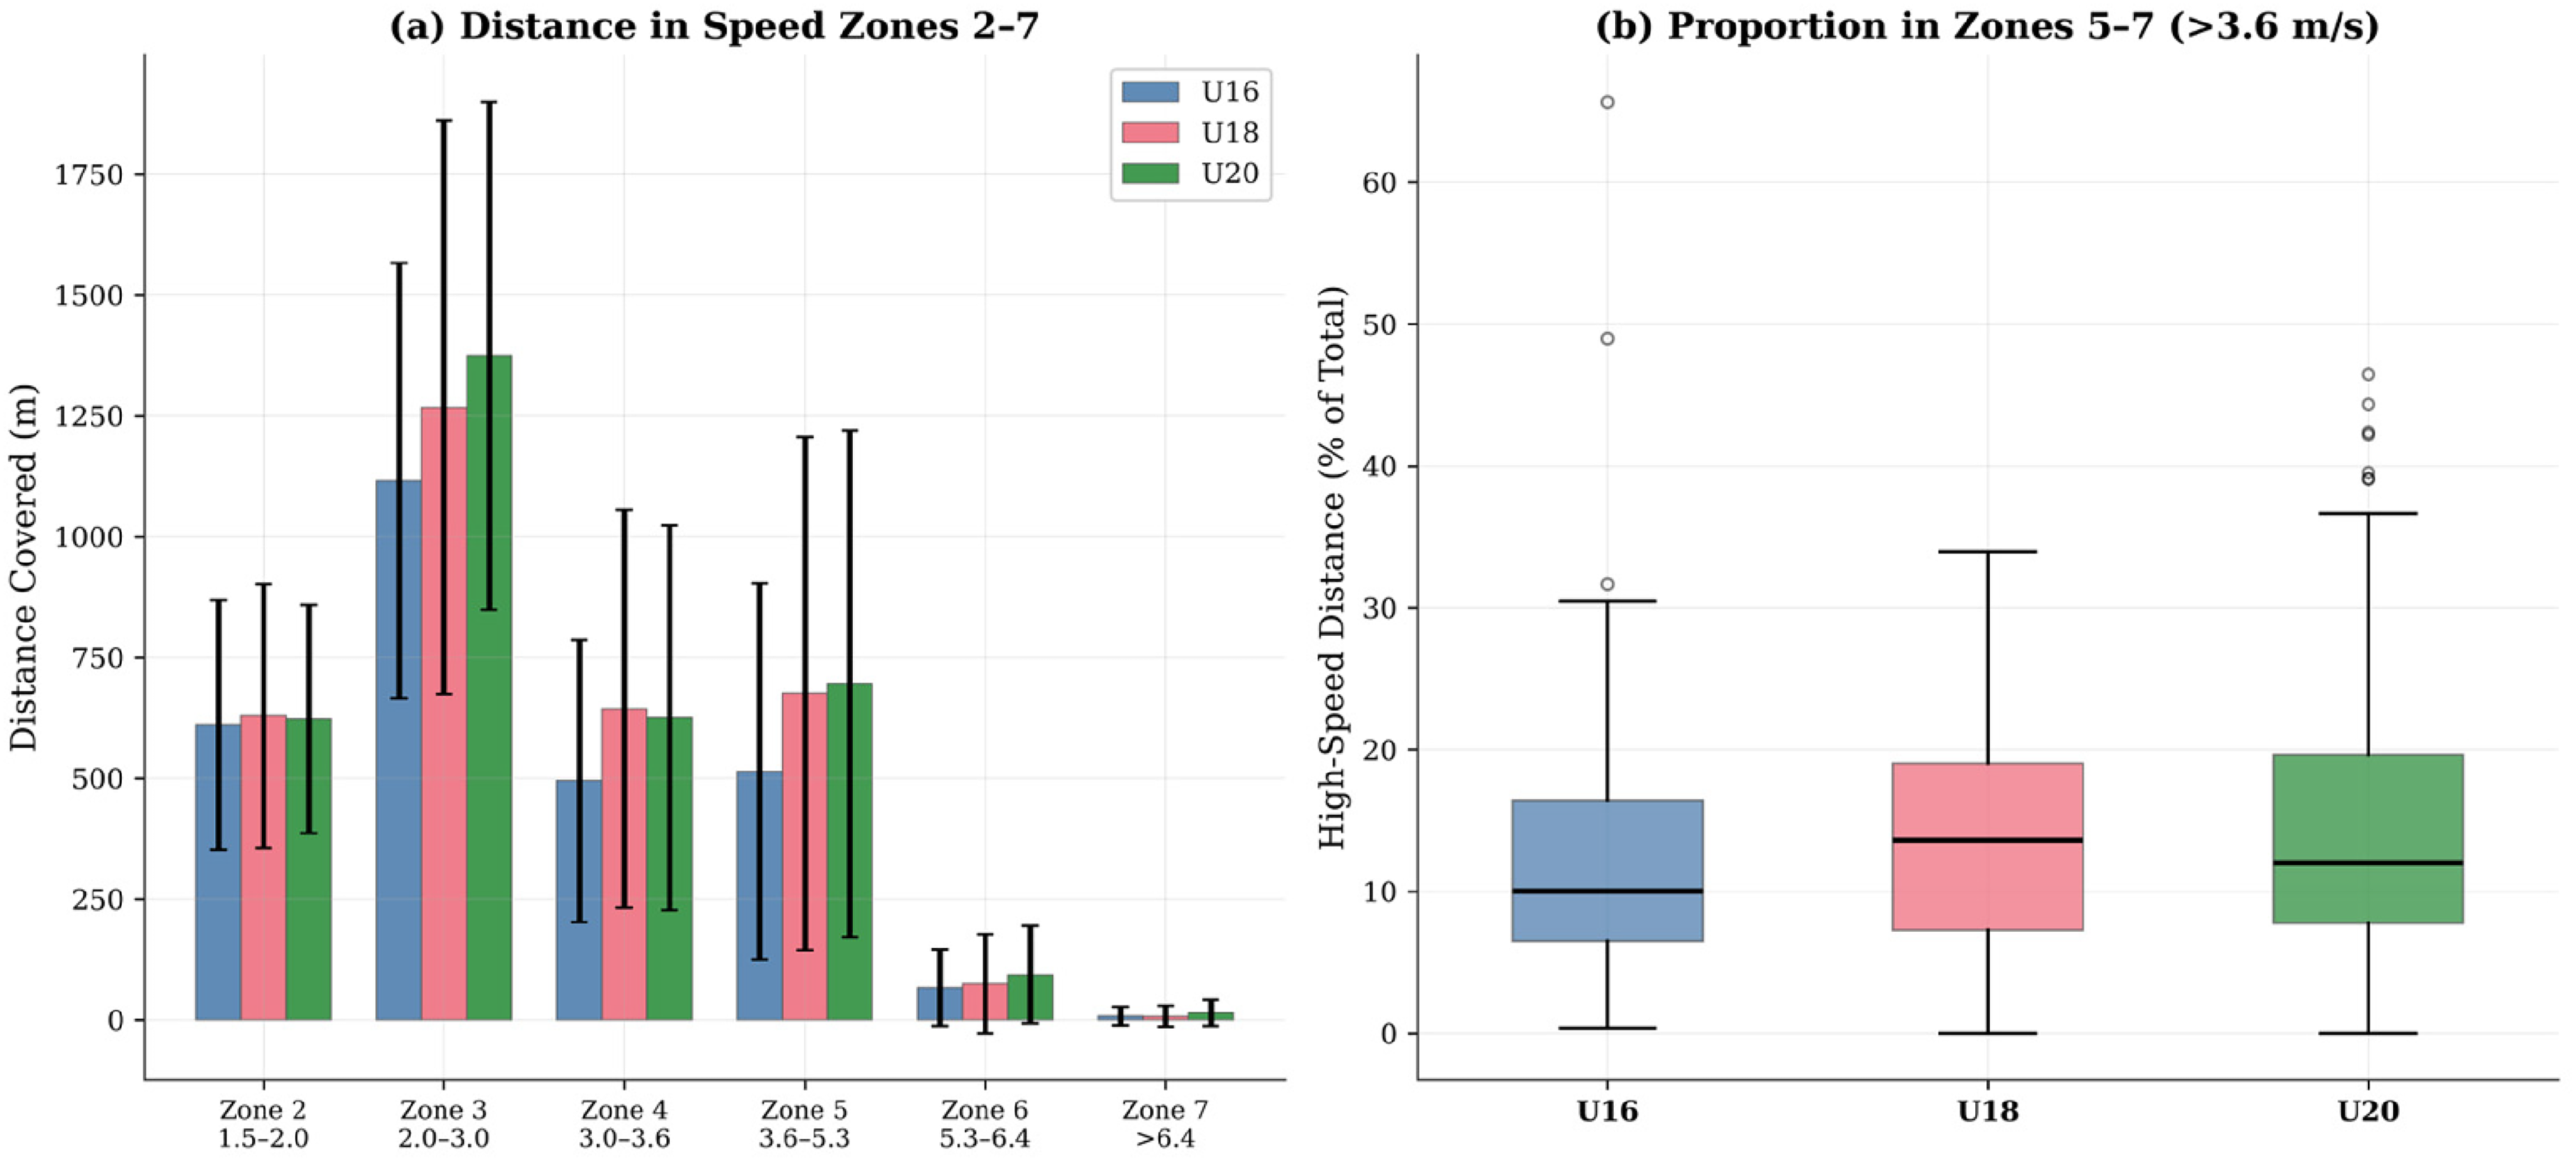
Speed zone profiles by age group. *** p < 0.001 for Zones 1, 3, 4, 5, 6, and 7 between age groups; Zone 2 was not significant (p = 0.26). Panel (a) shows absolute distance covered in speed zones 2–7. Panel (b) illustrates the proportion of total distance covered at high speeds (Zones 5–7, >3.6 m/s).
Positional differences
Significant positional differences were observed across the dataset. Midfielders exhibited the highest overall distance covered (5251 ± 1866 m) and work rate (65.43 ± 29.44 m/min), significantly exceeding Forwards (4948 ± 1756 m; 61.19 ± 28.26 m/min) (Distance: H = 7.32, p = 0.03, d = 0.17). Defenders recorded the highest releases per minute (1.09 ± 0.85), significantly greater than both Midfielders (1.00 ± 0.81) and Forwards (1.02 ± 0.90) (H = 10.22, p = 0.006, d = 0.10). The interaction between Age Group and Position Category revealed noteworthy patterns (Figure 4). U20 Forwards exhibited the highest rate of intense speed changes (0.61 ± 0.29/min) across all age-position combinations, substantially exceeding U16 Forwards (0.48 ± 0.31/min). In contrast, the technical involvement (touches/min) of Defenders, Midfielders, and Forwards converged at the U20 level (3.18, 3.12, and 3.41 respectively), whereas at U16 level, Defenders had notably higher involvement (2.81) than Midfielders (2.49).
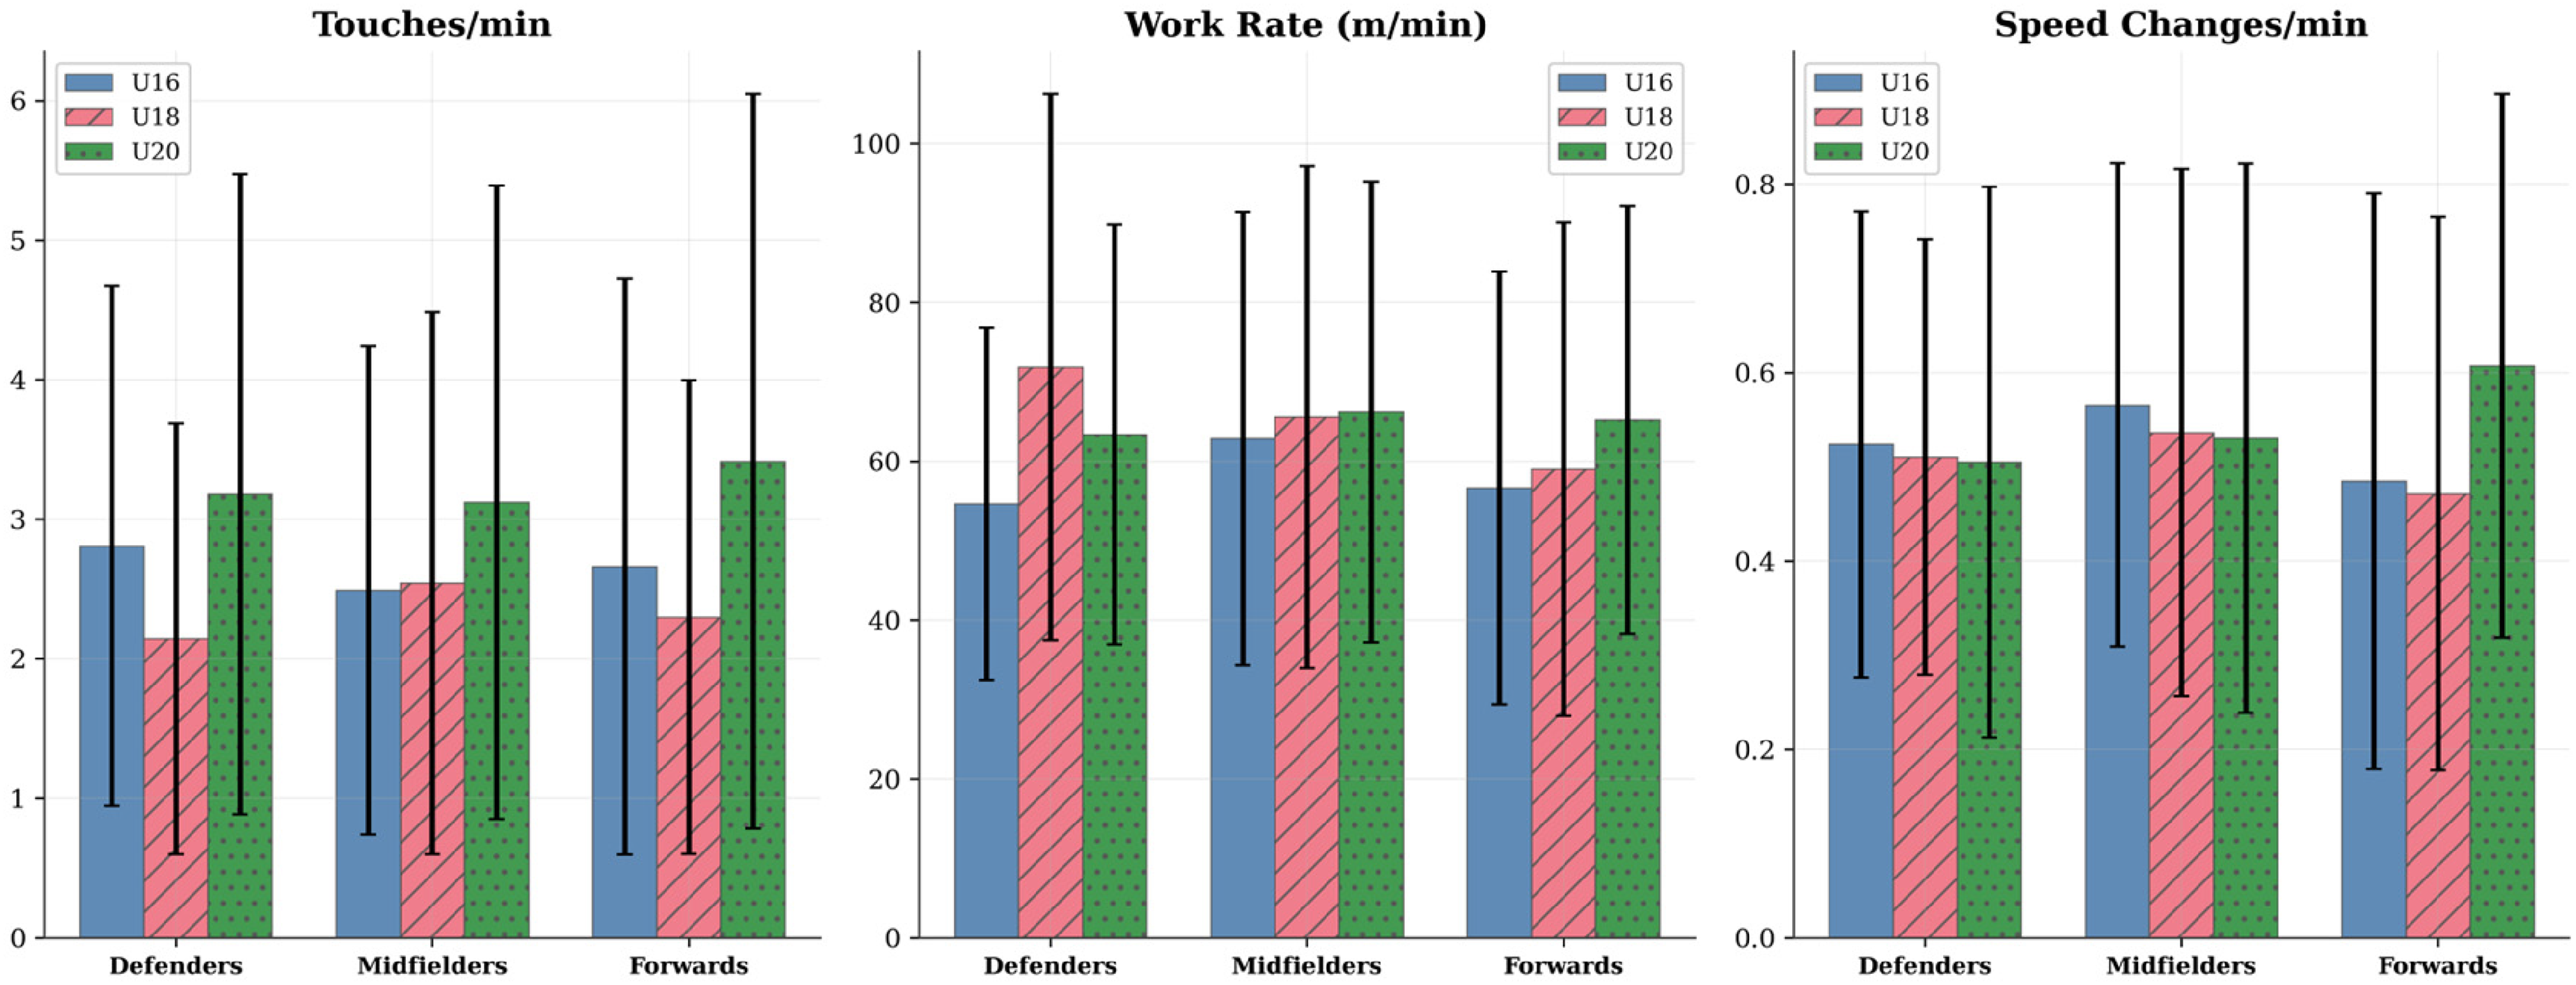
Age group × position category interaction for touches/min, work rate (m/min), and speed changes/min. * p = 0.03 for distance (Midfielders > Forwards); ** p = 0.006 for releases/min (Defenders > Midfielders and Forwards). Bars represent means with standard deviation error bars.
Release velocity
The analysis of release velocity revealed a clear progression in passing power across the age groups. The U20 cohort generated significantly higher maximum release velocities with both the right foot (16.58 ± 2.04 m/s vs. 15.57 ± 2.07 for U16 and 15.41 ± 2.49 for U18; H = 162.73, p < 0.001, d = 0.49) and the left foot (14.48 ± 2.63 m/s vs. 13.27 ± 2.80 for U16 and 14.21 ± 2.87 for U18; H = 81.19, p < 0.001, d = 0.44). Average release velocities showed a similar trend, with the U20 right foot averaging 12.53 ± 1.06 m/s compared to 12.06 ± 1.55 for U16 (H = 14.14, p < 0.001, d = 0.35). Notably, a bilateral asymmetry in release velocity was evident across all age groups, with right-foot maximum velocities consistently exceeding left-foot values by approximately 2 m/s. This asymmetry was most pronounced in the U16 group (right: 15.57 m/s, left: 13.27 m/s; difference = 2.30 m/s) and narrowed slightly in the U20 group (right: 16.58 m/s, left: 14.48 m/s; difference = 2.10 m/s), indicating differences in non-dominant foot power between the age groups (Figure 5).
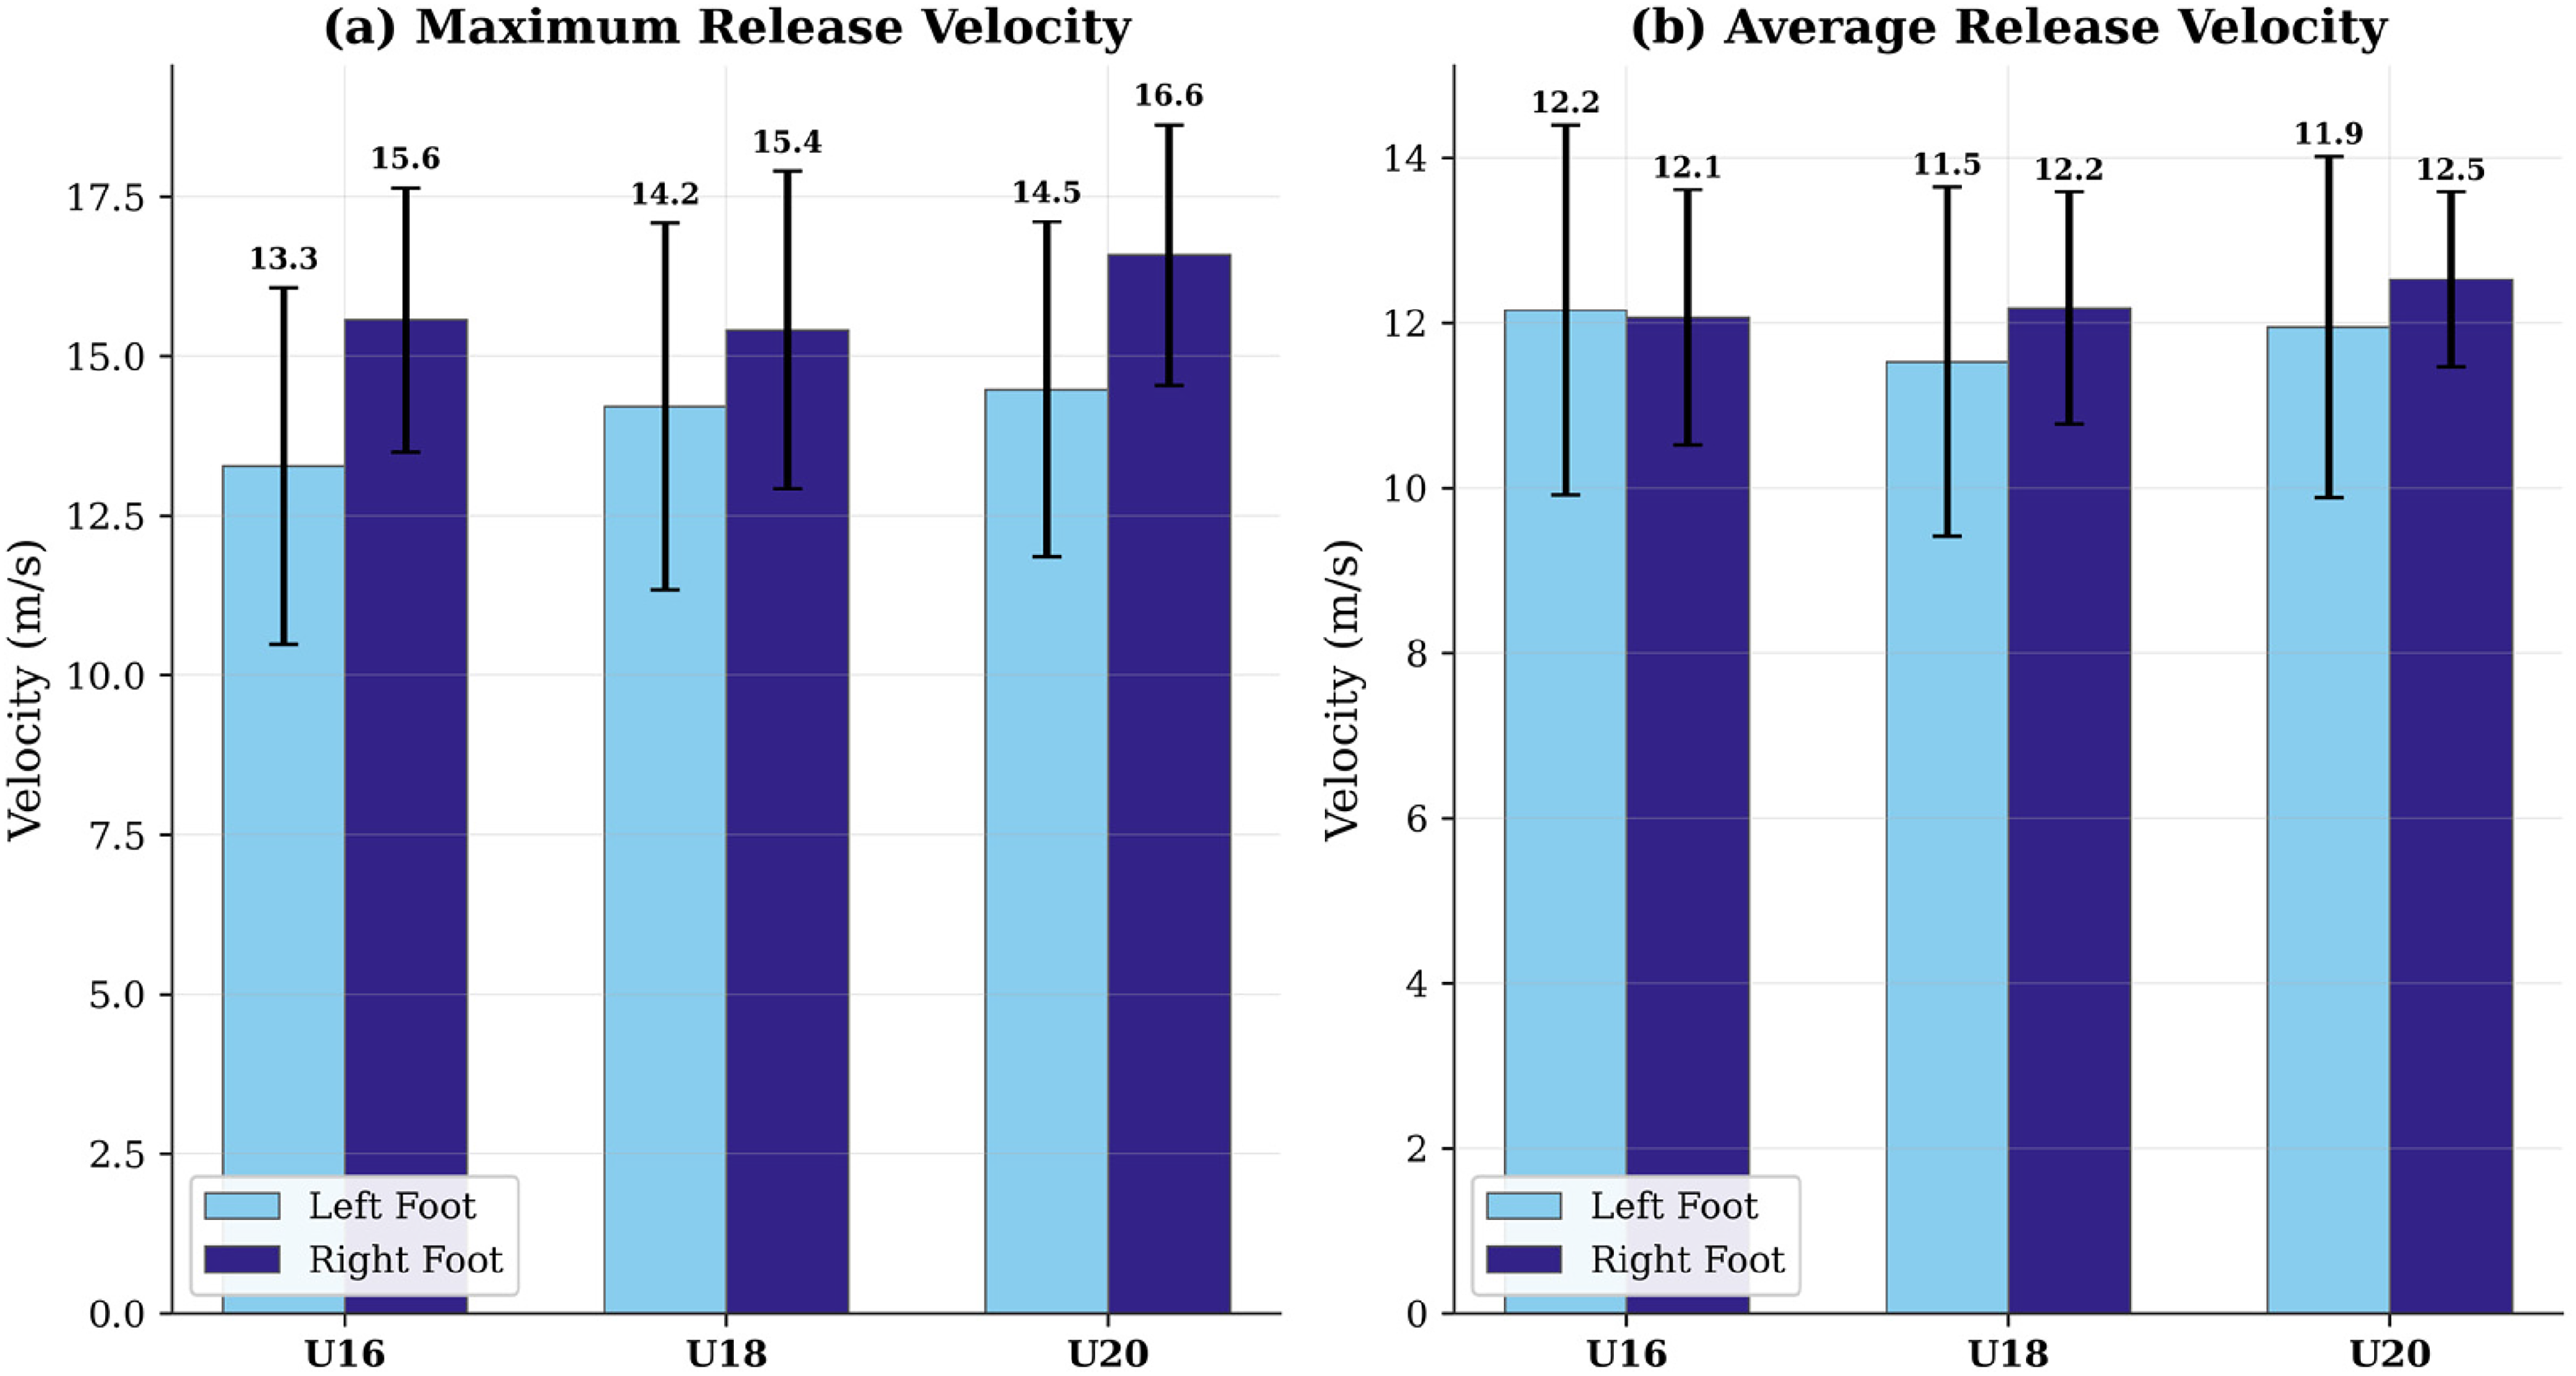
Release velocity by age group and foot. *** p < 0.001 for maximum release velocity (right foot: H = 162.73; left foot: H = 81.19) and average release velocity (right foot: H = 14.14) between age groups. Panel (a) displays maximum release velocity. Panel (b) displays average release velocity. Error bars represent standard deviations. Values above bars indicate group means.
Microcycle loading patterns
Analysis of training days relative to match day revealed distinct periodisation strategies across the age groups. A clear tapering effect was observed across all groups, with work rate and distance covered peaking at MD-4 and progressively decreasing towards match day. At MD-4, the U20 group recorded the highest work rate (65.72 ± 19.74 m/min) and distance (6410 ± 1438 m), followed by U18 (60.71 m/min; 6103 m) and U16 (57.98 m/min; 5796 m). By MD + 1 (recovery day), all groups showed substantially reduced outputs, though the U20 group maintained a notably higher work rate (44.17 m/min) compared to U16 (29.47 m/min) and U18 (32.64 m/min). Intense speed changes per minute followed a similar tapering pattern, decreasing from MD-4 (U16: 0.59; U18: 0.56; U20: 0.52/min) to MD + 1 (U16: 0.25; U18: 0.31; U20: 0.40/min). Figure 6 illustrates the weekly microcycle loading patterns across the three age groups.
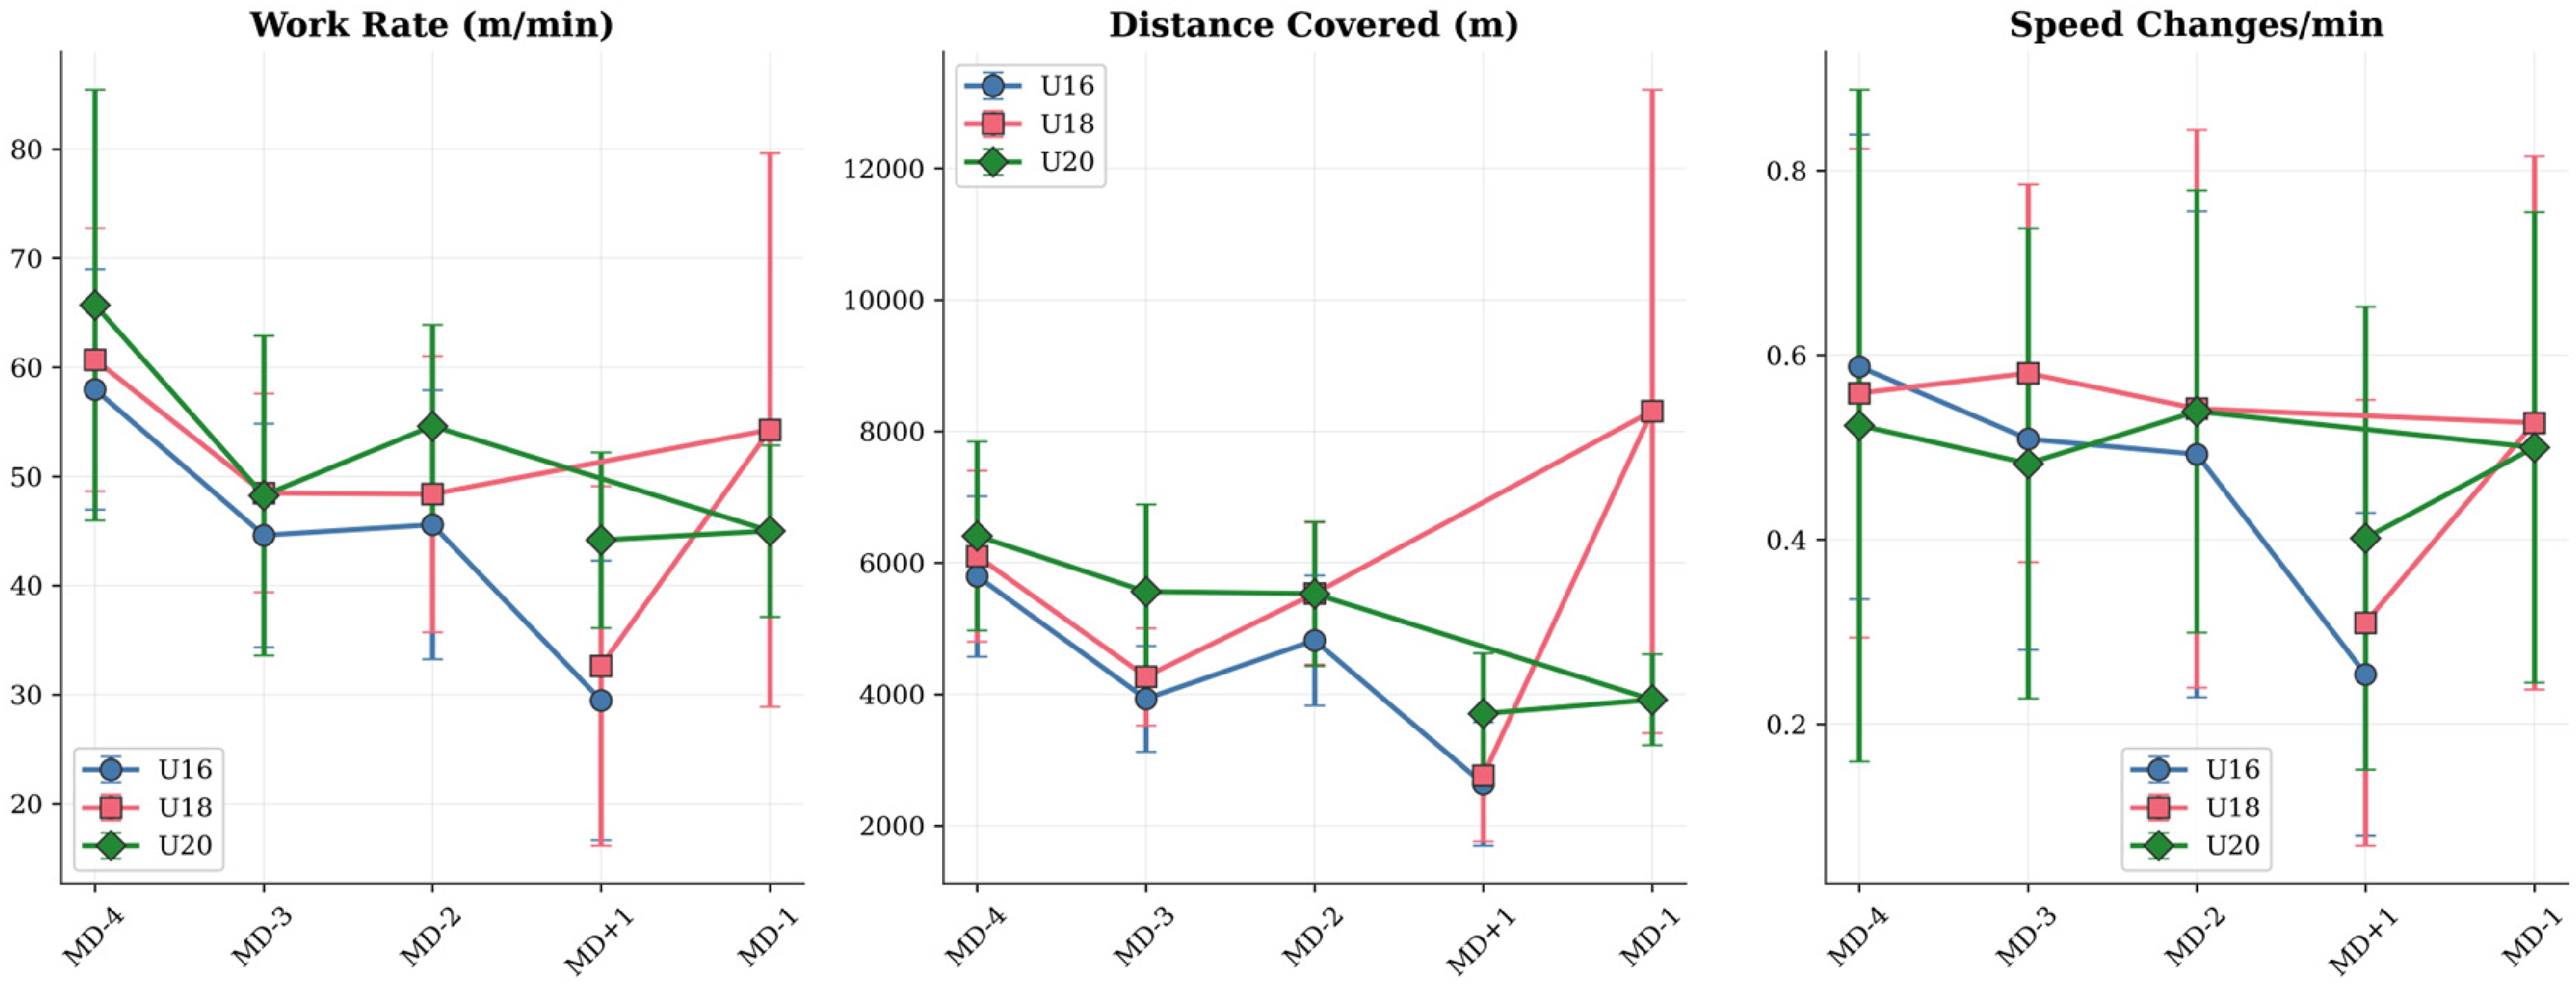
Weekly microcycle loading pattern by age group. Line graphs illustrate the tapering of Work Rate (m/min), Distance Covered (m), and Speed Changes/min from MD-4 to MD + 1 (recovery day). Error bars represent standard deviations. All groups demonstrated a progressive reduction in physical load approaching match day, consistent with established periodisation practice. The U20 group maintained higher outputs on recovery days (MD + 1) compared to younger groups.
Match possession characteristics
During competitive matches, the U20 group recorded significantly more total possessions per match (27.61 ± 17.27) than the U16 (20.44 ± 9.68) and U18 (21.41 ± 11.82) groups (H = 17.15, p < 0.001, d = 0.51). The U20 group also recorded more short possessions (8.10 ± 6.76 vs. 4.90 ± 2.97 for U16; H = 18.75, p < 0.001) and long possessions (10.31 ± 7.66 vs. 7.37 ± 4.77 for U16; H = 15.34, p < 0.001). The U16 group exhibited the highest percentage of one-touch possessions (40.5 ± 17.0%), whereas the U20 group had the lowest (35.9 ± 17.4%) (H = 9.97, p = 0.007). Time on the ball per possession did not differ significantly between groups (U16: 1.24 s; U18: 1.22 s; U20: 1.32 s; p = 0.11). Positional analysis of match possession data revealed that Defenders accumulated the most possessions (28.19 ± 17.12), while Midfielders spent the longest time per possession (1.41 ± 0.49 s) and had the lowest one-touch percentage (34.2%), reflecting their role in retaining and distributing possession (Figure 7).
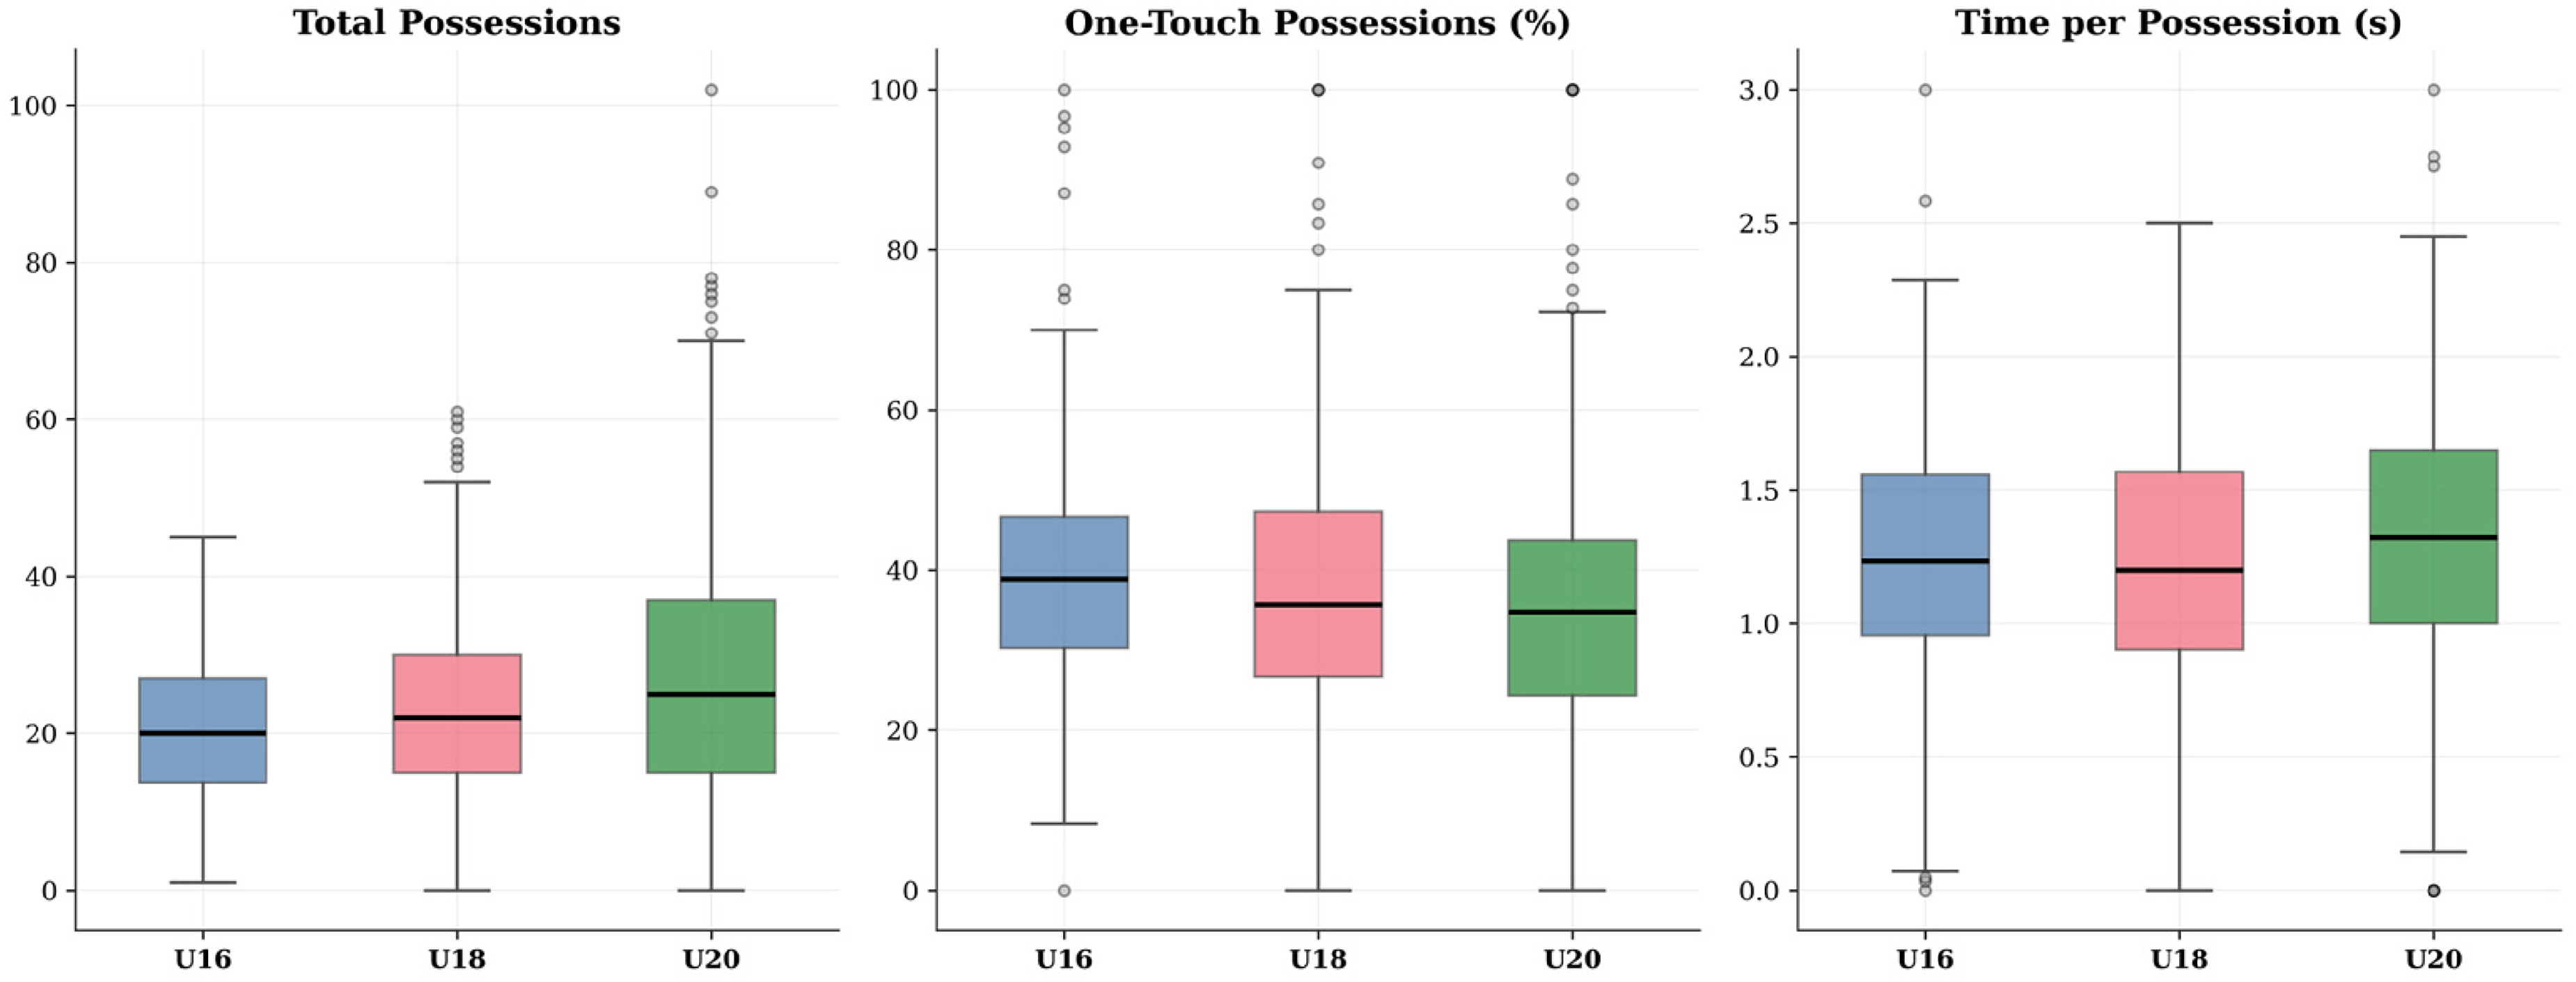
Match-Day possession characteristics by age group. *** p < 0.001 for Total Possessions (H = 17.15); ** p = 0.007 for One-Touch Percentage (H = 9.97); Time per Possession was not significant (p = 0.11). Boxplots display Total Possessions, One-Touch Percentage, and Time per Possession (seconds).
Discussion
This study provides a comprehensive, multidimensional analysis of the technical and physical demands placed on youth academy football players across three distinct age groups. By leveraging foot-mounted IMU technology and integrating both training and match-day data alongside positional stratifications, this investigation addresses several significant gaps in the existing literature. The findings offer novel, actionable insights into the differences in player performance from U16 to U20 and provide practitioners with evidence-based benchmarks for optimising youth development programmes.
Perhaps the most striking finding of this study is the profound disparity between training and match-day demands. Across all age groups, the transition to competitive match-play elicited a dramatic increase in physical intensity – evidenced by work rates more than doubling and high-intensity distance per minute increasing by a factor of 3.5 to 4.5 – coupled with a 60–70% reduction in technical actions per minute. The effect sizes for these differences were uniformly large (d > 1.0 for technical reductions; d > 3.0 for work rate increases), underscoring the practical significance of this training-to-match gap. This disparity is meaningful for player development as it highlights a potential under-preparation during training for the demands of competition, where space and time are severely restricted by opposition pressure. This inverse relationship between physical intensity and technical output highlights the unique stress of the match environment. 7 These findings are consistent with Guerrero-Calderón et al., 7 who reported significant discrepancies between training and match metabolic loads in professional players, and extend this work by demonstrating that the same phenomenon exists – and is equally pronounced – in youth populations. The practical implication is clear: coaches should consider incorporating specific high-intensity, technically demanding drills that simultaneously overload players both physically and technically, thereby better preparing them for the dual challenge of competitive match-play. 11
The analysis of speed zone profiles revealed a critical shift in locomotor strategy between the age groups. Although the U20 group covered the greatest total distance during training, the more important finding is the redistribution of that distance towards higher-intensity speed zones. The U20 group covered significantly more distance in Zones 5, 6, and 7 (>3.6 m/s), indicating a shift towards a more explosive, high-intensity locomotor profile in the older age groups. It is important to acknowledge that these differences may not solely reflect biological development; variations in coaching philosophy, session design, or tactical periodisation between the age groups could also contribute to the higher volumes of high-speed running observed. This finding aligns with Barnes et al., 12 who documented an evolution in the physical demands of the English Premier League towards greater high-speed running, and is further supported by recent work from Cardoso et al., 18 who found significant differences in acceleration-speed profiles between age groups throughout a season. From a practical standpoint, this has direct implications for the design of physical conditioning programmes: while general aerobic capacity building remains important in early adolescence, the emphasis should progressively shift towards repeated sprint ability, change-of-direction speed, and explosive power development as players approach the senior transition. 13 These conditioning recommendations are important as matching the explosive demands of senior match-play is a key barrier in the transition from youth to professional football.
The positional analysis revealed distinct physical and technical fingerprints that must inform individualised development plans. Midfielders consistently exhibited the highest work rates and total distances, reflecting their dual role in linking defence and attack, a finding consistent with the seminal work of Di Salvo et al. 8 in senior football. Forwards, conversely, demonstrated the highest frequency of intense speed changes, indicative of the explosive movements required to evade defenders and create goal-scoring opportunities. This aligns with Thoseby et al., 16 who identified peak acceleration demands as a key differentiator between elite youth and professional players. The Age Group x Position interaction during training is particularly noteworthy: the physical demands placed on U20 Forwards (0.61 speed changes/min) were substantially higher than those on U16 Forwards (0.48/min), whereas the demands on Defenders remained relatively stable across age groups. This suggests that the explosive demands placed on forwards may increase disproportionately as players progress through the academy. This indicates that the developmental pathway is not uniform across positions; a ‘one-size-fits-all’ approach to physical preparation is therefore suboptimal, and training must be tailored to the specific positional demands the player will face at the next competitive level.
Technically, the U20 cohort demonstrated several markers of superior proficiency. They generated significantly higher maximum release velocities with both feet, which may be related to age-group differences in lower-limb strength and accumulated technical refinement. 14 This increased passing velocity enables faster ball circulation and the ability to exploit fleeting spatial advantages in high-pressure match situations. Regarding bilateral proficiency, the U18 group exhibited the most balanced touch distribution, while the U20 group showed greater dominant-foot reliance. Recent research by Želežnik et al. 19 suggests that functional symmetries and bilateral ability are key indicators of player level in youth football. Interestingly, during matches, the U20 group recorded more total possessions but a lower percentage of one-touch actions compared to the U16 group. Rather than indicating inferior tempo, this may reflect greater tactical awareness, potentially allowing older players to secure possession and assess their options, although psychological and tactical variables were not directly measured in this study. The finding that Midfielders spent the longest time per possession (1.41 s) and had the lowest one-touch percentage (34.2%) is consistent with their role in controlling the rhythm of the game. These findings align with Escreet et al., 5 who reported similar age-related trends in possession characteristics during academy match-play.
The microcycle analysis provides valuable insights into the periodisation strategies employed across the academy. The clear tapering pattern from MD-4 to match day is consistent with established best practice in elite football, 9 with the highest physical loads occurring early in the week and progressively decreasing to allow for physiological recovery and tactical preparation. This is supported by Franceschi et al., 17 who observed marked fluctuations of daily load across microcycles in late-stage academy players. Notably, the U20 group maintained higher physical outputs on recovery days (MD + 1) compared to the younger groups (44.17 vs. 29.47 m/min for U16), which could indicate either a greater physiological capacity for recovery or a more demanding recovery session protocol at the senior academy level. This finding has implications for load management, suggesting that recovery protocols may need to be age-specific rather than uniformly applied across the academy.
While this study provides robust and novel insights, certain limitations must be acknowledged. The dataset did not include direct measures of biological maturation (e.g., peak height velocity offset), which is a known confounding variable in youth physical performance research. 2 Accordingly, all differences reported herein should be interpreted as age-group differences rather than maturational effects. Future studies should integrate bio-banding methodologies to isolate the effects of maturation from chronological age. Additionally, while the IMU technology provides excellent technical data, it lacks the spatial context provided by optical tracking or GPS systems; combining IMU data with tactical positioning data would offer a more holistic view of performance. The unbalanced sample sizes across age groups (U20 having the most observations) may also influence the statistical comparisons, although the use of non-parametric tests mitigates this concern. Finally, the possession data were available primarily for matches, limiting the ability to compare possession characteristics between training and match environments. Future research should seek to capture possession data during training to enable a more complete comparison.
Conclusion
In conclusion, this study demonstrates that differences between age groups in a football academy include higher-intensity physical outputs, greater technical volume and efficiency, and enhanced release velocity in older cohorts. These observed patterns may arise from a combination of age-related factors, training design, coaching strategies, and differing tactical demands. The stark contrast between training and match demands – with physical intensity more than doubling while technical actions per minute decrease by 60–70% – emphasises the critical need for training methodologies that accurately replicate the peak intensities and technical pressures of competition. The identification of distinct positional fingerprints and age-specific microcycle loading patterns provides practitioners with granular, evidence-based benchmarks for designing individualised development programmes. By utilising these benchmarks, coaches and sports scientists can implement more targeted interventions – tailoring physical conditioning to positional demands, integrating high-intensity technical drills to bridge the training-to-match gap, and applying age-appropriate periodisation strategies – ultimately supporting the developmental trajectory of elite youth football players and facilitating their successful transition to the professional game.
Footnotes
Ethical considerations
Ethical approval was granted to use the deidentified dataset analysis (AUT; 22/353).
Consent to participate
Organisational and informed consent was obtained from all participants (and their legal guardians for minors under 18 years of age) prior to data collection. All procedures were conducted in accordance with the Declaration of Helsinki.
Funding
The authors received no financial support for the research, authorship, and/or publication of this article.
Declaration of conflicting interests
The authors declared no potential conflicts of interest with respect to the research, authorship, and/or publication of this article.
Data availability
The datasets generated during and/or analysed during the current study are available from the corresponding author on reasonable request.