
Abstract
Sorafenib has been used for the treatment of liver cancer. However, its clinical impact on human immunity system remains poorly known. Our previous study has shown that sorafenib modulates immunosuppressive cell populations in murine liver cancer models. Here, we continue to report that low doses of sorafenib promotes the survival of murine bone marrow cells (BMCs) in a dose-dependent manner by up-regulating the anti-apoptotic protein survivin. Sorafenib induces differentiation of BMCs into suppressive dendritic cells that inhibit autologous T-cell proliferation and stimulate CD4+ T cells to express increased IL-1β, IL-2, IL-4, IL-10, IFN-γ and TNF-α, and reduced levels of IL-6 and CD25, which indicates that sorafenib-induced dendritic cells represent a distinct cellular subset with unique properties. Taken together, our findings suggest that in addition to its anticancer effects, sorafenib has an immunoregulatory property that is apparent at low doses.
Introduction
Dendritic cells (DCs) are unique bone marrow-derived APCs that play a fundamental role in initiating and regulating immune responses against pathogens and endogenous cancers.1–3 DCs are migratory cells whose functions are associated with specific differentiation stages and influenced by endogenous and exogenous factors that positively or negatively modulate their ability to direct T cells to become allergic, memory or effector T cells. 4 Thus, the ability of DCs to initiate an appropriate immune defense is critically dependent on signals present in the local microenvironment.5,6 Because the immune system is important for detecting and killing tumor cells, it is important to establish a detailed understanding of the potential coincident effects of chemotherapeutic agents on DCs and other immune cells.
As a potent anticancer therapeutic drug, the multi-kinase inhibitor sorafenib has been approved by the FDA for the treatment of patients with advanced renal cell cancer and hepatocellular carcinoma and has been widely tested for use in the treatment of different cancers either alone or in combination with other therapy.7,8 Sorafenib negatively regulates tumor development by inducing apoptosis and inhibiting growth or angiogenesis of malignant cells.9,10 Most recently, accumulating data have shown that in addition to its cytotoxicity to cancer cells, sorafenib can modulate the function of immune cells by inhibiting DCs and natural killer cells, impairing T-cell activation responses, and suppressing the phosphorylation of the Src family kinase LCK.11–16 Our previous data also indicated that sorafenib exerted effects on immunosuppressive cell populations in a xenograft liver cancer murine model. 17 However, the impacts of sorafenib on the immunity system of patients with hepatocellular carcinoma (HCC) remain to be further understood.
Here, we report that sorafenib can promote dose-dependent survival of murine bone marrow cells (BMCs) and induce their differentiation into suppressive DCs. Sorafenib-induced DCs (SIDCs) can inhibit the proliferation of autologous T cells and modify their ability to express IL-1β, IL-2, IL-4, IL-10, IFN-γ, IL-6, TNF-α and CD25. These findings reveal a new mechanism of action of sorafenib, which may help in the rational design of regimens for the treatment of cancer.
Materials and methods
Reagents and Abs
Recombinant mouse granulocyte macrophage colony-stimulating factor (GM-CSF) was purchased from R&D Systems (Minneapolis, MN, USA). Sorafenib (p-toluenesulfonate salt, 99%) was obtained from LC Laboratories (Woburn, MA, USA) and resolved in DMSO to yield a 100-mg/ml stock solution, which was stored at −20℃. Anti-cyclin D1, anti-cyclin E, anti-Bcl-xL, anti-survivin and anti-β-actin Abs were obtained from Cell Signaling Technology (Beverly, MA, USA); goat anti-rabbit HRP-conjugated secondary Ab was purchased from Santa Cruz Biotechnology (Santa Cruz, CA, USA). Fluorescence-conjugated mAbs of CD11b, CD11c, CD80, CD86, F4/80, CD25, and MHC class I and II, as well as isotype IgG-matched control mAbs, were purchased from BD Biosciences (San Jose, CA, USA).
Mice
Six- to eight-wk-old female BALB/c mice were purchased from The Jackson Laboratory (Bar Harbor, ME, USA) and housed under specific pathogen-free conditions for at least 1 wk before use. All animal experiments were performed in accordance with the approved protocols and advice of the Institutional Animal Care and Use Committee at the University of Florida in Gainesville, FL, USA.
Generation of bone marrow-derived DCs
DCs were generated from BMCs obtained from BALB/c mice as described previously.
17
Briefly, BMC were flushed from femurs and tibias, and single cell suspensions were obtained by passage through a 27-gauge needle and filtering with a cell strainer (70 mesh; BD Biosciences), followed by erythrolysis in Red Blood Cell Lysis Buffer (Sigma, St. Louis, MO, USA). Cells (8 × 10⁶) were counted and cultured in 100-mm culture dishes in 10 ml RPMI 1640 medium containing 10% FBS, 2 mM
FACS
The phenotypes of different DC were examined by flow cytometry. Briefly, cells were harvested, washed with PBS and re-suspended in FACS staining buffer (2% FBS and 2 mM EDTA in PBS). Cells were first blocked with 10% (v/v) normal goat serum for 15 min at 4℃ and stained with fluorescence-conjugated mouse mAbs against CD11b, CD11c, CD80, CD86, F4/80, or MHC class I and II (MHC-I and MHC-II) for 30 min at 4℃. The appropriate conjugated isotype-matched IgGs were used as controls. Cells were analyzed on a FACS Calibur system with Cell Quest software (Becton Dickinson, San Jose, CA, USA).
Isolation of CD4+ T cells from mouse spleen
CD4+ T cells were prepared from BALB/c mouse spleen by negative selection using CD4+ T-cell enrichment cocktail from Stem Cell Technologies (Vancouver, Canada) according to manufacturer’s instructions. The purity of CD4+ T cells was consistently around 95%.
Mixed leukocyte reaction assay
The stimulators in the mixed leukocyte reaction assay (MLR) were BALB/c mouse bone marrow-derived DCs. Different concentrations of DCs (irradiated at 30 Gy of gamma ray before use) were cultured with 1 × 10⁵ CD4+ T cells in each well of a U-bottomed 96-well plate in 200 μl RPMI 1640 containing 10% FCS in the presence of 2.5 µg/ml anti-CD3 and 2.5 µg/ml anti-CD28 for 3 d. [3H]Thymidine (1 μCi) was added to each well for the last 16 h. The cells were harvested and thymidine incorporation was determined by scintillation counting. All experiments were performed in triplicate incubations. In some experiments, purified CD4+ T cells were labeled with 5,6-carboxylfluorescein diacetate succinimidyl ester (CFSE), as previously described.18–20 The cells were re-suspended in 2.5 µM CFSE in PBS. After being shaken for 8 min at room temperature, the cells were washed once in pure FBS and twice in PBS with 10% FBS. DCs (1 × 10⁴) were co-cultured with 1 × 10⁵ allogeneic CFSE-labeled T lymphocytes in U-bottom 96-well plates in the absence or presence of anti-CD3 (2.5 µg/ml) and anti-CD28 (2.5 µg/ml). After 3 d, the cells were harvested and washed in PBS. CFSE dilution optically gated lymphocytes were assessed by flow cytometry.
Western blotting
Western blotting was performed as described previously. 21 Cells were treated and harvested. The cell pellets were re-suspended in lysis buffer containing Nonidet P-40. After centrifugation, the supernatant was transferred to a new tube and the protein concentration was determined. Equivalent amounts of samples were subjected to SDS-PAGE on 12% gels. Proteins were transferred to nitrocellulose membranes and probed with the indicated primary Abs, followed by the appropriate secondary Abs. Immunoreactive bands were detected using enhanced chemiluminescence (Pierce, Rockford, IL, USA). The molecular sizes of the proteins detected were determined by comparison with pre-stained protein markers (Bio-Rad, Hercules, CA, USA).
Cytokine measurement by Luminex
The cytokines in culture supernatants were analyzed by Luminex using Beadlyte Mouse Multi-Cytokine Detection System 2 (Upstate, Lake Placid, NY, USA), according to the manufacturer’s protocol.
SiRNA mediated knockdown
SiRNA-mediated survivin knockdown was performed as previously described. 22 Smart-pool pre-designed siRNA duplexes targeting survivin mRNA were from Cell Signaling Technology. BMC cultures were transfected with 100 nM siRNA duplex mixtures for 24 h in the presence of lipo-fectamine RNAiMax (Invitrogen, Carlsbad, CA, USA) according to the manufacturer’s instructions. A non-specific scramble siRNA was also transfected in parallel.
Apoptosis assay
Apoptosis was assessed by detecting phosphatidylserine exposure on the cell membrane with Annexin V staining as described previously. 21 Cells were simultaneously stained with Annexin V-FITC and PI. Comparative experiments were performed at the same time by bivariate flow-cytometry using a FACScan (BD Biosciences) and analyzed with CellQuest software. Data were obtained from a cell population from which debris was gated out.
MTS assay
Cell viability assays were performed as previously described. 22 Briefly, after treatment with sorafenib, cell viability was determined using the CellTiter 96 Aqueous One Solution Cell Proliferation Assay Kit (Promega, Madison, WI, USA) according to the manufacturer's protocol.
Statistical analysis
Experiments were repeated at least three times with consistent results and representative findings shown. Student's t-test (two-tailed) was used for statistical analysis of comparative data between different groups; comparisons between multiple groups were done using Turkey’s multiple comparison test. P < 0.05 was considered to be statistically significant. Data are presented as the mean ± SD.
Results
Sublethal sorafenib promotes BMC survival
To test the effects of sorafenib on BMC survival, various dosages of sorafenib were added to murine BMC cultures in the presence of 4 ng/ml recombinant mouse GM-CSF. Higher doses of sorafenib (≥5 µg/ml) inhibited BMC survival and growth, which is consistent with its ability to induce apoptosis in tumor cultures;
23
however, we noted that low-dose sorafenib (1 and 3 µg/ml) promoted the proliferation of BMCs in vitro (Figure 1A, B). MTS assays verified that 1 and 3 µg/ml sorafenib increases cell viability, while 5 µg/ml sorafenib exerts an inhibitory effect (Figure 1C). These data suggest that sorafenib promotes apoptosis of BMC cultures at high doses, but instead promotes proliferation at lower dosages.
The effects of sorafenib on BMC survival. (A) BMCs from BALB/c mice were prepared and cultured as described in the ‘Materials and methods’. BMCs were left untreated or were treated with sorafenib (1, 3 or 5 µg/ml) for 3 d. Cells were observed under a phase contrast inverted microscope to show the effects of sorafenib on cell growth. Representative photos of BMC cultures with various treatments are shown, and every experiment was repeated three times. (B) BMCs were left untreated or were treated with 1, 3 or 5 µg/ml sorafenib for 3 d. Cell numbers were counted by FACS to show the percentages of surviving cells vs. those of the control group (*P < 0.05, **P < 0.01, #P < 0.05 vs. control cells). (C) BMCs were grown in 96-well plates were treated with 0, 1, 3 or 5 µg/ml sorafenib for 3 d. Cell viability was measured via MTS assays (*P < 0.05 vs. control cells).
Survivin is essential for sorafenib-induced BMC survival
To clarify the mechanism underlying the low dose sorafenib-induced BMC survival and growth, we assessed the expression of anti-apoptotic proteins and cell cycle-related proteins. As shown in Figure 2A, the anti-apoptotic proteins Bcl-xL and survivin and the cell cycle proteins cyclin D1 and cyclin E were significantly elevated in the presence of 1 and 3 µg/ml sorafenib. Previous studies have reported that sorafenib-induced apoptosis involves the down-regulation of survivin.
24
To evaluate whether, conversely, the up-regulation of survivin plays a role in sorafenib-induced BMC proliferation, we used siRNA-mediated knockdown to reduce survivin levels (Figure 2B). Our results demonstrate that the sorafenib-induced increase in cell viability at low doses is significantly attenuated by siRNA-mediated survivin knockdown (Figure 2C). To further confirm whether survivin plays a key role in sorafenib-induced proliferation of BMC, FACS was performed to calculate cell number. Indeed, as shown in Figure 2D, survivin gene silence reduced sorafenib-induced cell number increase. Collectively, these data suggest that low-dose sorafenib may promote BMC survival and growth through the up-regulation of survivin and additional anti-apoptotic proteins. Collectively, these data suggest that low-dose sorafenib may promote BMC survival and growth through the up-regulation of survivin and additional anti-apoptotic proteins.
Effects of sorafenib on protein expression in BMCs. (A) BMCs were cultured in the absence or presence of sorafenib (1, 3 or 5 µg/ml) as indicated, and cells were harvested. Cell lysates were prepared and subjected to Western blotting. The expression of cell cycle-related proteins cyclin D1 and cyclin E, and anti-apoptotic proteins Bcl-xL and survivin was assessed with specific polyclonal Abs. β-Actin protein levels were assessed as a loading control. Representative bands are shown and every experiment was repeated three times. (B) BMCs were untreated (control) or transiently transfected with synthesized non-targeting scramble siRNA or survivin-specific siRNA duplexes. After transfection for 48 h, cells were harvested and cell lysates were prepared for Western blotting. Survivin protein levels were assessed with anti-survivin polyclonal Ab. β-Actin protein levels were assessed as a loading control. (C) BMCs were left untreated or were transiently transfected with synthesized scramble siRNA or survivin-specific siRNA duplexes. Cells were incubated with GM-CSF and sorafenib as indicated, and cell viability was measured by MTS assay. Representative data are shown, and every experiment was repeated three times (*P < 0.05). (D) BMCs were left untreated or were treated as in Figure 2C. Cell numbers were counted by FACS to show the percentages of surviving cells compared to those of the control group (*P < 0.05 vs. control cells).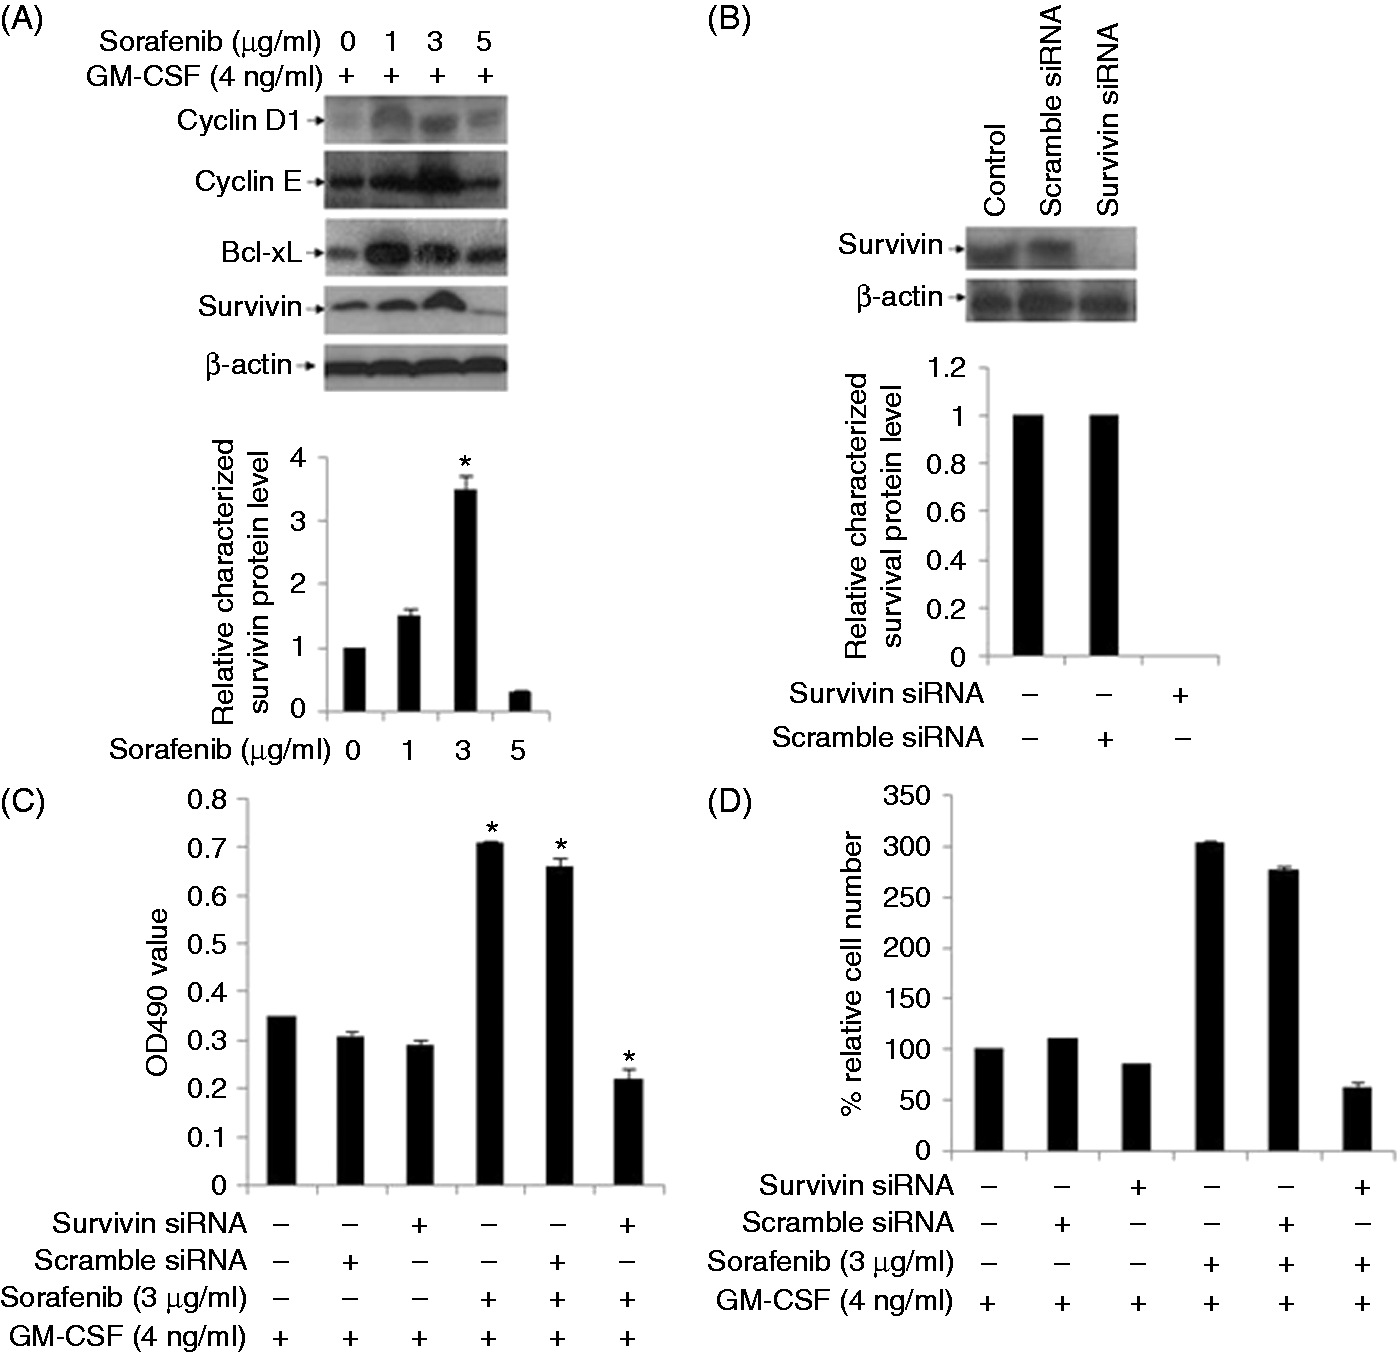
Sorafenib induces expansion of CD11c+ cells in BMC cultures
To determine whether low-dose sorafenib may also affect BMC differentiation, we cultured BMCs in the presence of 1 or 3 µg/ml sorafenib for 9 d. Both floating cells and adherent cells were harvested and subjected to FACS analysis with specific Abs against CD11b and CD11c. CD11b+ and CD11c+ cell numbers in the two fractions were counted independently. Our results show that sorafenib triggers a dose-dependent increase in both CD11b+ cells (Figure 3A) and CD11c+ cells (Figure 3B) in BMC cultures. The expression of MHC class I, MHC class II, CD80, CD86, CD40 and F4/80 molecules was detectable in the CD11c+ populations from sorafenib-supplemented BMC cultures (Figure 3C), which is consistent with the identification of a sorafenib-induced DC population. These data suggest that sorafenib can induce DC production from BMCs (SIDCs).
Sorafenib (SFB) induces generation of DCs from BMC cultures. (A, B) BMCs were cultured in the absence or presence of sorafenib (1 and 3 µg/ml) for 9 d. The cells were harvested and subjected to FACS to analyze CD11b and CD11c expression in SIDCs. Representative data are shown, and every experiment was repeated three times (*P < 0.05 vs. control). (C) Expression profiles of DC-associated molecules. BMCs were cultured in the presence of sorafenib (1 and 3 µg/ml) for 9 d. Cells were harvested, and specific markers, including MHC class I and II, CD80, CD86, CD40 and F4/80, on DC cell surfaces were analyzed by FACS with specific Abs. Representative data are shown, and every experiment was repeated three times. MFI: mean fluorescence intensity.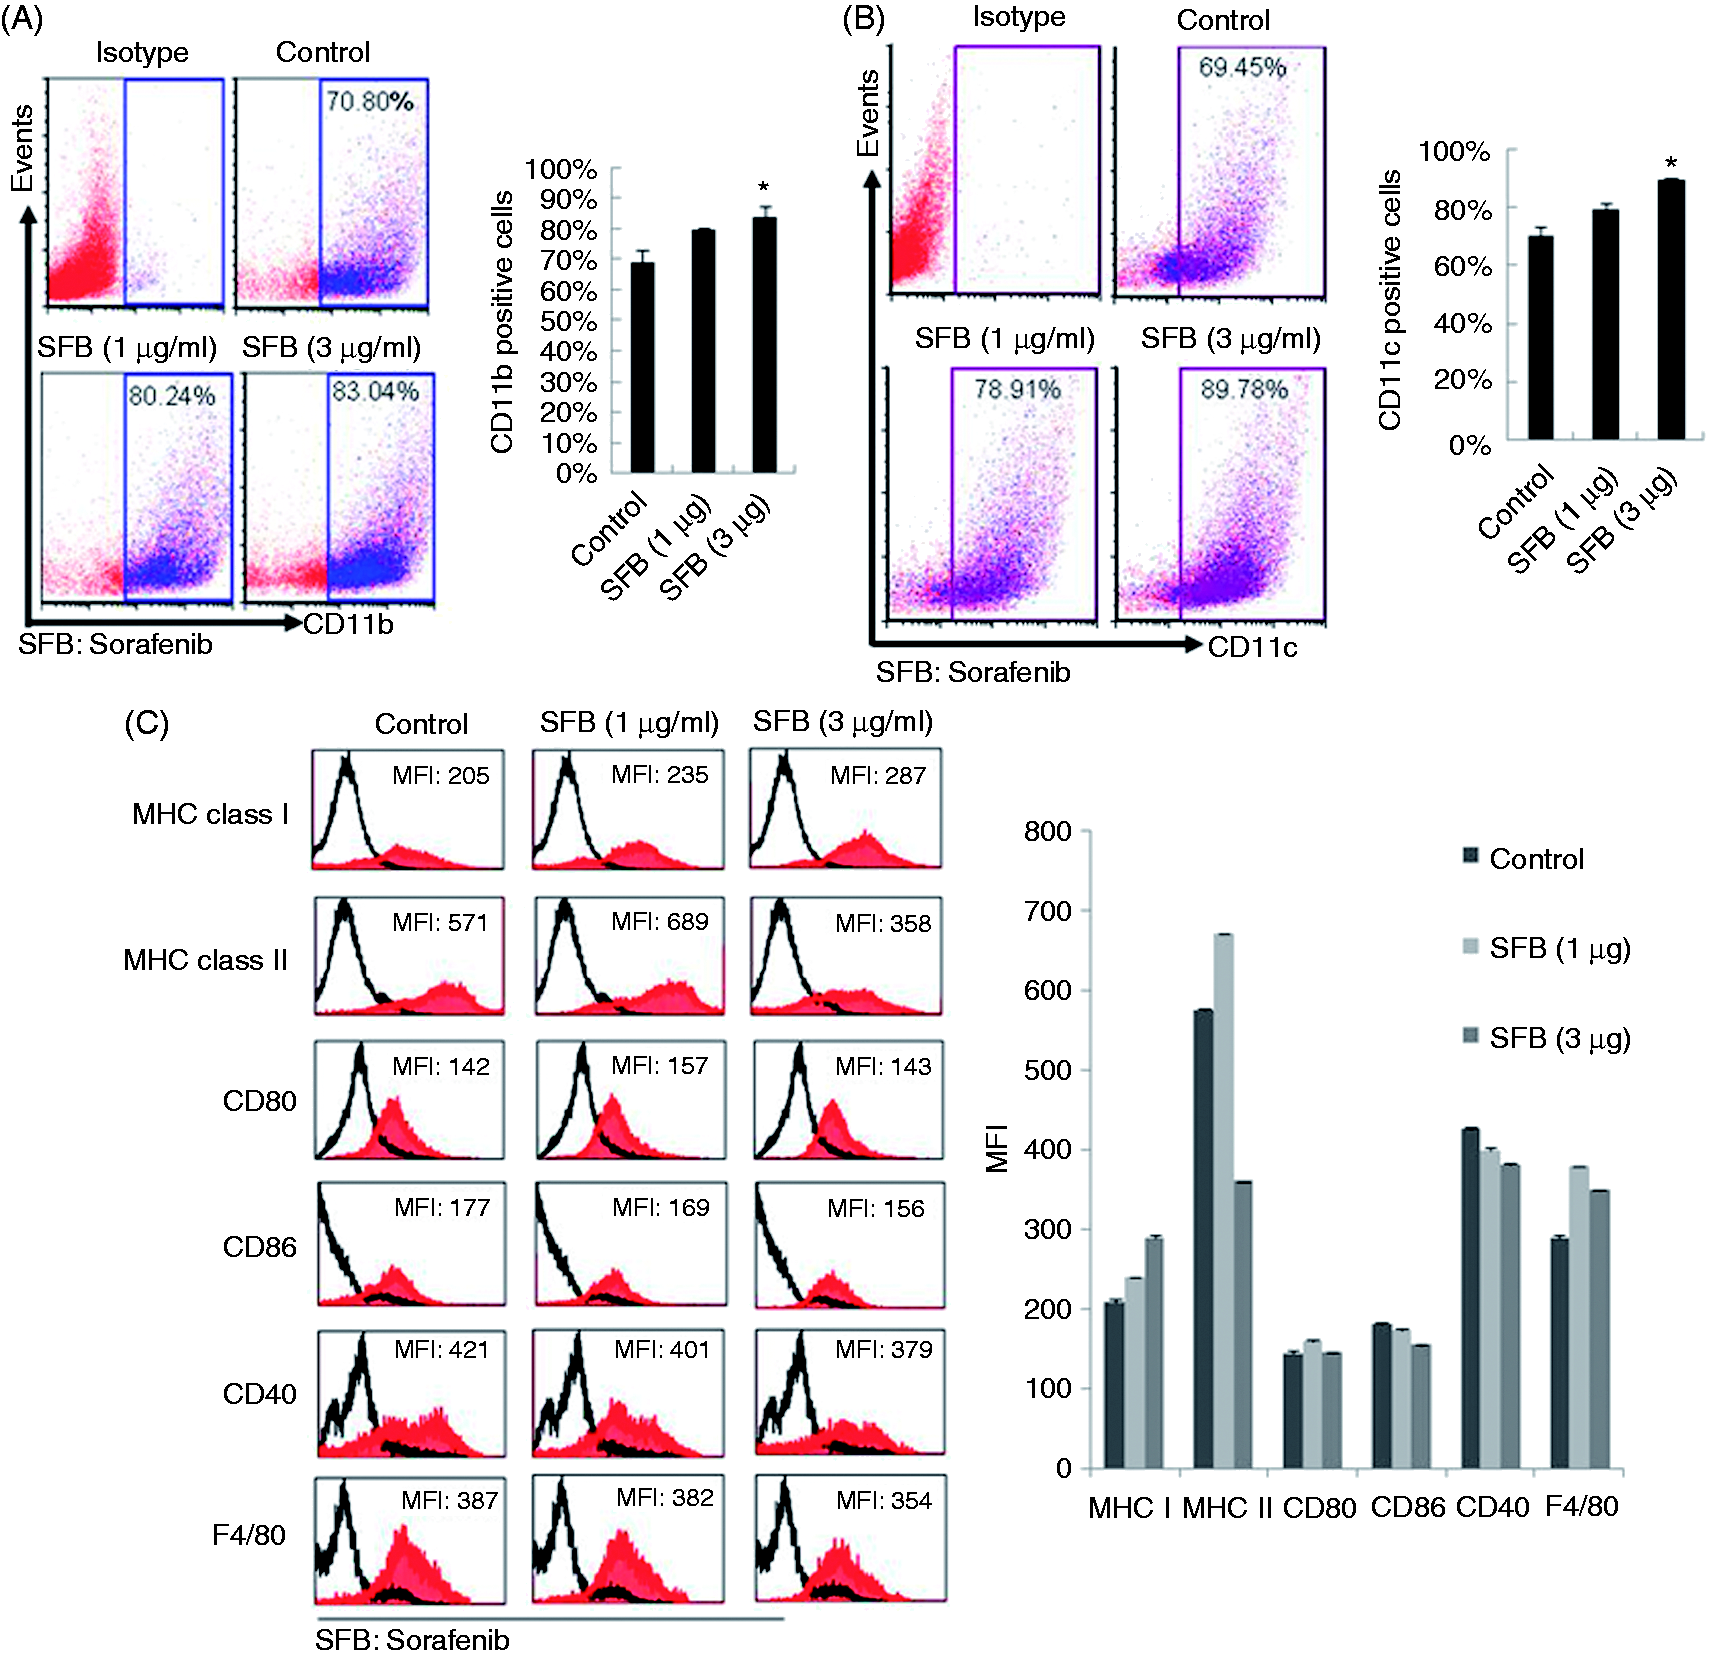
SIDCs inhibit autologous T-cell viability and proliferation
To test the effects of low-dose SIDC on autologous T-cell growth, we measured T-cell proliferation using CFSE fluorescent probes and [3H]- thymidine incorporation assays. As shown in Figure 4(A–C), SIDC effectively inhibited T-cell division as assessed by both methods, and the inhibition was dependent on the sorafenib dose. These results suggest that SIDCs negatively regulate T-cell viability and proliferation.
SIDCs inhibit autologous T-cell viability and proliferation. (A) SIDCs were incubated with CFSE-labeled autologous T cells (SIDC:T = 10:1). T-cell proliferation was measured by FACS. Representative data are shown, and every experiment was repeated three times. (B) Cells were treated and cell viability was measured as in (A). Statistical analysis was performed for the percentage of cell relative viability (*P < 0.05). (C) The inhibitory effects of SIDCs on autologous T-cell growth was evaluated by [3H]-thymidine incorporation assay. Representative data are shown, and every experiment was repeated three times (*P < 0.05).
SIDCs activate CD4+ T cells
It is well known that T cells produce significant amounts of IL-2 and IFN-γ, and markedly elevated amounts of CD25, CD44, and CD69 when stimulated with autologous CD11c+ DCs.
25
To determine whether SIDCs can effectively stimulate these T-cell activation markers, we performed Luminex assays on T cells following incubation with SIDCs. Our results showed that sorafenib treatment led to significantly increased expression of cytokines, including IL-1β, IL-2, IL-4, IL-10, IFN-γ and TNF-α (Figure 5A–F); however, sorafenib decreased IL-6 secretion and CD25 expression on autologous T cells (Figure 5G, H). These data suggest that DCs generated with sorafenib exhibit a unique T-cell-stimulatory capacity compared with conventional DC cultures established with GM-CSF.
SIDCs activate CD4+ T cells. (A–G) Cytokine profiles of T cells after co-culture with SIDCs. Purified CD4+ T cells were incubated with SIDCs at different ratios (DC:T = 10:1 or 10:2 indicates the co-cultured cell ratio between SIDCs and T cells). Levels of IL-1β, IL-2, IL-4, IL-10, IFN-γ, TNF-α and IL-6 were measured by Luminex assay (*P < 0.05 vs. control). Representative data are shown, and every experiment was repeated three times. (H) Purified CD4+ T cells were co-cultured with SIDCs at a ratio of 10:5 (DC:T = 10:5). Relative CD25 levels were then analyzed by FACS. Representative data are shown, and every experiment was repeated three times (*P < 0.05 vs. control).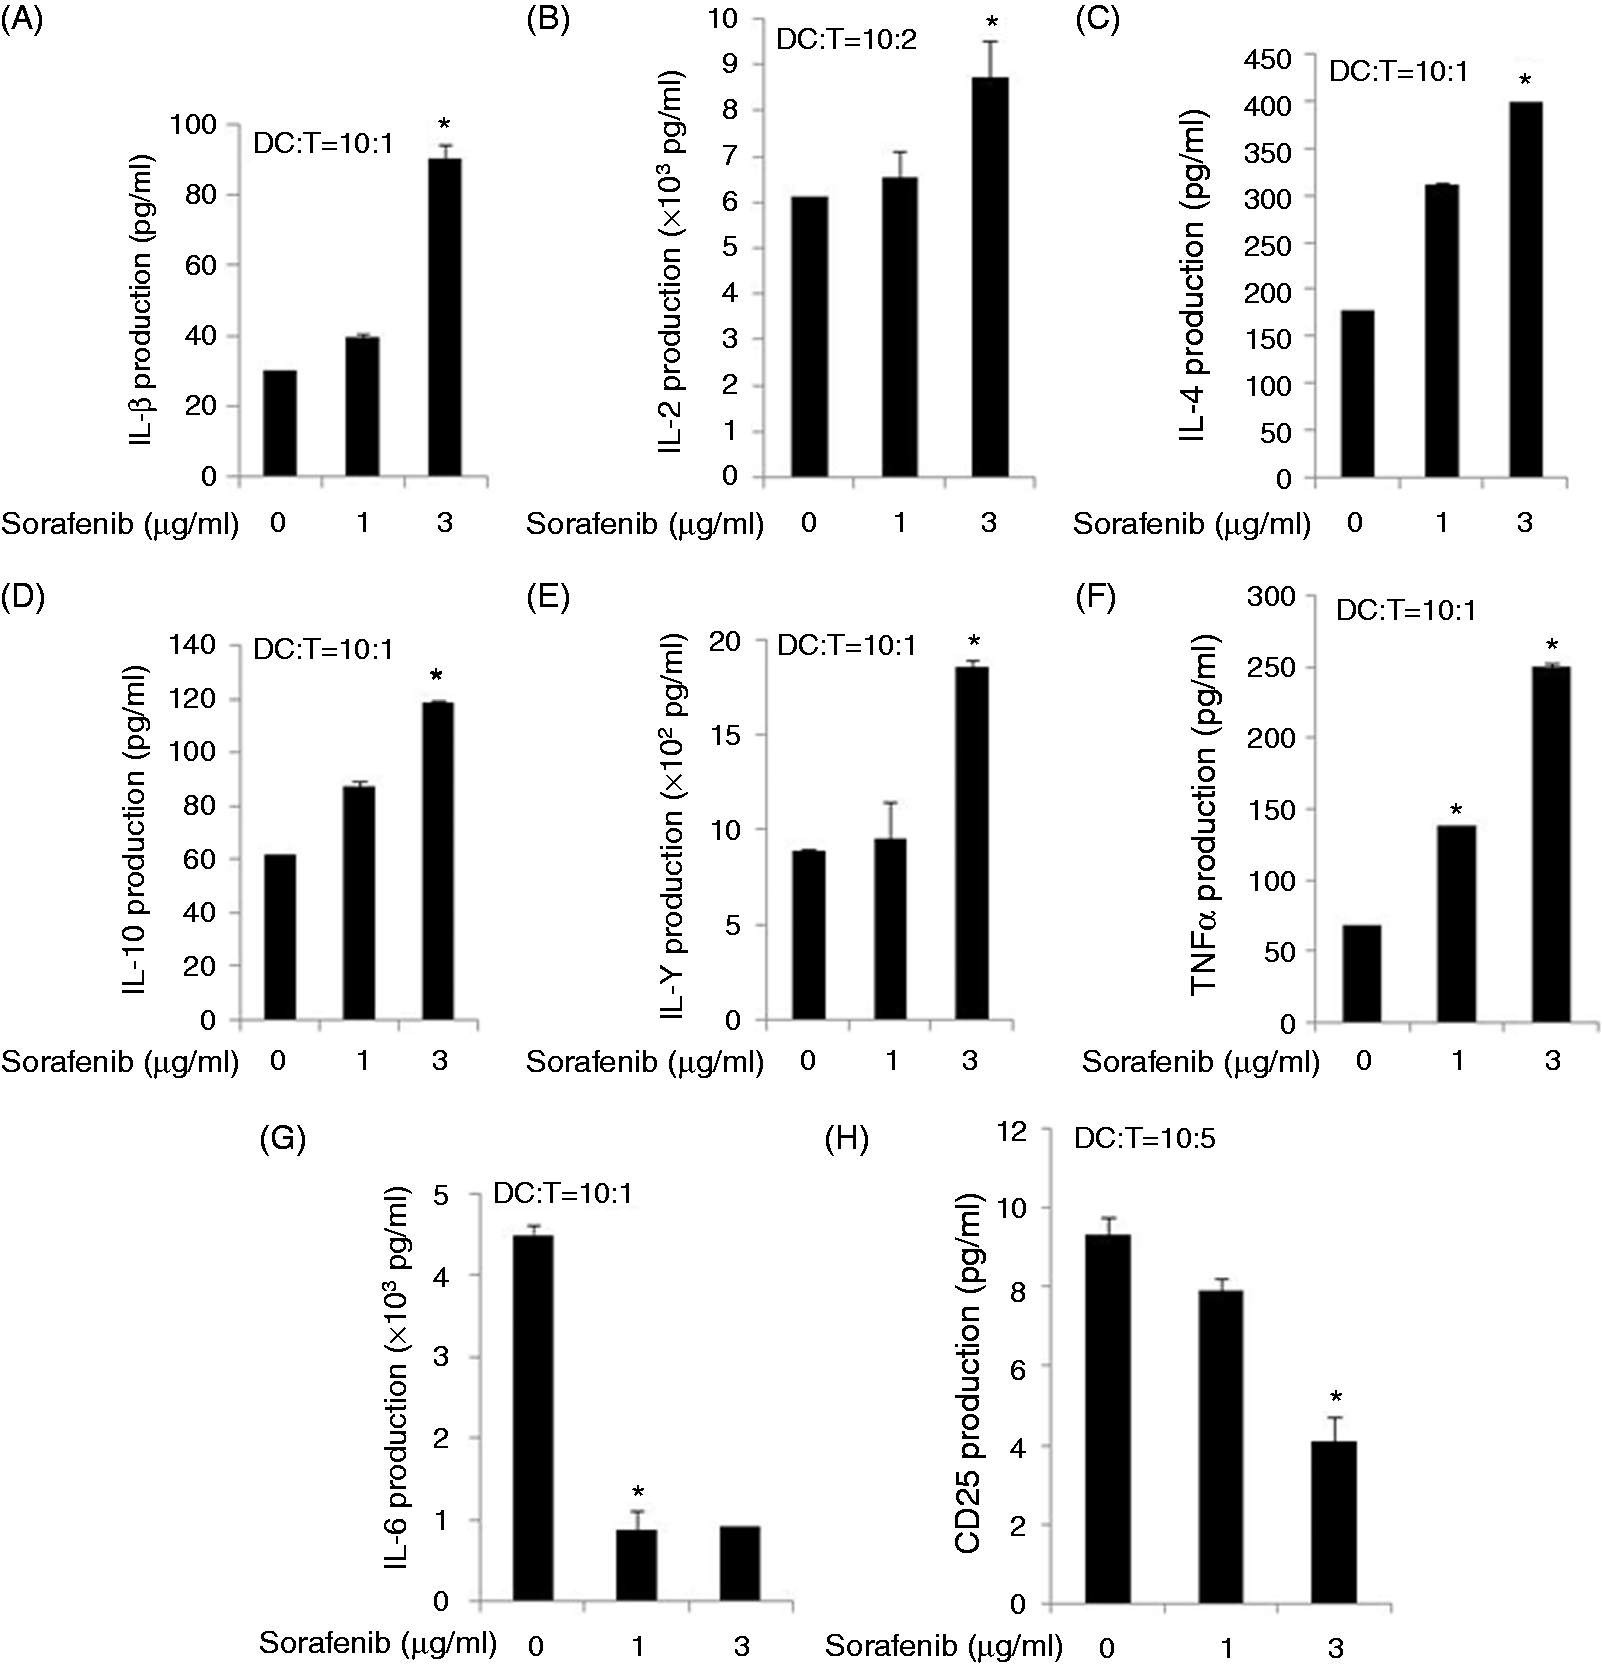
Discussion
Many forms of conventional chemotherapy have dose-limited toxic effects on the immune system, including the bone marrow. Immune toxicity, in particular neutropenia, can lead to substantial morbidity and mortality. 26 Therefore, advances in understanding the molecular interactions between clinical anti-tumor drugs and the immune system will lead to improvement and more effective therapeutics. In the present study, we have addressed the effects of sorafenib on the immune-stimulatory capacity of murine DCs and the induction of the primary immune response. We provide data to show that low doses of sorafenib exert potent induction of BMC survival and growth by up-regulating the anti-apoptotic protein survivin, as well as cell cycle-related proteins. Furthermore, sorafenib induces BMC differentiation into immunosuppressive DCs that significantly inhibit autologous T-cell viability and proliferation; purified SIDCs exhibit profound ability to activate CD4+ T cells characterized by increased secretion of cytokines, including IL-1β, IL-2, IL-4, IL-10, IFN-γ and TNF-α.
A number of studies have argued that small molecular compounds, including nilotinib, 27 sunitinib, 28 methotrexate 29 and sorafenib 30 impair reactivity of different immune effector cells. However, the role of these compounds in immune response regulation is not well understood and remains controversial. It has been reported that patients with advanced HCC were treated with sorafenib at dosage of 400 mg twice daily and the average sorafenib plasma concentration is 9.23 µg/ml. 31 In preliminary experiments we treated cells with sorafenib concentrations ranging from 0 to 10 µg/ml and found that ≥ 5 µg/ml sorafenib exerted serious apoptosis toxicity to BMCs. Therefore, the optimal (plasma) concentration for sorafenib to exert immune regulatory effect should be < 5 µg/ml. Here we used sorafenib ranging from 0 to 5 µg/ml to test its effects on BMCs in vitro. Our data demonstrate that sub-cytotoxic concentrations of sorafenib significantly promote mouse BMC survival and growth in a dose-dependent manner. These results are consistent with the notion that small molecular compounds such as arsenobetaine are able to markedly enhance the viability of murine BMCs. 32 However, our finding is in contrast to a clinical study that demonstrated that bone marrow hypoplasia was associated with sorafenib-induced marrow blast clearance in two patients with FLT3-ITD acute myeloid leukemia. One possibility to explain this discrepancy may be that the excessive plasma concentrations of sorafenib used in the latter study (≥10 µg/ml) induced apoptosis rather than survival in BMCs, which is similar to our finding that high doses of sorafenib (≥ 5 µg/ml) have lethal toxicity rather than promoting survival in BMCs (data not shown).
In an attempt to clarify the mechanism underlying sorafenib-induced BMC survival and growth, we analyzed the expression of apoptosis-related proteins. Our data indicate that cyclin D1, cyclin E, survivin, and Bcl-xL were elevated in BMCs treated with 1 and 3 µg/ml sorafenib, suggesting that proliferation and anti-apoptotic signaling pathways were activated. As shown in Figure 2A, we also noticed that 1 µg/ml sorafenib induced more cyclin D1 and Bcl-xL proteins than 3 µg/ml did. For cyclin E and survivin, 3 µg/ml sorafenib induced more proteins than 1 µg/ml. One of the possible explanations is that sorafenib might regulate these four proteins via different signaling pathways. In this study, to clarify which protein’s up-regulation is essential for the proliferation of BMCs, we used siRNA-mediated gene silence to knock down expression of these four genes. We observed that only the survivin gene silences significantly impaired sorafenib-induced cell viability increase, suggesting up-regulation of survivin is crucial for sorafenib to stimulate BMC growth. Our previous study has shown that sorafenib (5 µg/ml) induced HCC LH86 and Huh7 cells apoptosis by down-regulating OPA1 protein in vitro and in vivo. 33 Kim et al. reported that sorafenib-induced apoptosis in human non-small cell lung cancer (NSCLC) cells by decreasing survivin expression. 24 Fernando et al. reported that 2 µg/ml sorafenib sensitizes HCC Hep3B and HepG2 cells to physiological apoptotic stimuli by down-regulating survivin and cyclin d1 expression. 34 Here, our data show that sub-lethal sorafenib increased survivin expression and promote proliferation in BMCs, suggesting that the effects of sorafenib on tumor cells such as HCC and NSCLC cells and immune BMCs are different. Nevertheless, more experiments need to be performed to verify the mechanism by which low dosages of sorafenib induce anti-apoptotic protein elevation and to test the effects of sorafenib on pro-apoptosis proteins.
Studies have shown that a variety of cytokines such as GM-CSF, TNF-α, IL-33, IL-4 and CSF can induce the generation of DCs from BMCs.35–38 As sorafenib treatment enhanced the viability of BMCs, we sought to determine whether it can induce the generation of DCs from BMCs. Interestingly, in a parallel experiment with GM-CSF, we found that low concentrations of sorafenib (1–3 µg/ml) effectively induce BM progenitor cell differentiation to DCs, as characterized by the presence of specific markers CD11b and CD11c on the surface of cellular membranes for ≥ 80% of cells. These findings are in contrast to a recent study demonstrating that sorafenib (1–3 µg/ml) induces significant apoptosis and impairs function in GM-CSF-induced murine BM-derived DCs. 15 We compared the properties of SIDCs with those of GM-CSF and found that the expression of proteins, including MHC-I, MHC-II, CD40, CD80, CD86 and F4/80 in SIDCs, was quite similar with those in DCs induced by GM-CSF. Indeed, these results suggest that sorafenib has a potential ability to stimulate BMCs to produce SIDCs. However, our endocytosis assay indicated that SIDCs have a lower ability to uptake Dextan compared with GM-CSF-induced DCs, implying that these two types of DCs are different.
Further assessment of the functional properties of sorafenib-treated BMCs using [3H]-thymidine incorporation and BMC-derived DCs using CFSE labeling assays revealed that both cell subsets have a potent ability to inhibit primary T-cell proliferation and viability. These results further confirm our previous report that sorafenib administration down-regulates immunosuppressive T-cell populations in hepatocellular carcinoma tumor xenograft mice. 17 Moreover, mixed cell culture assays showed that SIDCs promote the expression of cytokines, including IL-1β, IL-2, IL-4, IL-10, IFN-γ and TNF-α, in CD4+ T cells. Our findings raise the possibility that subtoxic sorafenib may be used as monotherapy or in combination with Ag-specific immunotherapies for diseases such as HIV or advanced renal cell cancer. Additionally, in contrast with a previous report that demonstrated that GM-CSF-induced DCs trigger an elevated CD25 level, 39 we found that CD25 was decreased in CD4+ T cells co-cultured with SIDCs; the significance of these results also need further verification. In conclusion, we have shown that the multikinase inhibitor sorafenib promotes murine BMC survival and induces differentiation into immature DCs. Low-dose sorafenib monotherapy could induce functional DC generation to result in T-cell growth inhibition and activation of CD4+ T cells.
Footnotes
Declaration of Conflicting Interests
The author(s) declared no potential conflicts of interest with respect to the research, authorship, and/or publication of this article.
Funding
The author(s) disclosed receipt of the following financial support for the research, authorship, and/or publication of this article: This study was supported by National Natural Science Foundation of China (31371425 to X. Zhao), NCI K24 PA08-151 and NIH UL1RR029890 to DRN, Liaoning Provincial Natural Science Foundation of China (2013023056 to X. Zhao), National Natural Science Foundation of China (81301265 to Y. Ren), and the Special Funds of the National Natural Science (31240025 to Z. Lu)