
Abstract
This study presents a data-driven exploratory analysis that combines experimental measurements with statistical modelling to investigate how the mechanical properties of a football, specifically stiffness and energy loss, influence a football’s impact behaviour. Experimental testing of twelve FIFA-certified footballs, impacted at low (5.93 ± 0.06 m s−1) and high (19.2 ± 0.4 m s−1) velocities, revealed three distinct characterisations of impact behaviour. These groupings were primarily defined by contact time and deformation, variables that were strongly correlated with the stiffness properties of the balls, measured in both static and dynamic environments. Multivariable models were developed using inputs of impact conditions and ball properties. For the selected outcome variables (contact time and deformation) and under the conditions tested, these inputs could explain up to 96% of the differences observed in impact behaviour in the best-performing model. The models also demonstrated agreement with observed behaviour in an independent dataset, in this instance errors of 2.8% (corresponding to 0.3 ms) were observed for contact time and errors of 3.4%–9.7% (corresponding to 1–5.5 mm) were observed for deformation. Properties of the footballs measured at the low velocity also demonstrated reasonable consistency in their relationship with dynamic impact behaviours at the higher velocity with errors below 7%. This study demonstrates the use of statistical modelling to classify and explain aspects of football impact behaviour using a small set of measurable properties, within the conditions investigated.
Introduction
The physical and performance characteristics of a football, used in any competitive match, are governed by the Laws of the Game defined by the International Football Association Board (IFAB) and by certification requirements within the FIFA Quality Programme (FQP). The FQP aims to ensure consistency, fairness, and quality across different balls used in the sport. While effective for standardisation, the testing protocols do not directly measure or control for the underlying properties of a ball, such as stiffness and energy loss, that govern deformation, energy dissipation, and contact dynamics during impact. As a result, footballs that satisfy the quality thresholds may exhibit differences in impact behaviour, particularly outside the narrow range of prescribed test conditions.
Modelling the impact behaviour of a football plays a crucial role in advancing the understanding of the mechanisms that affect the dynamic response of a ball. For manufacturers, modelling can be used to gain critical insights into how design and material choices influence different aspects of a ball’s performance, such as rebound, compliance, or energy transfer, without the reliance on costly iterative prototyping. Impact modelling of a football has previously been approached using physics-based modelling1–3 or computational simulation,4–6 which have demonstrated success in reproducing the impact response of individual footballs under controlled conditions.1–6 However, these approaches rely on simplifying assumptions on material behaviour, geometry, or contact conditions and have often required an accurate representation of a ball’s dynamic response during a collision, frequently captured using high-speed video. The kinematic data extracted from a video is used to define initial boundary conditions, to estimate physical quantities, to calibrate or tune model constants, or to validate model calculations. As a result, model constants are commonly tuned to a specific ball or test condition, limiting their capacity to generalise across different constructions, materials, or manufacturers. This approach implies that the model parameters may be biased to artifacts of each football’s design rather than representing the physical or mechanical properties, thereby constraining their usefulness for comparative assessment. The effectiveness of modelling the impact behaviour for footballs with varying mechanical properties remains largely untested or confined to small-scale studies. While differences in impact behaviour between individual footballs have been observed for a normal-inbound impact, these are often only suggested to be caused by differences in construction,7,8 temperature, 9 internal pressure, or impact velocity,7,10 but rarely report objective measurements of the football’s mechanical properties in the analysis.
Given the limited capacity of existing models to support comparative assessment across footballs from different manufacturers, this study adopts a data-driven methodology that integrates experimental measurements with supervised and unsupervised modelling approaches to investigate how the mechanical properties of a football, specifically mass, stiffness, and energy loss, influence a football’s impact behaviour. By doing so, the work explores the potential of statistical modelling to classify and explain the dynamic impact behaviour using a small set of measurable mechanical properties, without reliance on design-specific calibration. Importantly, correlations between low- and high-velocity impacts are also examined to assess whether regulatory tests remain valid indicators for higher-velocity impacts, often encountered under match conditions.
Methods
The following sections describe the methodological approaches required to collect data essential for the statistical modelling.
Ball selection
A total of 1081 FIFA Quality Programme (FQP) football test reports were obtained from FIFA licensee’s that consented to anonymous data-sharing for research purposes. These reports included key ball characteristics for all footballs submitted for certification from 1999 to 2021, including those for active, expired, and failed licences. To ensure the availability of footballs for experimental use, the dataset was filtered to include only those with a valid licence past January 2021, giving a total number of 155 potential footballs. A further criterion was applied to only include footballs certified with a FIFA Quality Pro mark (n = 72), as these models typically incorporate the latest innovations in materials and manufacturing techniques. These footballs were regarded as a representative sample of those currently available on the market.
Footballs exhibit anisotropic mechanical behaviour arising from their panelised construction, whereby seam distribution and material orientation govern deformation patterns and contact dynamics. 11 To control this potential confounding variable, the sample of footballs was restricted to those with the most common 32-panel design (57/72 footballs, 79%). Following a formal request to the respective licensees, 12 thermally bonded 32-panel, size 5, footballs meeting all selection criteria were obtained and used in the study. All footballs were inflated to 0.8 ± 0.01 bar in line with the inflation pressure tested during FIFA certification and fell within the manufacturer’s recommended pressure range for each football.
Mechanical testing
Quasi-static compression tests were carried out on an Instron EC3000 test machine (Model 2663-901). The footballs were compressed between two rectangular mild steel plates (200 mm × 300 mm) at a rate of 1000 mm min−1 to a deflection of 45 mm, as shown in Figure 1. In the absence of any internationally standardised or widely cited protocol, the maximum deflection was selected to align with the deformation magnitude experienced during the high-velocity dynamic impact (outlined in Section 2.3). This maximum deflection ensured stiffness was characterised within a mechanically relevant deformation range while acknowledging the fundamental differences between quasi-static and dynamic loading.

Images of the quasi-static compression test of a football: (a) The upper plate moves at a slow, controlled rate with uniform force application to compress a football from its uncompressed state to (b) a deflection of 45 mm.
A 25-N preload was applied to account for the slight differences in circumferences of the footballs and to ensure contact was not lost during consecutive compression cycles. Each ball was cyclically loaded four times to 1000 N to overcome viscoelastic effects before the final deflection cycle was performed. Force and deflection were measured in three orientations of the football to assess the homogeneity of stiffness around its circumference. Raw data were exported to a .csv file and imported into MATLAB (The MathWorks. Inc Version; R2021b). Stiffness was calculated by fitting a second-order polynomial to the force-deflection curve during loading and evaluating at 5-mm intervals between 5 and 40 mm. The measurements from the three orientations were averaged to provide the overall global stiffness for each football.
Dynamic impact testing
Impact tests were carried out at two velocities: 5.93 ± 0.06 m s−1 and 19.2 ± 0.4 m s−1. The lower velocity reflected the velocity outlined by the FQP test manual. The higher velocity was calculated by applying the upper limit of football kick speed (35 m s−1) observed in previous published work12,13 to a trajectory model 14 to estimate the maximum velocity at which a football could impact the playing surface during match play. To achieve the lower velocity, the football was dropped from 2 m, and a bespoke 4-wheel mechanical device was used to project the football to the higher velocity. For each velocity, the football was positioned directly opposite the impact point to avoid valve-surface contact. Each football impacted a floor-mounted piezoelectric force platform without spin (Kistler 9281EA, Kistler Holding AG; dimensions: 600 mm × 400 mm, natural frequency: 1 kHz) for a total of 25 impacts at each velocity, giving a total of 300 impacts per velocity. The impact was recorded using a single high-speed camera (Phantom MIRO 311, Vision Research Ltd., USA; resolution 320 × 800 p, sample rate 10,000 fps) placed 5 m from the force platform edge and calibrated using planar checkerboard calibration. The instantaneous in- and out-bound velocities were calculated by plotting the vertical position obtained using a computer vision algorithm and digital processing. An inbuilt MATLAB function (imfindcircles.m) was used to apply the circular Hough transform on over 120 consecutive high-speed video frames, and a second-order polynomial was fitted to the positions.
Impact variables that were used to describe the response of the football undergoing a collision were the deformation

Measurements describing the football’s impact response were extracted via digitisation of high-speed video frames (a), with accompanying schematic diagram (b) indicating the variables and definitions.
In contrast, the mechanical input variables were obtained using the outputs from the force platform (Figure 3). The unfiltered output of the force platform was used to calculate: (1) the maximum force (
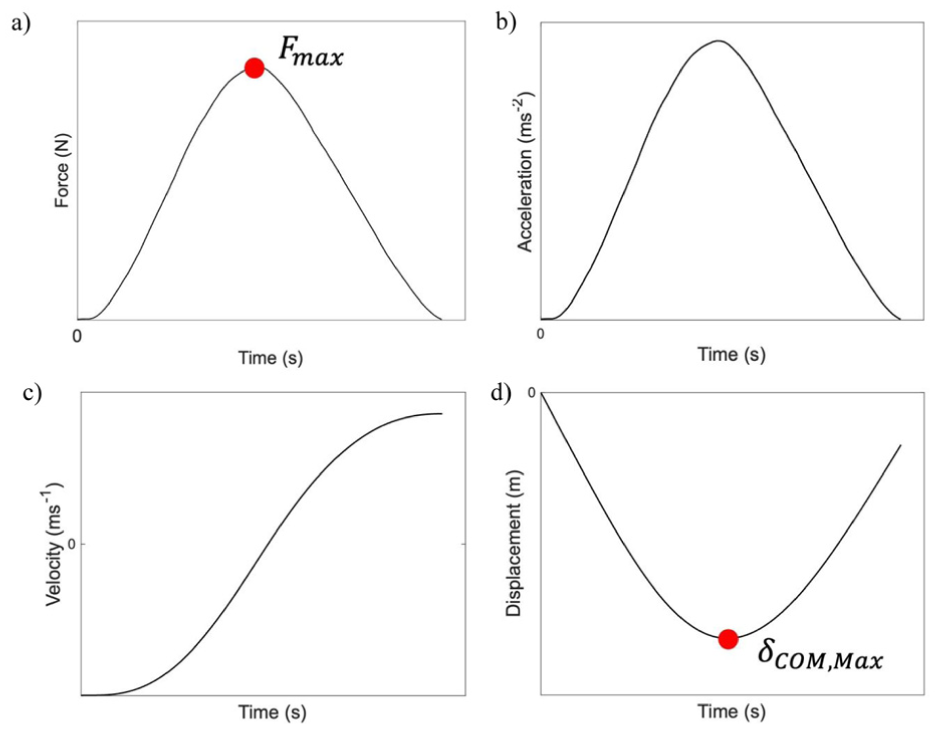
Example of the curves obtained and calculated using the force-time data for a football impacting a force platform: (a) force-time, (b) acceleration-time, (c) velocity-time, and (d) displacement-time. Maximum peak force and COM-displacement are indicated.
Statistical analysis
Normality of each impact metric was assessed using the Shapiro-Wilk test (SPSS, 26.0.0.1, IBM Corporation).
Pearson correlation coefficient
The Pearson’s product moment correlation coefficient was calculated to assess correlations between the average stiffness with COR, contact time, deformation, and peak impact force. Coefficients between
Cluster analysis
A K-means cluster analysis was used to classify the footballs into distinct groups based on their impact characteristics. Variables of contact time, COR, deformation, and peak impact force were included in the analysis and were standardised using z-scores to prevent variables with larger scales (e.g. peak impact force) from disproportionally influencing the cluster outcomes. To determine the number of clusters, the elbow method was followed by calculating the within-cluster sum of squares (WCSS) using equation (1) for

where,
Following the identification of clusters, a one-way ANOVA with a post hoc Tukey test was performed on each of the impact variables with a confidence level of 0.05 to compare the mean result of each cluster.
Multivariable regression models
Multivariable regression models were developed to determine the relationship between the mechanical properties of a football and the dynamic impact response at each velocity. Each model took the form of equation (2), where

To understand how experimental variability influenced the performance of the model, three levels of data aggregation were used.
Trial A used the raw data, including all impacts (n = 300), capturing the full experimental variability.
Trial B averaged every five consecutive impacts (n = 60), retaining moderate variability while smoothing out short-term fluctuations.
Trial C averaged across all 25 impacts per football (n = 12), minimising experimental variability to emphasise ball-specific characteristics.
Model performance
The performance of each model was assessed using the absolute root-mean-square error (RMSE) and normalised root-mean-square error (NRMSE), calculated on the training dataset for each trial. To assess how well the models reproduce observed behaviour in an independent dataset, an independent validation dataset was collected, consisting of 75 impacts that were carried out at each velocity using three randomly selected FIFA-Certified 32-panel footballs available on the market in May 2025, using the same methodology as outlined in Section 2.3. These footballs were not included in the training dataset. The validation data were normalised using the same hyperparameters (accessible in Supplemental Materials). Model calculations were compared against observed values using the RMSE, NRMSE, and mean absolute percentage error (MAE).
Results
Correlation between mechanical stiffness and impact behaviour
The strength and significance of the correlations between the ball’s stiffness and impact response are presented in Table 1. These results showed that as the deflection level at which static stiffness was evaluated increased, both the strength and significance of the correlations tended to decrease.
Correlations between static and dynamic stiffness and dynamic impact variables at various deflections for a low- and high-velocity, with significance level.

Significance: ap < 0.001. bp < 0.01. cp < 0.05.
At the lower impact velocity, strong negative correlations were found between static stiffness and both contact time (r = −0.87 to −0.45, p < 0.001–0.05) and deformation (r = −0.87 to −0.45, p < 0.001–0.05). The strongest correlations were found when stiffness was evaluated at a deflection of 5 mm for contact time (r = −0.87, p < 0.001) and deformation (r = −0.86, p < 0.001). Dynamic stiffness also showed a stronger relationship with contact time (r = −0.96, p < 0.001) and deformation (r = −0.88, p < 0.001), and a positive significant correlation with peak impact force (r = 0.93, p < 0.001). No strong or significant relationships were observed between stiffness and COR.
At the higher impact velocity, similar patterns were observed. Strong negative correlations were observed between dynamic stiffness with contact time (r = −0.87, p < 0.001) and deformation (r = −0.73, p < 0.001). However, weaker correlations, with many failing to reach the higher significance level were observed, highlighting the limitations associated with a static measurement. The dynamic stiffness measured during the lower velocity impact showed strong and significant relationships with contact time (r = −0.86, p < 0.001) and deformation (r = −0.94, p < 0.001) measured at the higher velocity, suggesting low-speed dynamic stiffness may serve as a valid proxy for higher-speed compliance behaviour.
Cluster analysis of behavioural traits
Three distinct groupings of impact behaviour emerged among the footballs at the two impact velocities. The results of the cluster analysis are presented in Figure 4. All four variables contributed significantly to cluster membership (p < 0.05), with ball deformation (F = 25, p < 0.001) and contact time (F = 20, p < 0.001) showing the highest F-scores at the lower impact velocity. At the higher impact velocity, COR (F = 37 and p < 0.001) was a significant differentiator and had the highest F-score, but was closely followed by deformation (F = 30 and p < 0.001) and contact time (F = 30 and p < 0.001) highlighting that the ability of a football to deform and absorb energy becomes a critical differentiator at higher impact velocities.
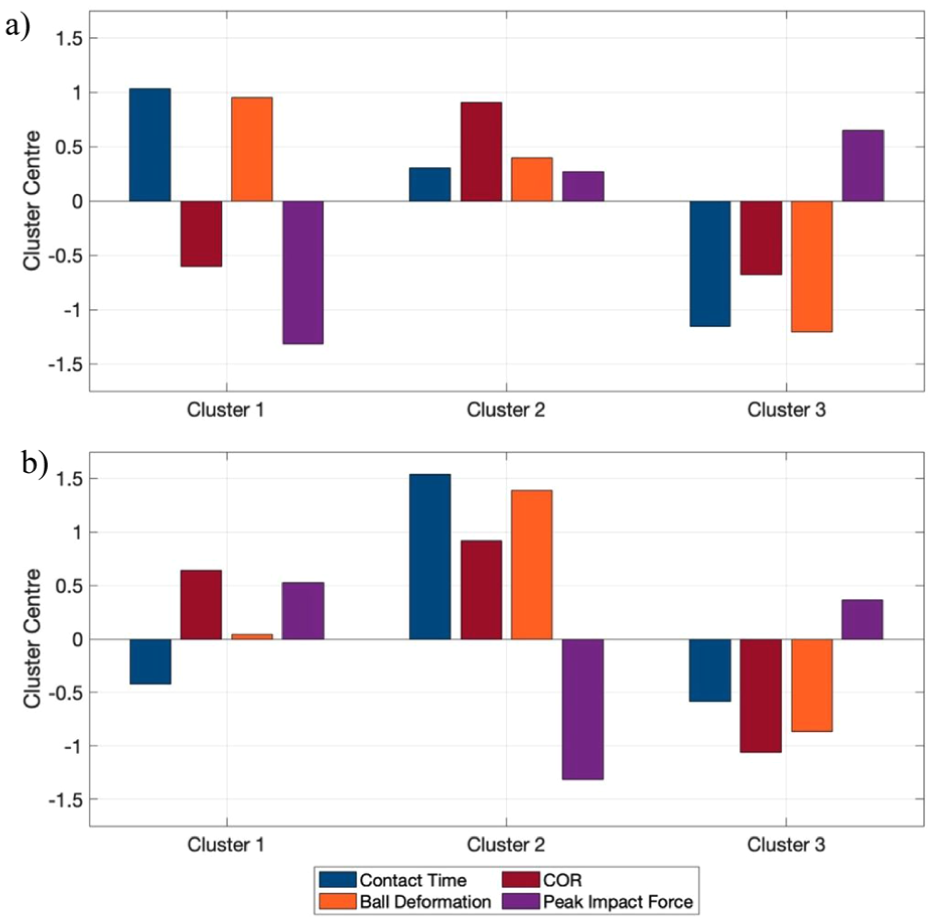
Cluster centres illustrating three distinct behavioural groupings of football impact behaviour at the (a) low velocity and (b) high velocity.
From analysing the cluster centroids, the following groups and corresponding behavioural traits, as outlined in Table 2, emerged among the sample of footballs tested. While most footballs maintained consistent behavioural traits, a subset of footballs demonstrated speed-sensitive behaviour, transitioning between clusters at the higher impact speed. These findings confirm that the mechanical responses of certain footballs exhibit higher strain-rate dependencies than others.
Description of groups and behavioural characteristics identified during cluster analysis.

The results of the ANOVA revealed significant differences between at least two groups for all impact variables (p < 0.001). The footballs in the soft category across both velocities exhibited significantly longer contact times (Figures 4(a) and 5(a)), lower impact forces (Figures 4(b) and 5(b)), and greater deformations (Figures 4(d) and 5(d)) compared to the balanced and firm types (p < 0.001).
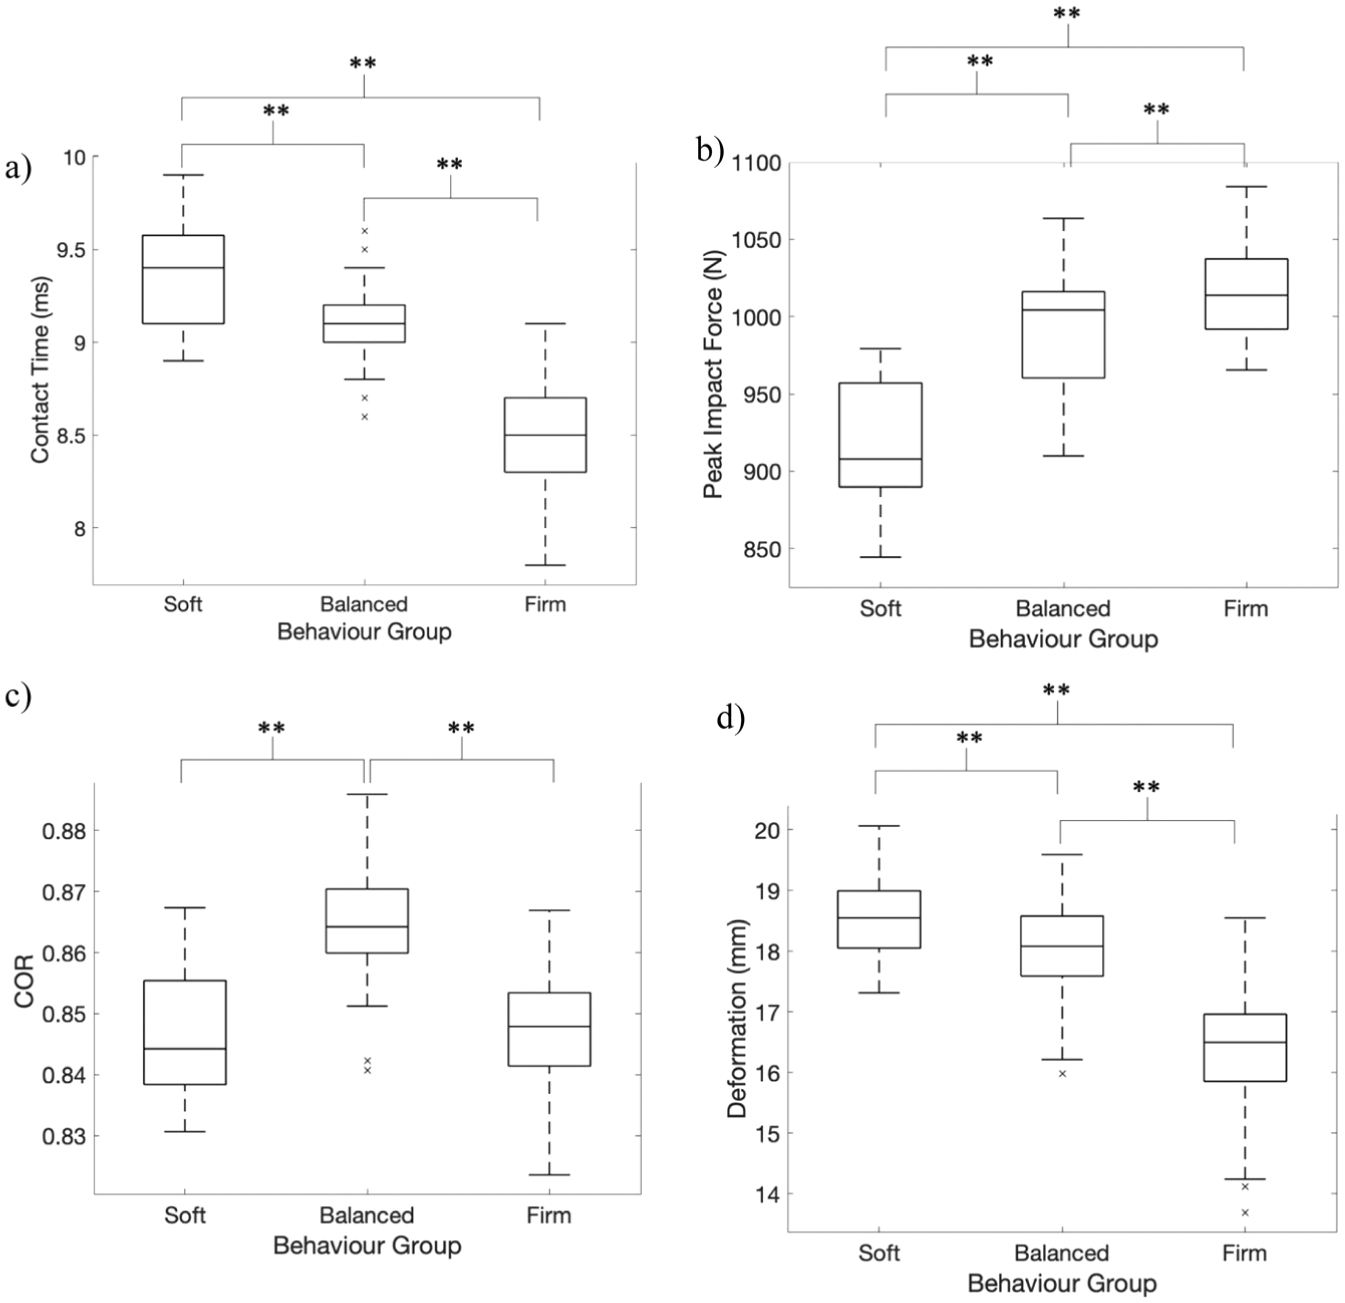
Boxplots of dynamic impact variables associated with each behaviour group at the lower velocity: (a) contact time, (b) peak impact force, (c) COR, and (d) deformation.
The COR (Figures 5(c) and 6(c)) did not consistently differentiate among all three groups at both velocity conditions, but this inconsistency is likely a consequence of using FIFA Certified footballs where COR at a low velocity is bounded. At the low velocity, only the balanced group differed significantly from soft and firm footballs, which did not differ from each other. In contrast, at a high velocity, the soft footballs were distinct from the other groups, whereas the balanced and firm footballs showed no significant difference.

Boxplots of dynamic impact variables associated with each behaviour group at the higher velocity: (a) contact time, (b) peak impact force, (c) COR, and (d) deformation.
The results of the impact testing are shown in Figure 7, with the size and colour of the marker representing the static stiffness of the ball measured at 5-mm deflection. Despite achieving statistical significance among the groups, the absolute percentage differences across the impact variables were generally minimal, particularly for metrics considered performance indicators, such as the COR, which varied by less than 6% across all footballs at both impact velocities. The largest differences were observed for metrics that correlated highest with the stiffness of the football, with contact time varying 12% and 7%, deformation varying 17% and 15%, and peak impact force varying 15% and 14% at the low- and high-velocity, respectively. These results indicate relatively consistent impact behaviour across all footballs at the two tested velocities, with more pronounced changes in metrics associated with the compliance behaviour of the balls.

Relationships between contact time and deformation (a,d), peak impact force and contact time (b,c) and COR and contact time (c,f) at the low (top row) and high (bottom row) velocity. Data points represent the average outcome variable with dot size and colour normalised to static stiffness at 5 mm; stiffer = red, softer = blue. Error bars denote the standard deviation.
Multivariable modelling
Given that the group a football may fall into was reliably classified by contact time and deformation, modelling was carried out using these two variables as the outcome variables.
The model performance with contact time as the outcome variable is presented in Table 3. Across the models, explanatory power varied substantially, with R2 values ranging from 0.31 to 0.96. The NRMSE on the test dataset ranged from 0.2 to 0.73, corresponding to an error of approximately 0.13–0.25 ms in contact time. The best explanatory performance was seen at the low velocity for Trial C (R2 = 0.96, RMSE = 0.07 ms). However, models with higher explanatory performance often demonstrated weaker agreement with the validation data, consistent with overfitting to smaller datasets, for example, at the low velocity, the MAE for Trial A (n = 300) was 2.8% compared to 4.3% for Trial C (n = 12).
Model performance metrics for training and validation datasets for contact time.

RMSE has been reported in both absolute (RMSE) and normalised units (NRMSE).
The model performance with deformation as the outcome variable is presented in Table 4. Similar patterns were observed for deformation as for contact time, with the strongest agreement with the validation data appearing at the low velocity. However, model accuracy for deformation was more variable across trials. The R2 values ranged from 0.38 to 0.92, and the NRMSE for the training dataset ranged from 0.27 to 0.73, corresponding to absolute errors of 0.33 to 2.61 mm. At the high velocity, deformation proved more difficult to capture reliably, with validation errors rising to nearly 10% and RMSE values up to 6.4 mm.
Model performance metrics for training and validation datasets for deformation.

RMSE has been reported in both absolute (RMSE) and normalised units (NRMSE).
Given that regulatory tests are typically performed under low-velocity conditions, the final stage of the analysis assessed how well models trained exclusively on properties measured at the low velocity reproduce observed behaviour at a high velocity. These models demonstrated meaningful agreement with observed values, particularly for contact time, where the best-performing model achieved errors of approximately 5% (equivalent to 0.4 ms). Model errors were larger for deformation, around 7% (∼2.6 mm), but remained within a relatively small range relative to observed values.
Discussion
This study demonstrated the use of statistical modelling to classify and explain aspects of football impact behaviour using a small set of measurable properties, including mass, dynamic stiffness, and energy loss. First, three distinct classifications of impact behaviour were identified among the footballs tested, primarily defined by contact time and deformation. These outcome variables were strongly correlated with the stiffness properties measured in both static and dynamic conditions, establishing stiffness as a primary mechanical determinant of compliance-related impact behaviour. Next, it was shown using multivariable models that up to 96% of the variation in contact time and 87% of the variation in deformation could be explained by the measurable properties. Finally, strong agreement with observed data was shown for these models, with errors below 10% for both variables and velocities; however, this agreement should be interpreted in the context of the shared underlying impact event from which several input and output variables were derived. The absolute model errors remained relatively small in practical terms; for contact time errors between 0.25 and 0.3 ms, which corresponded to around 3% of observed values and for deformation, errors between 1 and 6 mm which corresponded to approximately 3%–10% of the observed values. Collectively, these findings suggest that compliance-related impact behaviour of a football can be approximated within the tested dataset; however, these relationships reflect structured dependencies between variables derived from the same impact event rather than fully independent material-property-to-response relationships.
These results provide important context for the widespread use of the COR as an indicator of football performance. While COR remains a robust, standardised measure of rebound behaviour; the results demonstrated that footballs with comparable COR values can exhibit significantly different contact times and maximum deformations. Differences in these outcome variables reflect behaviours that are not directly captured by rebound height alone. Notably, footballs with identical design specifications, internal air pressure, and intended for the same level of play, exhibited differences in compliance-related behaviour of up to 17%. This result highlights a limitation of relying on COR as a sole performance metric, and advocates for a dual-focus approach to performance assessment, one that maintains the repeatability and standardisation of COR while complementing it with stiffness-related measures that better characterise compliance behaviour.
Given that ball velocities during kicking have been reported in the range 19–35 m s−1,18–21 an important but underexplored question is the extent to which governing-body test protocols, which often involve lower-velocity rebound impacts for reasons of practicality and repeatability, translate to higher velocities encountered in match play. This study is the first to demonstrate that low-velocity dynamic properties strongly correlate with high-velocity outcome variables, including contact time (r = −0.86, p < 0.001), COR (r = 0.79, p < 0.01), and deformation (r = −0.94, p < 0.001). Although the explanatory power of these properties was limited, they demonstrated consistent relationships, particularly for contact time. Low-velocity properties provided indicative estimates of high-velocity contact time [within 5% error (RMSE = 0.4 ms)] representing a more independent relationship as the input and output variables were derived from separate impact events. Model errors for deformation were larger (MAE = 7%, RMSE = 3.35 mm), yet in practice, this error remains relatively small and within a range likely suitable for performance monitoring and equipment testing. Importantly, the cluster analysis revealed consistent behavioural classifications across the two velocities, indicating that low-velocity regulatory tests may provide useful indicative estimates of high-velocity behaviour, but only for specific tested outcomes. Given that high-velocity impacts require specialised instrumentation, greater resources, and incur higher variability in measured outcomes, statistical modelling relationships using inputs from simple rebound tests may offer a preliminary indication of certain aspects of ball performance at higher velocities. While not a substitute for high-speed experimental testing, this approach may improve accessibility to performance evaluation in settings where such instrumentation is not available. With further validation across a broader range of conditions and ball designs, this approach may warrant further investigation for broad application in both regulatory and applied settings.
Limitations
The combined use of supervised and unsupervised modelling approaches enabled a data-driven exploration of football impact behaviour, providing insight into the key variables and properties that influence and differentiate impact response. However, several limitations should be considered when interpreting these findings. (1) The decline in performance when trained on averaged data highlighted the sensitivity of statistical models to dataset size suggested that the current sample of footballs may be insufficient to fully capture the underlying variability in impact response arising from differences in construction and material behaviour. (2) The dataset consisted of only 12 footballs with a single panel configuration, which not only limits construction diversity but may also bias the models towards relationships specific to this design, reducing the applicability to alternative constructions. (3) The use of only two discrete impact velocities restricted the characterisation of intermediate strain-rate behaviours, meaning that potentially important nonlinear transitions in deformation and energy dissipation are not captured. (4) In models where the inputs and outputs were derived from the same impact event, they reflect complementary descriptors of a coupled physical process. Although obtained using independent measurement systems, the observed relationships may reflect statistical assosciations that may partially arise from shared underlying dynamics, rather than fully independent predictors, potentially constraining their interpretability. This limitation does not apply to models using low-velocity inputs to estimate high-velocity behaviour, where inputs and outputs originate from separate impact events, providing a more independent basis for estimation. As such, the models presented here should therefore be interpreted as descriptive tools that capture structured relationships within the dataset, rather than as fully independent predictive models.
Future research
Future work should incorporate a broader range of constructions and intermediate velocities, and should explore the inclusion of other relevant factors such as internal pressure. Expanding the dataset would enable the development of more generalisable models capable of capturing nonlinear responses without reliance on velocity-specific formulations. Beyond normal impacts, the strong potential demonstrated here suggests that statistical modelling could also provide a practical framework for studying oblique impacts, which are inherently difficult to model theoretically due to complex tangential and coupled deformation modes. In this context, statistical modelling offers a pragmatic approach to approximating multidimensional impact behaviour beyond the normal inbound conditions considered in this study and offers a practical pathway for integrating experimental measurements into applied equipment assessment.
Conclusions
This study demonstrated the use of statistical modelling to classify and explain patterns in the impact behaviour of footballs, for certain outcome variables. Three compliance-based groupings of impact behaviour were identified, and multivariable models explained up to 96% of the variance in contact time and 87% in deformation under the conditions tested using mechanical properties and impact parameters. Model errors were generally below 10%, although these results should be interpreted within the scope of the dataset and experimental design.
Supplemental Material
sj-docx-1-pip-10.1177_17543371261455701 – Supplemental material for The relationship between mechanical properties and dynamic behaviour: A data-driven exploratory analysis of football impact behaviour
Supplemental material, sj-docx-1-pip-10.1177_17543371261455701 for The relationship between mechanical properties and dynamic behaviour: A data-driven exploratory analysis of football impact behaviour by Katie Mills, Johsan Billingham and Simon Goodwill in Proceedings of the Institution of Mechanical Engineers, Part P: Journal of Sports Engineering and Technology
Footnotes
Acknowledgements
The authors would like to express thanks for the guidance from the doctoral supervisory team of Dr. Simon Choppin, Dr. Marcus Dunn, and Dr. John Kelley, and to E. Kealey for her assistance in the collection and preparation of the validation dataset.
Funding
The authors received no financial support for the research, authorship, and/or publication of this article.
Declaration of conflicting interests
The authors declared no potential conflicts of interest with respect to the research, authorship, and/or publication of this article.
Data availability statement
Model coefficients are available in the Supplemental Material. Datasets generated in this study are available from the corresponding author* upon reasonable request.
Supplemental material
Supplemental material for this article is available online.
References
Supplementary Material
Please find the following supplemental material available below.
For Open Access articles published under a Creative Commons License, all supplemental material carries the same license as the article it is associated with.
For non-Open Access articles published, all supplemental material carries a non-exclusive license, and permission requests for re-use of supplemental material or any part of supplemental material shall be sent directly to the copyright owner as specified in the copyright notice associated with the article.