
Abstract
This paper proposes a multi-scale software vulnerability detection model using Radio Frequency Identification (RFID) target recognition technology and Field-Programmable Gate Array (FPGA) hardware design. The systematic analysis of RFID systems and FPGA architectures provides the foundation for constructing robust security solutions against code-based threats. The Scalable Vulnerability Detection Method (SVDM) is developed leveraging multi-scale code metrics and deep feature extraction techniques. The evaluations of vulnerability datasets CWE-119 and CWE-399 demonstrated over 84% accuracy, recall, and F1 score. The precision, recall, and F1 score of the CWE-399 vulnerability dataset in the SVDM were 85.15%, 85.12%, and 84.79%, respectively, while the values of the CWE-199 dataset were 83.12%, 82.16%, and 82.38%, respectively. Compared with existing methods, the functionality of SVDM was further highlighted. This research provides an extensible and adaptable framework for identifying security vulnerabilities with both hardware and software techniques. It can optimize threat detection, risk analysis, and system integrity across software development and operation life cycles, providing technical reference and scientific support for the security protection of software vulnerabilities, while promoting the development of industries such as intelligent monitoring and traceability.
Keywords
Introduction
With the continuous evolution of Internet technology, the scale and complexity of software systems increase dramatically (Baraneetharan, 2022; Ghinea et al., 2020; Nimrah & Saifullah, 2022). Recently, the number of lines of code in software has increased exponentially according to statistics, which not only improves software functionality but also brings security risks. Software vulnerabilities pose a serious threat to personal information and corporate data, becoming the main entry point for hackers. Over recent years, security reports have shown that more than 80% of security incidents are related to software vulnerabilities, which highlights the urgency of effective detection and prevention (Kumar, 2021; Mao & Wang, 2023). RFID technology utilizes neural network models and other technologies in different fields, which is feasible for practical applications such as recognition accuracy and sensor applications. However, in the communication among multiple tags in the reader, competition and conflict within the same channel can occur, leading to serious signal impact and the reader being unable to correctly parse tag information. FPGA technology is widely used in the field of intrusion detection, but there is relatively little research on network firewall detection schemes and content filtering. Meanwhile, the existing software vulnerability detection methods such as static code analysis and dynamic stain analysis can only identify vulnerabilities to a certain extent. Therefore, there are too many limitations. Specifically, static code analysis has a higher False Positive Rate (FPR), while dynamic stain analysis is limited by code coverage. Faced with increasingly complex software structures and huge code base, these traditional methods are often unable to meet the requirements of rapid and accurate detection (Almomany et al., 2022; Bobda et al., 2022). To improve the security detection capability of software vulnerabilities, scholars at home and abroad have conducted extensive research and exploration. Akram et al. proposed a vulnerability detection method based on code cloning detection technology for better detecting vulnerabilities in software. Then, the method was applied to actual vulnerability processing, which detected software vulnerabilities efficiently and reliably (Akram & Luo, 2021). For software vulnerability security detection, precise algorithms and deep learning networks are often combined to detect intrusion signals in real-time, which improves the operational performance of vulnerability detection models. Qasem et al. focused on software vulnerability security issues. An embedded system was proposed, which was used to scan and detect security vulnerabilities in underlying software. Quantitative and qualitative analyses proved the high recognition accuracy of the detection model (Qasem et al., 2021). Batur Şahin et al. proposed a static analysis tool for automatic detection of software vulnerabilities. Then a classification model was developed. This method reduced the FPR and False Negative Rate (FNR) of vulnerability detection in the experimental results (Batur Şahin & Abualigah, 2021). Cheng et al. proposed an embedding method based on deep learning for vulnerability security detection. After combined with graphical neural networks, the detection model was established to demonstrate the high accuracy (Cheng et al., 2021). In addition, in the detection and protection of software vulnerabilities, large-scale instance validation has also been conducted to explore the essence of software vulnerabilities. Lv et al. used an image feature extraction method to exploit buffer overflow vulnerabilities in C programs to reduce code information loss. The results showed that it had high vulnerability detection performance (Lv et al., 2023). Iannone et al. stated that software vulnerabilities were weaknesses in the source code. Meanwhile, the life cycle of software engineering was analyzed to identify ways for eliminating vulnerabilities, which verified the superiority of subsequent vulnerability repair and detection capabilities (Trebuna et al., 2019). Zhang et al. proposed encrypting the application programming interface to enhance the effectiveness, thereby proving the high detection accuracy (Gajic et al., 2019). Zhang et al. used deep learning technology to improve the vulnerability code cloning detection model and conducted performance tests on the improved model. The results showed that the model had better effects on software vulnerability detection than the existing technology (Bayazit et al., 2023). Although code analysis and vulnerability detection models have actually improved the efficiency and accuracy of vulnerability detection, their classification, identification, and accurate detection only appear in low-level software. There is still a lack of intelligent and advanced technologies and models for more complex network attacks and security threats. Therefore, in order to improve the effectiveness of software vulnerability detection, Radio Frequency Identification (RFID) technology and Field-Programmable Gate Array (FPGA) are applied to software vulnerability detection model. Among them, RFID technology makes use of neural network model and other technologies in different fields, which is feasible for the identification accuracy and sensor application in practical applications. Therefore, it can improve the identification performance and intelligence level of RFID system (Cong et al., 2022). FPGA is widely used in circuit, Internet, and big data applications. It adopts various network models and high-precision algorithms, which provides fast and accurate operating performance for hardware design and development (Akram & Luo, 2021). The research innovatively combines FPGA and RFID. At the same time, a Scalable Vulnerability Detection Method (SVDM) model is proposed based on FPGA-RFID technology. Compared with the methods in the existing literature, the proposed SVDM based on FPGA-RFID has the parallel processing capability of FPGA and the real-time recognition function of RFID, which can effectively overcome the limitations of traditional methods, as well as bring new breakthroughs to the software security detection. The research is carried out in four parts. The first part describes the current research results. The second part analyzes the RFID and FPGA technology. The third part analyzes and compares the constructed model. The last part summarizes the whole research.
Research Method
RFID technology is combined with FPGA to improve algorithm accuracy, providing technical support for building software vulnerability detection models.
Construction of RF System
RFID is a non-contact automatic identification technology based on inductance or electromagnetic coupling, which often plays an intelligent role in various fields such as monitoring and tracking. The key technology of RFID system is to obtain tag information quickly and accurately, and monitor it in real time (Mares et al., 2023). RFID systems in different communication bands have a great impact on the identification of label information, usually divided into categories such as Low Frequency, High Frequency, Ultra High Frequency (UHF), and microwave. Among them, UHF-RFID system is the most widely used, which can achieve a communication distance of 40–80 m. Meanwhile, it has long-distance identification and high reliability, so it is applied in software vulnerability detection model to improve the identification performance. The UHF-RFID system mainly uses electromagnetic coupling, in which the reader continuously sends the carrier through the dipole antenna. The instructions sent by the upper computer are attached. Part of the RF energy is absorbed at the tag and then converted into DC energy through the rectifier circuit to activate the tag chip. Meanwhile, the other part of the radio frequency energy uses the tag demodulation circuit and converts it into a digital signal (Pekarcikova et al., 2022). By adjusting the impedance of the circuit to change the matching condition of the antenna, the tag can scatter the corresponding data in different directions with various strengths. Then, the reader receives the scattered signal from different directions to obtain the tag information, thus collecting and identifying the tag information. The transmission and reception of radio frequency signals are both the collection and preprocessing of information or data. When the target tag receives the electromagnetic wave sent by the reader, the chip is activated and then transmitted to the reader in reverse. The distance of the radio frequency signal propagated is twice the distance between the reader and the tag.
In equation (7),
In equation (8),
In equation (9),
In equation (10),
In equation (11), the data for each window is
In equation (12),
In equation (13),
Construction of Field-Programmable Gate Array
As a universal user programmable device, FPGA has the high integration and versatility of gate array devices, the flexibility of field-programmable logic devices, short development cycles, and is easy to upgrade and maintain (Kara et al., 2022). Due to the above advantages of FPGA module, it is applied to software vulnerability detection model for improving the processing efficiency of the model. According to the FPGA chip design process and architecture developed by Xilinx, the security detection issues are thoroughly studied. The overall design process of FPGA is shown in Figure 1. FPGA Design Flow Chart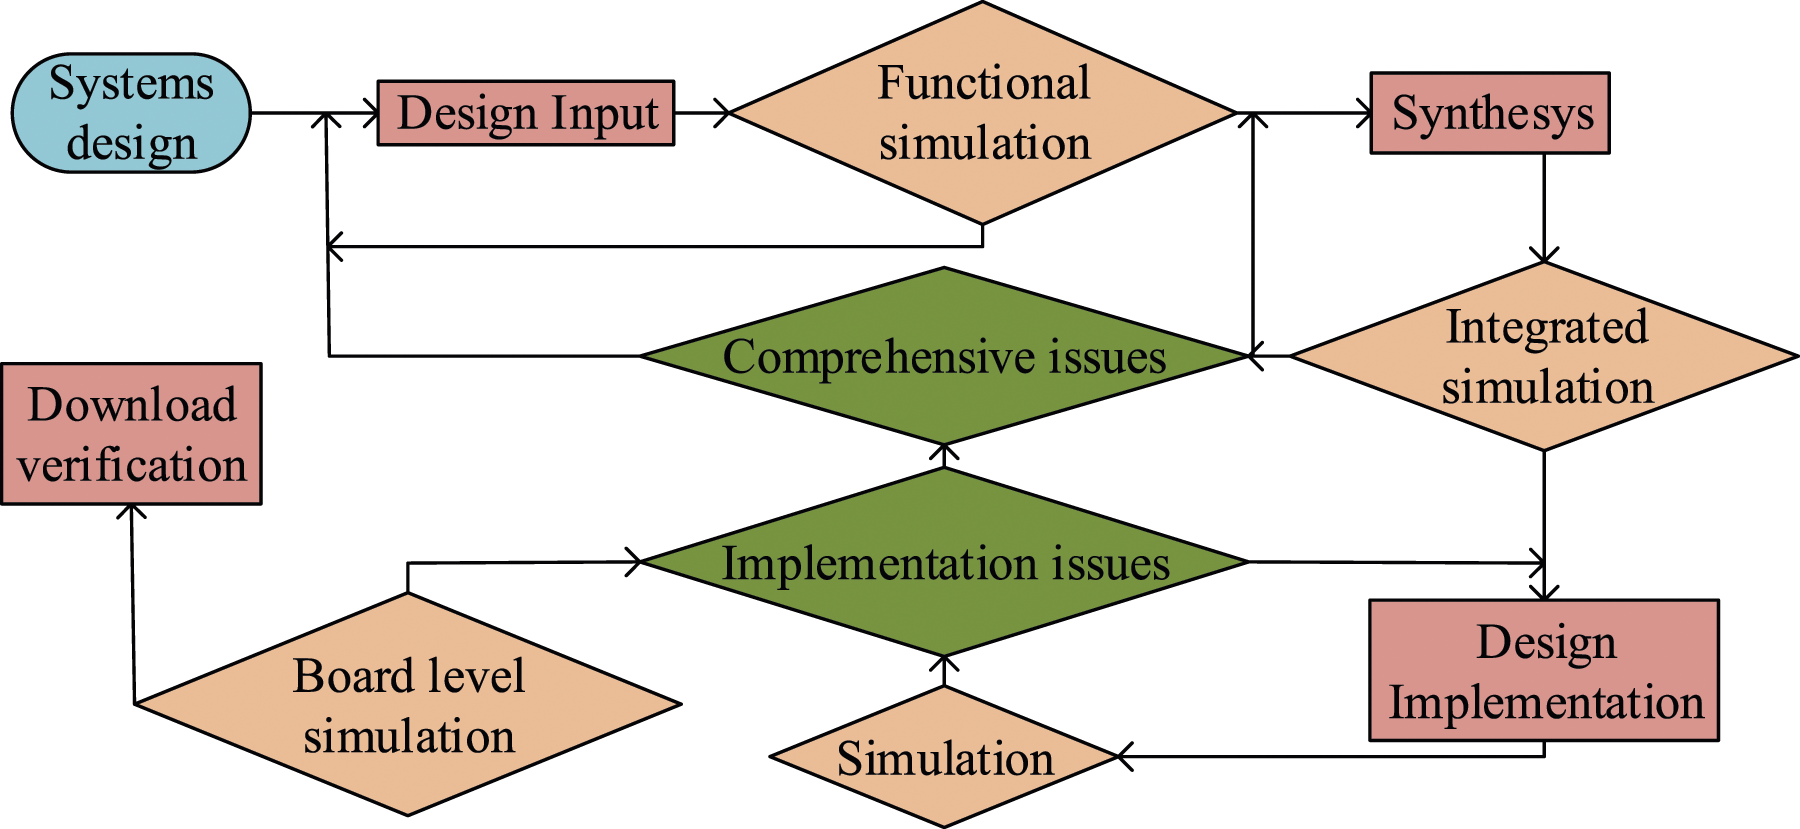
From Figure 1, FPGA is mainly divided into design input, design synthesis, design implementation, and download verification. The design input can be achieved through methods such as drawing schematic diagrams and writing hardware programming languages. Simulation verification can be divided into RTL simulation, comprehensive simulation, timing simulation, and board level simulation according to different stages. Design synthesis is combined with constraints to optimize the design, obtaining the best solution. The design implementation distributes the obtained logic to the actual chip devices. The final download verification is to load the configuration bitstream data into the FPFA chip, which is to ensure the operation of the circuit. The architecture of Xilinx FPGA chips includes Input Output Block (IOB), Configurable Logic Block (CLB), Switch Box (SB), Connecting Box (CB), and Built in Random Access Memory (BRAM). The specific structure is shown in Figure 2. Basic Structure Diagram of FPGA Chip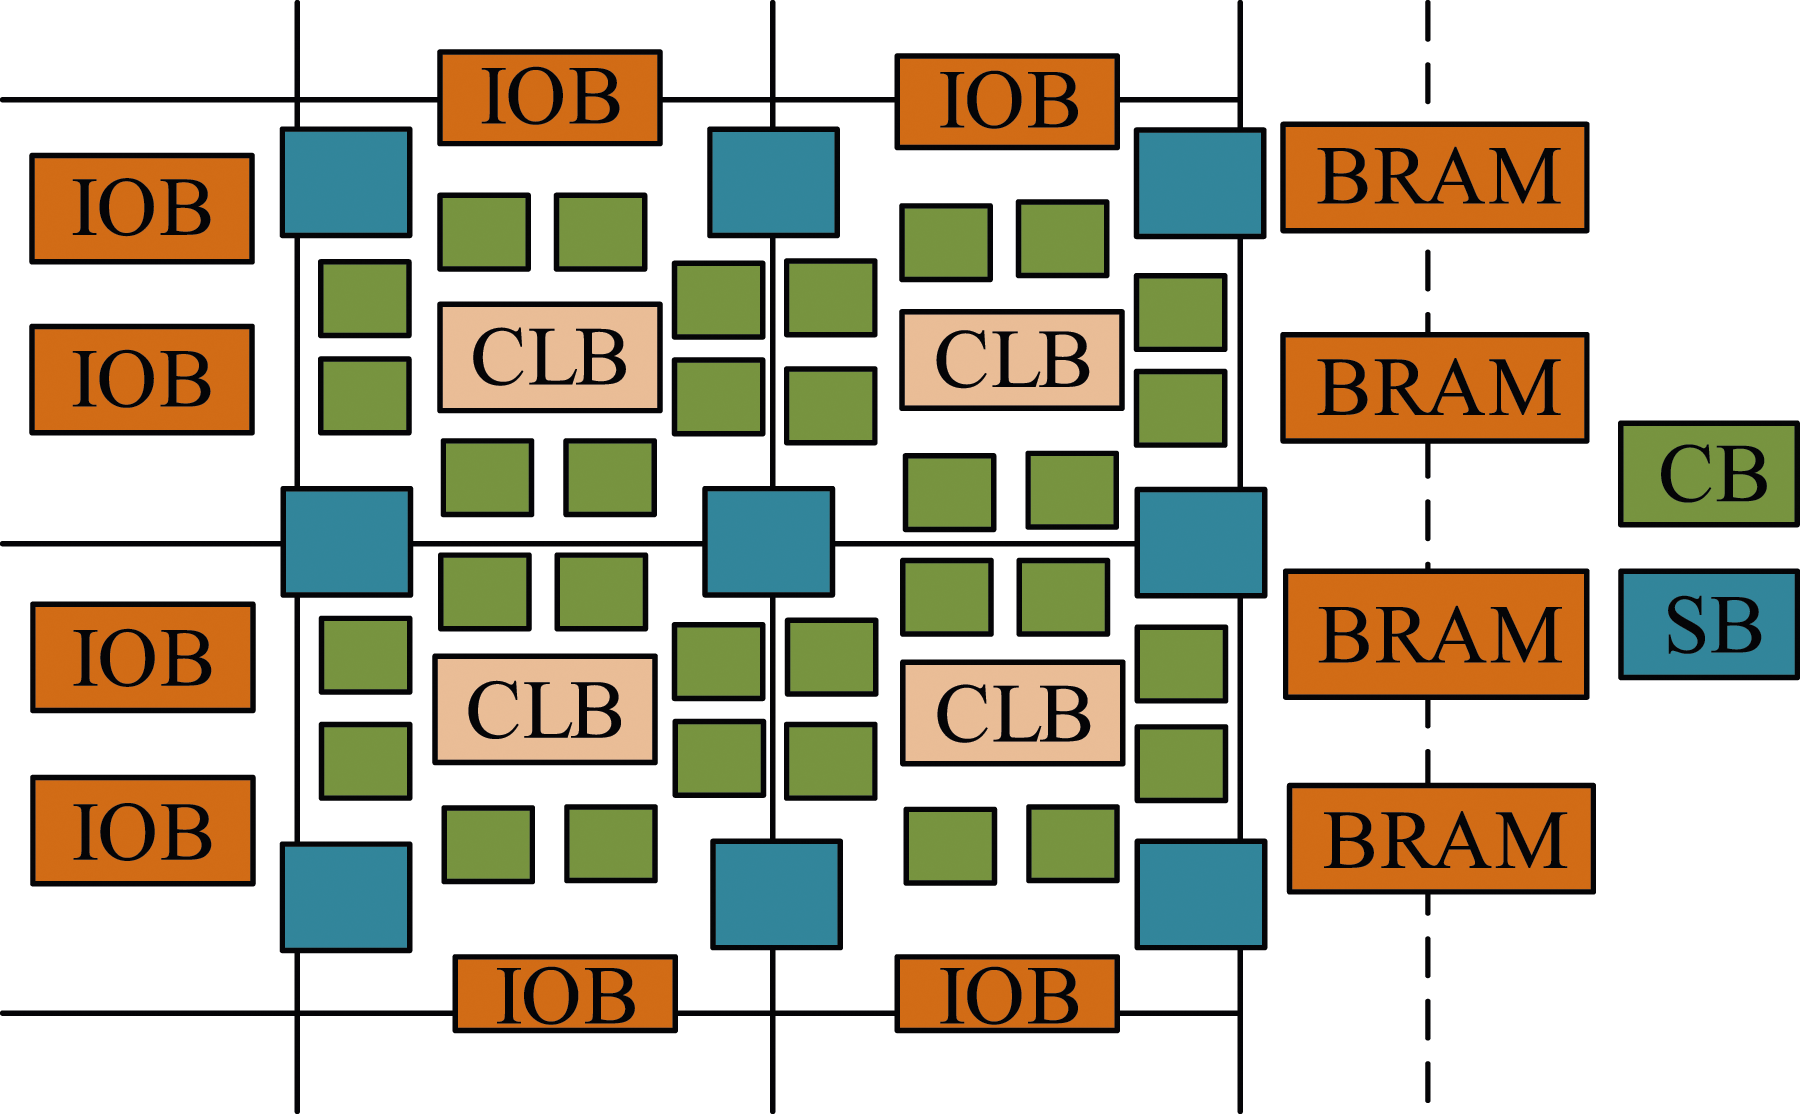
In Figure 2, the FPGA circuit design mainly consists of combinational logic and sequential logic. The combinational circuit is the data input of the sequential circuit. Data output can drive other sequential logics. The only logical function that determines the FPGA is the configuration data stored in an internal static storage unit. The numerical selection can configure the status options of logical units and the connection methods between each unit. In the architecture of FPGA chips, it is important to understand the main functions of each module (Şahin, 2023). Firstly, the IOB module serves as the external pin of the chip, mainly for inputting or outputting signals. The CLB module is the core circuit logic block of FPGA chips, which contains most of the resources. It can implement combinational logic, carry logic, and arithmetic logic, thereby completing logic carry and other operations. Secondly, BRAM is divided into single-port RAM, dual-port RAM, and first-in, first-out (FIFO) in FPGA chips. RAM can read and write data by address, while FIFO can only read and write data in order. Then, the digital clock management module completes clock phase adjustment and clock comprehensive management in the chip. Finally, FPGA chips contain rich wiring resources, including global wiring resources, long line resources, short line resources, and distributed resources. It mainly connects various logic units within the chip or completes signal control. The power supply of FPGA is relatively complex. Therefore, the power-on sequence and isolation need to be considered. As the power chips are all switching power chips, phase control is performed. The optimized Least Mean Square (LMS) algorithm and Coordinate Rotation Digital Computer (CORDIC) based on Euclidean distance can achieve phase correction. When FPGA processes signals and data, the binary form is often used. The expression of binary numbers includes fixed point numbers and floating-point numbers. Compared with floating-point numbers, the position of the decimal places remains unchanged, as shown in equation (1).
In equation (1),

In equation (2),
Construction of Software Vulnerability Detection Model
With the development of information technology, the scale of software application is getting larger, and its architecture is also more complex, which leads to more common hidden security risks and more frequent malicious attacks (Zhang, 2024). Therefore, the detection and protection technology of software vulnerabilities is a research hotspot in the software security at present (Gültekin et al., 2023; Kavitha et al., 2023). The intelligent detection method for software vulnerabilities is usually based on deep learning computing hardware platforms and then analyzes the design, production, and computing patterns of the hardware platform to discuss the possibility of vulnerabilities (Kurnianto Hidayat & Wang, 2023). Therefore, for software vulnerability detection methods, multi-scale code measurement and feature extraction network are used to analyze the accuracy and efficiency of software vulnerability detection. The vulnerability type that its detection system can detect is Common Weakness Enumeration (CWE). Two representative vulnerability types, CWE-119 and CWE-399, are selected from it to verify the effectiveness of the detection system. After using RFID technology to process data and building FPGA successfully, an SVDM is proposed based on the two. SVDM mainly consists of three parts, namely, parser module, feature extraction module, and representation learning network model. In the feature extraction module, FPGA-RFID technology is used to improve the extraction efficiency and accuracy. The SVDM based on FPGA-RFID technology is shown in Figure 3. Vulnerability Detection Model Framework Diagram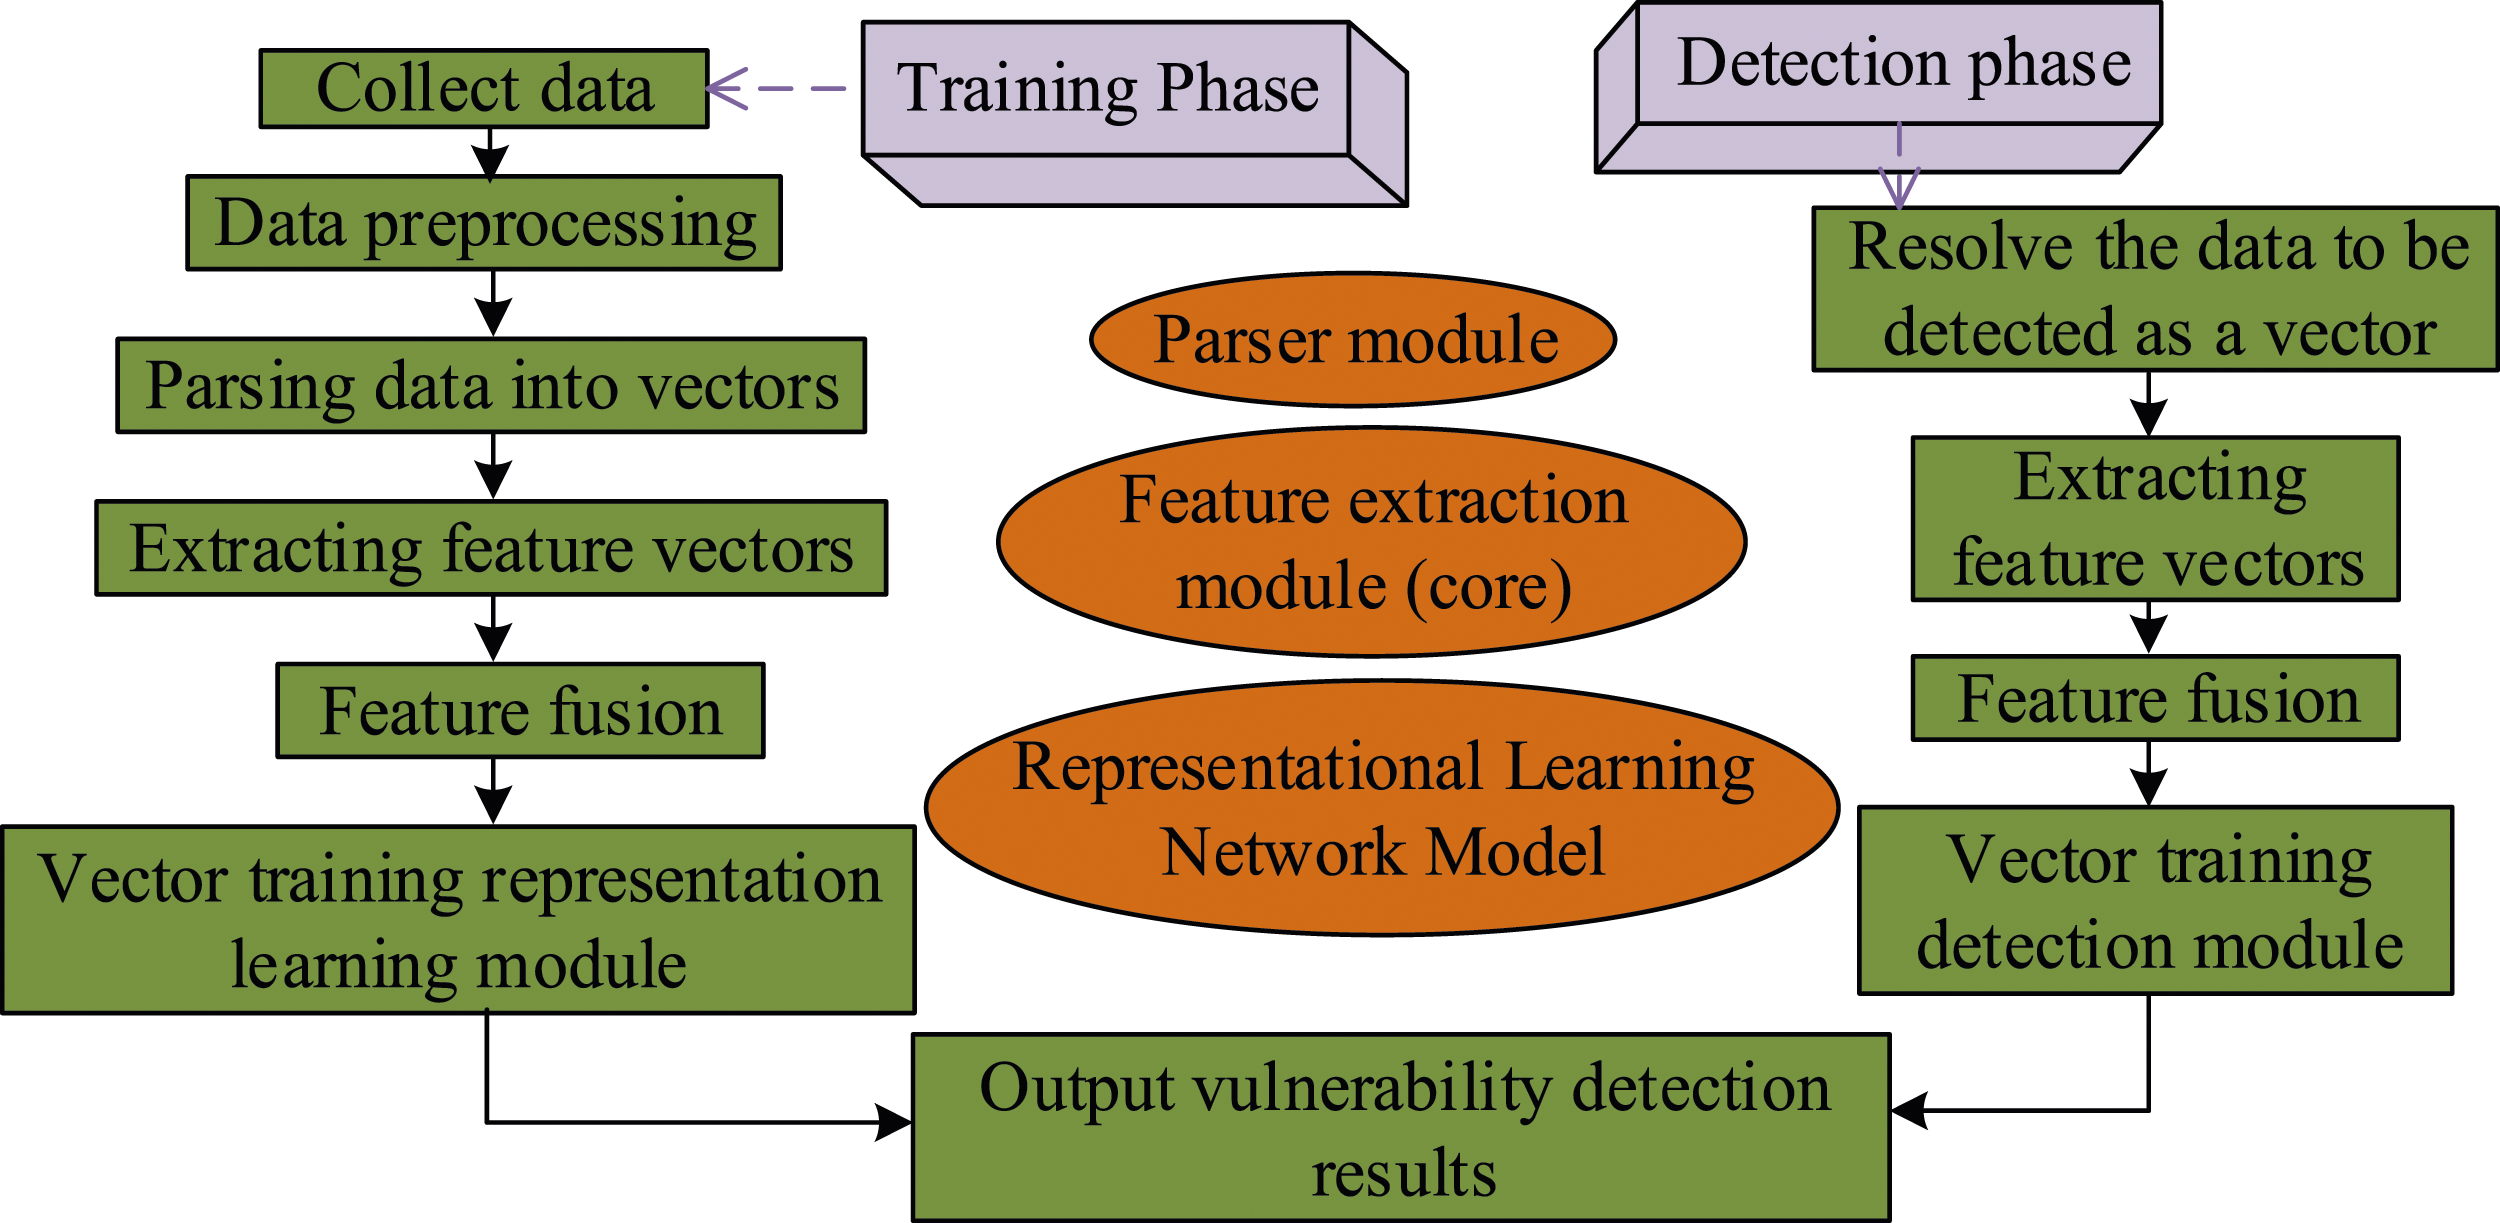
The model architecture of SVDM is designed to enable efficient and scalable vulnerability detection, where the parser module is responsible for parsing data (such as source code and binary files) into a vector representation. Therefore, the parser module can lay the foundation for subsequent processing. From these vectors, the feature extraction module extracts key features related to software vulnerabilities (code complexity, function call graphs, control flow graphs, etc.). The complexity of the control flow is evaluated by calculating the cyclomatic complexity of the code. By analyzing the function call graph, potential function level vulnerabilities are identified. Static code analysis tools are also used to extract features related to specific vulnerability patterns. These features are effectively integrated into the SVDM to improve the accuracy of vulnerability detection. In the representational learning phase, these features are combined effectively to form a more comprehensive and distinguishable feature set. In addition, hyper-parameter tuning is critical to the performance of deep learning models. The hyper-parameters (learning rate, batch size, and regularization parameters) of SVDM are fine-adjusted by cross validation, grid search, and Bayesian optimization. Through hyper-parameter tuning, the research can find the most suitable model configuration for the current dataset and vulnerability detection task. Finally, in order to verify the effectiveness of SVDM, two common vulnerability types are selected in the CWE list: CWE-119 (buffer error) and CWE-399 (resource leakage). To demonstrate the accuracy and feasibility of vulnerability detection models, the vulnerability detection methods based on semantics and code metrics are compared. Evaluation indicators usually use precision, recall, FNR, FPR, and F1 score to determine the accuracy of vulnerability detection models. The FNR is the rate at which negative results are mistakenly detected as positive, as shown in equation (3).

In equation (3),

In equation (4),

In equation (5),

In equation (6),
Result and Discussion
Based on the vulnerability dataset, the vulnerability detection model is trained on the network. By combining neural networks, the performance of different detection tools is compared to analyze the optimal performance and practicality of software vulnerability detection models.
Network Model Training Results for Vulnerability Datasets
The vulnerability data used in software vulnerability model testing mainly comes from the National Vulnerability Database (NVD) in the United States. NVD is a representative source code for open-source software projects in the real world, with 61,638 vulnerability samples selected. The CWE-119 vulnerability type contains 10,440 positive samples and 29,313 negative samples. CWE-399 vulnerability types include 7285 positive samples and 14,600 negative samples. The comparison indicators of this experiment mainly include precision, recall, FNR, FPR, and F1 score. Among them, precision refers to the proportion of samples correctly detected as positive samples in all samples tested as positive samples, which measures the accuracy of test results. The recall is the proportion of samples that are correctly tested positive to all samples that are actually positive, reflecting the completeness of the test results. The FNE describes the rate at which a negative sample is wrongly tested as positive. The FPR is the rate at which a positive sample is wrongly tested as negative. F1 score is the harmonic average of precision and recall, which is used for comprehensive evaluation of detection performance. Overall, these metrics provide a comprehensive assessment of the model performance.
The parameter settings of the vulnerability detection model are important for experimental operation. The neural network settings for the feature extraction module mainly include Bidirectional-Long Short Term Memory Network (Bi-LSTM) for semantic metrics, Convolutional Neural Network (CNN) for function granularity, and CNN for row granularity. The vulnerability characterization learning module utilizes the Bi-LSTM. Subsequently, to demonstrate the feasibility of SVDM, the multi-scale code measurement dataset is uniformly divided. Then it is used for training and testing vulnerability detection models. Additionally, several vulnerability detection tools and methods are selected for comparison, namely, Flawfinder, RIPS, VCCFinder, VPM, VulExplore, and VulDeePecker. The training dataset is derived from the CWE-119 and CWE-399 (Galić et al., 2024; Mohammad et al., 2022). The two are differentiated and mixed for training and testing to demonstrate the universal applicability of the detection model. Then, CWE-119-SET, CWE-399-SET, and the mixed dataset Multi-SET are selected for detection. The results are shown in Figure 4. Performance Comparison of Different Datasets in SVDM Vulnerability Detection Model. (a) Comparison of precision, recall, and F1 of different data. (b) Comparison of false positive and false negative rates of different data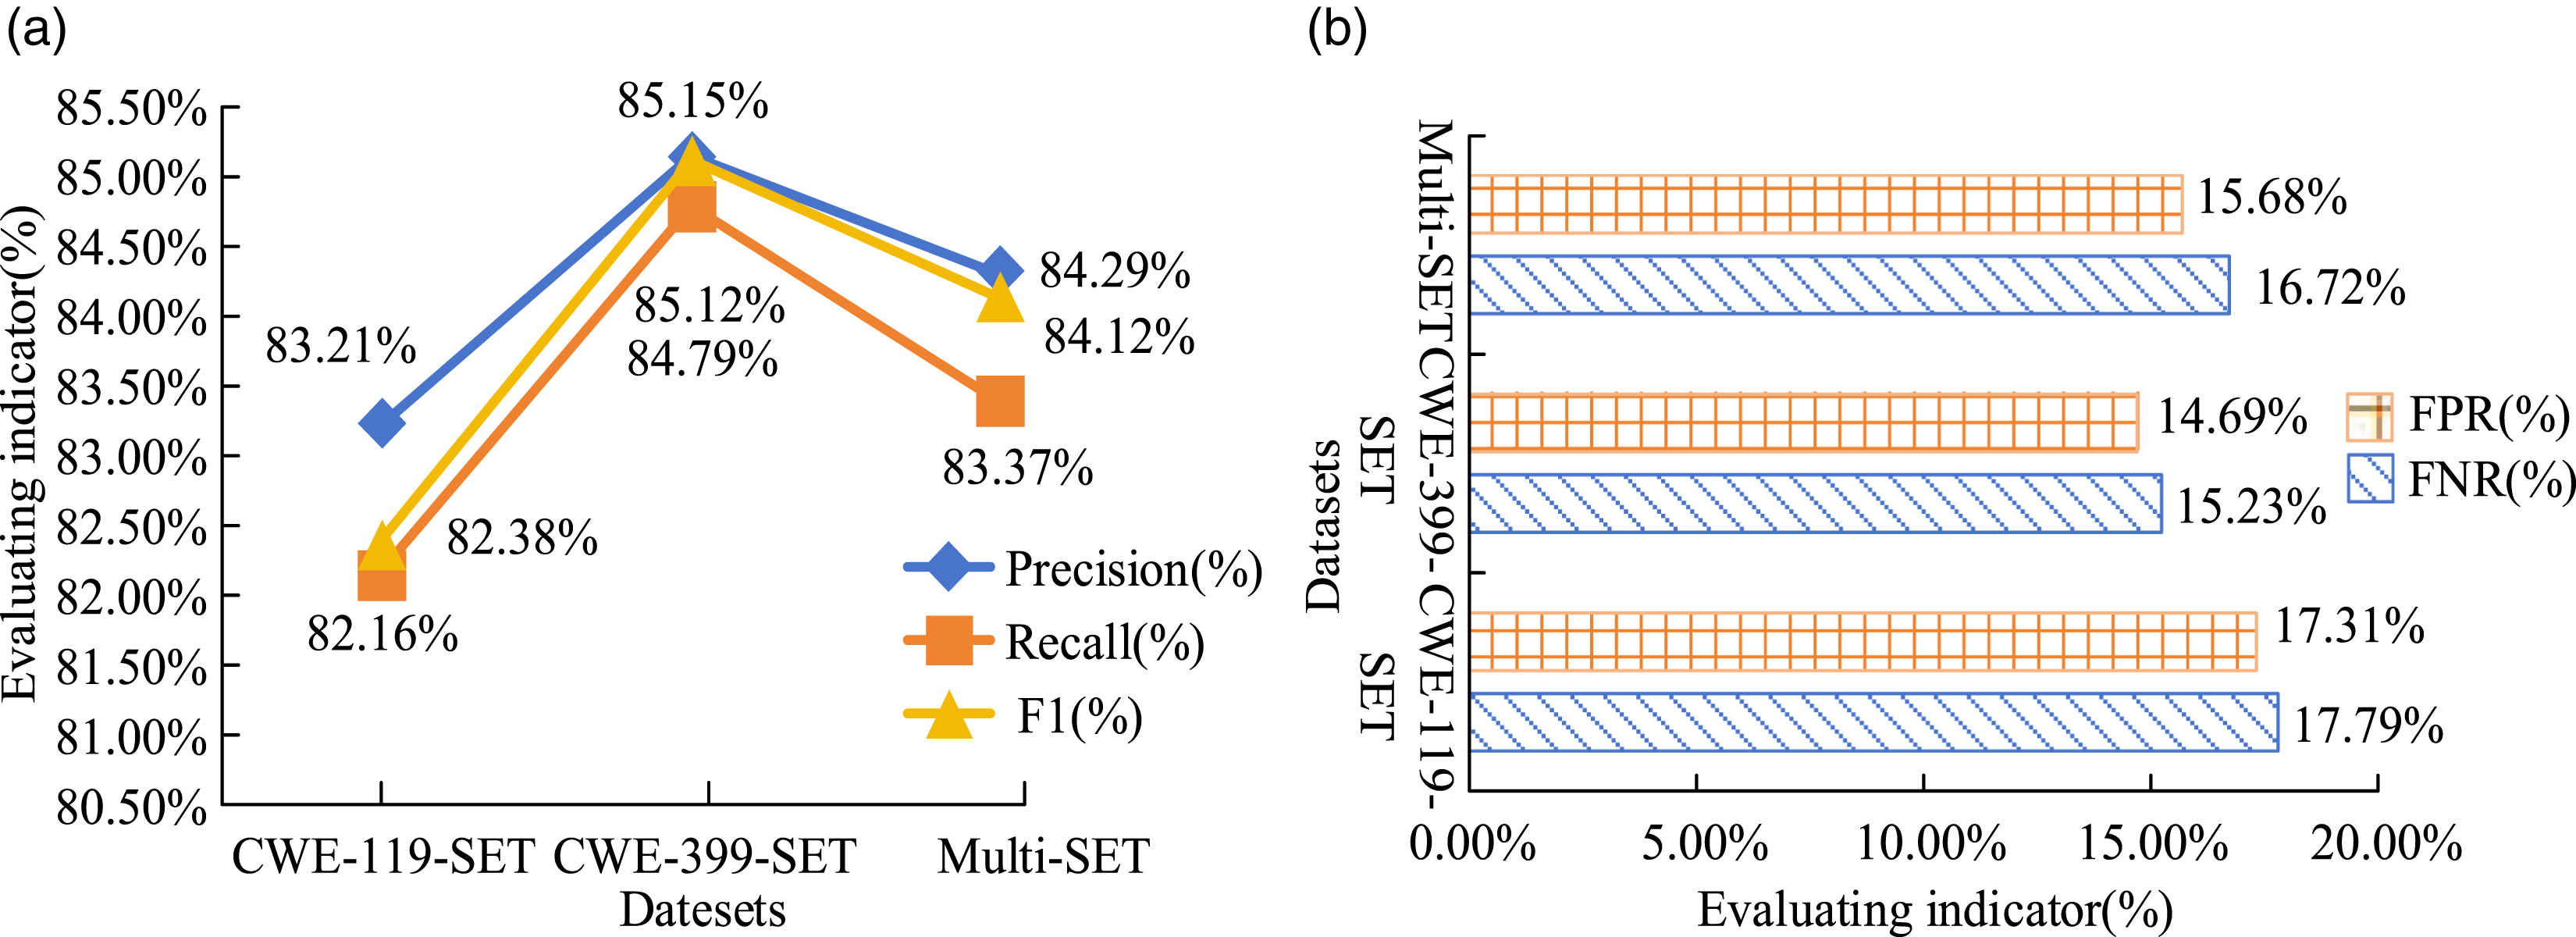
From Figure 4, the precision, recall, and F1 indicators of the CWE-399 vulnerability dataset in the SVDM vulnerability detection model were 85.15%, 85.12%, and 84.79%, respectively, which were much higher than the CWE-119 dataset and the mixed dataset Multi-SET. In the detection results of FPR and FNR, the CWE-119 dataset had the highest FPR and FNR of 17.79% and 17.31%, respectively. This indicated poor dataset detection results. The CWE-399 dataset showed better detection results, with 15.23% and 14.69%, respectively. Overall, the deviation of the three datasets was still within an acceptable range. The significant difference was the F1 score of 2.74%, which verified the universal applicability on different vulnerability types. The mixed dataset Multi-SET was selected. It was trained and tested using different methods. The detection results are shown in Figure 5 (Kim et al., 2021). Comparison of Detection Metrics Between Different Detection Methods on Mixed Dataset Multi-SET. (a) Comparison of precision, recall, and F1 of Flawfinder, RIPS, VCCFinder, and VPM detection methods. (b) Comparison of FPR and FNR among Flawfinder, RIPS, VCCFinder, and VPM detection methods. (c) Comparison of precision, recall, and F1 of VulExplore, VulDeePecker, and SVDM detection methods. (d) Comparison of FPR and FNR among VulExplore, VulDeePecker, and SVDM detection methods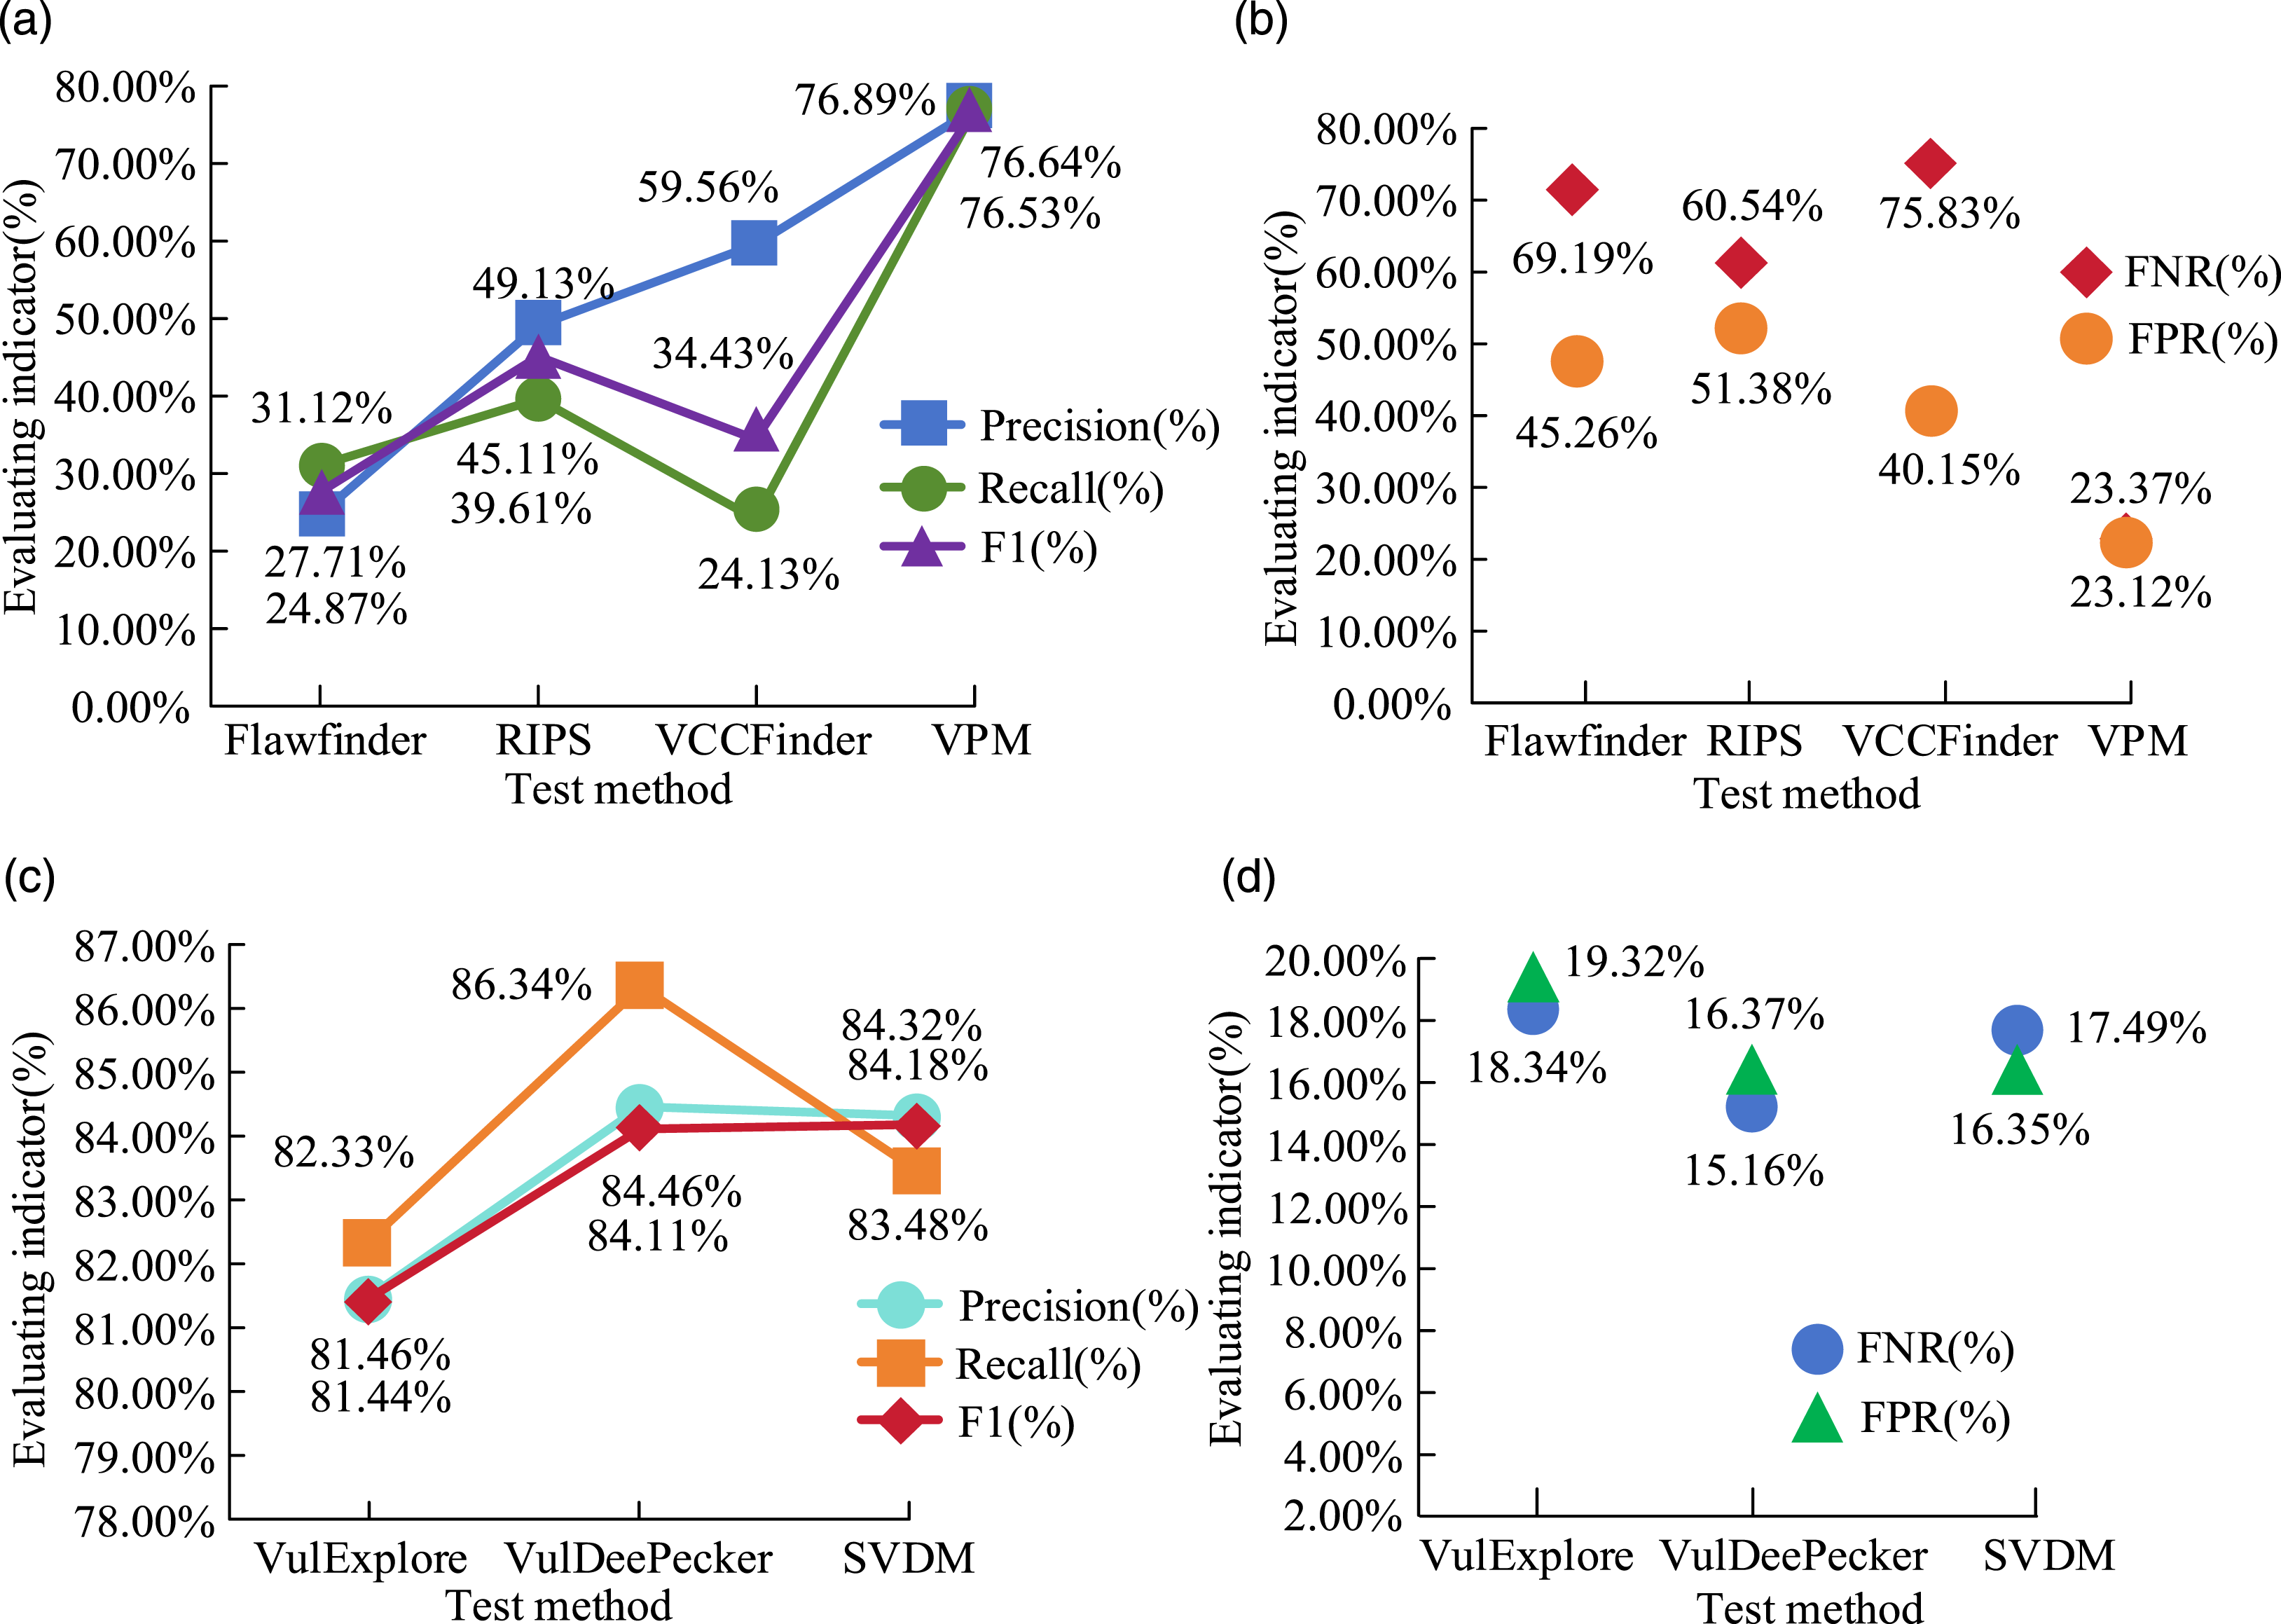
From Figure 5, the overall detection results of the SVDM were superior to other detection methods. The precision, recall, and F1 score of the mixed dataset Multi-SET on the model were 84.32%, 83.48%, and 84.18%, respectively. The FPR and FNR were 17.49% and 16.35%, respectively. Although higher than the 15.16% and 16.37% of VulDeePecker detection methods, it was far lower than other detection methods (Saminathan et al., 2023). To further demonstrate the complete detection results of different vulnerability detection methods, the Receiver Operating Characteristic Curves (ROCs) are tested for different detection methods and network models, as displayed in Figure 6. Comparison of ROC Curves for Different Detection Methods and Network Models. (a) Comparison of ROC for different detection methods. (b) Comparison of ROC for different network models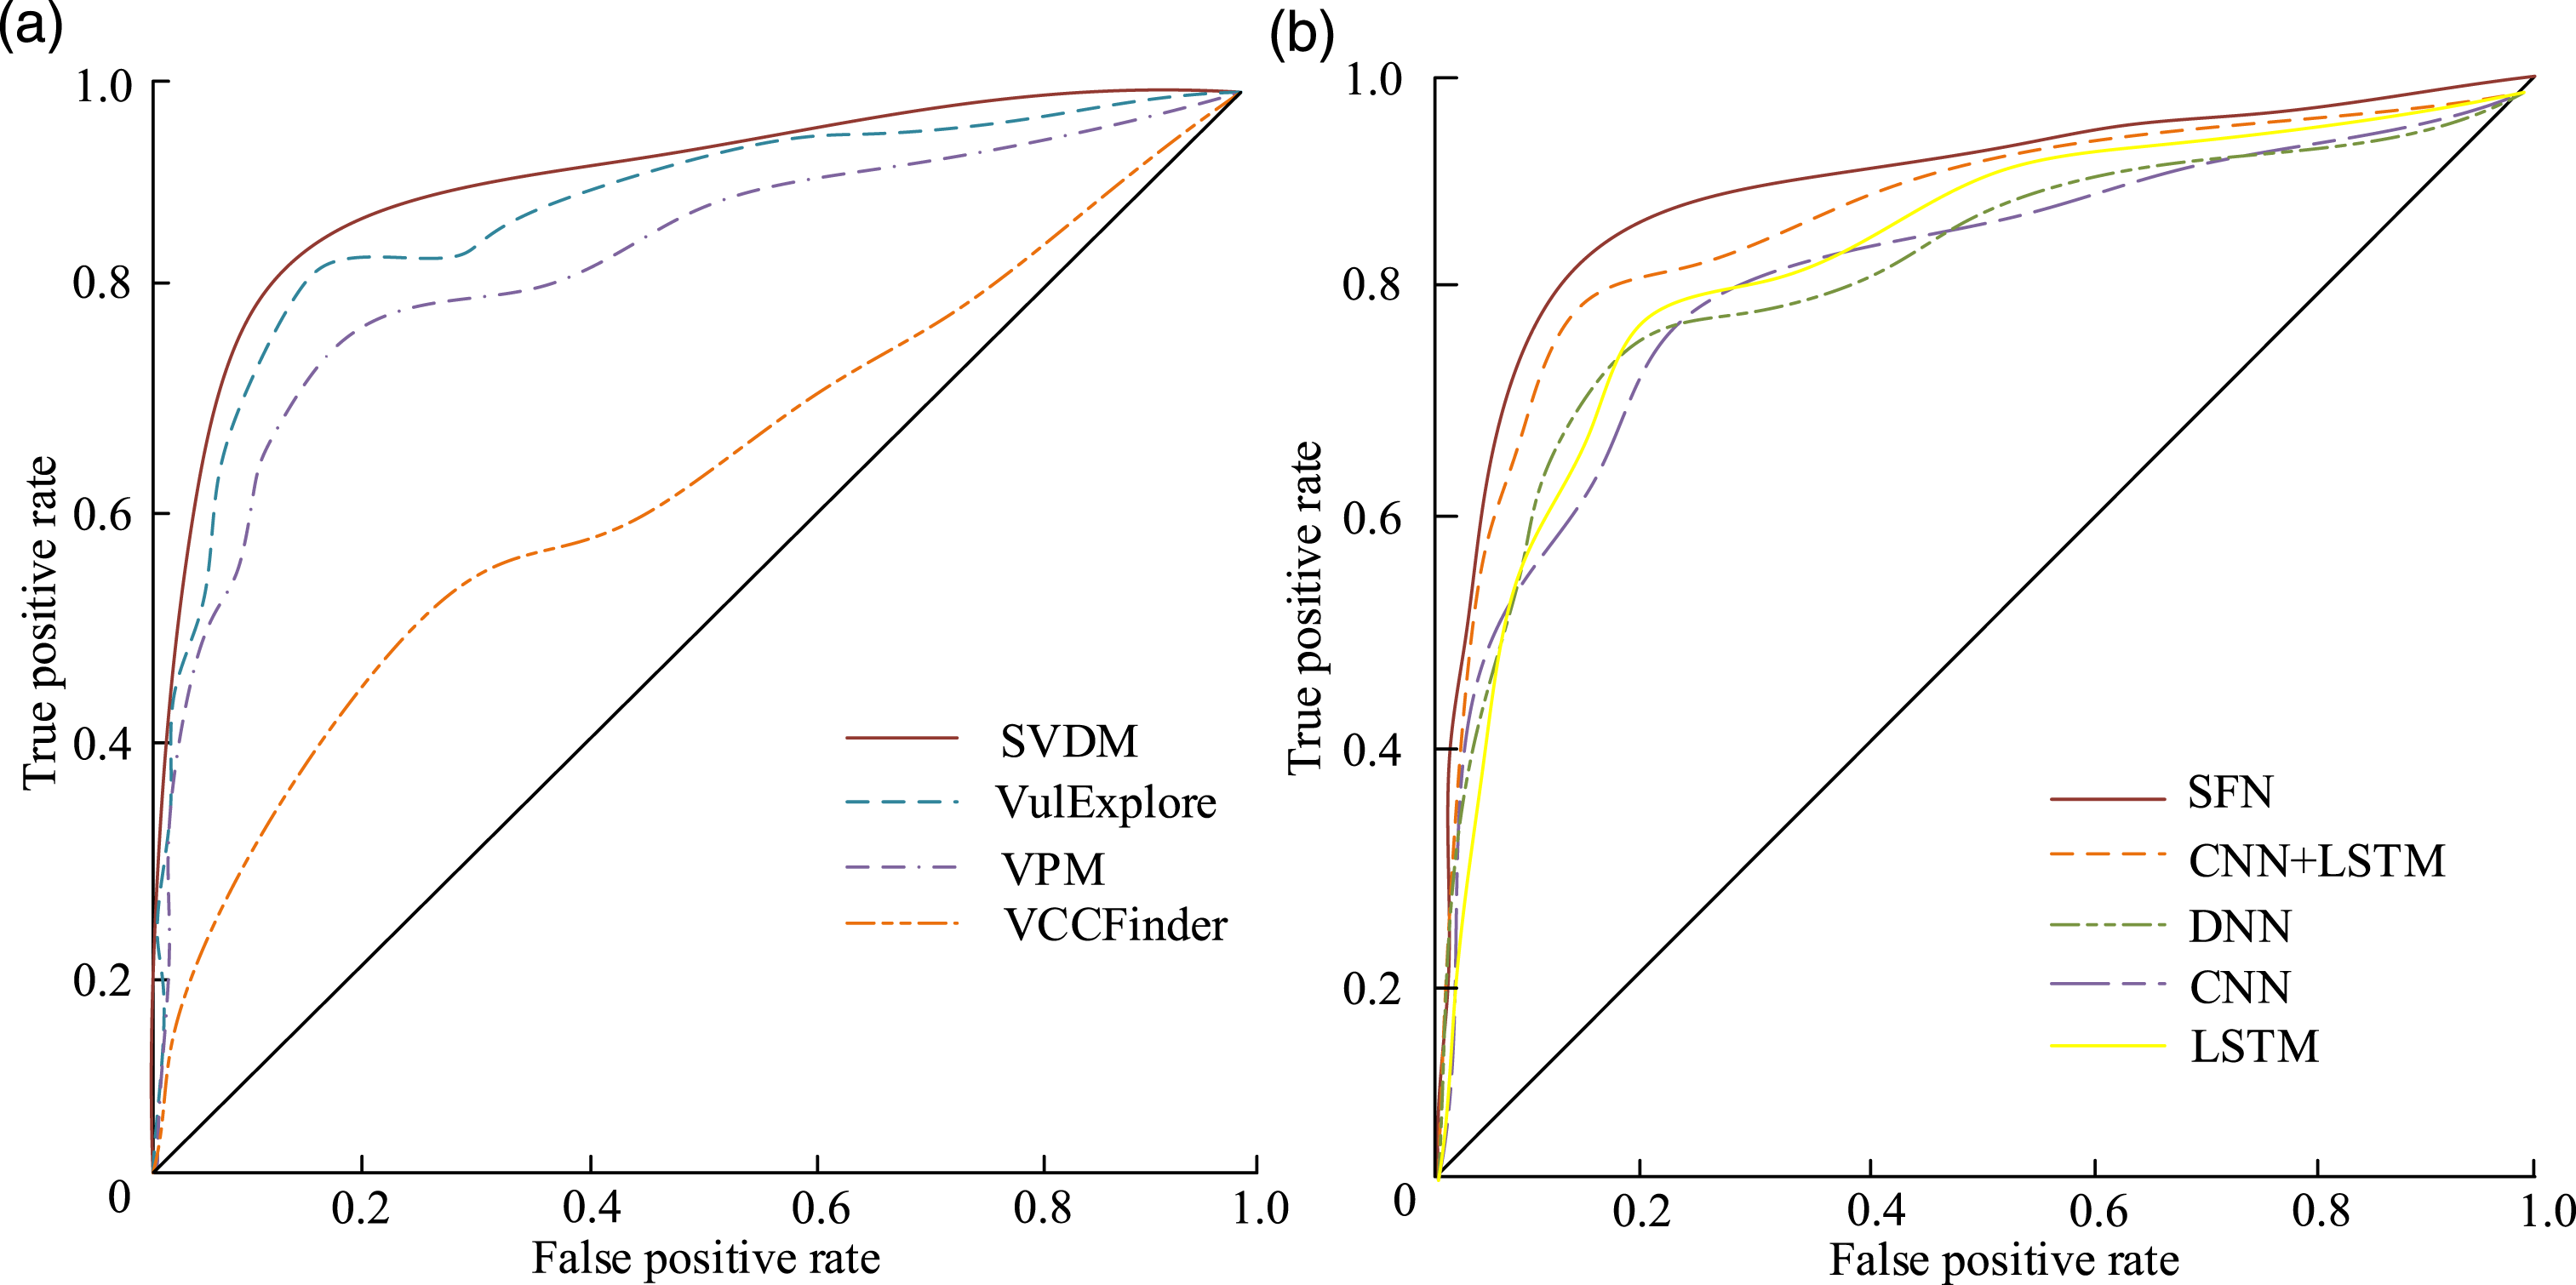
From Figure 6, the SVDM detection method used a Scalable Feature Network (SFN). The Deep Neural Network (DNN) was added for comparison. The ROC of the SVDM was closer to the upper left corner according to the Figure 6(a). It used a feature extraction module of Bi-LSTM + CNN + CNN to extract features from multi-scale code metrics (Al-Hassan et al., 2022). The long-term memory performance is applied to perform deep representation learning on feature vectors, thereby preserving features of different granularity in vulnerability code. The SFN model in Figure 6(b) emphasized the semantic information of the code context, which also focused on the correlation between metric attributes. Furthermore, the ROC curve was higher than other curves. The performance was superior to other models.
Performance Analysis of Software Vulnerability Detection Model
Afterward, the SVDM vulnerability detection model was improved to enhance the detection performance. The network structure of the model was replaced with a DNN structure. The detection structures of different models are compared, as displayed in Figure 7. Comparison of Vulnerability Detection Results in Different Models. (a) Comparison of precision, recall, and F1 results of different models. (b) Comparison of FNR and FPR results for different models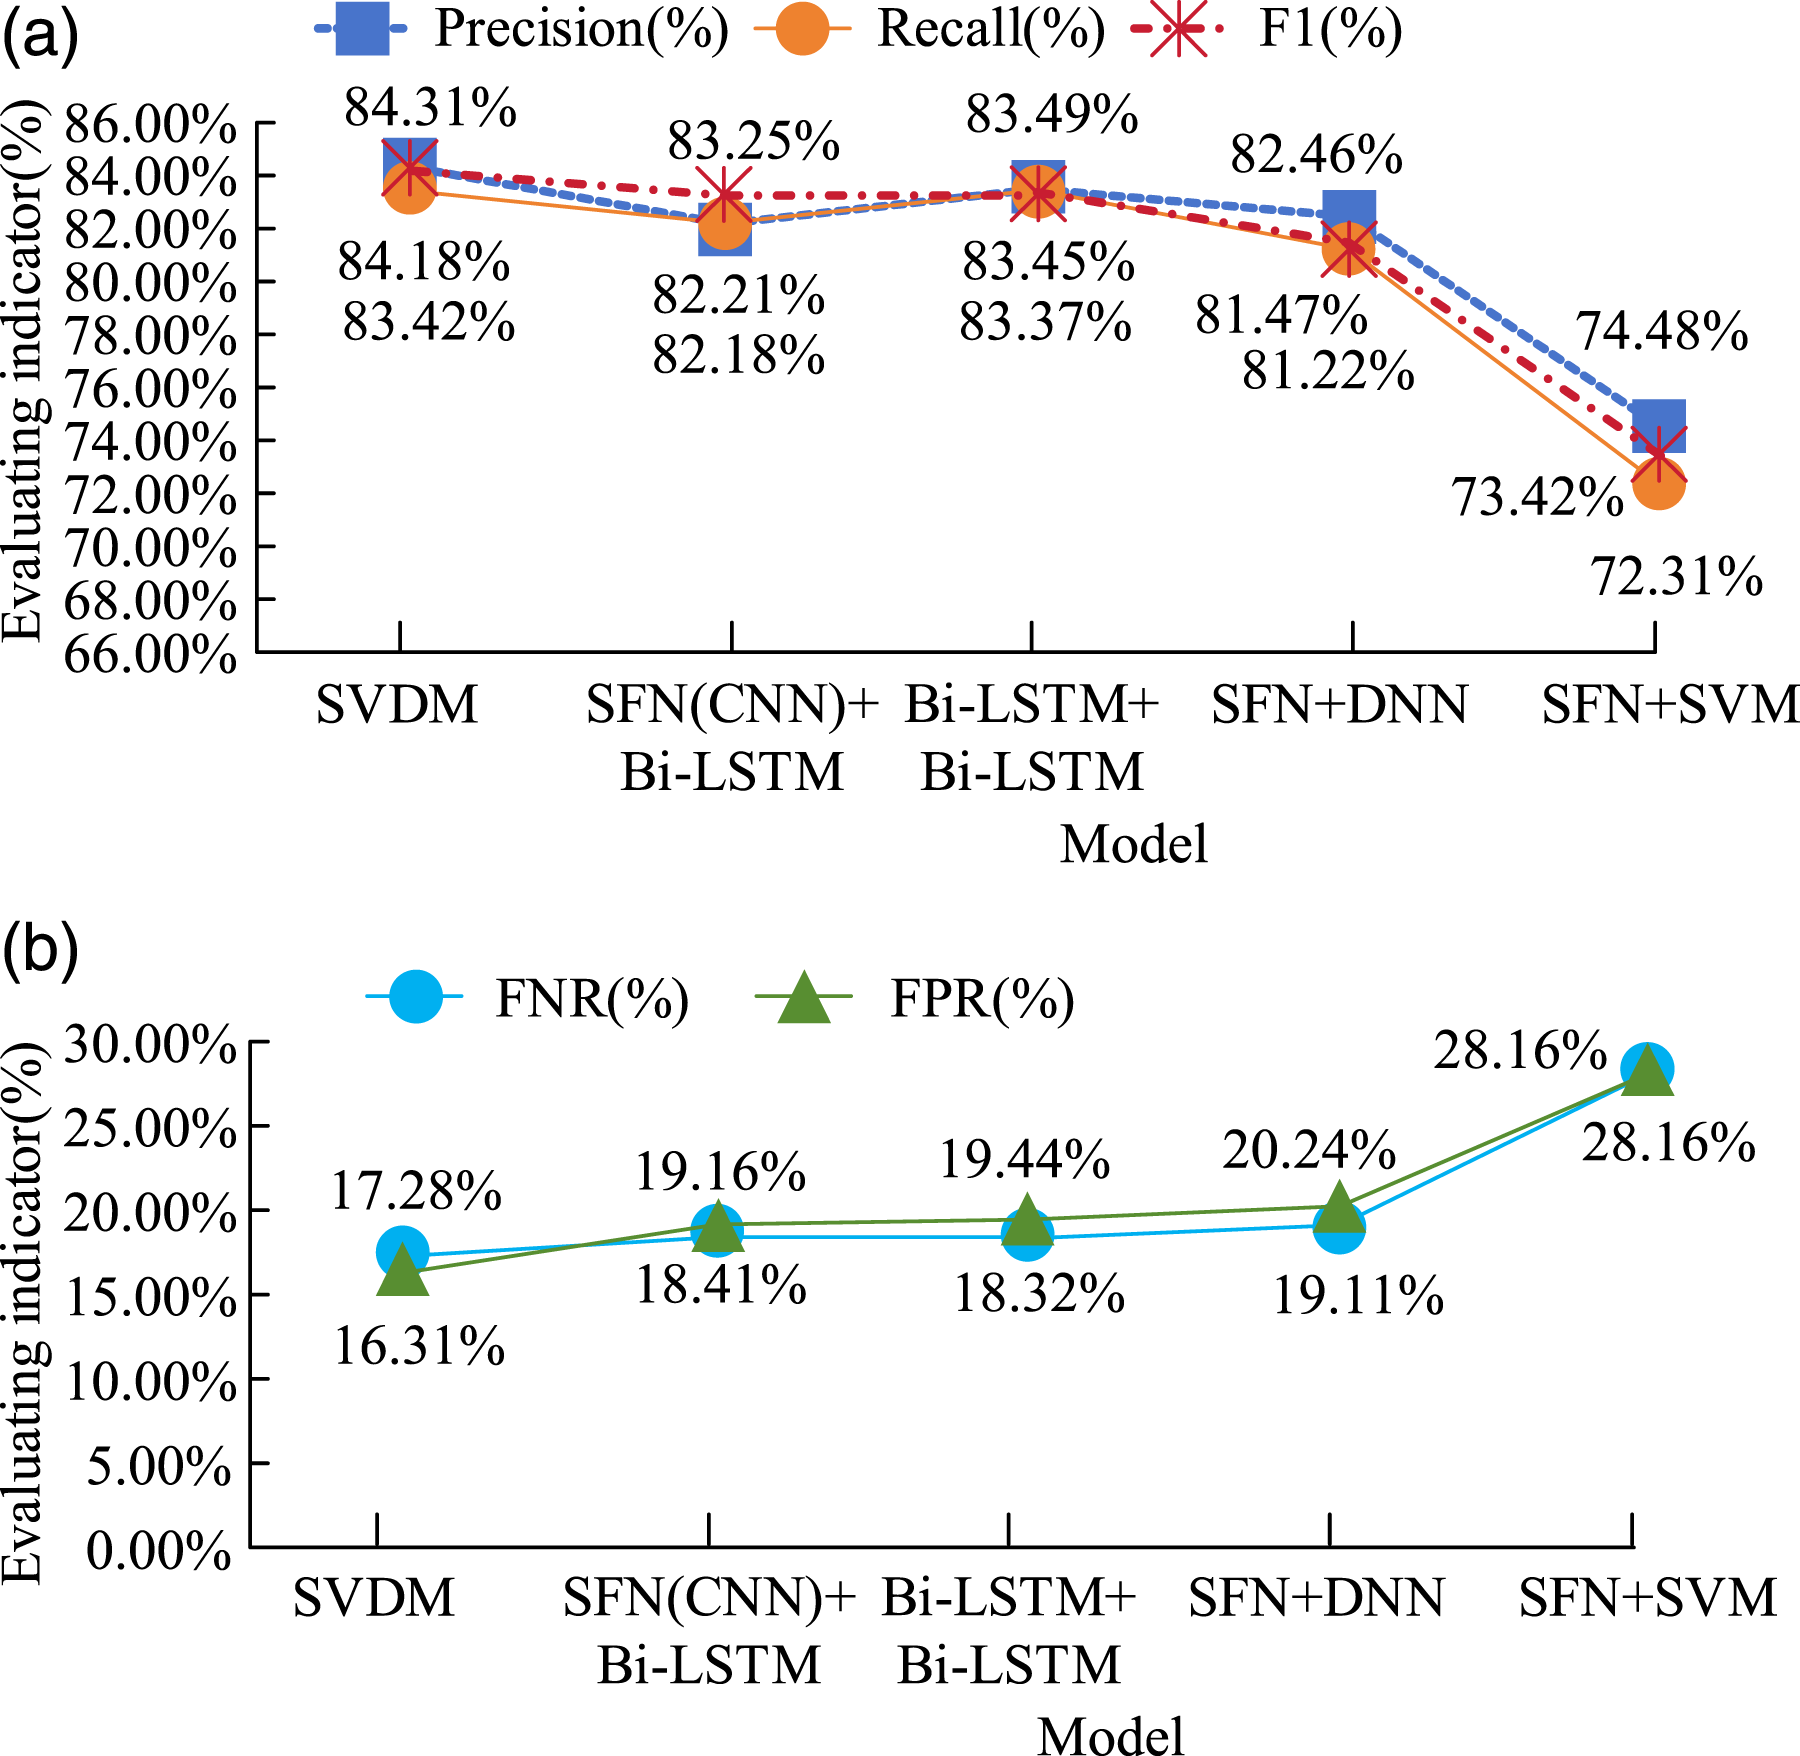
Combination Types of Control Variables and Structure of Feature Extraction Model
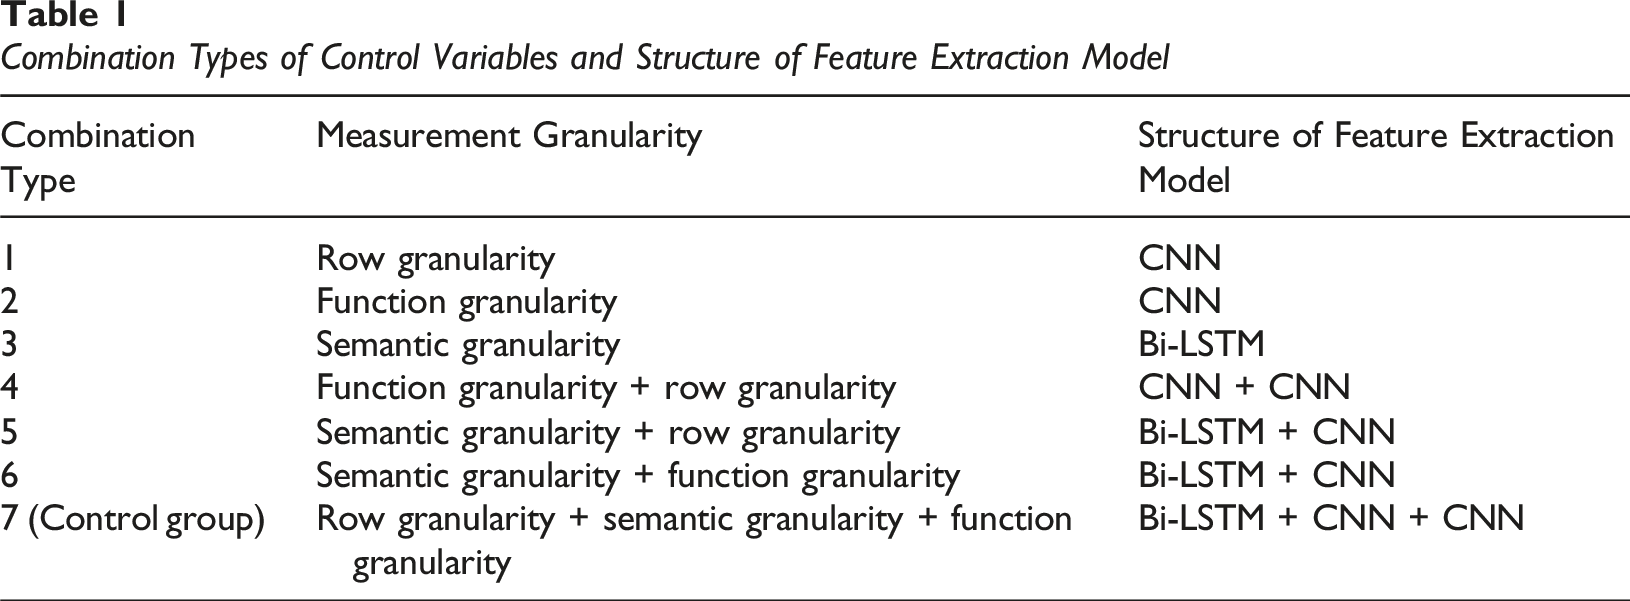
From Table 1, the feature extraction model structures corresponding to the seven combination types were different. The datasets used were subsets of the mixed dataset Multi-SET to govern different granularity code metrics. Afterward, the combination types 1–6 are used as the experimental group. The combination 7 is used as the control group for testing. The results of precision, recall, and F1 score are shown in Figure 8. Comparison Results of Precision, Recall, and F1 Indicators for Experimental Combinations 1–7. (a) Comparison of detection results between experimental groups 1–4. (b) Comparison of detection results between experimental groups 5–7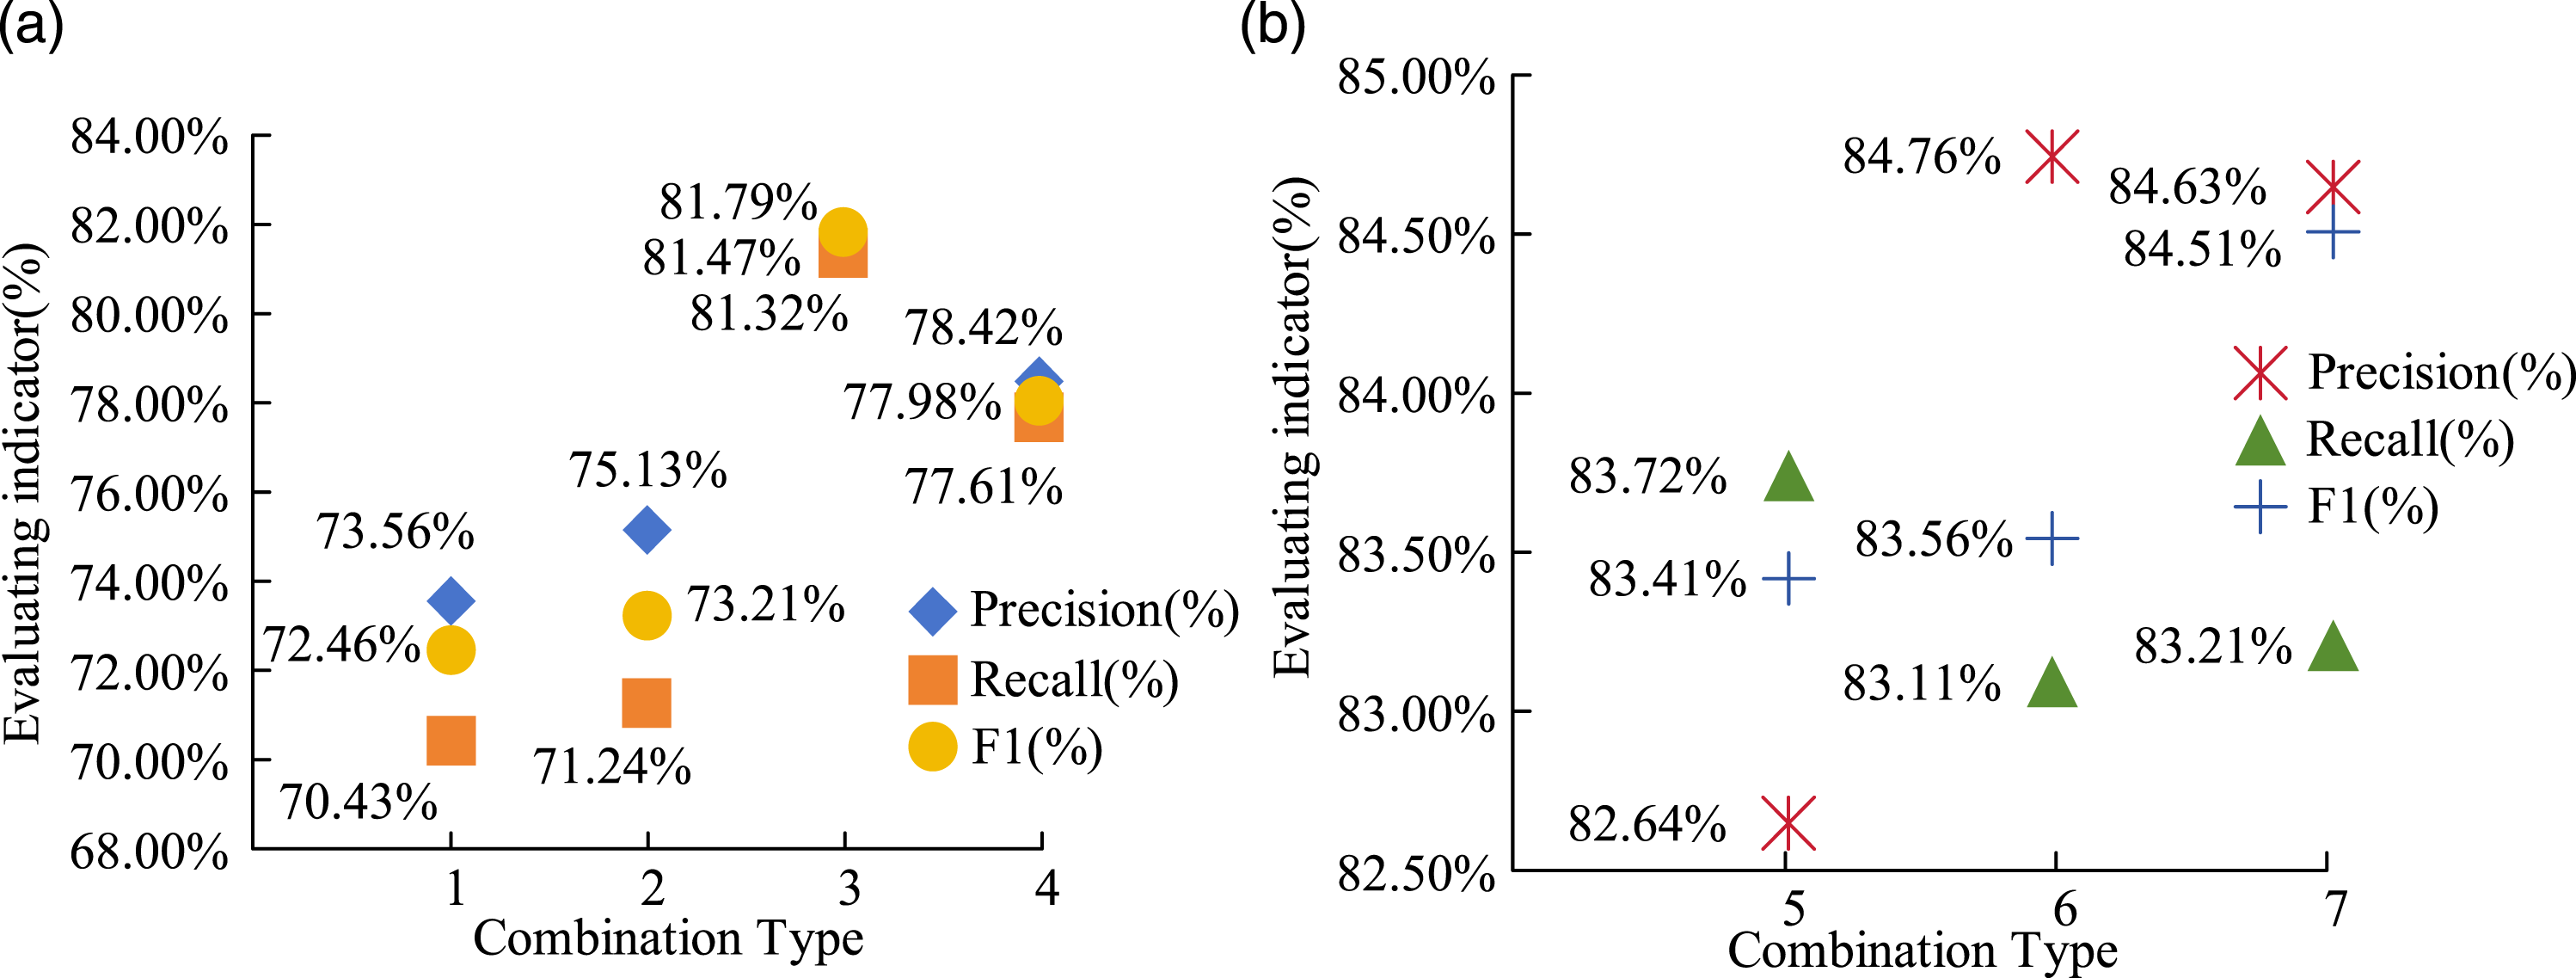
From Figure 8(a), the precision, recall, and F1 indicators of experimental group 3 were 81.47%, 81.32%, and 81.79%, respectively, and the performance indicators of experimental groups 1–4 were all below 82%. In Figure 8(b), the precision, recall, and F1 score of combination type 6 were the best in the experimental group, with values of 84.76%, 83.11%, and 83.56%, respectively, while the precision, recall, and F1 score of control combination 7 were 84.63%, 83.21%, and 84.51%, respectively, which was much higher than all experimental combination types. Afterward, the FPR and FNR of the combination type are shown in Figure 9. Comparison of FNR and FPR Detection Results for Experimental Combinations 1–7. (a) FNR detection results of experimental combinations 1–7. (b) FPR detection results of experimental combinations 1–7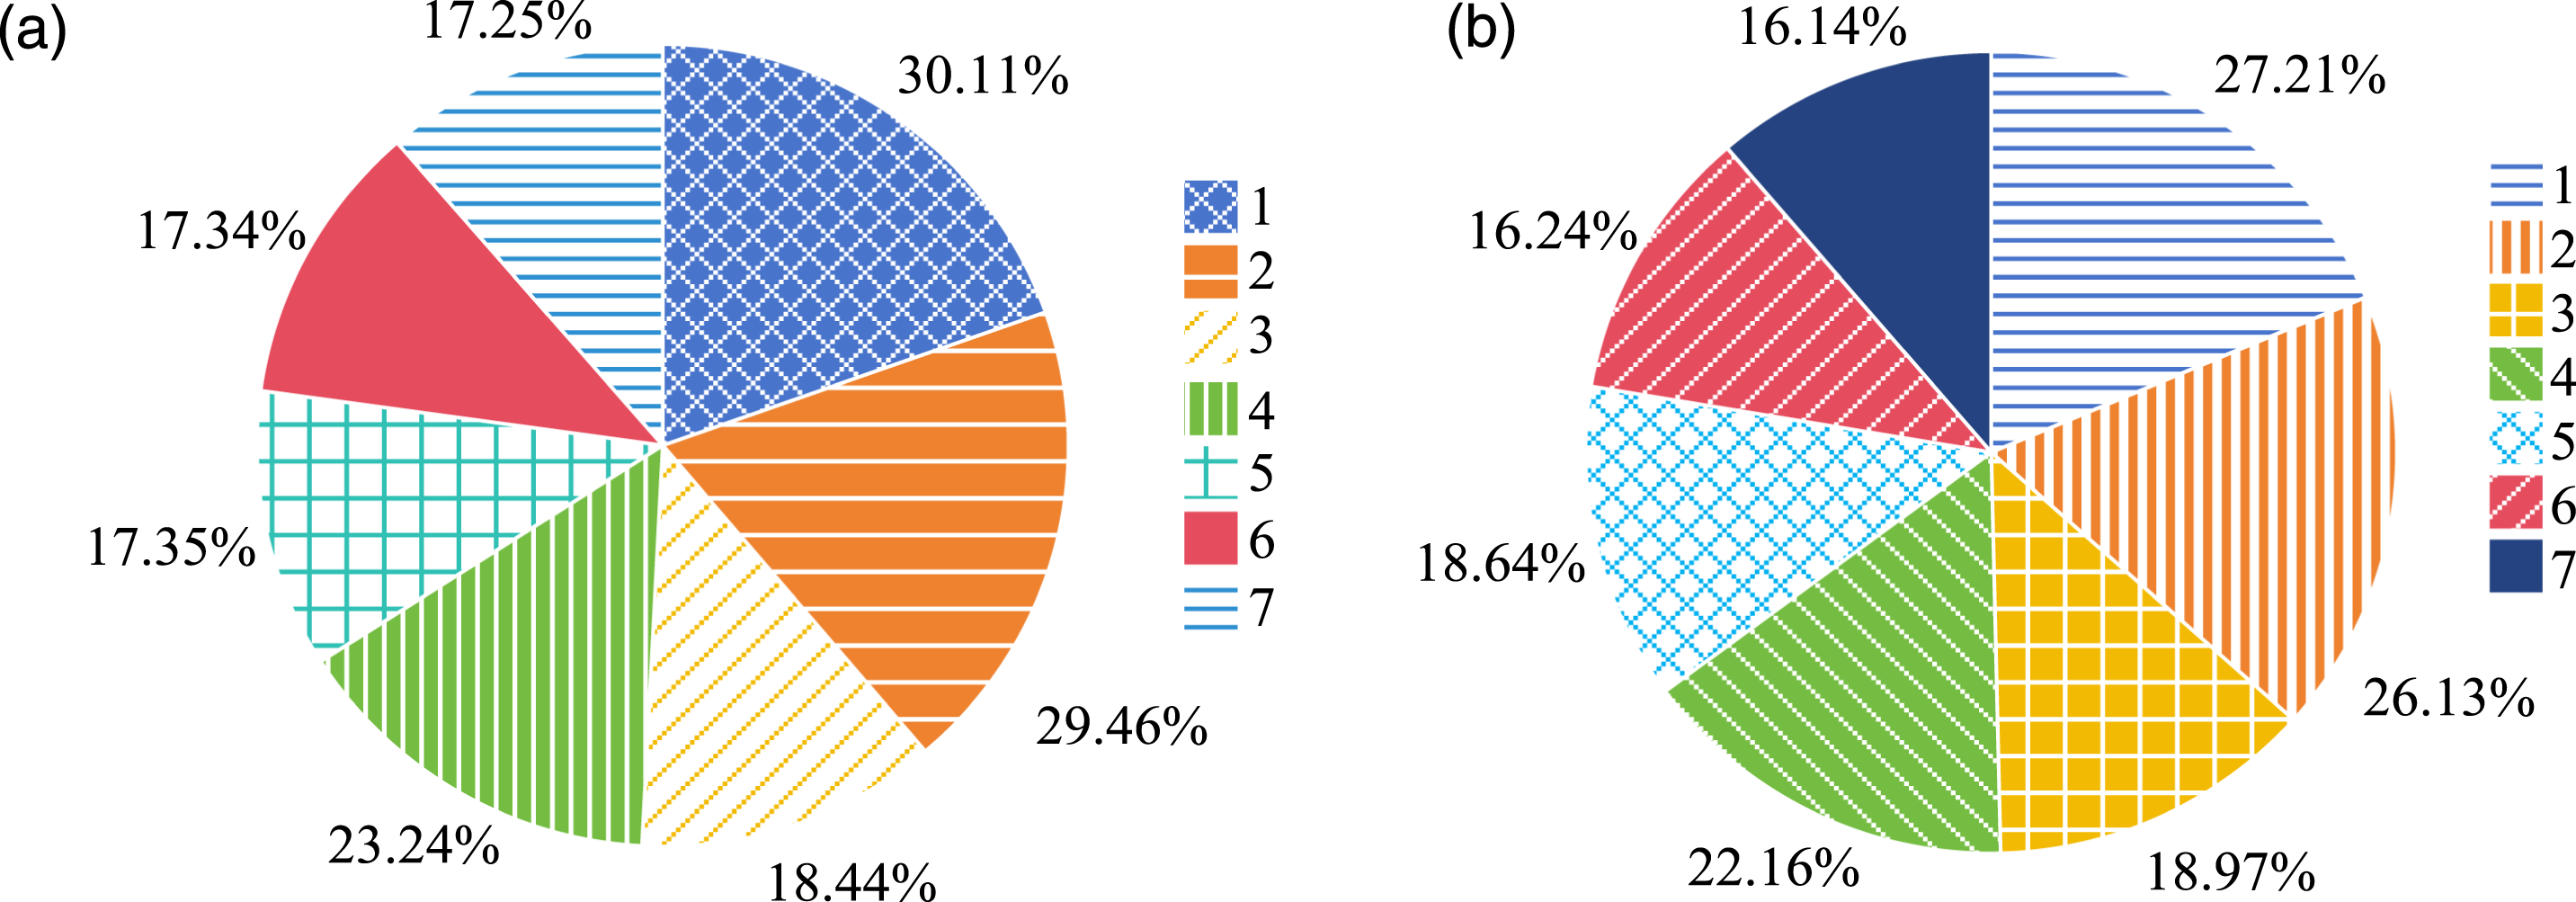
From Figure 9, the combination 6 had the lowest FPR and FNR in the experimental group, with 17.34% and 16.24%, respectively. The FPR and FNR of combination type 7 in the control group were 17.25% and 16.14%, respectively, which were below the experimental group. Based on the performance indicators of the SVDM vulnerability detection model and the combined feature extraction model, it was found that the highest performance indicators of the former were 84.31%, 83.42%, and 84.18%, while the best results of the latter were 84.76%, 83.11%, and 83.56%. Through overall comparison, it is demonstrated that the combination of code metrics can better improve detection results.
Test Results of the Three Models

In Table 2, the detection effect score, detection time score, and detection consumption score of the optimized model were superior to those of the two comparison models. When the number of tests was 9, all the scores were the highest, among which the average test effect score, detection time score, and detection consumption score were 97, 90, and 93 points, respectively. The results show that the optimized vulnerability detection model has superior performance and can be applied in practice.
Conclusion
This paper presented a novel software vulnerability detection model SVDM using RFID target recognition and FPGA capabilities for advanced threat analysis. The proposed approach integrated code metric analysis at multiple granularity levels with deep learning feature extraction to achieve robust detection across vulnerability types. Extensive evaluations validated the advantages of SVDM over existing methods, with precision and recall exceeding 84% on the CWE dataset. The work here provides both engineering and scientific contributions: (i) Technical advancement of RFID and FPGA modules for security use cases; (ii) novel multi-scale software analysis fusion for improved accuracy; (iii) adaptable model supporting generalizability across domains. The SVDM vulnerability detection model, through theoretical and experimental simulation, can efficiently and accurately evaluate the performance of vulnerability types. In practical working environments and software development applications, it verifies and analyzes external noise interference, channel transmission, and label recognition to improve the compatibility of real software and the reliability of security protection. However, the vulnerability detection model proposed in this study only considers the experimental data of vulnerability types, which is insufficient in universality and transparency. Therefore, while showing the prospects, this study can be expanded in several aspects in the future. More vulnerability data types should be tested, and additional code metrics incorporated to boost coverage. Secondly, further benchmarking on adversarial attack simulations and explainability analysis would aid model transparency. Finally, the detection framework can be customized for specific programming languages, systems, and platforms to maximize real-world impact on security practices.