
Abstract
The generation and turbulent transport of temporal equivalence ratio fluctuations in a swirl combustor are experimentally investigated and compared to a one-dimensional transport model. These fluctuations are generated by acoustic perturbations at the fuel injector and play a crucial role in the feedback loop leading to thermoacoustic instabilities. The focus of this investigation lies on the interplay between fuel fluctuations and coherent vortical structures that are both affected by the acoustic forcing. To this end, optical diagnostics are applied inside the mixing duct and in the combustion chamber, housing a turbulent swirl flame. The flame was acoustically perturbed to obtain phase-averaged spatially resolved flow and equivalence ratio fluctuations, which allow the determination of flux-based local and global mixing transfer functions. Measurements show that the mode-conversion model that predicts the generation of equivalence ratio fluctuations at the injector holds for linear acoustic forcing amplitudes, but it fails for non-linear amplitudes. The global (radially integrated) transport of fuel fluctuations from the injector to the flame is reasonably well approximated by a one-dimensional transport model with an effective diffusivity that accounts for turbulent diffusion and dispersion. This approach however, fails to recover critical details of the mixing transfer function, which is caused by non-local interaction of flow and fuel fluctuations. This effect becomes even more pronounced for non-linear forcing amplitudes where strong coherent fluctuations induce a non-trivial frequency dependence of the mixing process. The mechanisms resolved in this study suggest that non-local interference of fuel fluctuations and coherent flow fluctuations is significant for the transport of global equivalence ratio fluctuations at linear acoustic amplitudes and crucial for non-linear amplitudes. To improve future predictions and facilitate a satisfactory modelling, a non-local, two-dimensional approach is necessary.
Introduction
To fulfill emission regulations for nitrogen oxides (NOx) and other pollutants future gas turbines are envisioned to operate at lean premixed combustion. The mixture of high amounts of air with fuel upstream of the flame results in a lean uniform fuel-air mixture, yielding a reduction of NOx formation due to fewer local high temperature zones in comparison to fuel-rich diffusion flames.
However, lean premixed combustion comes with a technical challenge: its high susceptibility to thermoacoustic instabilities. These self-excited instabilities occur when a positive feedback cycle between unsteady heat release rate and pressure fluctuations is established. The resulting pressure oscillations can develop high limit-cycle amplitudes. State of the art gas turbines produce static pressures of 10–50 bars within their combustion chambers. Oscillation amplitudes may reach 1–2% of the static pressure which cause severe structural damage and higher emissions and a far lower efficiency1,2. Overall, the danger of thermoacoustic instabilities substantially limits the operational range of premixed combustion engines.
To comprehend the mechanisms underlying thermoacoustic instabilities, the positive feedback loop between pressure and heat release rate needs to be understood. If these two oscillations are in phase, energy is transferred from the flame to the acoustic field; if the amount of added energy exceeds the acoustic energy dissipation, the system becomes unstable. This self-excitation is largely determined by the flame response to acoustic perturbations which is driven by different coupling mechanisms. Kinematic effects like wrinkling and the movement of the flame surface are reasons for acoustically induced oscillations of the heat release rate especially in laminar flames 3 . For turbulent propagation stabilized flames, the major excitation mechanisms originate from velocity perturbations and equivalence ratio fluctuations,2,4,5 the latter of which can only exist under the presence of mixture inhomogeneities. For auto-ignition stabilized flames, which are not considered in this work, other mechanisms come into place.
Perfectly premixed flames have a homogeneous mixture of air and fuel and thus do not trigger equivalence ratio fluctuations. At these conditions, thermoacoustic instabilities are driven by coherent velocity fluctuations that induce global heat release rate fluctuations in the flame6–9. These velocity fluctuations are a result of acoustic velocity fluctuations that excite coherent structures in the shear layers10–13 and swirl fluctuations at the swirler14–17.
However, in industrial gas turbine combustors air and fuel are usually not perfectly premixed before reaching the flame, and the mixture fraction is therefore not constant. A homogeneous unburned mixture would require a relatively long mixing distance, which cannot be realized for safety reasons due to possible flashback or autoignition. Additionally, flames with a certain degree of mixture fraction inhomogeneity feature a broader operational range. This type of flame is usually referred to as partially premixed or, in the application-oriented literature, as technically premixed 18 .
In case of partially premixed flames, equivalence ratio fluctuations play an important role in triggering thermoacoustic instabilities. Equivalence ratio fluctuations originate from pressure and velocity oscillations at the location of the fuel injection19,20. These perturbations are transported to the flame, subjected to diffusion and dispersion21,22, and may generate large oscillations in the global heat release rate. This is in particular the case for lean combustion, where flame properties such as the burning velocity are strongly susceptible to perturbations in the equivalence ratio 19 . Moreover, strong temporal variations in the mixture fraction may lead to a dynamical displacement of the flame anchoring position, which then results in the generation of unsteady heat release rate 23 .
To understand and model the thermoacoustic stability of turbulent partially premixed flames, the simultaneous measurements of velocity and equivalence ratio perturbations are required 24 . In a number of studies, temporal equivalence ratio fluctuations during unstable combustion were measured using different laser absorption techniques, such as Direct Absorption Spectroscopy (DAS)25,26 and Tunable Diode Laser Absorption Spectroscopy (TDLAS)25–27. The results confirmed that temporal equivalence ratio fluctuations are directly linked to heat release rate fluctuations. In another experimental study, the response of the flame heat release rate to perturbations of equivalence ratios was investigated 28 . The fuel flow was modulated using a siren. Simultaneous measurements of the fuel mass fraction at the injector using infrared absorption spectroscopy and of the flame response using CH* chemiluminescence were applied. The study confirmed that equivalence ratio fluctuations are convected to the flame at the bulk flow velocity. In a follow-up study, the same group investigated the response of a partially premixed flame to both velocity and equivalence ratio fluctuations based on chemiluminescence measurements 29 . They proposed a linear reconstruction technique to separate both effects, but were not able to validate their approach since direct measurements of heat release rate fluctuations in a partially premixed flame were not available. Hermeth et al. conducted LES of a partially and a fully premixed flame showing that even for spatially well-premixed flames, temporal equivalence ratio fluctuations may not even out sufficiently and may dominate the flame response to acoustic forcing. 30 In another study, it was observed that, depending on the phase lag between velocity and equivalence ratio fluctuations, non-linear effects such as a saturation of the flame response at high amplitudes may occur 31 . This is a determining factor for the limit cycle pressure amplitude. Stoehr et al. experimentally studied the combined effects of velocity and equivalence ratio perturbations on thermoacoustic flame oscillations 32 . They found that a periodic variation of the reactant mass flux rates and heat release in the flame indicated an additional convective delay, which caused local flame extinction. The results showed that the interaction of velocity and equivalence ratio fluctuations has a significant impact on the thermoacoustic response of turbulent swirl flames. This interaction depends mainly on the time delay between the two. In a recent study, Bluemner et al. conducted TDLAS and PIV measurements in the mixing section of a swirl stabilized combustor with the focus on the transport and mixing of temporal equivalence ratio fluctuations generated by linear acoustic perturbations 33 . They measured a non-trivial frequency dependence of the mixing transfer functions, which they related to the coherent production of equivalence ratio fluctuations due to the excitation of coherent structures. This demonstrates the importance of the interaction of flow and equivalence ratio fluctuations even for linear acoustic forcing amplitudes, which is crucial for the prediction of flame stability.
In terms of thermoacoustic modeling, a key challenge is the prediction of the equivalence ratio fluctuations that are generated at the fuel injector and the modeling of their convection and diffusion in the mixing section between the injector and the flame. Regarding the generation of equivalence ratio fluctuations, Peracchio and Proscia 34 introduced a time-domain model that assumes instant mixing of fuel and air and stiff fuel injection. It describes a mode-conversion process where the generated equivalence ratio fluctuation amplitudes are equal to the air fluctuations at the injector, with a phase difference of half a period. Regarding the transport of equivalence ratio fluctuations Sattelmeyer et al. 35 proposed a model to account for dispersive effects by using convective delay times approximated from the mean velocity field in the mixing section. A similar approach was proposed by Xia et al. 36 and Giusti et al. 37 to model the dispersion of entropy waves based on a convection equation, neglecting the impact of diffusion. The authors argue that dispersion due to the non-uniform flow outweighs the impact of turbulent diffusion. A different approach is pursued by Wassmer et al. 38 who derive a model from the 1D convection-diffusion equation. They show a good match with measured mixing transfer functions, however they noted that potential dispersive effects may have been implicitly accounted for by a higher diffusivity. With the attempt to model the simultaneous effect of mean shear dispersion and turbulent diffusion, Kaiser et al. developed a framework based on the two-dimensional linearized transport equation equipped with an eddy viscosity model39,40. Comparison with DNS data of the mixing process in a turbulent channel flow reveal excellent agreement. The model could further qualitatively replicate the non-trivial frequency dependence of the linear mixing transfer function measured by Blümner et al. 33 .
This work builds on the recent analytic and experimental findings and tends to reveal the complex interplay between the equivalence ratio fluctuations and hydrodynamic flow structures within a turbulent swirl combustor by means of quantitative measurements. Particular emphasis is placed on the role of vortical structures in the convection, dispersion and diffusion of equivalence ratio fluctuations at linear and non-linear acoustic forcing amplitudes. These processes are quantified through local and global mixing transfer functions that are determined by combining PIV,
In the following sections, the experimental setup, data acquisition for all of the measurements, and the methodology for post processing will be explained. Thereafter, a brief summary of current models for the generation and transport of equivalence ratio fluctuations is given that allow for a comparison of the empirical findings. The results will be analyzed with respect to the baseline configuration, linear transfer function response and non-liner mixing transfer functions.
Experimental methods
Combustor test rig
Measurements were conducted in an atmospheric combustor test rig, which is shown in Figure 1. The combustor was operated with natural gas. Four 18-inch woofers (B&C 18PS76, with a maximum electrical power of 600 W per speaker) with a variable upstream impedance of the combustor were used to realize high forcing amplitudes. To realize the latter, the length of the tube between the speakers and the burner inlet was controlled by a computer traversing system. This mechanism allows for the forcing of the woofers to be used in resonance over the desired frequency range. The facility can be operated both at perfectly premixed mode, where fuel is injected far upstream into the upstream plenum, and in partially (technically) premixed mode where fuel is injected into the swirler.
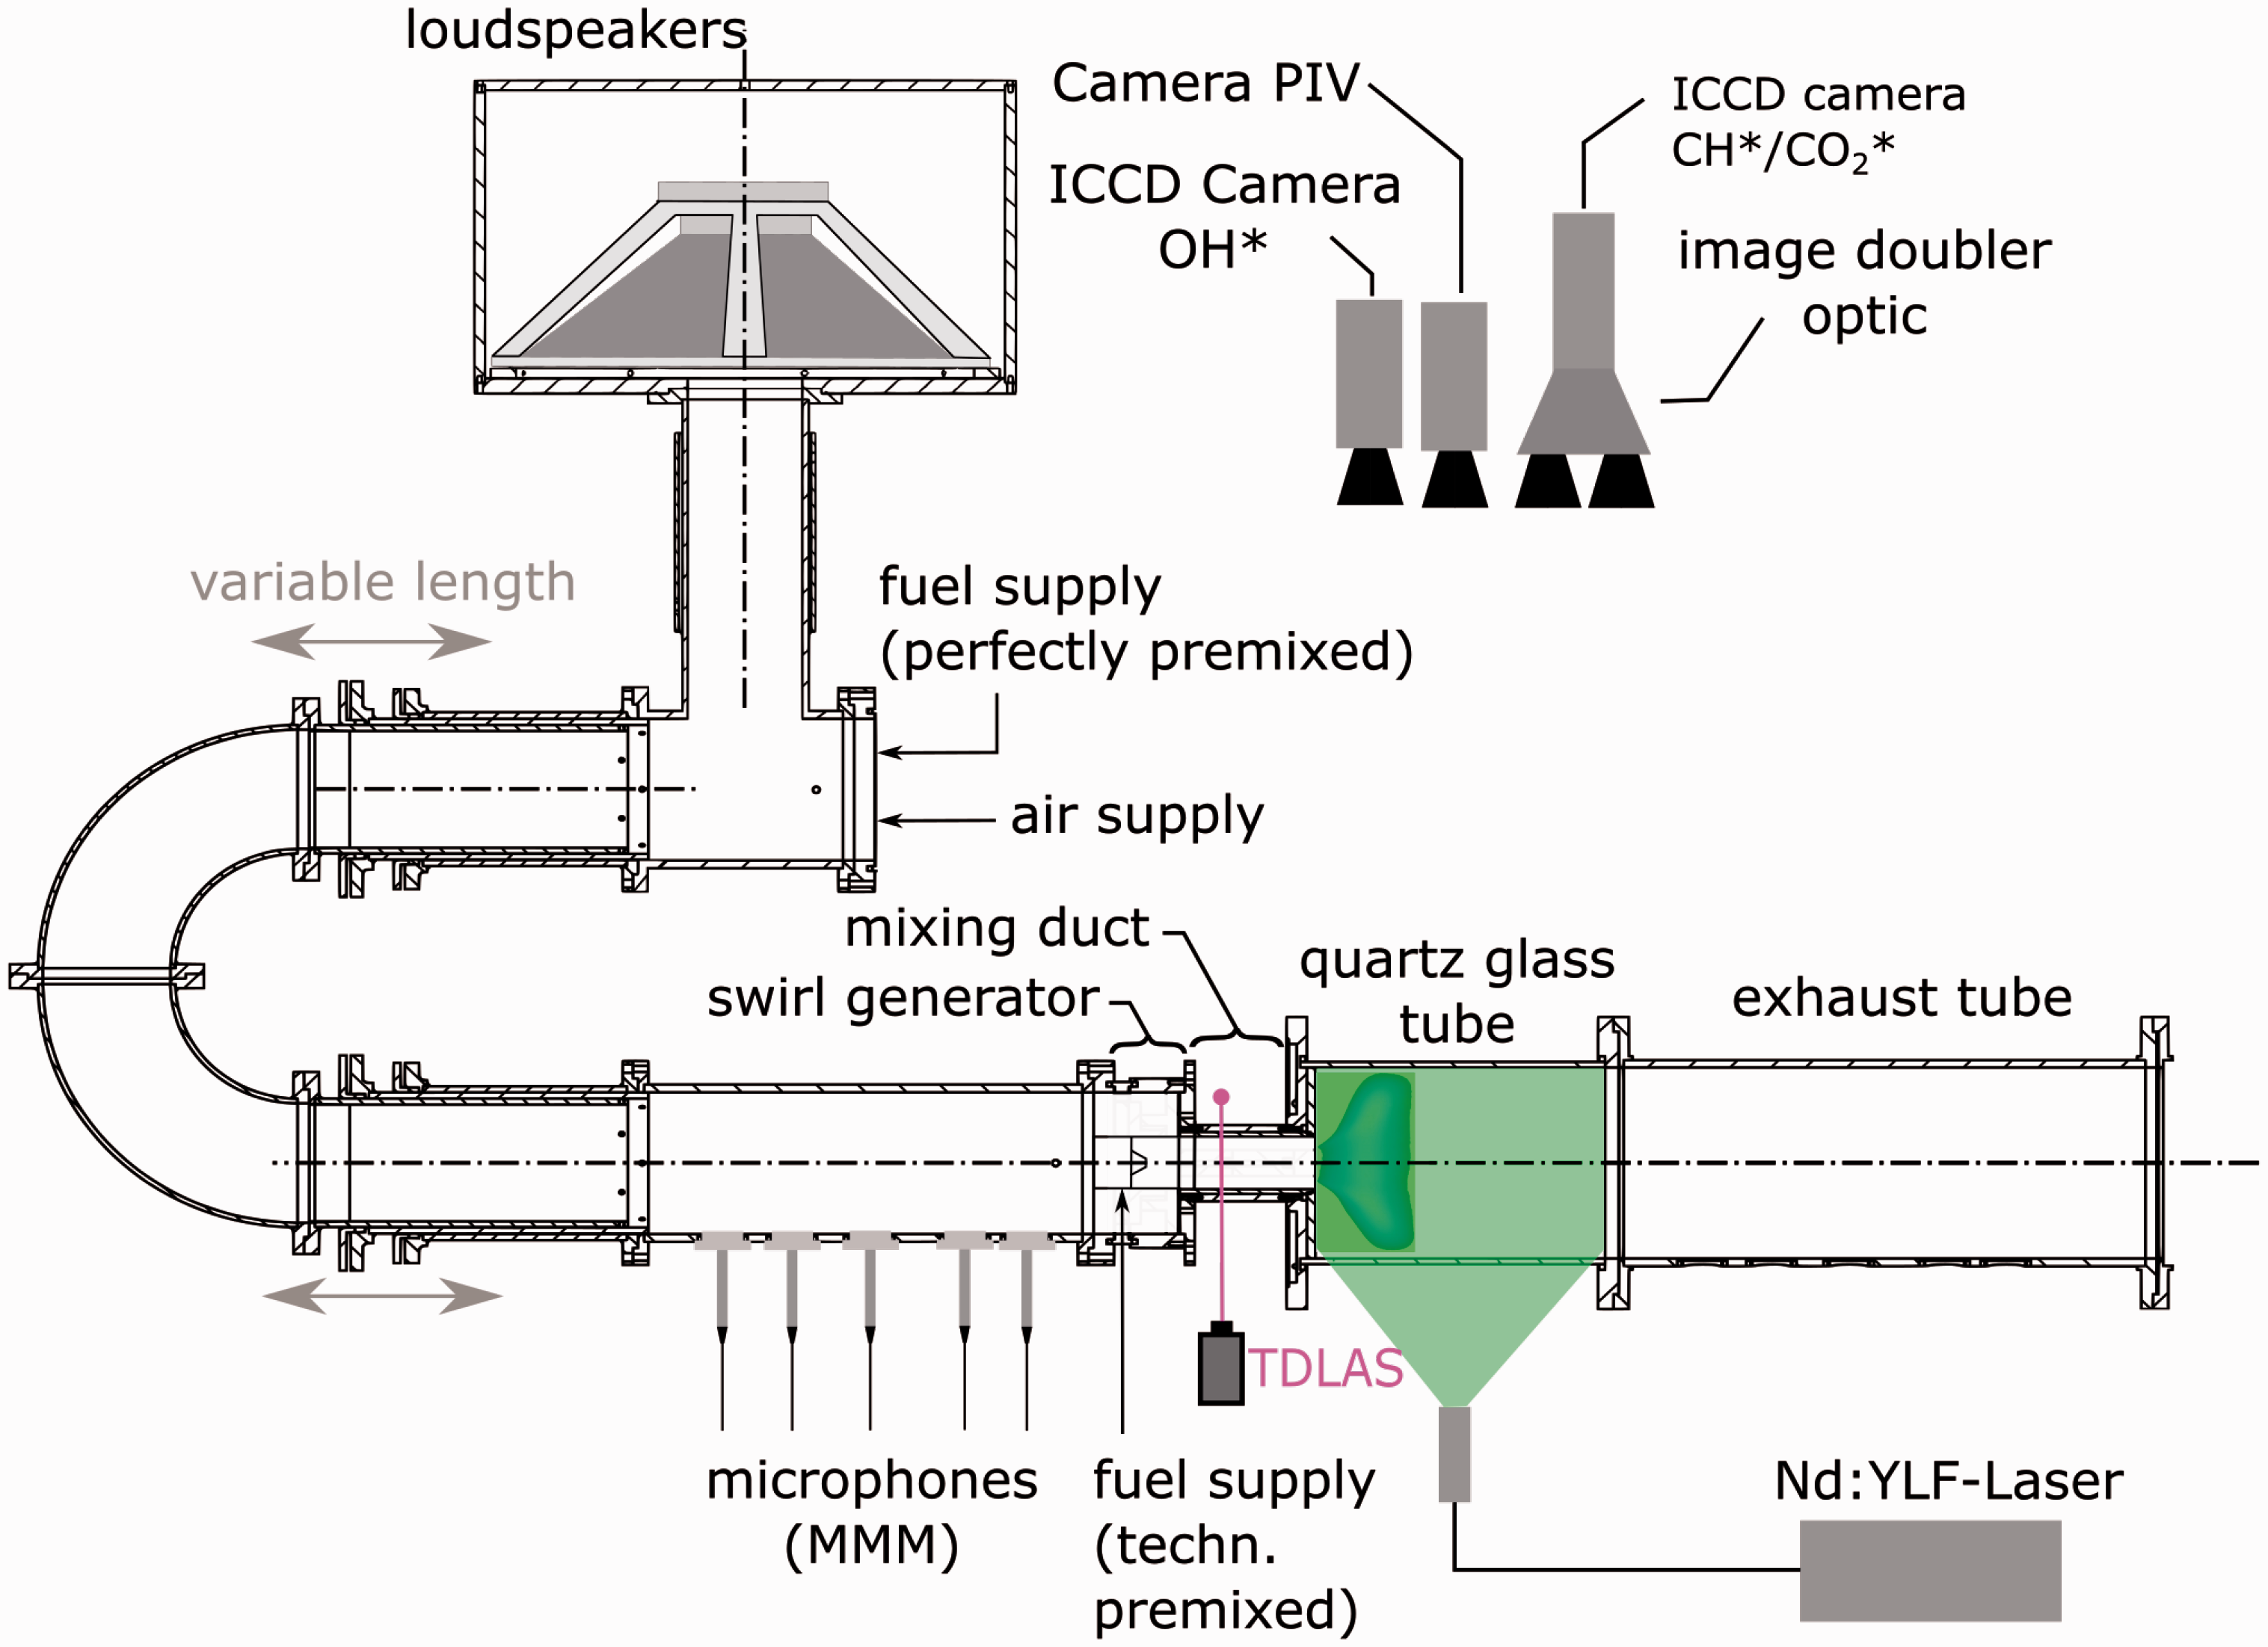
Sketch of the atmospheric combustor test rig.
Gas turbine model combustor
The generic swirl combustor used in this measurement series generates swirl by injecting fluid tangentially into a mixing tube that terminates at the combustion chamber inlet. A technical drawing of the swirler is given in Figure 2. The burner was initially designed for hydrogen application41,42. To avoid flashback, a central orifice was constructed, allowing for a jet that passes through the center, which can be adjusted by mounting different insets into the central opening of the swirler. The combustor was operated at partially premixed mode, where the fuel was injected through 16 circumferential, equally spaced holes (diameter
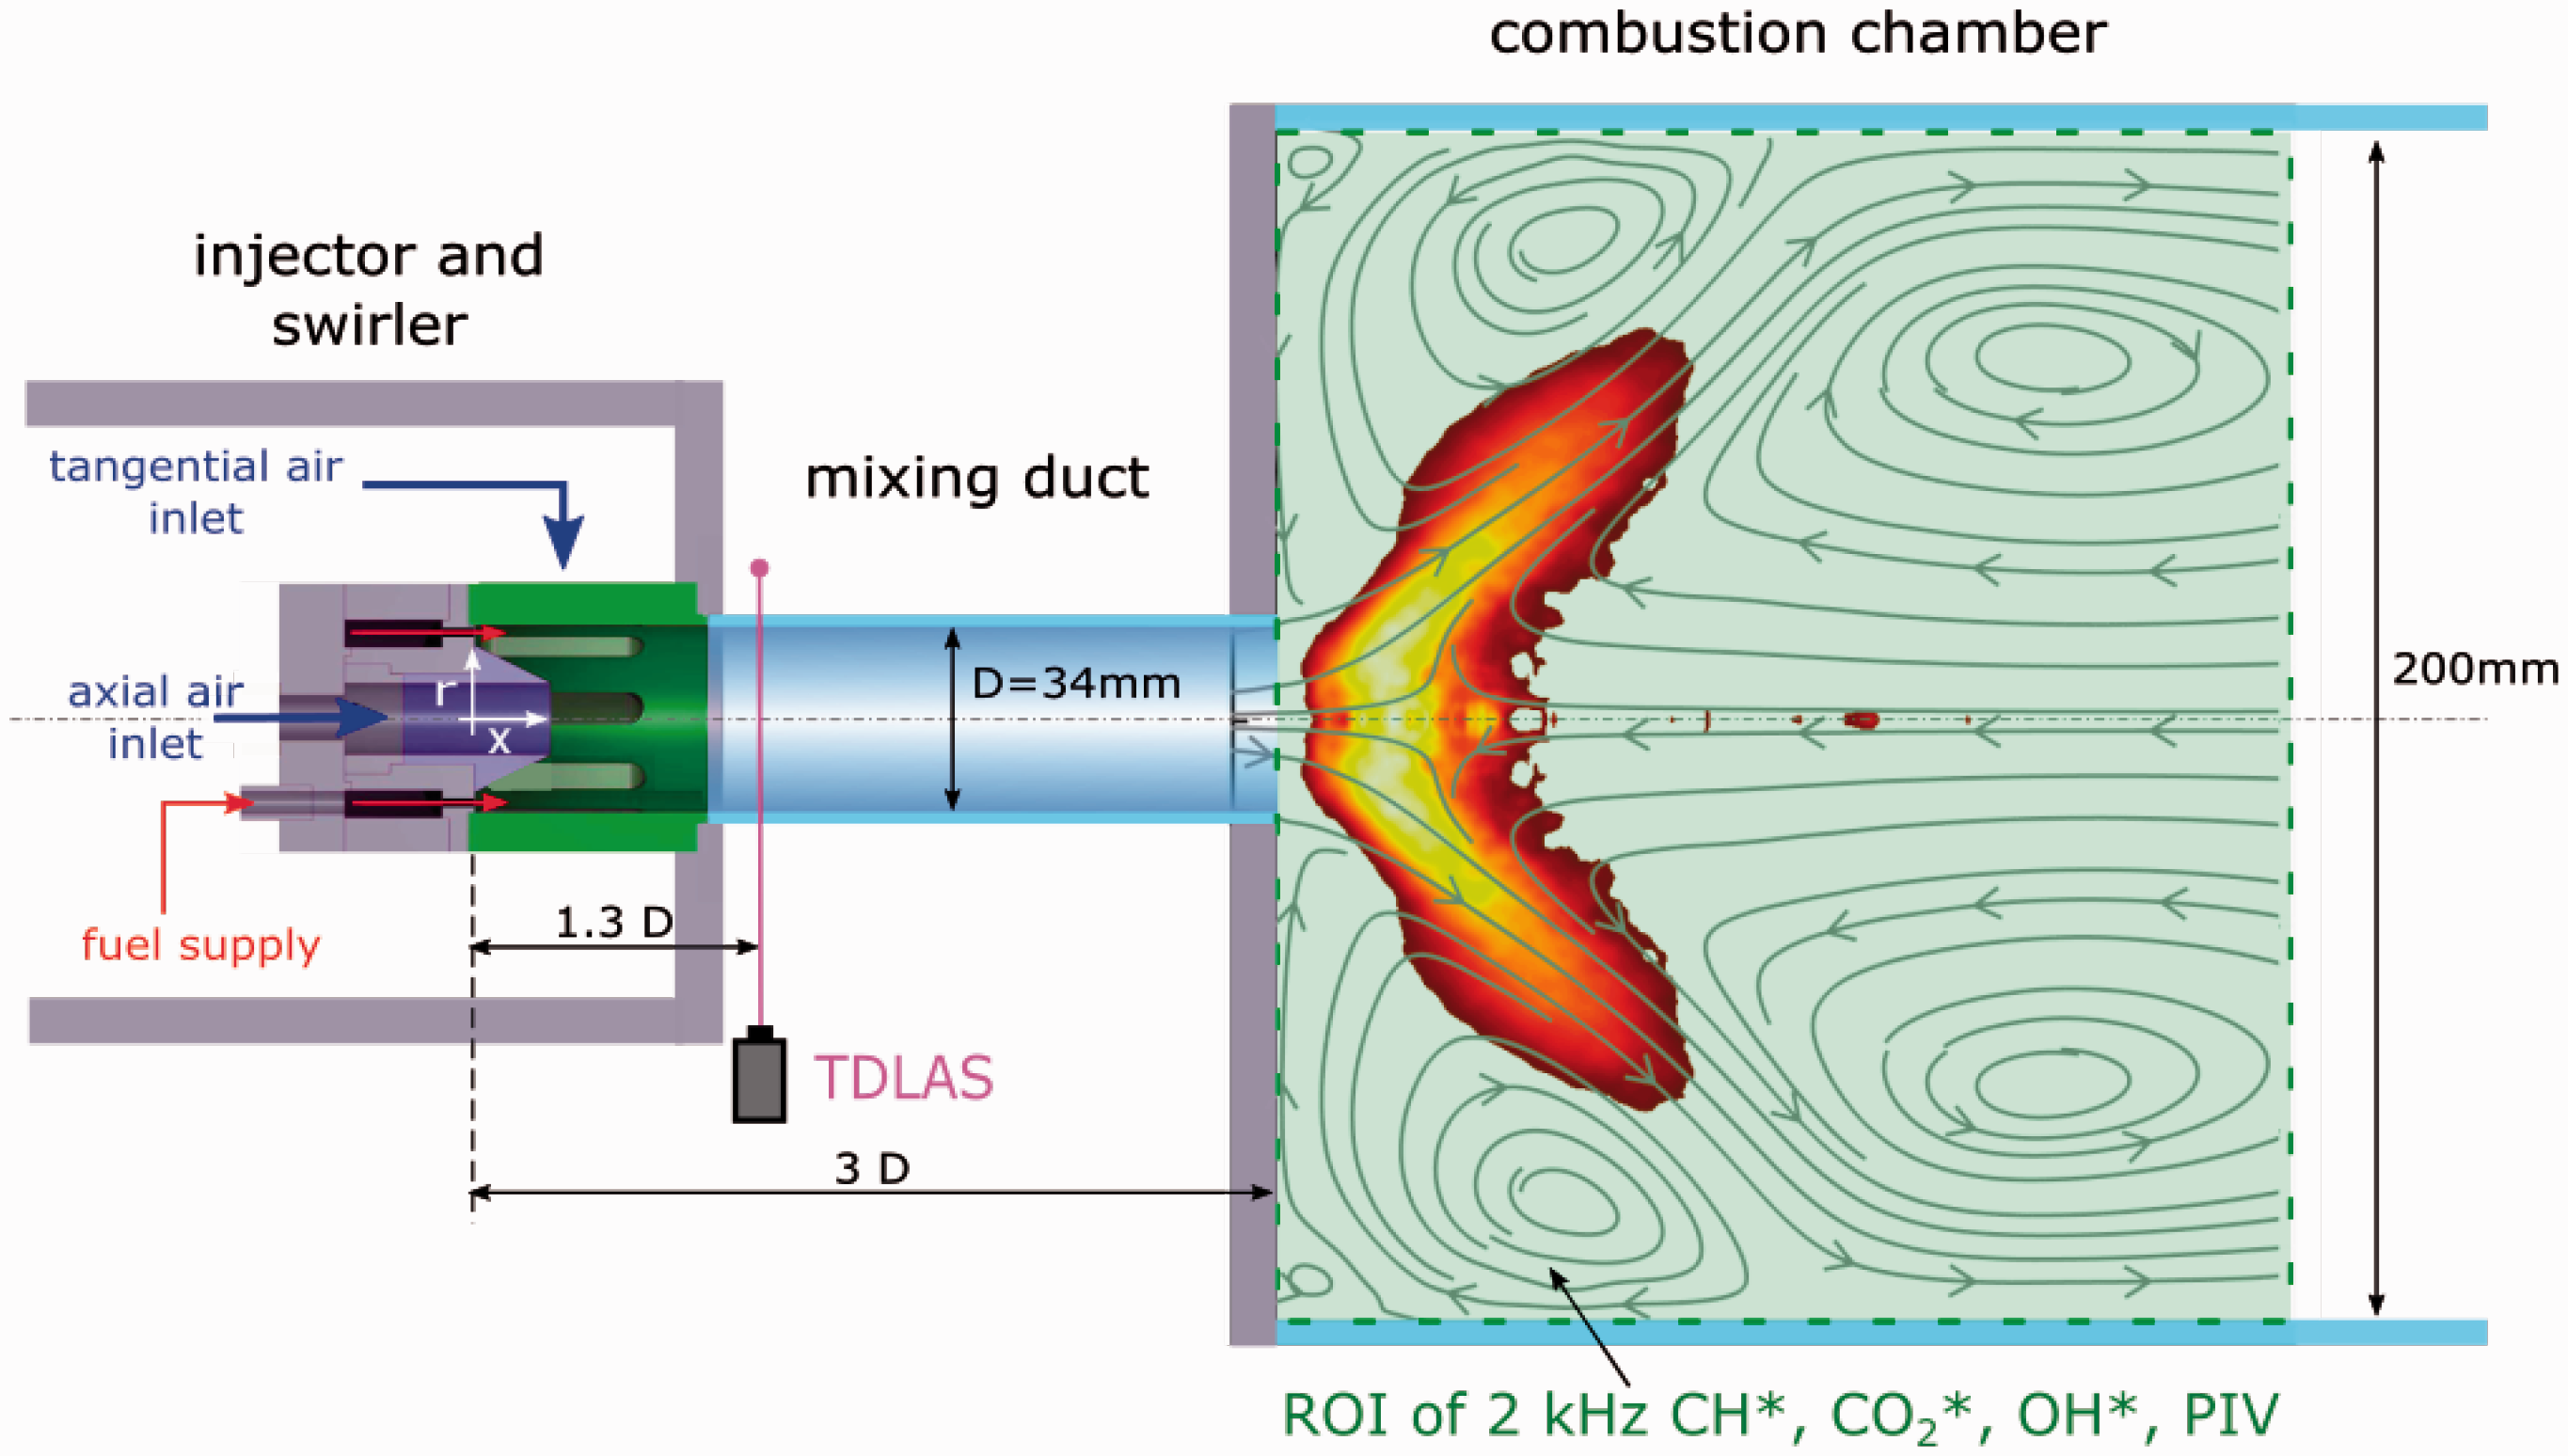
Detailed measurement setup with combustor, swirler and mixing section. The coordinate system is displayed at the injector. The different measurement methods TDLAS, PIV and
For all experiments considered in this work, the swirler was operated with a central orifice opening of 8.8 mm. The two fluids are united in the mixing tube, ranging from the swirler to the combustion chamber inlet with a diameter of D = 34 mm and a length of 3D. The area jump to the combustion chamber with a diameter of D = 200 mm establishes a confined swirling jet in the combustion chamber. Since the swirl number in that jet is sufficiently large, a hydrodynamic phenomenon known as vortex breakdown occurs. As a result, a central recirculation zone (CRZ) is generated which induces an inner shear layer between the jet and the CRZ. Furthermore, an outer recirculation zone is induced due to the area jump, which leads to a stabilization of the flame in the resulting shear layers (see streamlines in Figure 2). The combustion chamber, with a length of L = 300 mm and a diameter of D = 200 mm, is made from silica glass in order to provide optical access for chemiluminescence and laser-based measurements. The water-cooled exhaust tube is 700 mm long and was equipped with an orifice at the downstream end. With this orifice the combustor is thermoacoustically stable over a wide operational range as the orifice increases the acoustic dissipation of the chamber mode, which has a velocity anti-node at this location.
Multiple microphone method (MMM)
To reconstruct the plane wave acoustic velocities upstream and downstream of the combustor, the multi-microphone-method was applied 43 . The method is implemented using two microphone arrays (five water-cooled microphones each), located on either side of the combustor. The MMM allows for the measurement of the acoustic flame transfer function as well as a quantification of the acoustic perturbation amplitude. The MMM measurement error was calculated to be well below 5% for all results, based on a comparison of the reconstructed acoustic field with the measured data.
Spatially resolved equivalence ratio measurements
Over the last decades various studies have shown that there exists a fuel specific correlation between the equivalence ratio and different ratios of chemiluminescence emissions of species such as: C2*/CH*,
44
OH*/CH*45–47 and CH*/CO2.
48
The chemiluminescence intensity of a single species is linearly dependent on the mass flow of the fuel-air mixture and depends exponentially on the equivalence ratio
49
. Therefore, a ratio of two chemiluminescence emission signals is a function of the equivalence ratio only, which can serve as an accurate measure of the local equivalence ratio in premixed swirl flames46,47,50. In many studies, the ratio of
In this study,
Note that the technique of determining the local equivalence ratio indirectly from the chemiluminescence signal comes with an uncertainty of the spatial location of the measurement. This is because the chemiluminescence signal is emitted in the flame zone where the fuel is already burned while it correlates with the mixture fraction of the fresh unburned fuel upstream of the flame zone. Hence, this spatial uncertainty scales with the instantaneous flame thickness and the spatial gradient of the local equivalence ratio at the scale of the flame thickness. As we consider rather thin flames at high Reynolds numbers we expect this effect to be negligible, particularly within the context of large-scale (phase-averaged) equivalence ratio fluctuations which are the focus of this study.
The measurement of the spatial distribution of the two different chemiluminescent species was realized using an intensified Photron Fastcam SA 1.1 high-speed camera (1 Mpixel at 2 kHz double frame), which was installed perpendicular to the flow direction, facing the outlet of the mixing tube, which represents the inlet to the silica glass combustion chamber. The camera was equipped with a stereoscope (LaVision Image Doubler), which allows for the projection of an image pair onto a single camera chip. These two images capture the same field of view inside the combustion chamber, which can be seen in Figure 2. For each experimental configuration, a set of 2000 images was recorded at a rate of 2 kHz. Only for the measurement at an excitation frequency of 97 Hz, 2000 images were recorded at a rate of 1 kHz. Two optical bandpass filters were set to detect different chemiluminescent species:
The chemiluminescence measurements were calibrated by conducting seven measurements with different
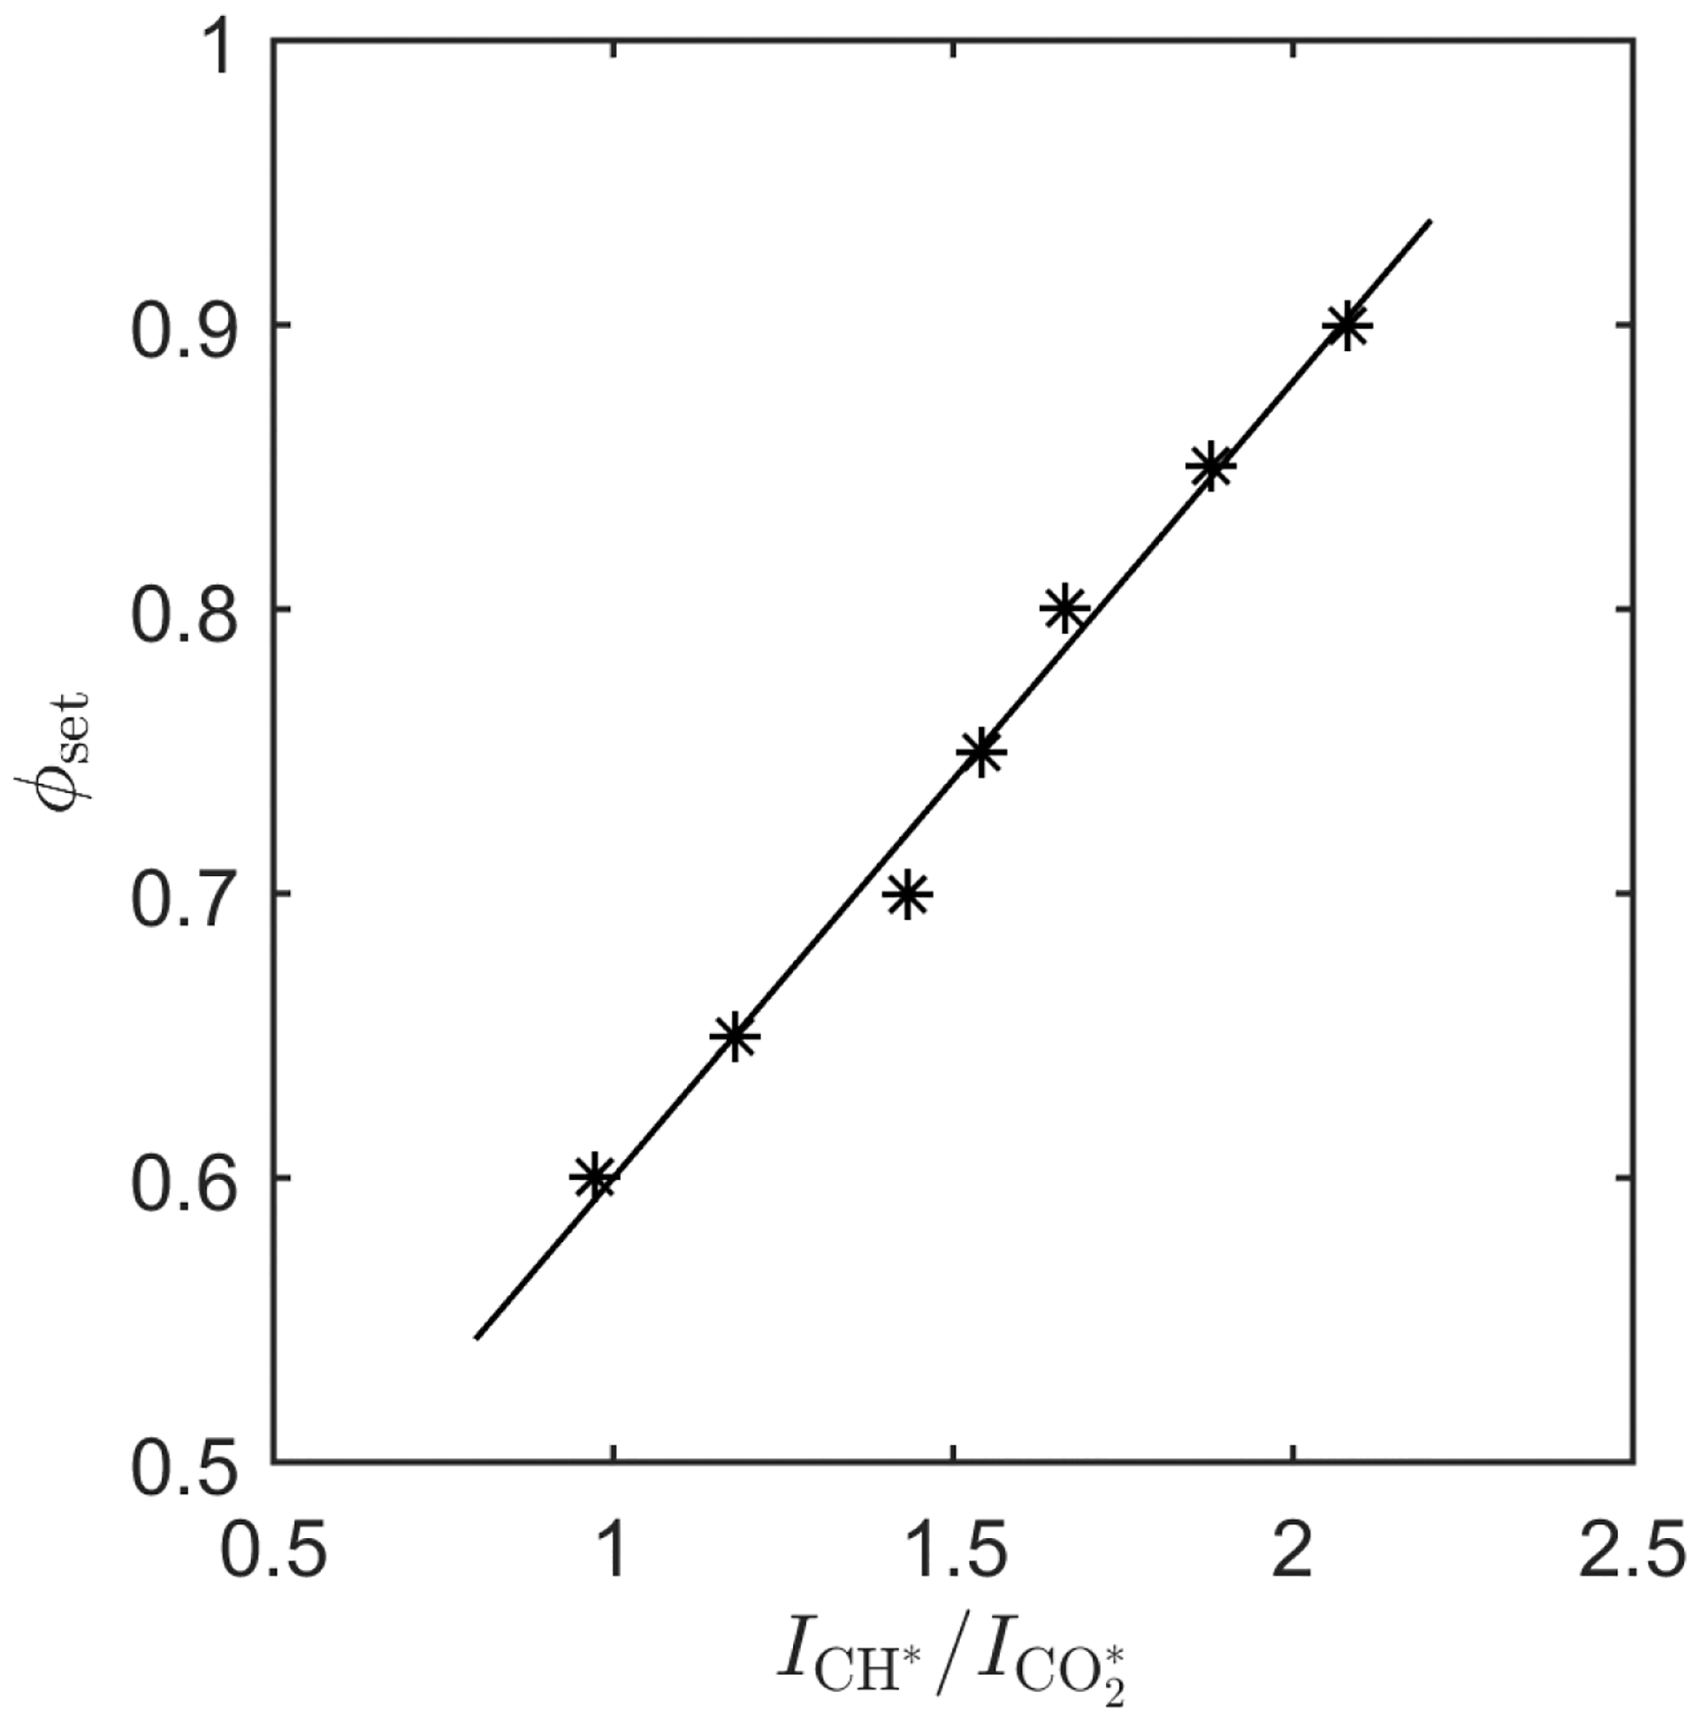
Measured calibration curve for mean equivalence ratio over intensity ratio (symbols), linear fit (line).
Particle image velocimetry
The two components of the velocity field in the streamwise plane aligned with the combustor axis were measured using high-speed particle image velocimetry (PIV). The PIV system consists of a Photron Fastcam SA 1.1 high-speed camera (1 Mpixel at 2 kHz double frame) and a pulsed Nd:YLF diode pumped laser (Quantronix (Hamden, CT) Darwin Duo 527–100M, 527 nm wavelength and total pulse energy of 60 mJ). Analog to the
Quantitative light sheet method
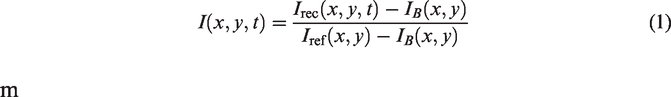
The PIV particle snapshots were furthermore used to estimate the mean and phase-averaged density fluctuations in the combustion chamber by means of quantitative light sheet method55–58. The light intensity I, scattered by the particles, is estimated by subtracting a background image IB without seeding from the recorded raw scattered light intensity
Additional influences on the detected light intensity such as multiple scattering or light extinction 57 are neglected within the scope of this study.
Based on equation (1), the particle concentration

By means of QLS an exact quantification of the number of particles is impossible. In general, the QLS technique only provides a relative information to a known quantity. Therefore,
OH*-chemiluminescence
For flame diagnostics, more specifically to visualize heat release rate fluctuations of the flame, the chemiluminescence of the OH* radicals was simultaneously recorded (to the PIV) with a second Photron Fastcam SA 1.1 (1 Mpixel at 2 kHz single frame). The camera was equipped with an image intensifier and an optical bandpass filter that restricts the observed wavelengths to λ = 308 nm. The planar representation of the flame shape was reconstructed from the time-averaged OH* signal using an Abel-deconvolution, assuming a perfectly symmetric flame shape with respect to the combustion chamber centerline.
Tunable diode laser absorption spectroscopy
The methane concentration and equivalence ratio inside the mixing tube was measured by Tunable Diode Laser Absorption Spectroscopy (TDLAS) making use of the wavelength modulation spectroscopy approach. Details to the present TDLAS arrangement can be found in Blümner et al.
33
. A fiber-coupled near-infrared tunable diode laser (Eblana Photonics EP1654-DM-DX1-FM) at a wavelength close to 1653 nm was modulated through a sinusoidal injection current at a frequency of 10 kHz. The laser light was guided through the mixing tube between two fiber-coupled collimators (Thorlabs TC12APC-1550). Freespace coupling was used, which is uncritical, since the selected wavelength is free from interference of other absorbing species. The laser beam was set to cross the mixing tube at a distance of
Experiments and post-processing
Operating conditions and measurements
Throughout this study, the combustor was operated at partially premixed conditions. Table 1 gives an overview of the considered operating conditions. For the considered experiments, the supplied air flow rate was 100 kg/h. This results in a Reynolds number of around Re = 60 000 based on the kinematic viscosity of air with
Operating conditions for experiments.

The measurement techniques mentioned above were applied starting with the MMM, followed by the PIV (and QLS) along with synchronized OH
Triple decomposition of experimental data
Considering a turbulent flow subjected to acoustic harmonic forcing, the time-dependent signal (such as 
The periodic part is obtained by subtracting the mean quantities from the phase-averaged quantities according to
The Fourier coefficients corresponding to the fundamental wave are calculated from the phase-averaged quantities as

The line-of-sight-integrated chemiluminescence data was Abel-deconvoluted in post-processing in order to obtain a planar representation. This is only applicable to axisymmetric fields which applies to the mean and phase-averaged quantities, but not to the instantaneous snapshots.
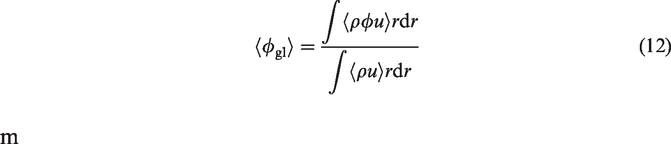
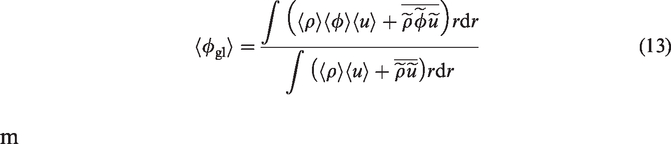
Quantification of global equivalence ratio fluctuations
The equivalence ratio of a mixture is defined as the ratio of fuel (subscript f) and oxidizer (subscript o) divided by their stoichiometric fraction, which depends on the fuel and oxidizer used. For a mass-based equivalence ratio this is commonly expressed as
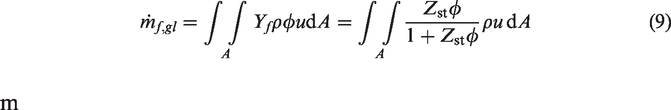

For better readability we neglect the term 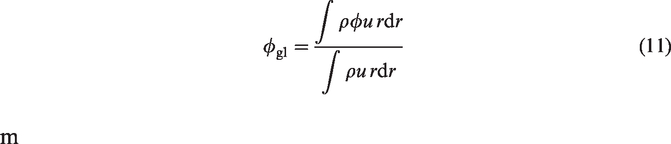
To further attain the phase-averaged ϕ values using the triple decomposition from equations (4) and (5), equation (11) converts to
Definitions of spatial mixing transfer functions
The goal of this study is to quantify the generation of fuel fluctuations at the injector and their convection and diffusion between the injector and the flame. To adequately assess this, several spatial mixing transfer functions can be considered, which will be defined in the following.
Figure 4 displays a schematic depiction of the quantities that are available for this purpose. Utilizing the MMM measurements, the acoustic velocity of the planar acoustic waves was reconstructed at the combustor inlet. It is denoted as

Schematic measurement setup, showing the individual measuring areas (mixing duct and combustion chamber), along with the axial measurement positions of the variables
Equivalence ratio fluctuations were measured inside the mixing duct using the TDLAS technique at a distance of
From these quantities, several transfer functions can be built that quantify the generation and streamwise transport of equivalence ratio fluctuations. Starting at the most upstream location, we define the fuel injector transfer function as
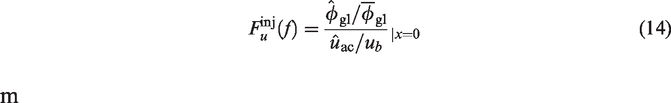
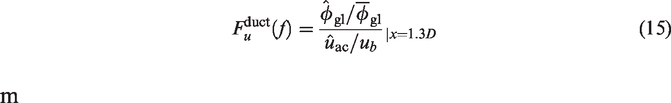
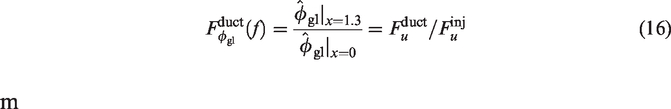
The corresponding gain and phase allows to quantify the convection and diffusion of the ϕ-fluctuations that are generated by the acoustic forcing. The corresponding transfer function for the local ϕ-fluctuations measured in the flame area 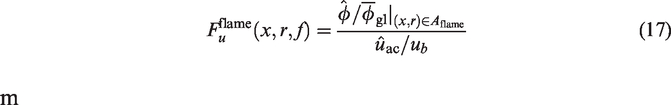
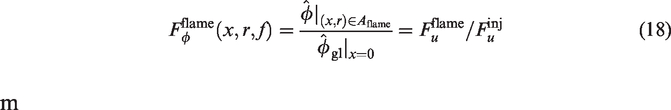
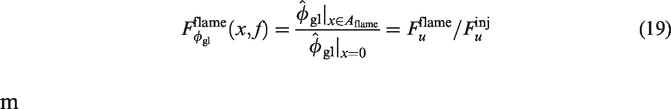

Analog to
Modeling generation and transport of equivalence ratio fluctuations
Generation of equivalence ratio fluctuations
To model the generation of fuel fluctuations in gas turbine burners, a choked acoustically stiff fuel injector is commonly assumed. This implies that the pressure fluctuations in the combustion chamber do not couple with the fuel injector and the injected fuel mass flow remains constant. This behaviour is typically achieved by having a very high pressure loss across the fuel injector, which is the case in this experiment. With the assumption of instant mixing of fuel and oxidizer at the injector, the generation of 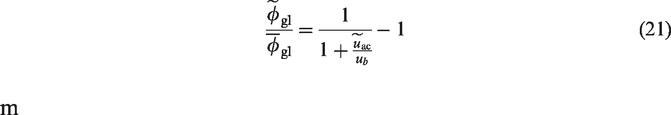
In the limit of small velocity fluctuations (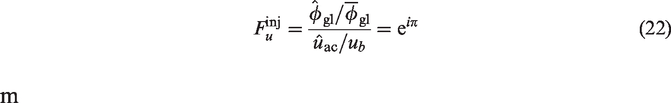
Transport and mixing of equivalence ratio fluctuations
The main focus of this work lies within the quantification of the streamwise transport of equivalence ratio fluctuations generated by velocity perturbations. The equivalence ratio fluctuations are thereby regarded as a passive scalar field. In this case ”passive” refers to the fact that the flow field is independent of the scalar field. We model the streamwise transport of global 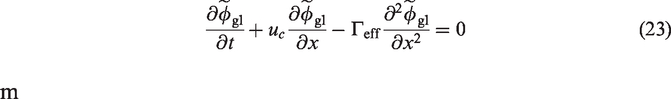
The capability of a 1D transport model to account for the convection and diffusion within a 3D swirled flow, as considered in this study, has been demonstrated within the context of entropy waves and equivalence ratio fluctuations33,38,48. In fact, as shown by Blümner et al.
61
, the 1D model performs better for turbulent swirling flows than the quasi-2D model suggested by Giusti at al.
37
which accounts for mean shear dispersion but neglects turbulent diffusion. In the current 1D model both these effects are accounted implicitly by the effective turbulent diffusivity
62
. As a drawback, an estimate for this diffusivity cannot be easily obtained and it must be derived from a fit of measured mixing transfer functions. Moreover, for both models, the transport velocity uc is assumed to be constant in time, and the periodic part
To align the model with the experimental results, it is convenient to explore the spatial mixing transfer function 
Characterization of baseline configuration
Mean flow and flame shape
Figure 5 shows the time-mean of the flow and flame inside the combustor at the baseline operating conditions (without acoustic forcing). The streamlines indicate the typical characteristic of swirl-stabilized combustor flows. Vortex breakdown creates an inner recirculation zone with the upstream stagnation point located somewhat downstream of the combustor inlet. The swirling jet entering the combustor is guided around this recirculation zone towards the combustion chamber walls (see Figure 5(a)). An external recirculation zone is created, due to the rapid area jump from the mixing tube cross section to combustion chamber cross section. Two shear layers exist, one between the jet and the inner recirculation zone and one between the jet and the outer recirculation zone.

Mean flow field, mean OH
The mean flame shape is indicated by the (Abel-deconvoluted) OH
The local
In order to validate the accuracy of the 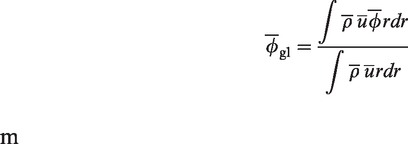
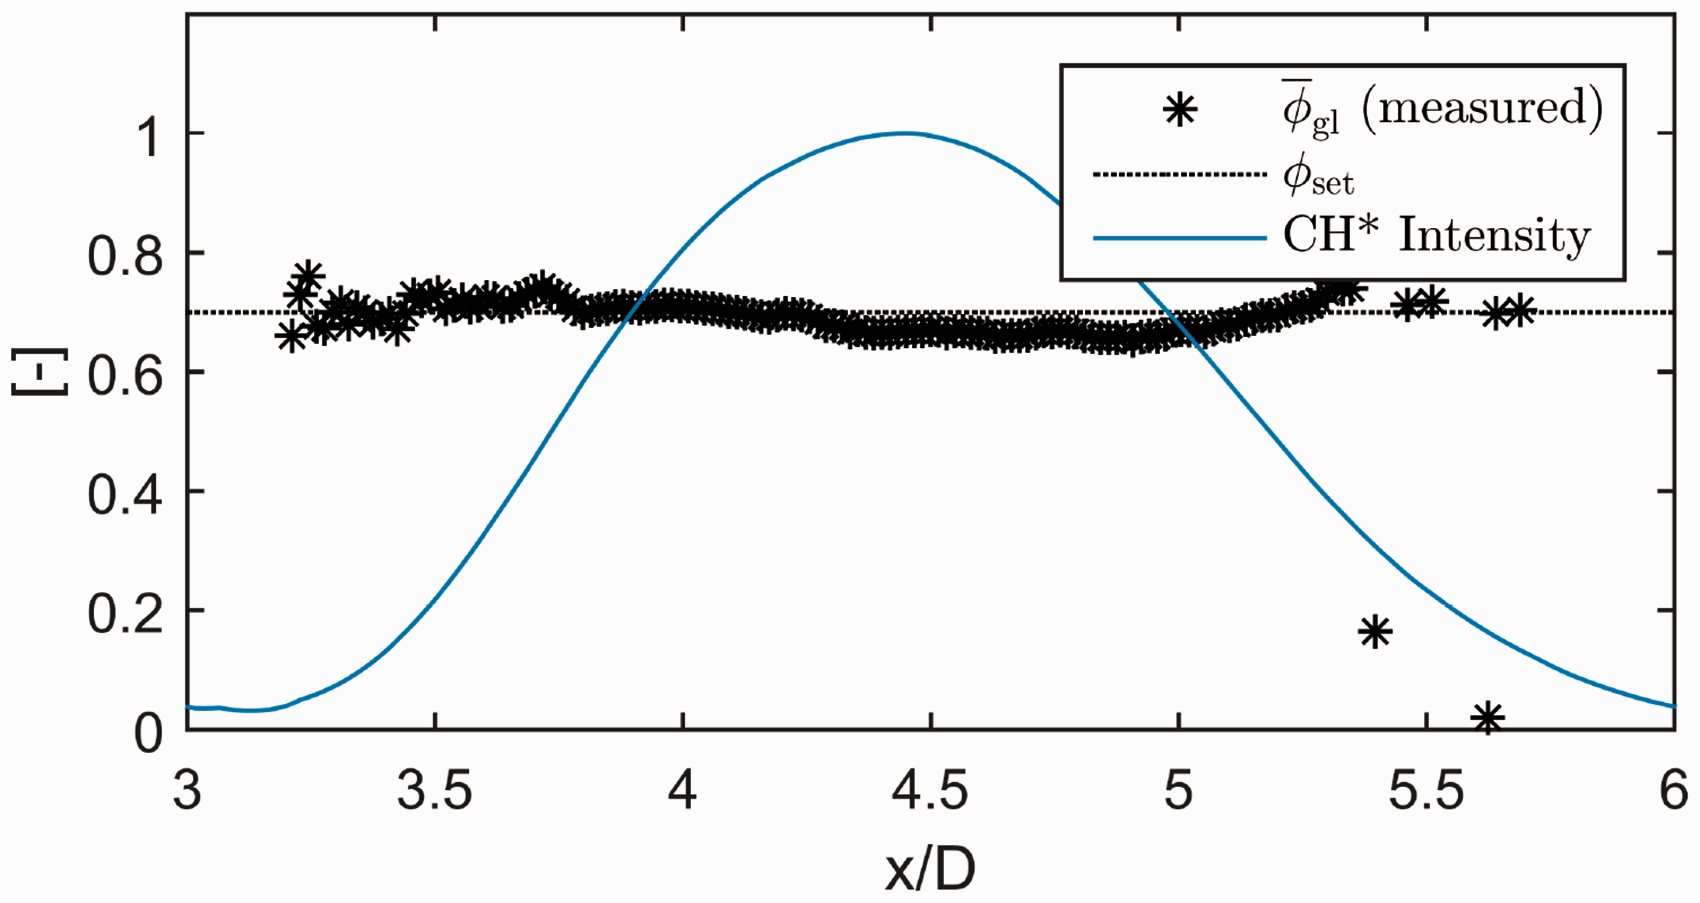
Black stars represent mean global equivalence ratio
The figure further shows the radially integrated CH
Flow field dynamics at linear and non-linear forcing
Figures 7 and 8 show the results from synchronized PIV and chemiluminescence measurements for two different forcing frequencies. The contours in gray-scale show the finite-time Lyapunov exponent (FTLE), a scalar quantity that can be extracted from phase-averaged velocity fields as determined from PIV. It is a suitable way to visualize Lagrangian coherent structures
63
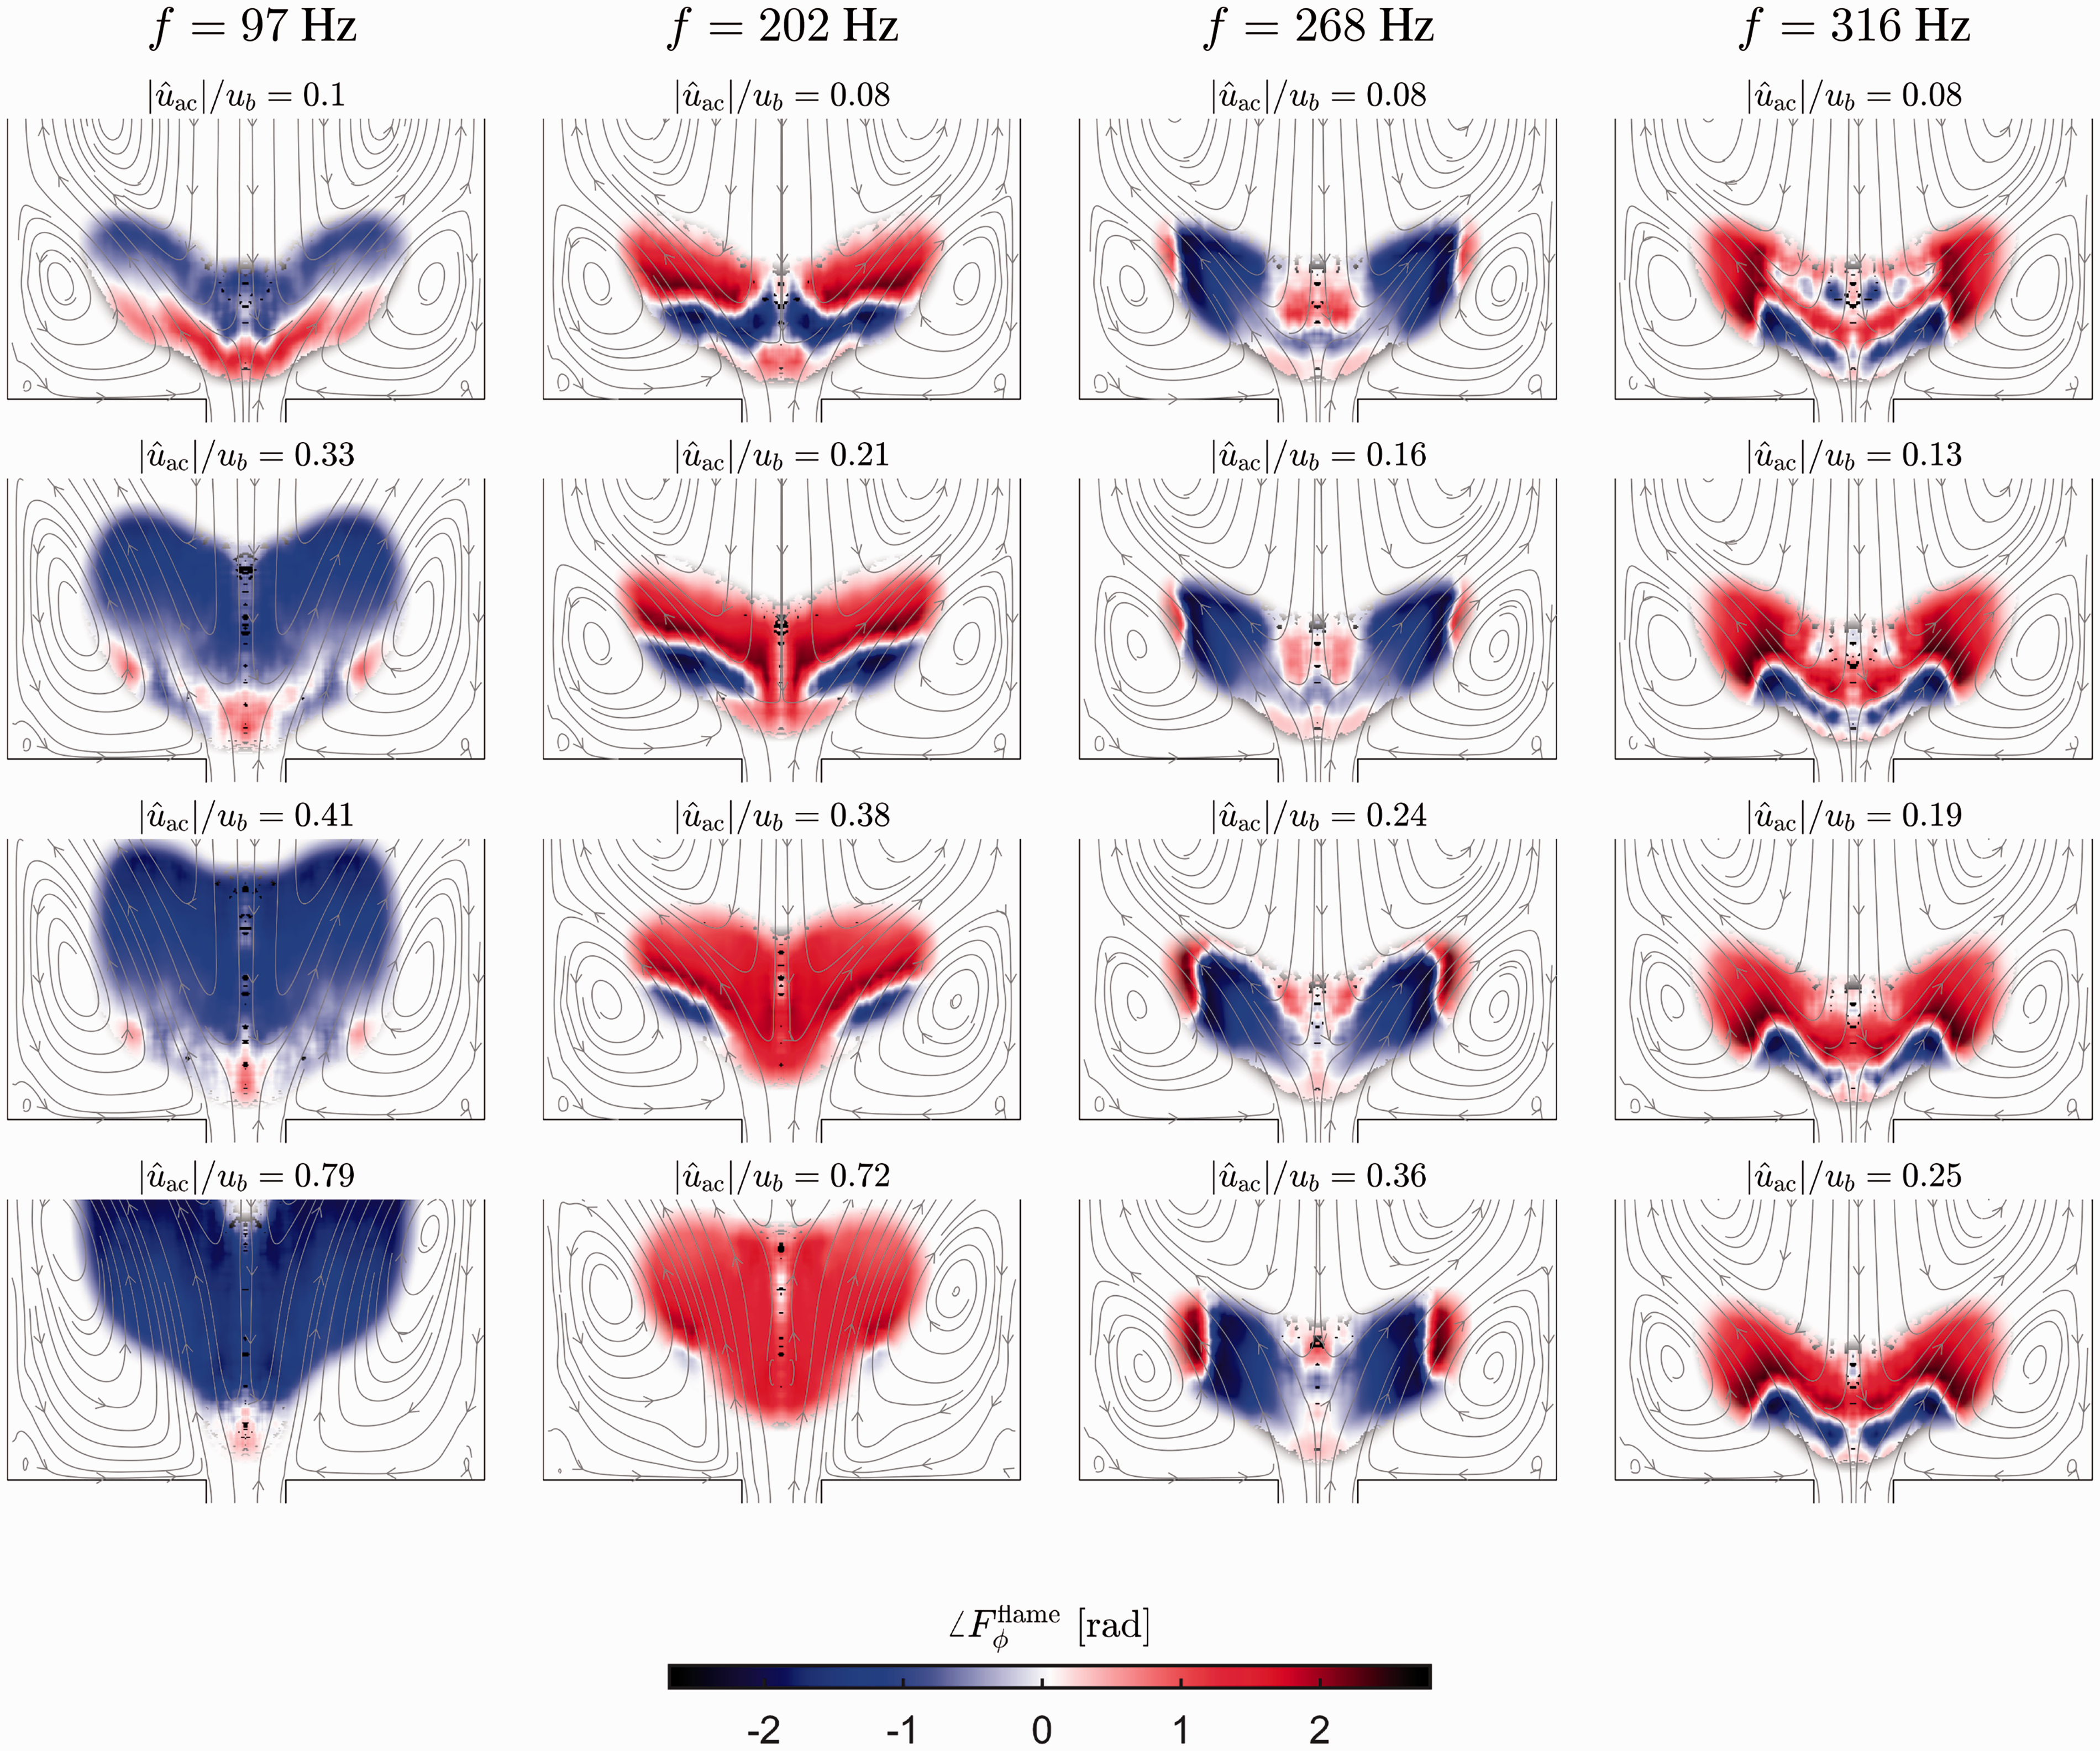
. The FTLE is a measure for the divergence of path lines in a fixed time interval, which can be calculate forward or backwards in time. To visualize the interfaces between the jet and the breakdown bubble, backward time FTLE is more suitable as it pronounces attracting structures. More details on how to compute FTLE from phase-averaged data is given in references64,65. The FTLE is shown together with color contours of the phase-averaged local equivalence ratio

Sequence of linear (left) and non-linear (right) response of the flow field and equivalence ratio to acoustic forcing at 202 Hz. Gray-scale shows FTLE determined from phase-averaged PIV images and colored contours show phase-averaged
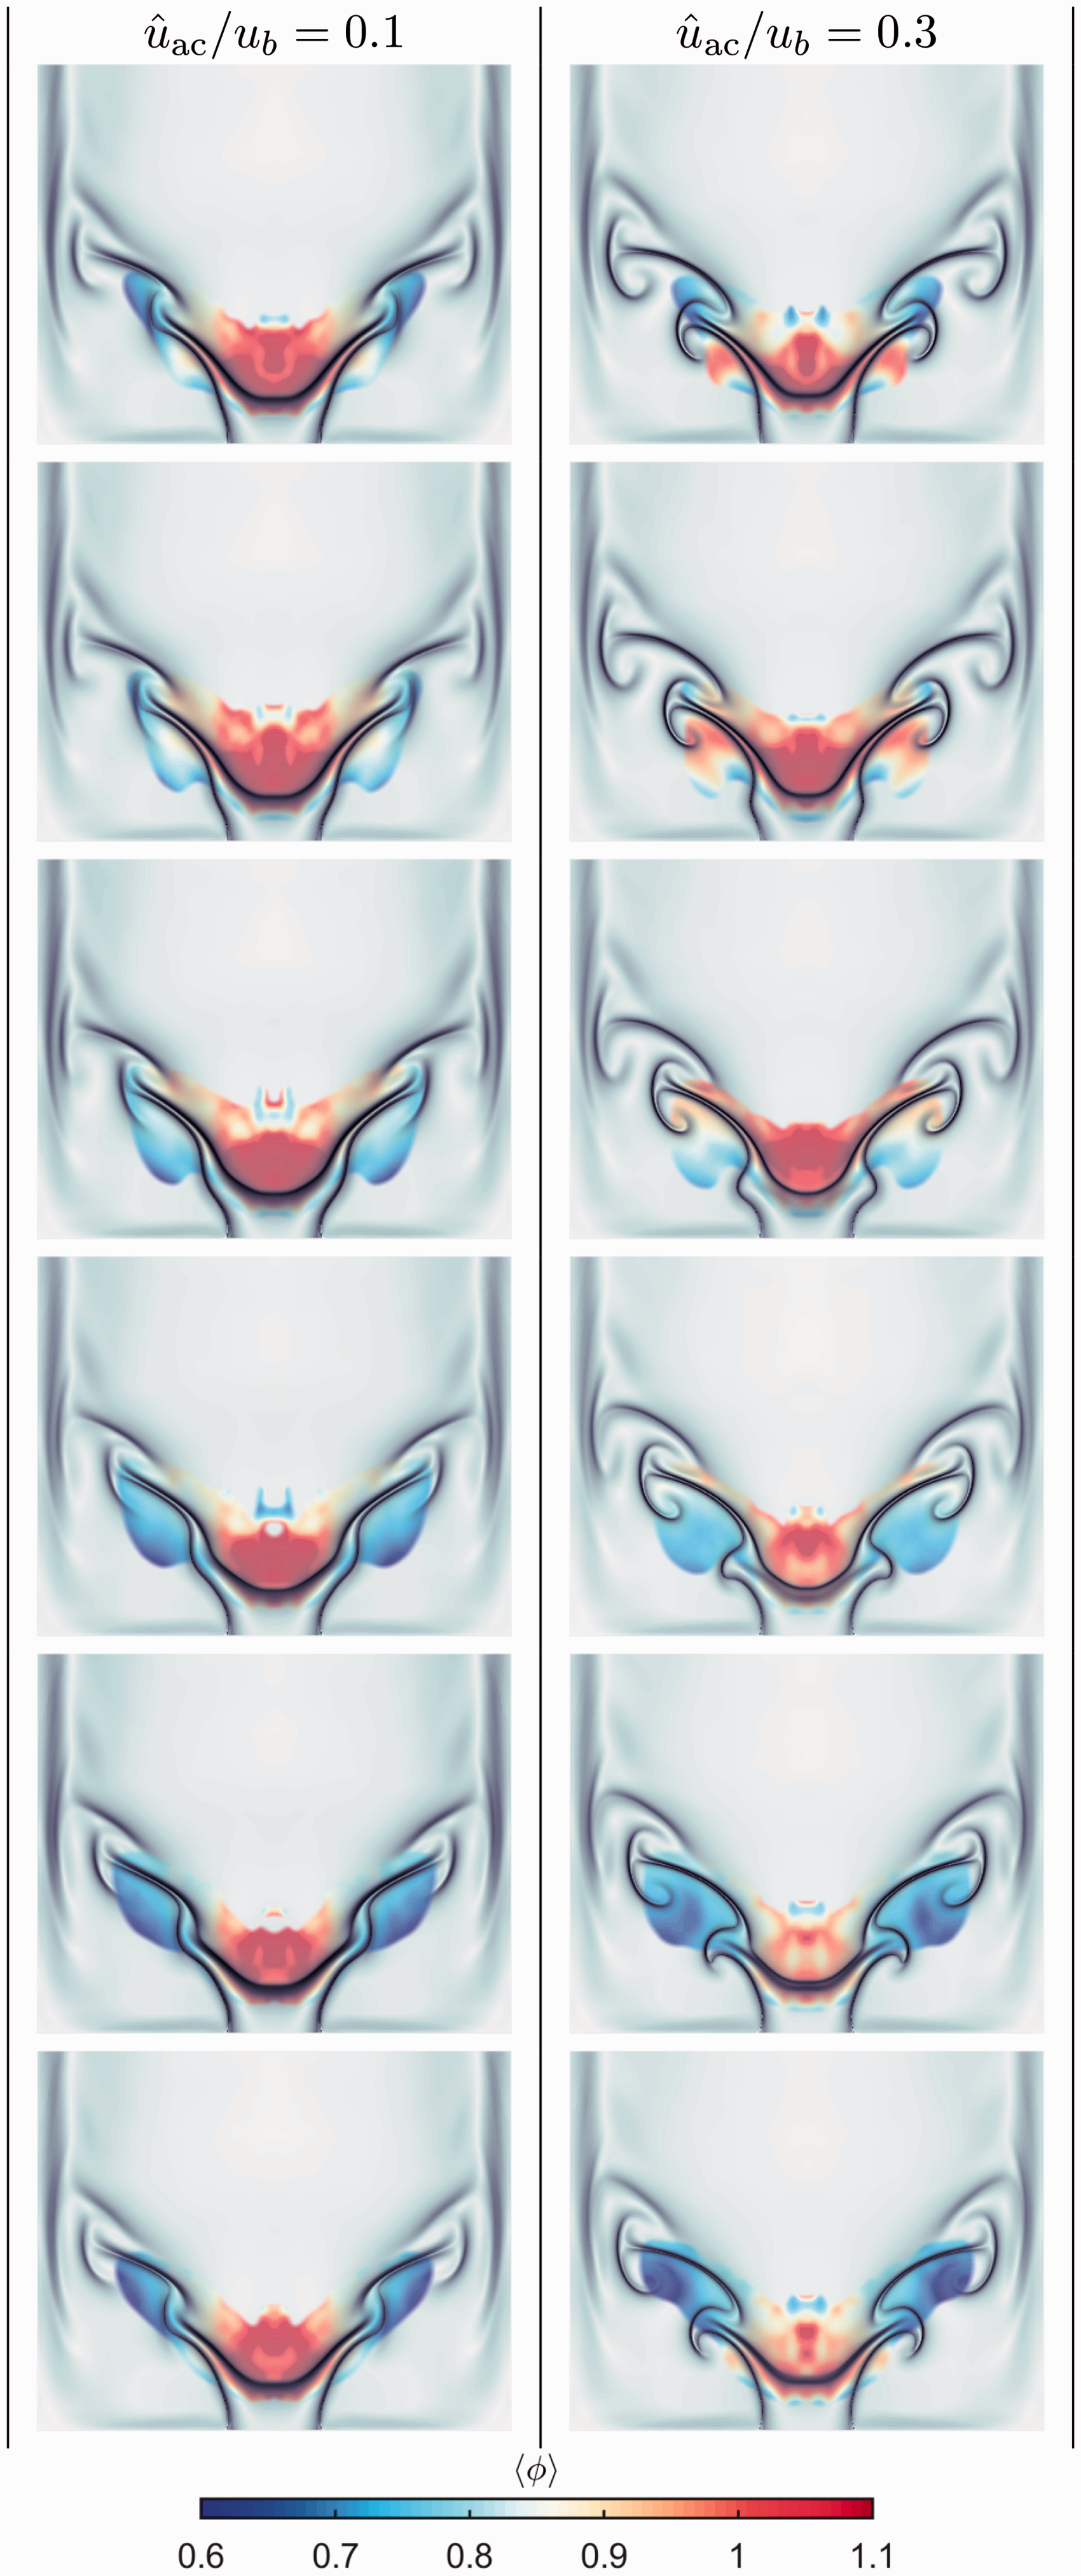
Sequence of linear (left) and non-linear (right) response of the flow field and equivalence ratio to acoustic forcing at 316 Hz. Gray-scale shows FTLE determined from phase-averaged PIV images and colored contours show phase-averaged
Figure 7 shows two columns, on the left, the linear response of the flow field and equivalence ratio to the acoustic forcing at f = 202 Hz, and analogously on the right, the non-linear response. The data is presented for six equidistant phase angle values, one in each row. The plots depicting the linear response show axisymmetric vortical structures at the tip of the flame. Throughout one period, the vortices are generated in the inner shear layer and transported downstream. At the flame base,
The right column, depicting the non-linear responses, makes the described effects more apparent. Large vortex structures are formed, leading to strong radial mixing of
Figure 8 shows the linear and non-linear responses for a higher frequency of f = 316 Hz. The linear response depicted on the left side show a wave-like movement of the annular flow field throughout one period, however no vortex formation is visible in contrast to the f = 202 Hz case. The lack of distinct vortices suggests a lower receptivity of the shear layers to the forcing frequency of f = 316 Hz than for lower frequencies. Fluctuations of
In the non-linear case, shown in the right column of Figure 8,
Comparing the two forcing frequencies, the most visual difference is the qualitative difference in the structure of the flow field fluctuations. These have, even for the linear response, a clear influence on the fluctuations of
When comparing the phase position of the flow field fluctuations as well as the areas of constant
Linear mixing transfer functions
Generation and transport of
in the duct
In this section, we investigate the generation and spatial mixing of equivalence ratio fluctuations based on the spatial mixing transfer function
The gain and phase of the measured spatial mixing transfer function
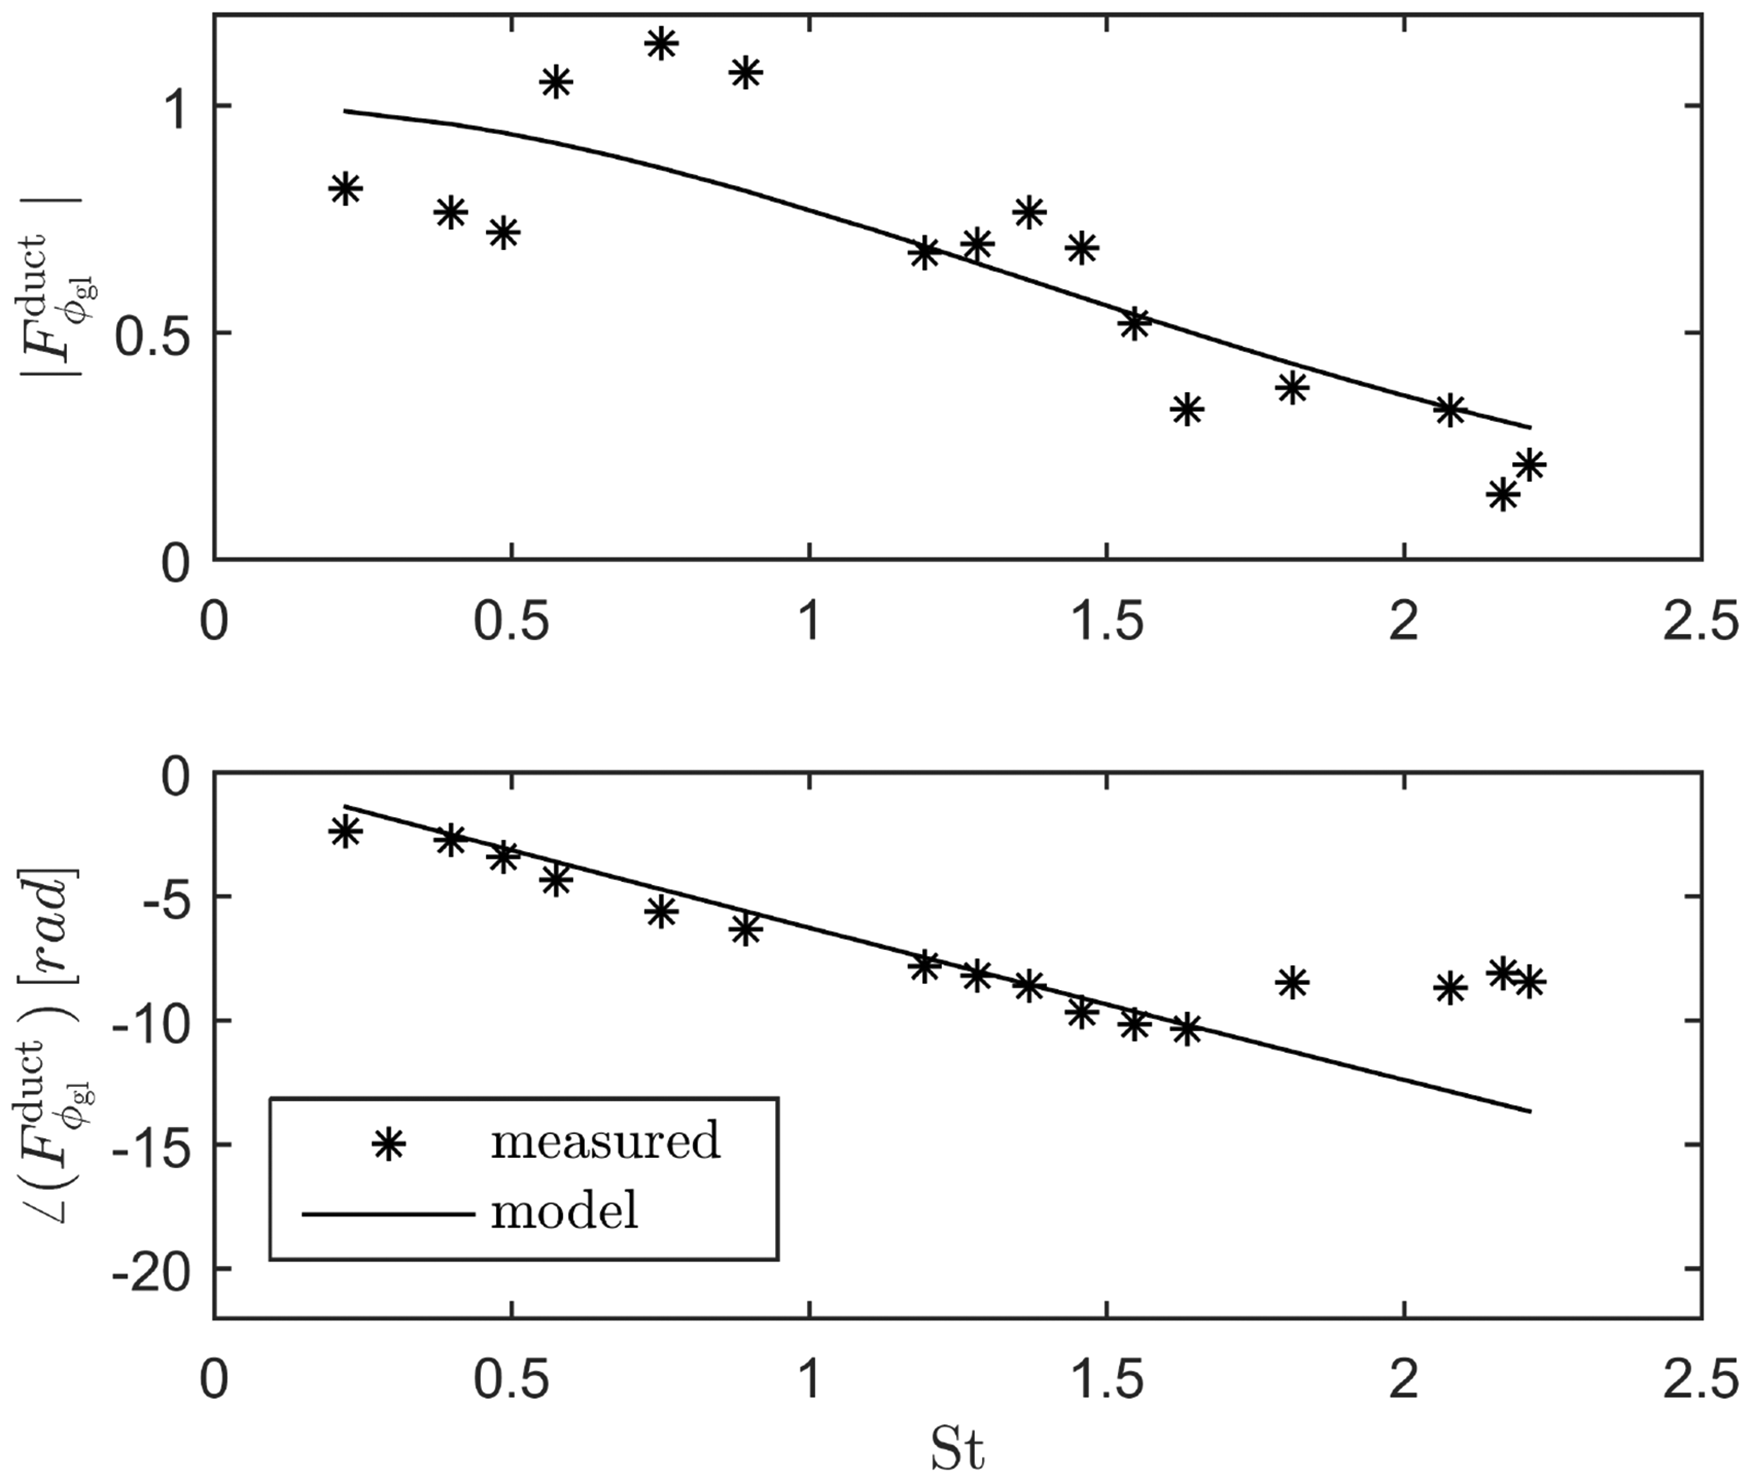
Symbols: Mixing transfer function
Similar interference patterns in the mixing transfer function were observed in a related study based on TDLAS data inside a generic mixing duct
33
. In this study, it was suggested that the constructive and destructive interference between two transport mechanisms is responsible for the interference pattern that may cause gain values higher than unity. One mechanism is related to the mean convection of
Figure 9 further shows that the 1D model reproduces the measured phase very well for frequencies up to St
The fact that the measured mixing transfer function approaches a gain value of one and a phase of zero towards zero frequencies (which is equivalent to zero
Transport of
fluctuations to the flame
Figure 10 shows the spatial distribution of the local mixing transfer function
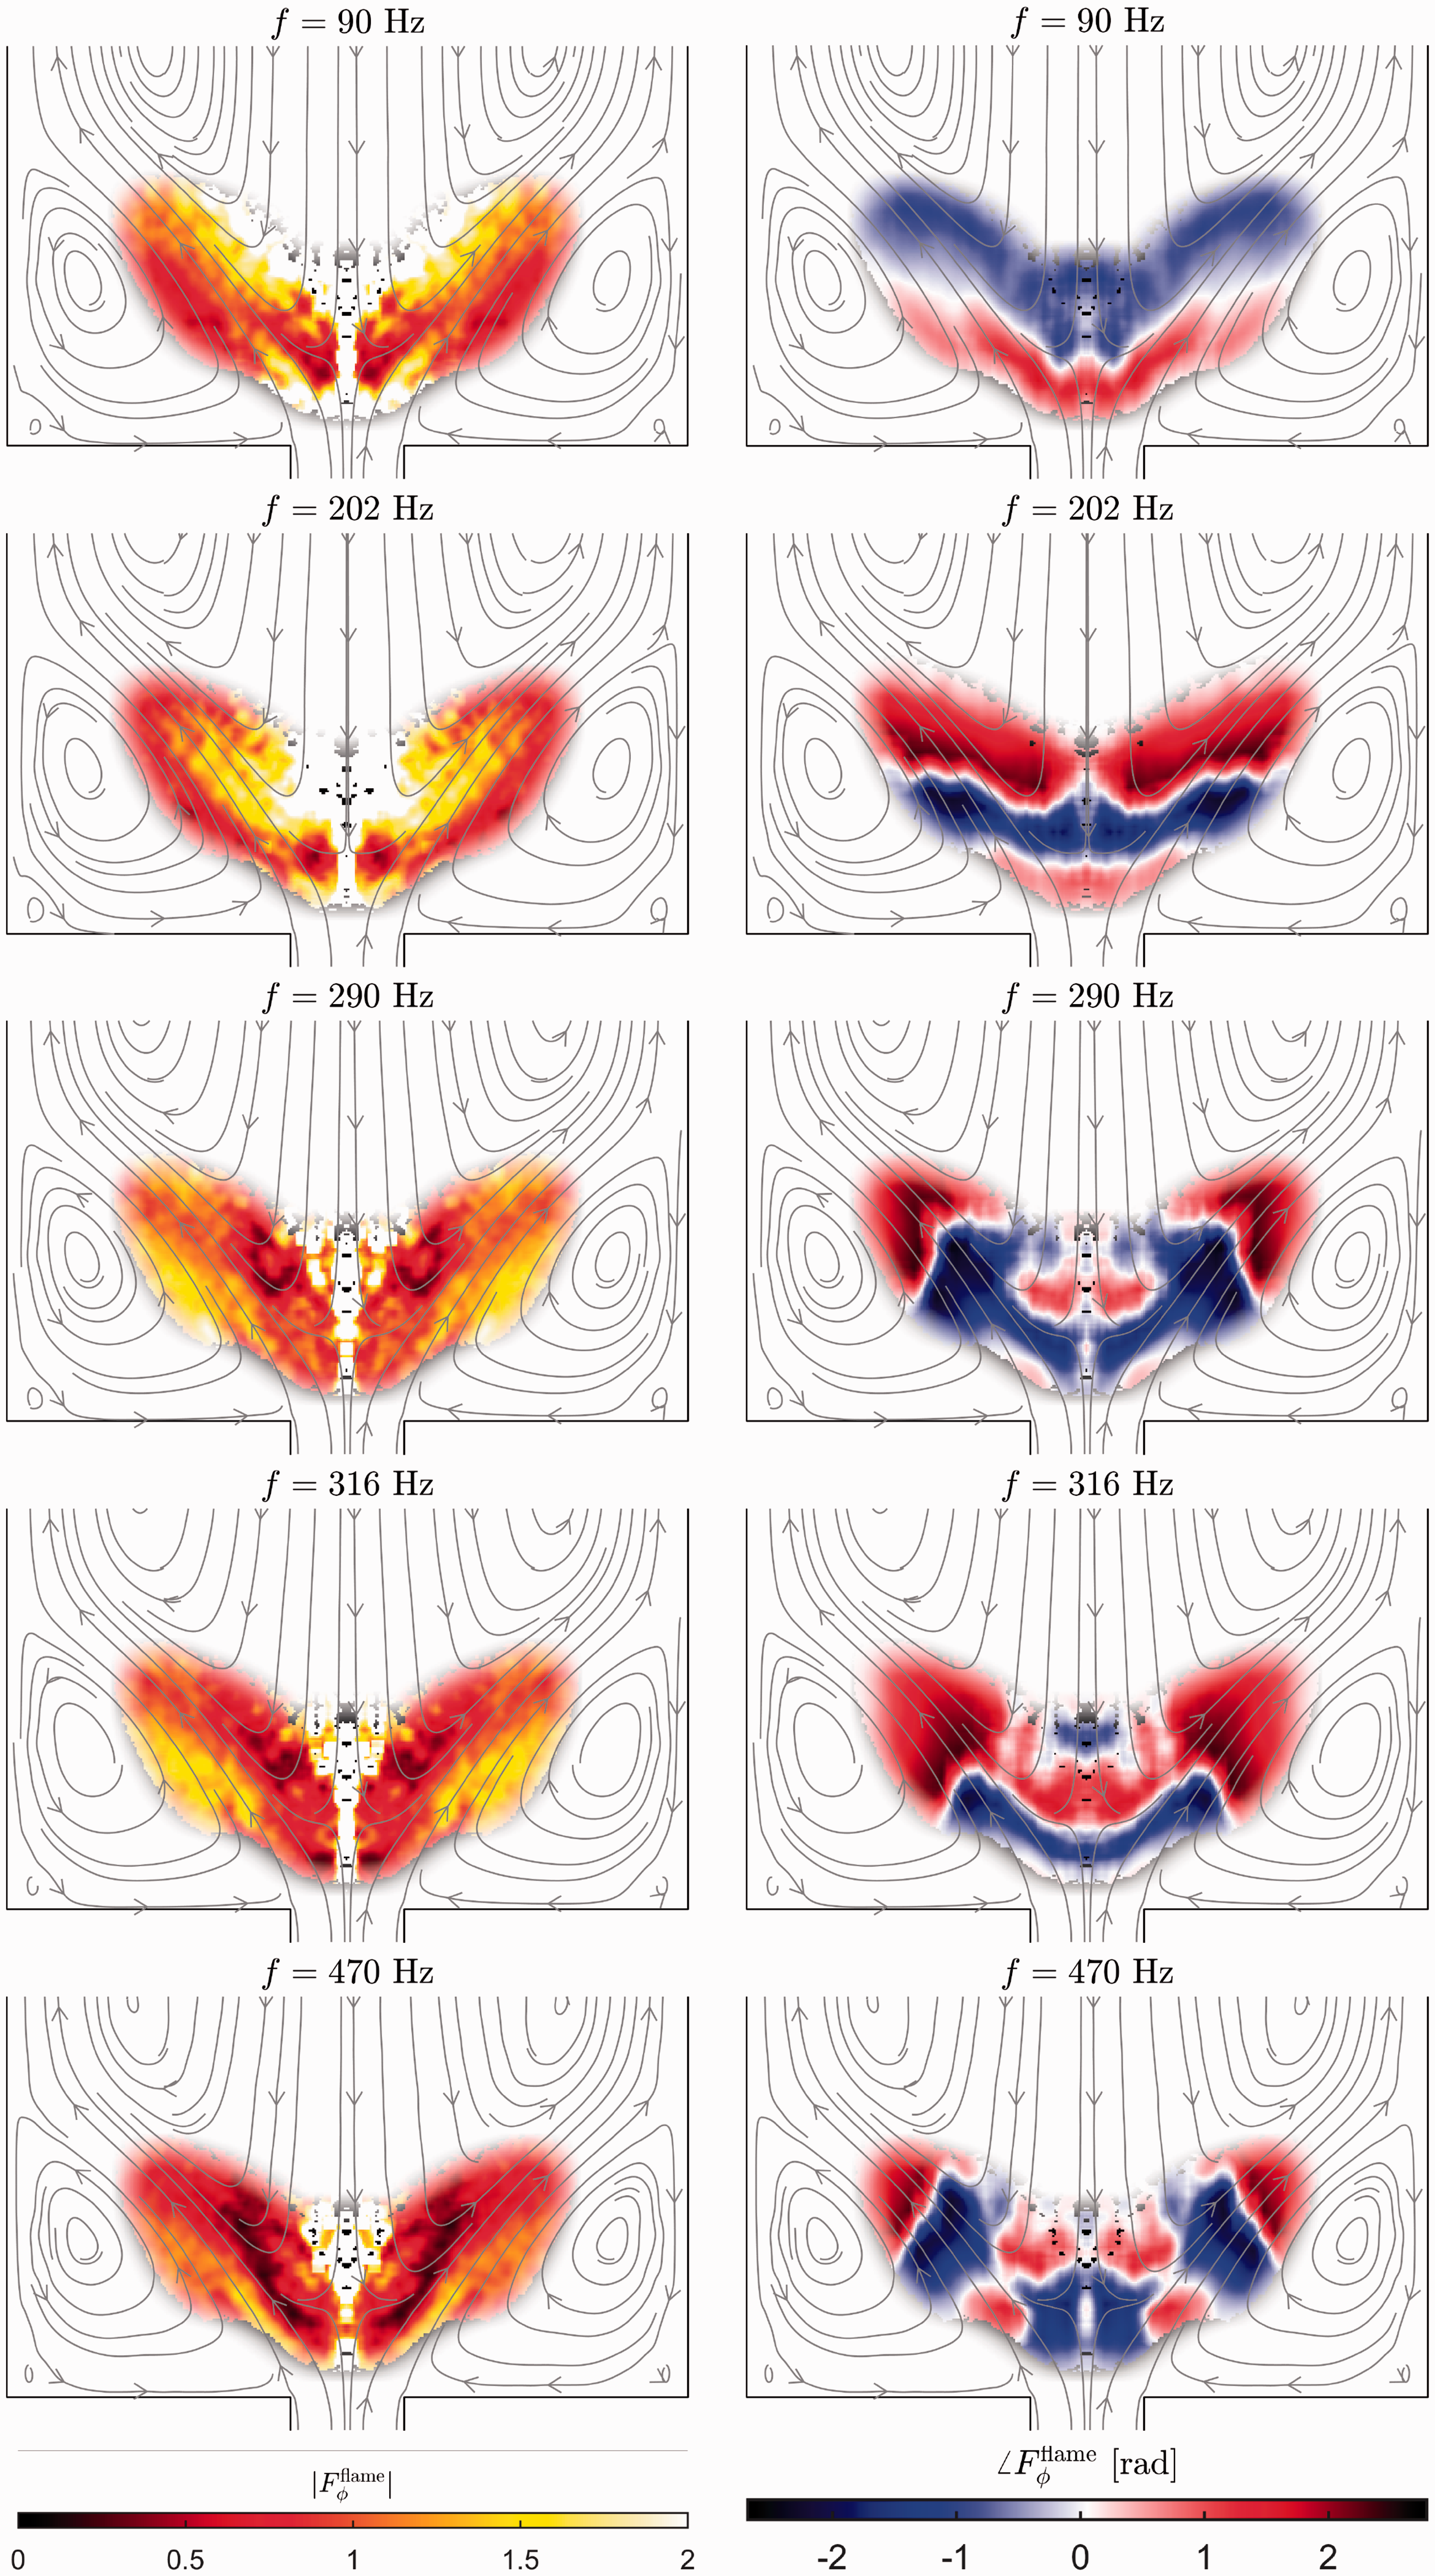
Gain (left) and phase (right) of local linear mixing transfer function
Considering the gain contours, it is apparent for the low frequency cases that a gain value in the flame center is approximately one, indicating that the ϕ-fluctuations induced at the injector are not significantly attenuated before they reach the flame. The high values in the centerline are to be ignored, as this region is susceptible to large measurement errors following the data deconvolution process. Between 90 and 316 Hz, an overall increase in gain values inside the outer recirculation zone of the flame brush (outer part) can be noticed for increasing frequencies, speaking for a large influence of coherent structures, induced by acoustic fluctuations. At the highest frequency of f = 470 Hz the gain values are reduced throughout the flame, most likely resulting from an attenuation of
The phase distribution displayed in the right column of Figure 10 suggests a convection-dispersion process taking place for the higher frequency cases. For low frequencies, the
After the discussion of the local mixing transfer function
Figure 11 shows the measured mixing transfer function
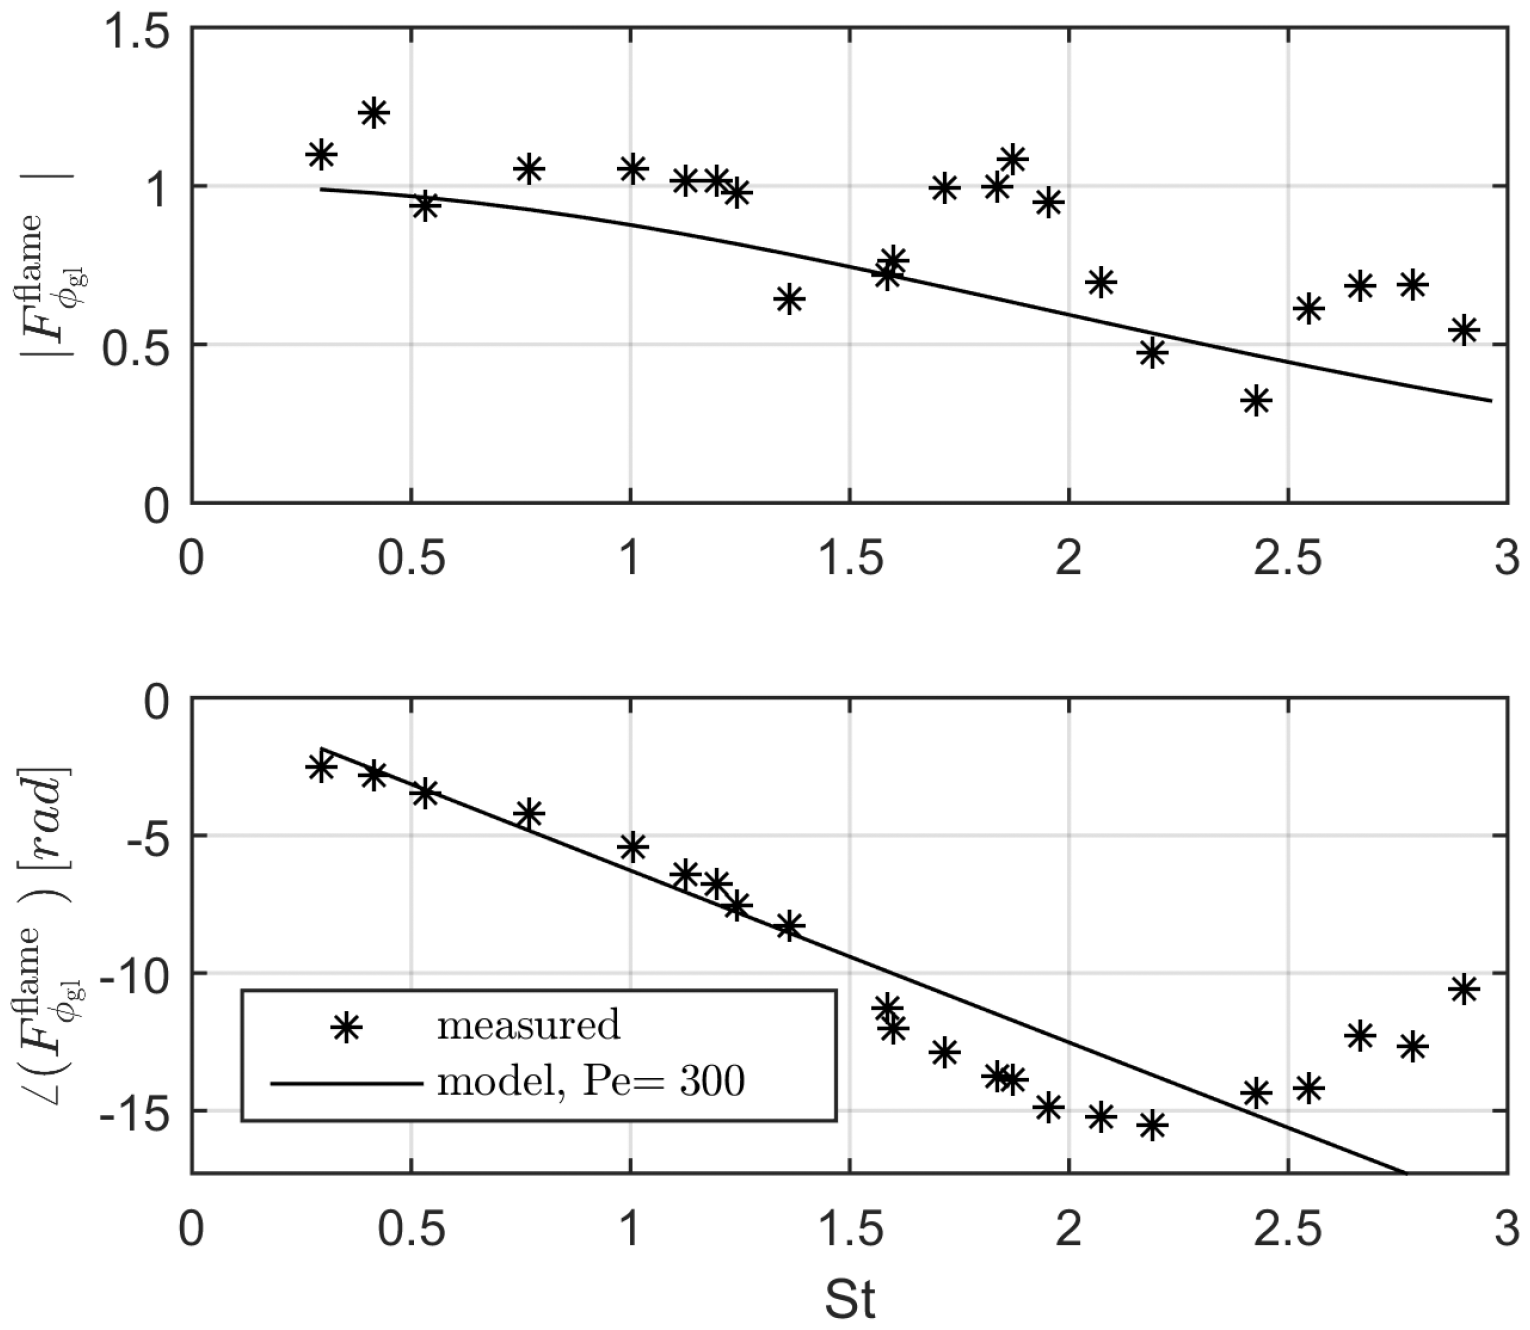
Symbols: Mixing transfer function
However, the deviations of the data from the model strongly suggest that the 1D convection-diffusion model can only be applied to low frequencies. For higher frequencies, the impact of flow fluctuations induced by turbulent coherent structures on the
Time delay analysis of
and flow fluctuations
As suggested here and in a previous study
33
, the interference pattern observed in the gain of the mixing transfer function is possibly caused by an interference of flow and fuel fluctuations. To support this hypothesis, a time delay analysis is conducted. Therefore, the equivalence ratio pertubations are decomposed in two parts
Rearranging the expression to

To estimate the time delays of the two mechanisms, we base
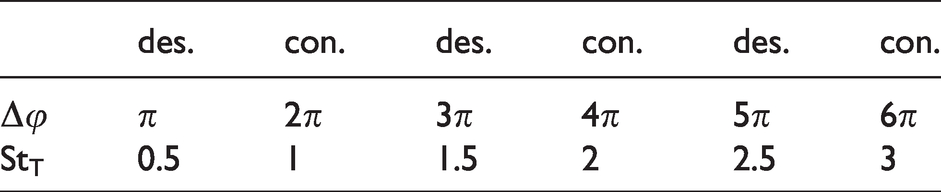
As seen in Table 2, the frequencies determined from the time delays compare quite well with the locations of the local minima and maxima of the gain of the mixing transfer function shown in Figure 11. This supports the hypothesis that the different transport velocities of the hydrodynamic structures and the bulk flow cause the interference pattern in the mixing transfer function. Note that the frequencies based on a convective distance of
Frequencies at ideal constructive and destructive interference of two mechanisms with transport velocities
Non-linear mixing transfer functions
In this section, we investigate the generation and transport of
Regarding the generation of
Moreover, current research suggests that coherent structures created by non-linear acoustic forcing in the combustion chamber lead to additional mixing, which causes a dampening of the
Local
-fluctuations in the flame
Figure 12 displays the gain values of the local mixing transfer function

Gain of local mixing transfer function
For the lowest frequency case a growing of the flame area is clearly visible for increasing forcing amplitudes. This is due to stronger fluctuations of the flame in streamwise direction resulting from the higher forcing amplitudes, which leads to an increased mean flame length. Moreover, a reduction of the mixing transfer function gain with higher forcing amplitudes is clearly noticeable indicating a saturation of
For the two highest forcing frequencies, the achievable maximum forcing amplitudes are lower due to acoustic dissipation of the test rig. Nonetheless, saturation of the mixing transfer function can also be observed, however, the modification of the mean flame area and the mean flow field are much less pronounced. Moreover, a comparison of cases with similar forcing amplitude shows that the saturation of mixing transfer function is more pronounced for the lower frequency case. Overall, it appears that the saturation of the local
Figure 13 shows the phase of the local mixing transfer function, providing information about the transport and dispersion of the equivalence ratio fluctuations as they travel through the flame region. For the lowest forcing frequency, the phase values indicate very long streamwise wavelengths, which extend beyond the flame length. Interestingly, the radial distribution of the phase does not seem to be disturbed considerably when increasing the forcing amplitude. It appears that the low frequency forcing primarily causes a streamwise bulk-movement of the
Phase of local mixing transfer function
Global mixing transfer functions
At this point, saturative effects have been observed in the local mixing transfer functions but their origin remains unknown. To further investigate the effects underlying the saturation and at what stage their impact is maximum, a study is conducted in which the separate transfer functions preceding and succeeding the injector are compared.
Figure 14 shows the gains of three different transfer functions plotted over the acoustic amplitude: the transfer function
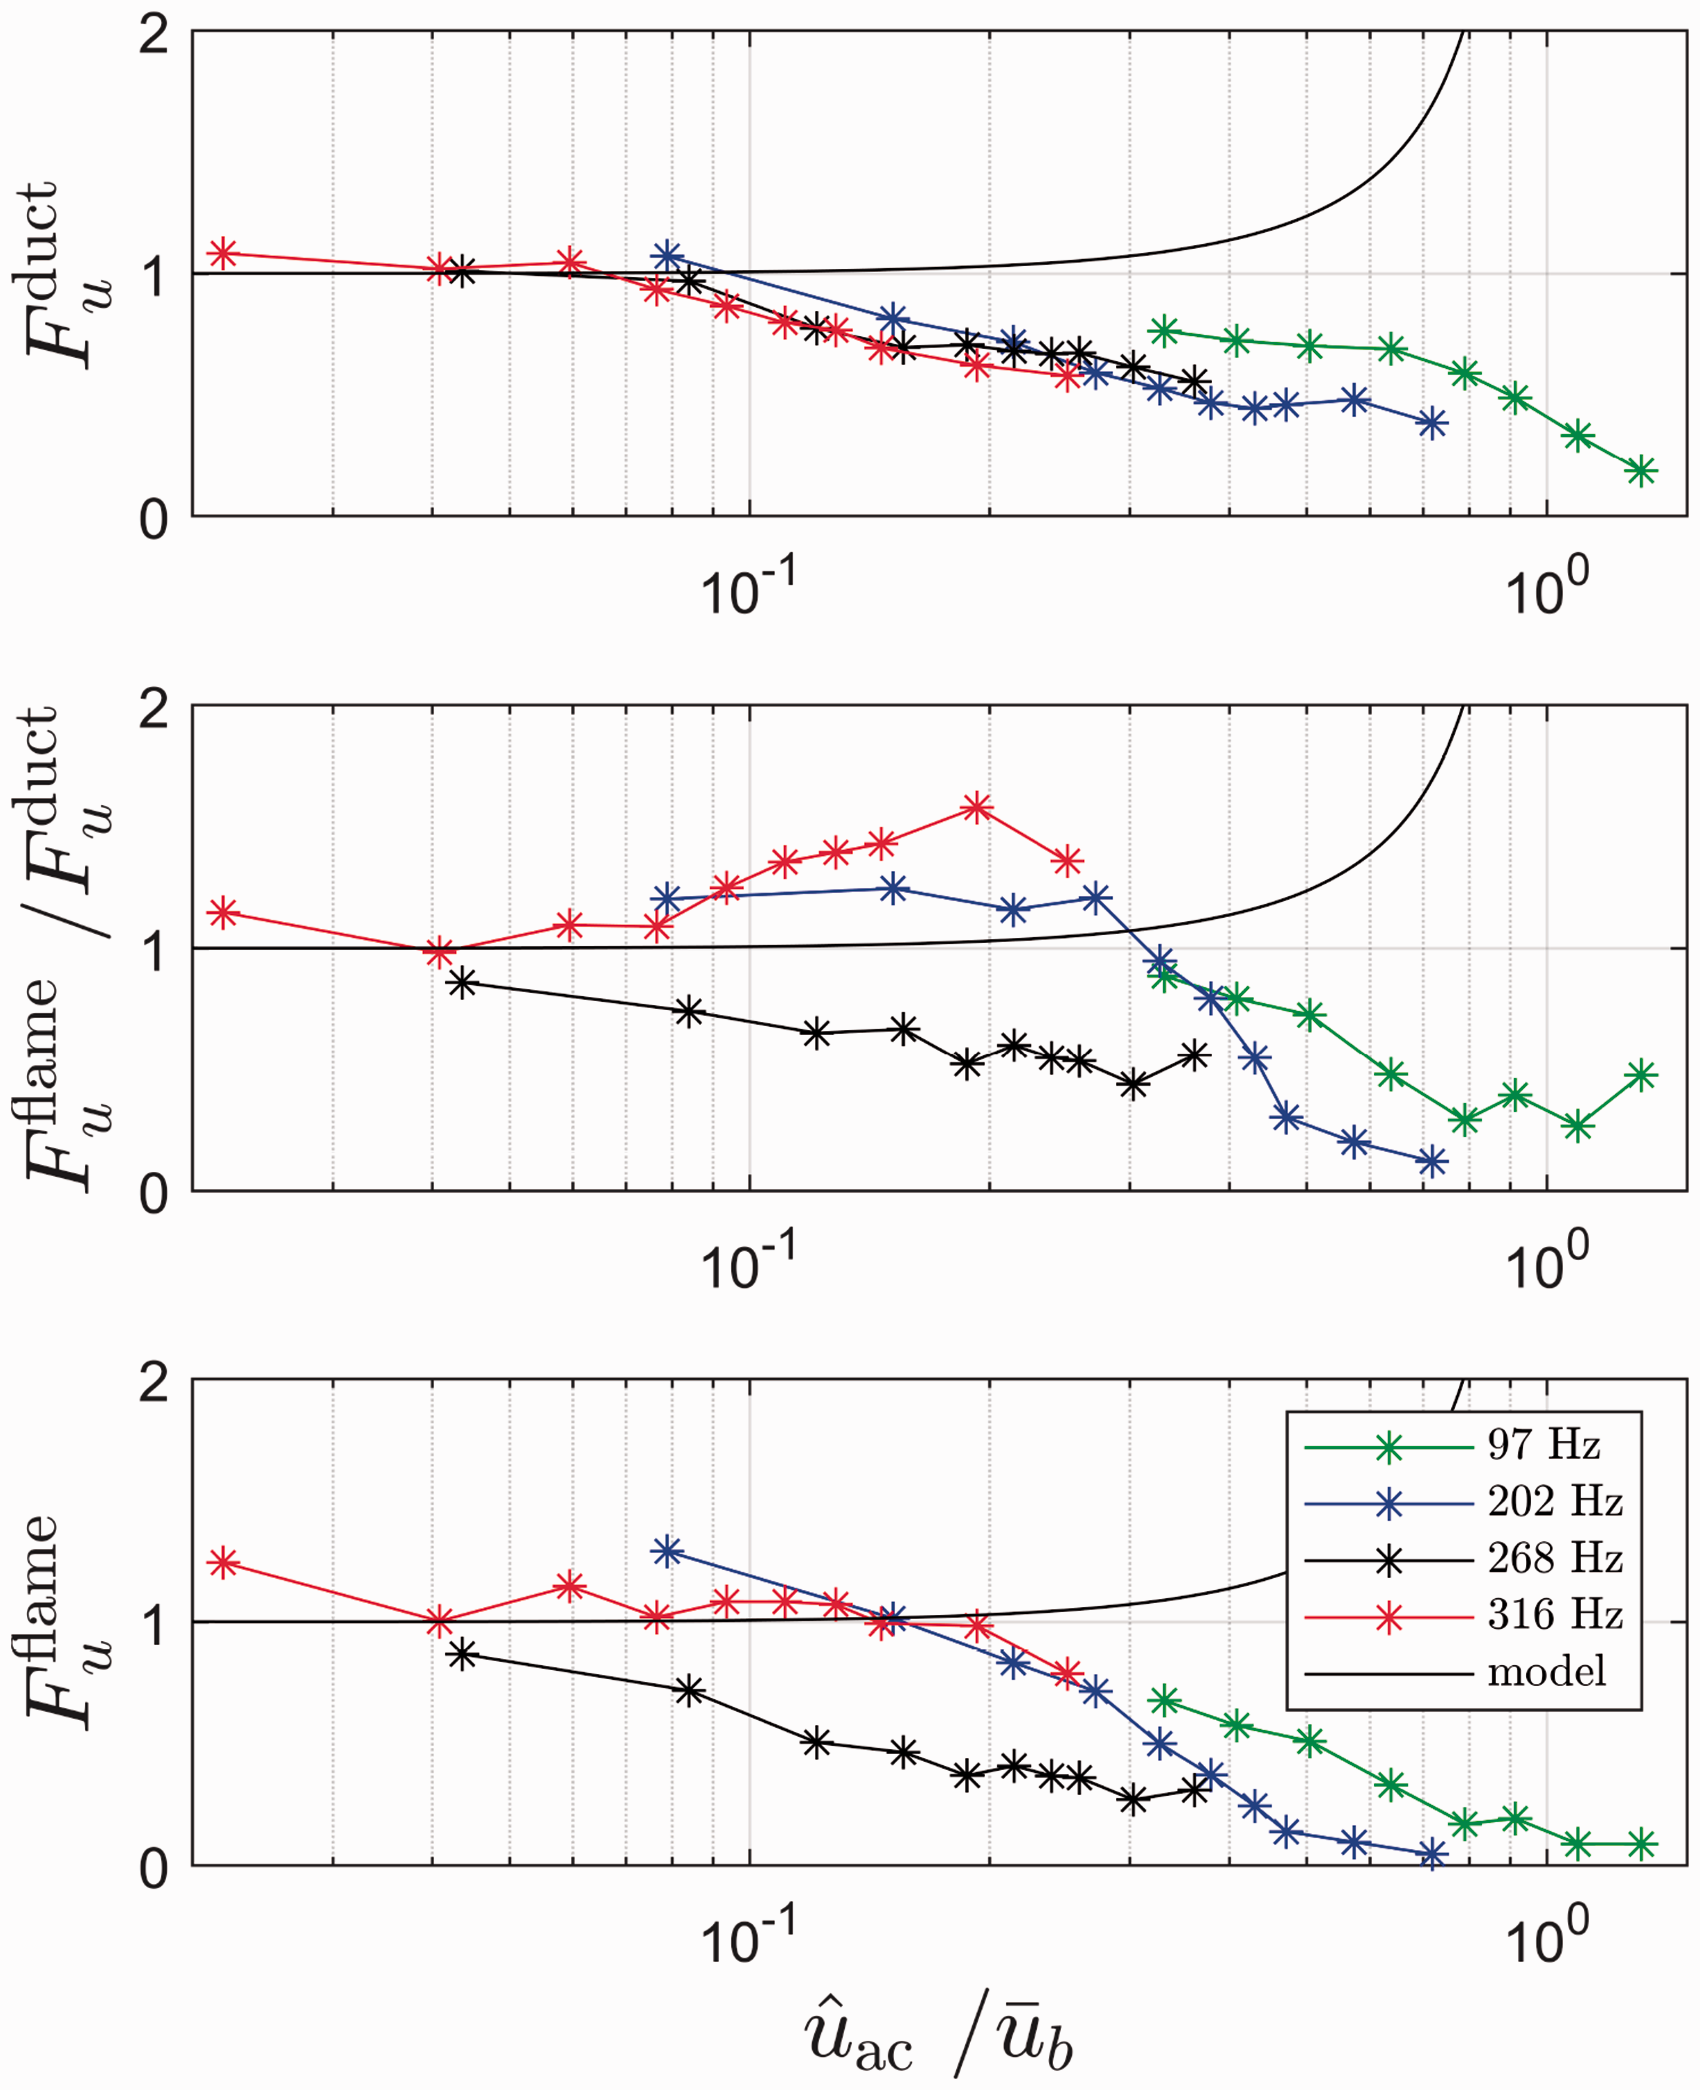
Comparison of different mixing transfer functions to analyze non-linear response to forcing amplitudes.
Considering the transfer function in the duct, first, (Figure 14 (top)) all of the different measurements (frequency cases) follow a similar trend: the gain values are constantly 1 until about
Considering the mixing transfer function between the duct and the flame next (Figure 14 (middle)), we observe a clear frequency dependence for the non-linear behaviour of the gain. For the lowest frequency case the gain saturates only at relatively high amplitudes somewhat in agreement with the gain values of the 202 Hz case. The 268 Hz case shows saturation at very low amplitudes starting at
Finally Figure 14 (bottom) shows the transfer function between acoustic fluctuations and
All the three presented transfer functions reveal a pronounced frequency dependence of saturating effects. The reasons underlying the different saturating mechanism can be enhanced turbulent diffusion and dispersion along with non-linear effects already triggered at the injector. The model prediction of an ever increasing gain for higher forcing amplitudes is not backed by the measurements. Moreover, the observed non-trivial frequency dependence of the mixing transfer function at higher forcing amplitudes cannot be represented by a 1D convection-diffusion process as given in equation (23), which would generally predict a decreasing gain with higher frequencies. Comparing the measurement results shown in Figure 14, both the 202 Hz as well as the 316 Hz cases produce gain values exceeding 1 in both diagrams. As mentioned earlier, a constructive interference between the
Summary and conclusions
The present work studies the generation and transport of temporal equivalence ratio fluctuations in acoustically forced, technically premixed swirl flames in regards to linear response and non-linear saturation. Different measurement techniques are employed to visualize interactions of local fuel ratio fluctuations and coherent vortical structures, both of which are affected by acoustic forcing and lead to global equivalence ratio fluctuations; among them PIV, chemiluminescence measurements, TDLAS, and MMM. The experimental results are compared to a 1D convection-diffusion model.
Through acoustic perturbations, phase-averaged, spatially resolved flow and equivalence ratio fluctuations are obtained to determine local and global mixing transfer functions inside the mixing duct between the injector and the flame and in the flame area.
The results show that for linear forcing amplitudes, the generation of equivalence ratio fluctuations at the injector is well approximated by a simple mode-conversion model, but it fails for non-linear forcing amplitudes. Measurements show a decay of equivalence ratio fluctuations with higher acoustic forcing amplitudes instead of an increase as predicted by the model. This strongly suggests a non-linear saturation process at the fuel injector which should be considered in future attempts to model the non-linear flame response.
The application of a 1D transport model shows that the average transport velocity of the equivalence ratio fluctuations between the injector and the flame is well approximated by the bulk flow velocity. Moreover, the model reveals a much higher effective diffusivity in the mixing duct than in the combustion chamber. This suggests that the length of the mixing duct strongly influences the phase and gain of the equivalence ratio fluctuations.
Considering the mixing process for non-linear forcing between the mixing section and the flame, the measurements reveal a decrease of local equivalence ratio fluctuations with higher forcing amplitudes. This suggests enhanced turbulent mixing induced by stronger acoustic forcing, which could be modelled by the 1D transport equation with an amplitude-dependent turbulent diffusivity.
However, considering the global equivalence ratio fluctuations for linear and non-linear forcing amplitudes, the experiments show an increase for the gain of the mixing transfer function, which cannot be explained by a 1D transport process.
The deviations are ascribed to interference patterns emanating from a two-dimensional and non-local interaction of coherent flow fluctuations and fuel fluctuations, which occur at linear and non-linear forcing amplitudes. Only for very low frequencies this effect seems negligible.
A simple time-delay analysis further allows to predict the interference pattern of the mixing transfer function and supports the relevance of coherent structures interfering with the transport of equivalence ratio fluctuations.
Future modelling should therefore address the two-dimensional non-local nature of the mixing process, which does not seem to be sufficiently characterized by an effective turbulent diffusion concept alone.
Footnotes
Acknowledgement
The authors would like to acknowledge Richard Blümner for assisting in the experimental work.
Declaration of Conflicting Interests
The author(s) declared no potential conflicts of interest with respect to the research, authorship, and/or publication of this article.
Funding
The author(s) disclosed receipt of the following financial support for the research, authorship, and/or publication of this article: This work was funded by the Research Association for Combustion Engines (Forschungsvereinigung Verbrenunngskraftmaschinen e.V. - FVV) and the German Research Foundation (DFG, grant number 247226395).