In this work, we numerically investigate the dynamics of a prototypical thermoacoustic system, the generalized Van der Pol oscillator, in the presence of additive noise of varying color (correlation time) and intensity while the system undergoes supercritical and subcritical Hopf bifurcation. We specifically investigate the influence of noise color on trends in the coherence factor and the Hurst exponent in the subthreshold region to assess their reliability as instability precursors. The Hurst exponent is found reliable only for correlation times much larger than the time scale of the instability while the coherence factor is found to be reliable for the entire range of noise color investigated. These inferences are found to hold for both supercritical and subcritical bifurcation cases.
Thermoacoustic instability, referred to as self-induced, large amplitude acoustic pressure oscillations in confined combustors, hinders the development of combustion systems such as industrial furnaces, gas turbines, and rocket motors. The onset of this instability, i.e., transitioning from a steady state to finite-amplitude limit cycle oscillations (LCOs), occurs with changes in combustor operating conditions (control parameter) such as temperature, Reynolds number, equivalence ratio, through either a supercritical1,2 or a subcritical2–4 Hopf bifurcation. These instabilities lead to undesirable consequences such as noise, flow fluctuations, and increased mechanical and thermal loading on the combustor, resulting in premature wear and catastrophic failures5. Therefore, predicting the onset of thermoacoustic instability is essential to prevent or reduce its detrimental effects in practical gas turbine combustors.
Such combustion systems are inherently noisy. The noise sources may include fluctuations in the flow field caused by turbulence or flow separation, fluctuations in the fuel-air supply systems and variations in heat release caused by unsteady combustion6,7. Hence, fluctuations in the pressure of a combustor always contain noise-induced features regardless of the presence of thermoacoustic oscillations. These inherent fluctuations, often called background (or combustion) noise, can act as both additive and parametric excitation sources to acoustic waves in combustors8. Noise-induced response of such systems have been previously reported to estimate growth/decay rates of thermoacoustic oscillations9–13, to cause a change in system’s stability margins8 and to cause triggering to instability in bistable region14–16. A detailed review of noise-induced dynamics in thermoacoustic systems is given by Kabiraj et al17.
Recently, noise-induced dynamics has been used to estimate certain parameters that exhibit a consistent change (either a monotonous increase or decrease) prior to the onset of thermoacoustic instability (i.e. when the system is in a stable state), termed as noisy precursors or early warning indicators. Monitoring the changes in these indicators helps detect a system’s proximity to thermoacoustic oscillations. In the thermoacoustic community, the commonly employed precursors are: (a) based on the spectral content of the pressure signal, which includes autocorrelation function18–20 and coherence factor2,21–23, (b) based on the critical slowing down phenomena which include variance18,19,24, (c) based on the probability distribution of time-series data which includes skewness and kurtosis19,20, and (d) based on the quantitative change in the complexity of the pressure signal such as permutation entropy20,25–27, multi-fractality19,28–30, and intermittency29–33. Near the Hopf bifurcation, the coherence factor increases with noise intensity, peaks at a certain optimum noise intensity, and decreases thereafter. This phenomenon is known as coherence resonance (CR)34,35. As the system approaches the Hopf bifurcation, an increase in the coherence factor acts as the precursor to instability. Similar to the coherence factor, precursors such as lag-1 autocorrelation, variance, skewness and kurtosis exhibit a monotonically increasing trend when approaching the impending instability. Multi-fractality28,36 indicates the degree of self-similarity in a time series by measuring its short and long time memory. As the system approaches the bifurcation point, loss in multi-fractality is observed, which indicates the impending instability and is quantified by the gradual decrease of Hurst exponent and singularity spectrum width. Permutation entropy20,26,27 and intermittency32 are also reported to decrease near the Hopf bifurcation, which acts as the precursors.
The reported literature on the precursors mentioned above either assumes the background (or combustion) noise to be white Gaussian or does not specify the type of noise present in the combustion system. However, experiments by Rajaram et al.37 and Nawroth et al.38 have shown that combustion noise from flames exhibits a non-zero correlation time and features specific spectral properties: The power spectral density (PSD) remains constant up to a cutoff frequency and then decays following the power law (). Here, represents the decay rate of power spectrum and is proportional to the noise color (or correlation time). The decay rate, , has been reported to vary with a variation in the combustor’s operating condition (such as equivalence ratio, temperature, Reynolds number, etc.)38 and its value lies within the range of 37,39. This implies that as the system approaches the thermoacoustic instability, with the variation in operating condition (control parameter), the noise correlation time of combustion noise is expected to vary, which affects the system dynamics. Waugh and Juniper14 have reported that pink noise is more effective than white noise in causing noise-induced triggering to instability in the bistable region of subcritical Hopf bifurcation. Bonciolini et al.40 and Vishnoi et al.13,41 have shown the importance of noise characteristics in system identification and have conclusively reported that the noise correlation time and its intensity significantly affects the estimation of growth rates of thermoacoustic oscillations. Noise correlation time have also been reported to affect rate-dependent tipping-delay phenomena, and any variations in noise correlation times are beneficial to dodging bifurcation20,42,43. Therefore, it becomes crucial to investigate the effects of noise characteristics- correlation time and intensity- on the noisy precursors to predict the impending thermoacoustic instability accurately.
In this direction, Li et al.44 have investigated the effects of noise correlation time and its intensity on the coherence factor analytically and numerically on a prototypical thermoacoustic system (Van der Pol system) exhibiting supercritical Hopf bifurcation. Li et al.44 had noted two main trends: (a) The optimum noise intensity exhibits linear dependence on noise color and (b) the coherence factor decreases monotonously with an increase in noise color below a threshold noise level while it exhibits resonance-like behaviour above the threshold noise level such that the optimal noise color increases as the system approaches the Hopf point. Recently, Vishnoi et al.45 have conducted an experimental investigation on an electroacoustic Rijke tube simulator exhibiting subcritical Hopf bifurcation and studied the effects of noise characteristics on coherence factor and Hurst exponent in the subthreshold region. Vishnoi et al.45 reported that the coherence factor is a reliable precursor at all noise correlation times and works well at most noise levels except for very low and very high levels. The authors also reported that the trends in the Hurst exponent are significantly affected by noise color. The authors have also validated their experimental results via simulations employing Rijke tube model with Galerkin modes.
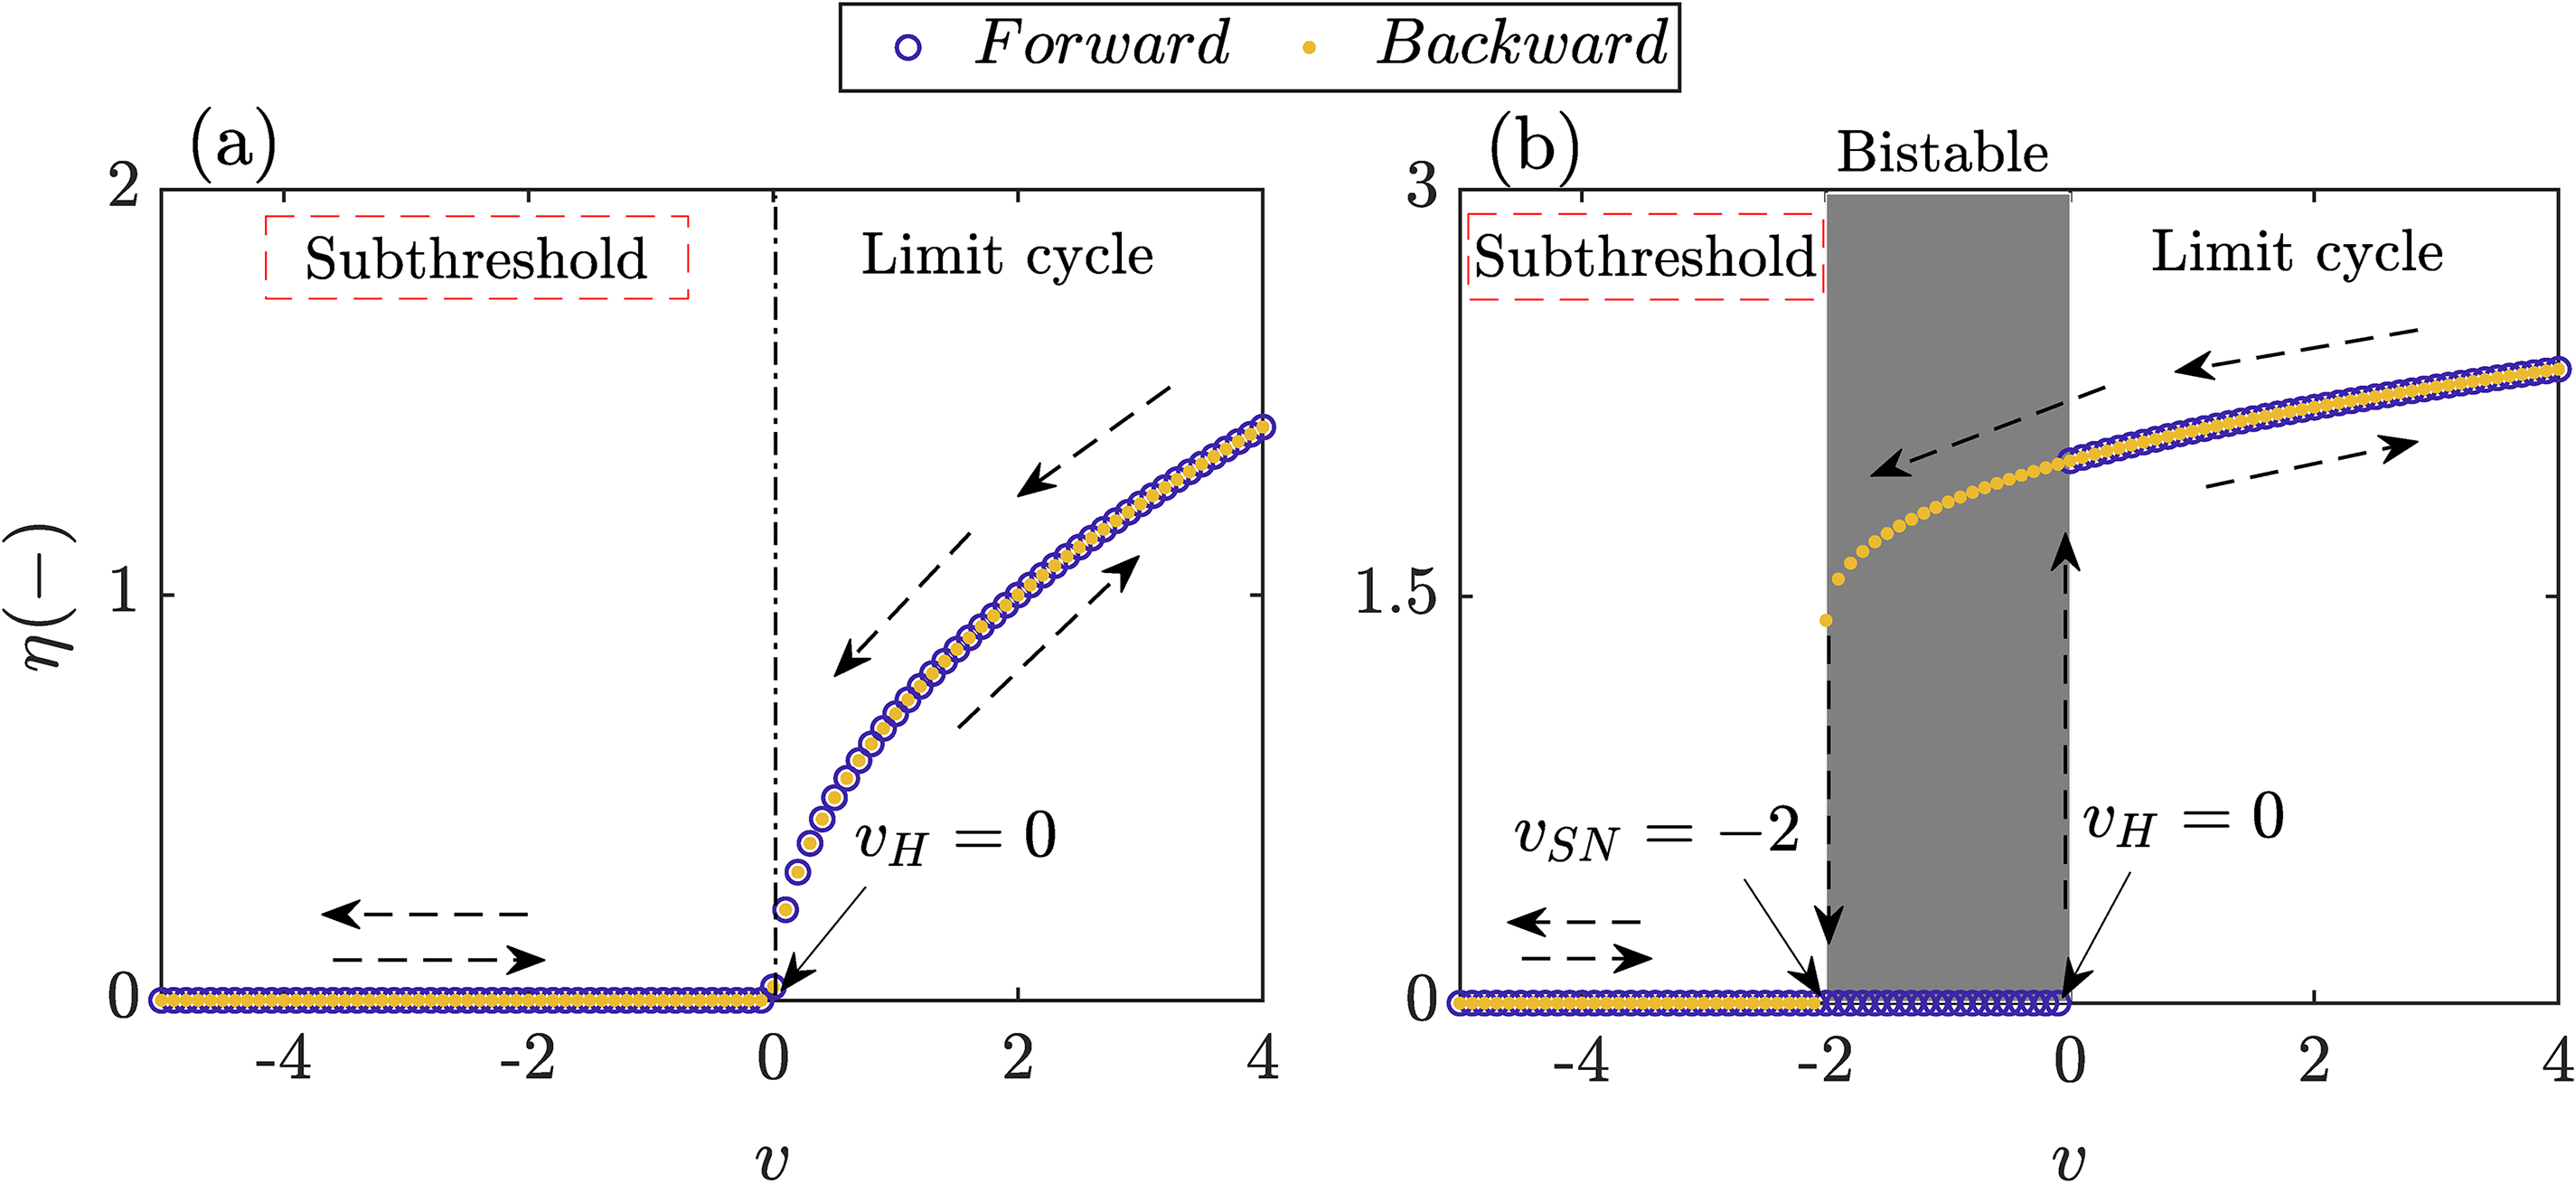
Motivated by the results of Vishnoi et al.,45 in this work we numerically investigate the noise-induced dynamics of a prototypical thermoacoustic system, the generalized Van der Pol oscillator, exhibiting both supercritical10 and subcritical Hopf bifurcation46 (Figure 1). The objective is to study the effects of noise correlation time and its intensity on two types of precursors: (a) Coherence factor and (b) Hurst exponent to identify their limitations and robustness to predict the onset of instability accurately. The investigation is performed in the subthreshold region, where the system is in a stable-steady state. This study provides insights for selecting appropriate precursors to be employed in practical systems, considering potential variations in noise and bifurcation variants.
Bifurcation diagram for noise-free Van der Pol oscillators with as the control parameter: (a) Supercritical Hopf bifurcation; (b) subcritical Hopf bifurcation. The dashed arrows indicate system’s response as is varied in forward (blue markers) and backward (yellow markers) direction. The Hopf point in plots (a) and (b) and the saddle-node point in plot (b) are observed at and , respectively. The grey area in plot (b) shows the bistable region (). The subthreshold regime is the area of interest for studying noise-induced dynamics.
This paper is divided further into three sections. the ‘Model description and methodology section describes the numerical model of Van der Pol oscillator, noise model and methodology for estimation of precursors (coherence factor and Hurst exponent) employed in this paper. In the ‘Results and discussions section, we present the results of the influence of noise color and its intensity on the noisy precursors. We then conclude our study in the ‘Conclusions section.
Model description and methodology
The Van der Pol oscillator – a prototypical thermoacoustic system
In this work, we employ the Van der Pol oscillator model, which is well-established for capturing the occurrence of thermoacoustic instability within combustion chambers. Van der Pol oscillator has been previously employed to study system identification10,11,40, stochastic bifurcations47, rate-tipping delay phenomenon20,42,48 and noise-induced CR2,44. The governing equation corresponding to the dominant frequency of a system in a generalized form is given as10:
where, the left-hand side ( is the modal amplitude; is the eigenfrequency; is the damping coefficient) represents the acoustic part and the right-hand side () represents the heat release rate fluctuation that acts as the driving term for the acoustic oscillations. is a function of acoustic fluctuations () and models thermoacoustic feedback in a combustor. A linearly stable system (with no oscillations) can undergo a transition to thermoacoustic instability (self-sustained LCOs) either via a supercritical Hopf bifurcation or a subcritical Hopf bifurcation depending on how the heat release fluctuation term which will be a nonlinear function of and .
For supercritical system, can be expressed as2,10,11,46,
while, for subcritical system, can be expressed as46,49,
where is the driving parameter; and are two positive coefficients. On substitution of the expressions for in Equation (1), we obtain
for supercritical Van der Pol system and,
for subcritical Van der Pol system. and is accountable for the linear growth/decay of acoustic oscillations (control parameter).
The stochastic differential equations of the two respective systems are given as,
where, represents the additive noise term.
The Van der Pol systems (Equations (6) and (7)) are numerically simulated using the fourth-order Runge-Kutta method in Matlab. We use the time step of in the time span of . For the analysis, we use data for last . We choose the system parameters as , , and following the experimental validation reported in Bonciolini et al46.
In the absence of noise (i.e., ), as the control parameter, is varied from to , the two systems undergoes transition to the instability through supercritical and subcritical Hopf bifurcations respectively, with Hopf and saddle-node points observed at and , as shown in Figure 1. The region before the Hopf point () in Figure 1(a) and the saddle-node point () in Figure 1(b) is referred to as the subthreshold (or stable) region. In case of subcritical system (Figure 1(b)), a bistable region exists for where two stable states coexist: Focus and LCOs. In the present work, the region of interest in the bifurcation diagram is the subthreshold region as we intend to investigate the effects of correlated noise characteristics on the precursors of thermoacoustic instability (prior to its occurrence).
Colored noise model
To investigate the noise-induced response of the systems, we first model as the white Gaussian noise. This model simplifies analytical derivations significantly and has been used in most of the studies on stochastically forced thermoacoustic limit cycles10,12. Secondly, to investigate the effects of correlated noise characteristics (correlation time and intensity) on the system’s response and the precursors, we model as the Ornstein Uhlenbeck (OU) process which satisfies the following Langevin equation40,44:
where is the noise correlation time (noise color) and controls the cutoff frequency. is the noise intensity, and is the white noise of intensity, . The power spectrum of is given as:
In the limit and , we get . Thus, white noise is a limiting case of the OU process: the smaller the , the closer is to white noise.
We present a quantitative comparison in the noise-induced response of the Van der Pol systems (Eqn. (6) and (7)) when is modelled as both white and OU noise. For this comparison, we set a criterion regarding the input power for both the type of noise: the powers provided by white and OU noise in a band (denoted by ) around the system’s eigenfrequency, , are kept equal40, i.e.,
In this case, the intensity of is adjusted by , evaluated using the following expression40
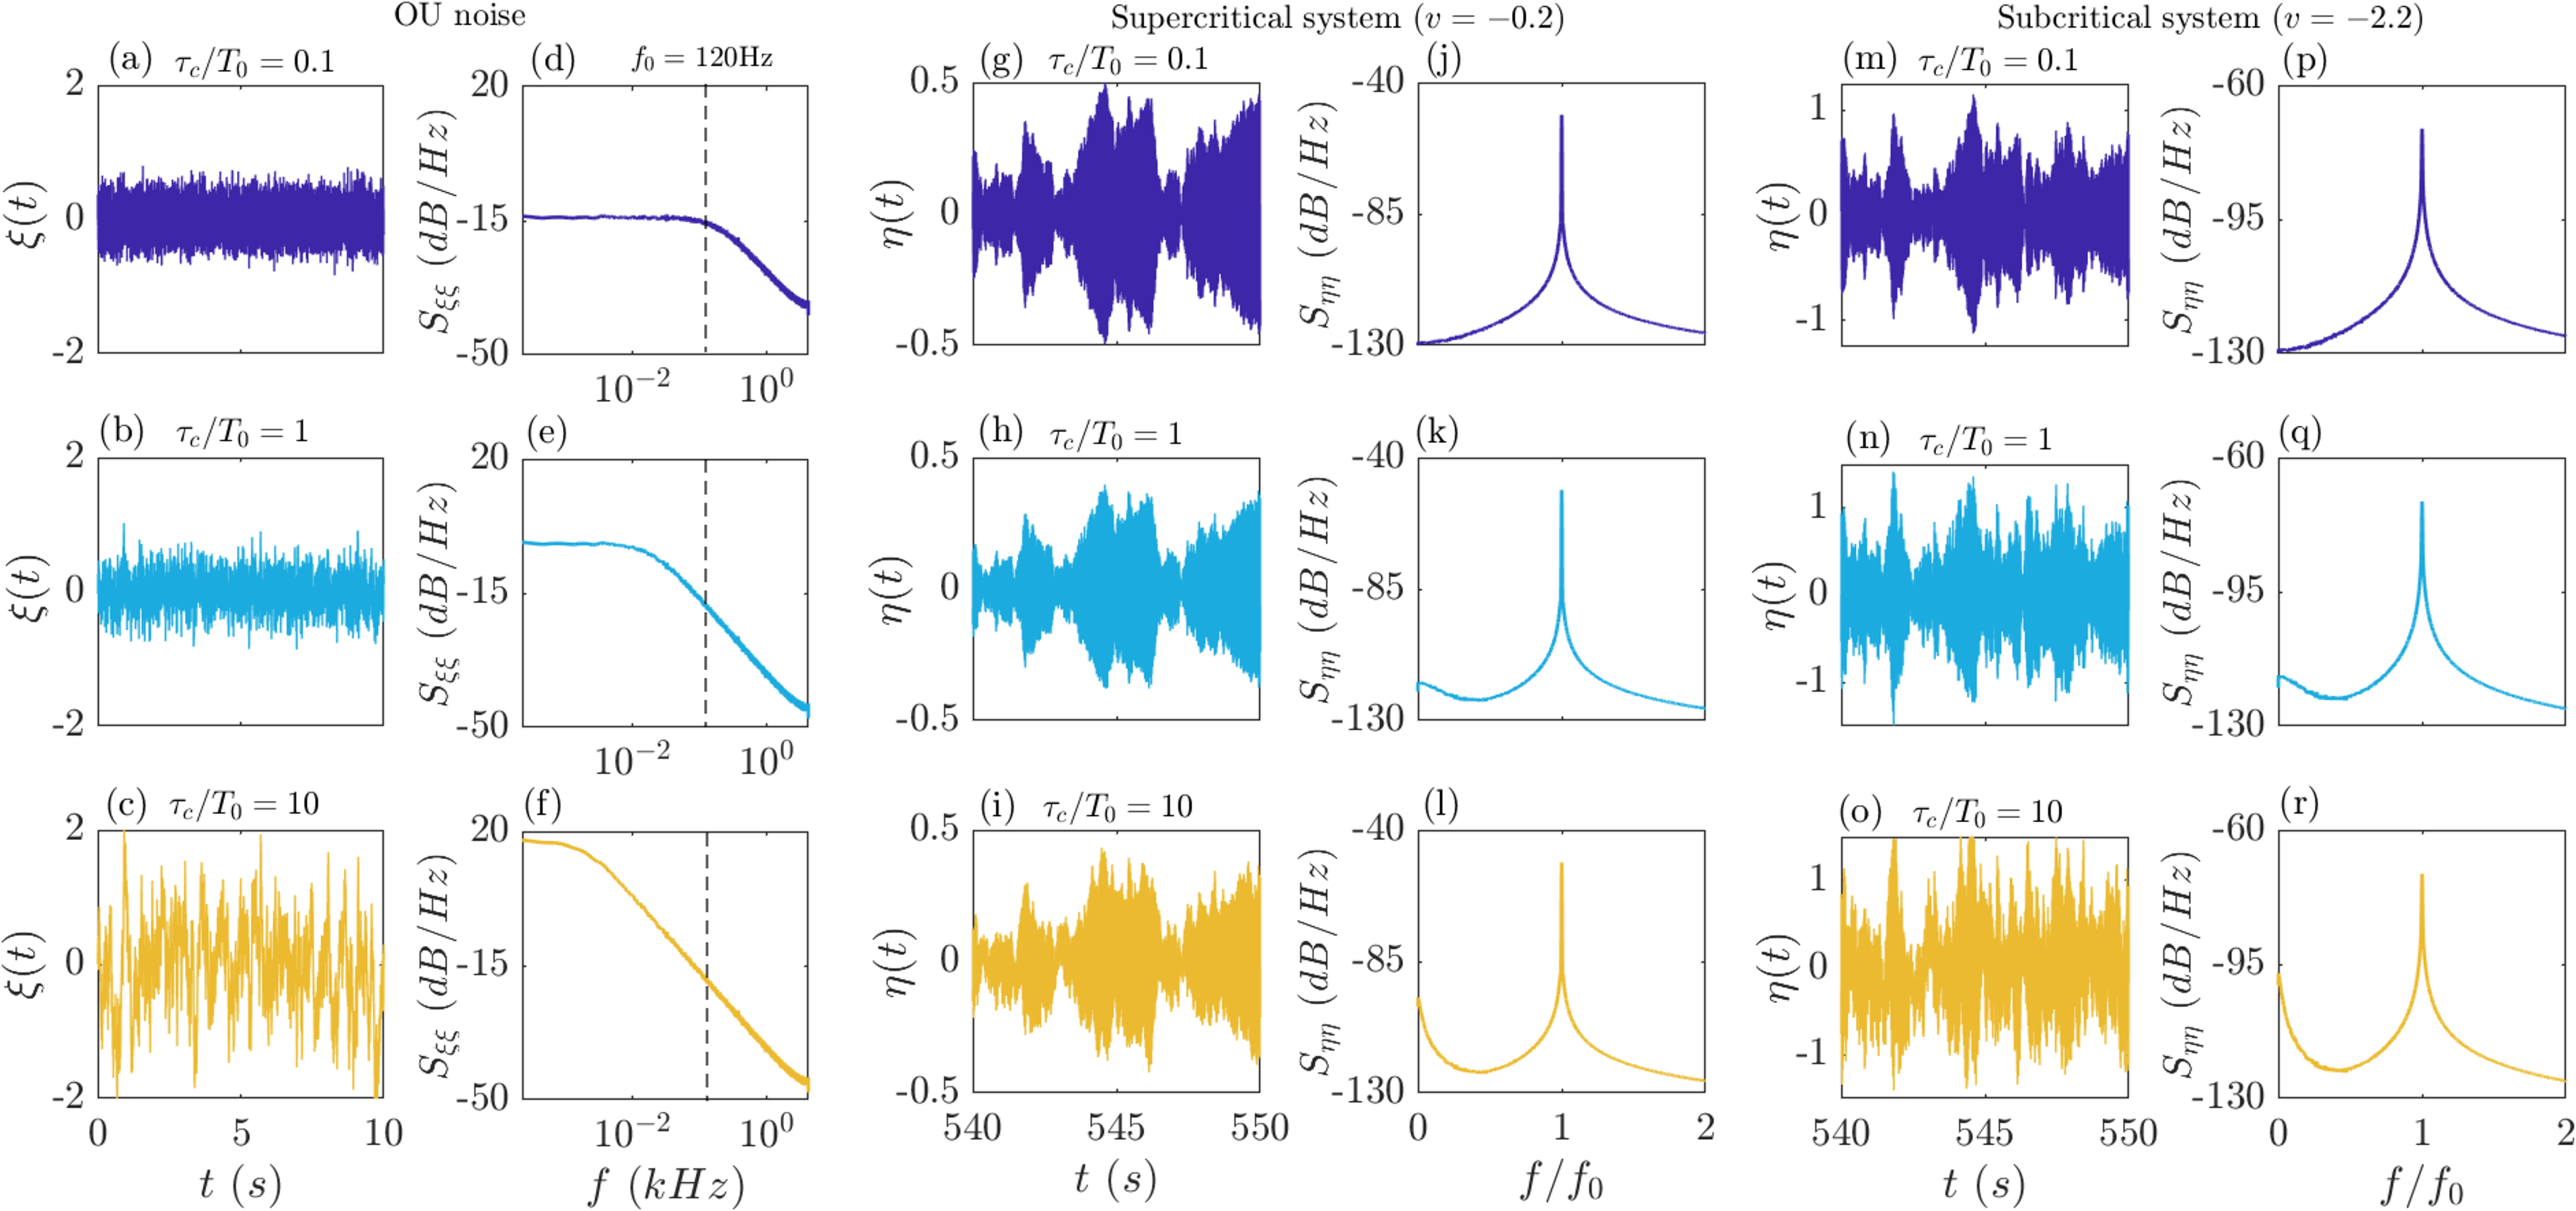
In the present work, we choose to isolate the system’s fundamental frequency. We vary noise correlation time as , where is the acoustic time period. In this study, correspond to . An illustration of OU noise features (time series and power spectrum) and the corresponding response of the two Van der Pol systems (time series and power spectrum) in the subthreshold region ( for supercritical system and for subcritical system) at varied noise correlation times are shown in Figure 2.
Illustration of Ornstein Uhlenbeck (OU) noise features and corresponding system response: OU noise time series (a-c) and its corresponding power spectrum (d-f) for three noise correlation times ( and ). The dashed line in plots (d-f) shows the eigenfrequency of the Van der Pol systems. is normalized by the time period of oscillations (). Plots (g-l) shows the time series (system’s response) and corresponding power spectrum for supercritical Van der Pol system at ; while plots (m-r) shows the time series (system’s response) and corresponding power spectrum for subcritical Van der Pol system at .
Methodology
This section briefly presents the methodology employed to estimate the noise-induced precursors of thermoacoustic instability. We specifically focus on two types of precursors: (i) based on spectral content (coherence factor) and (ii) based on fractal signature (Hurst exponent).
Coherence factor
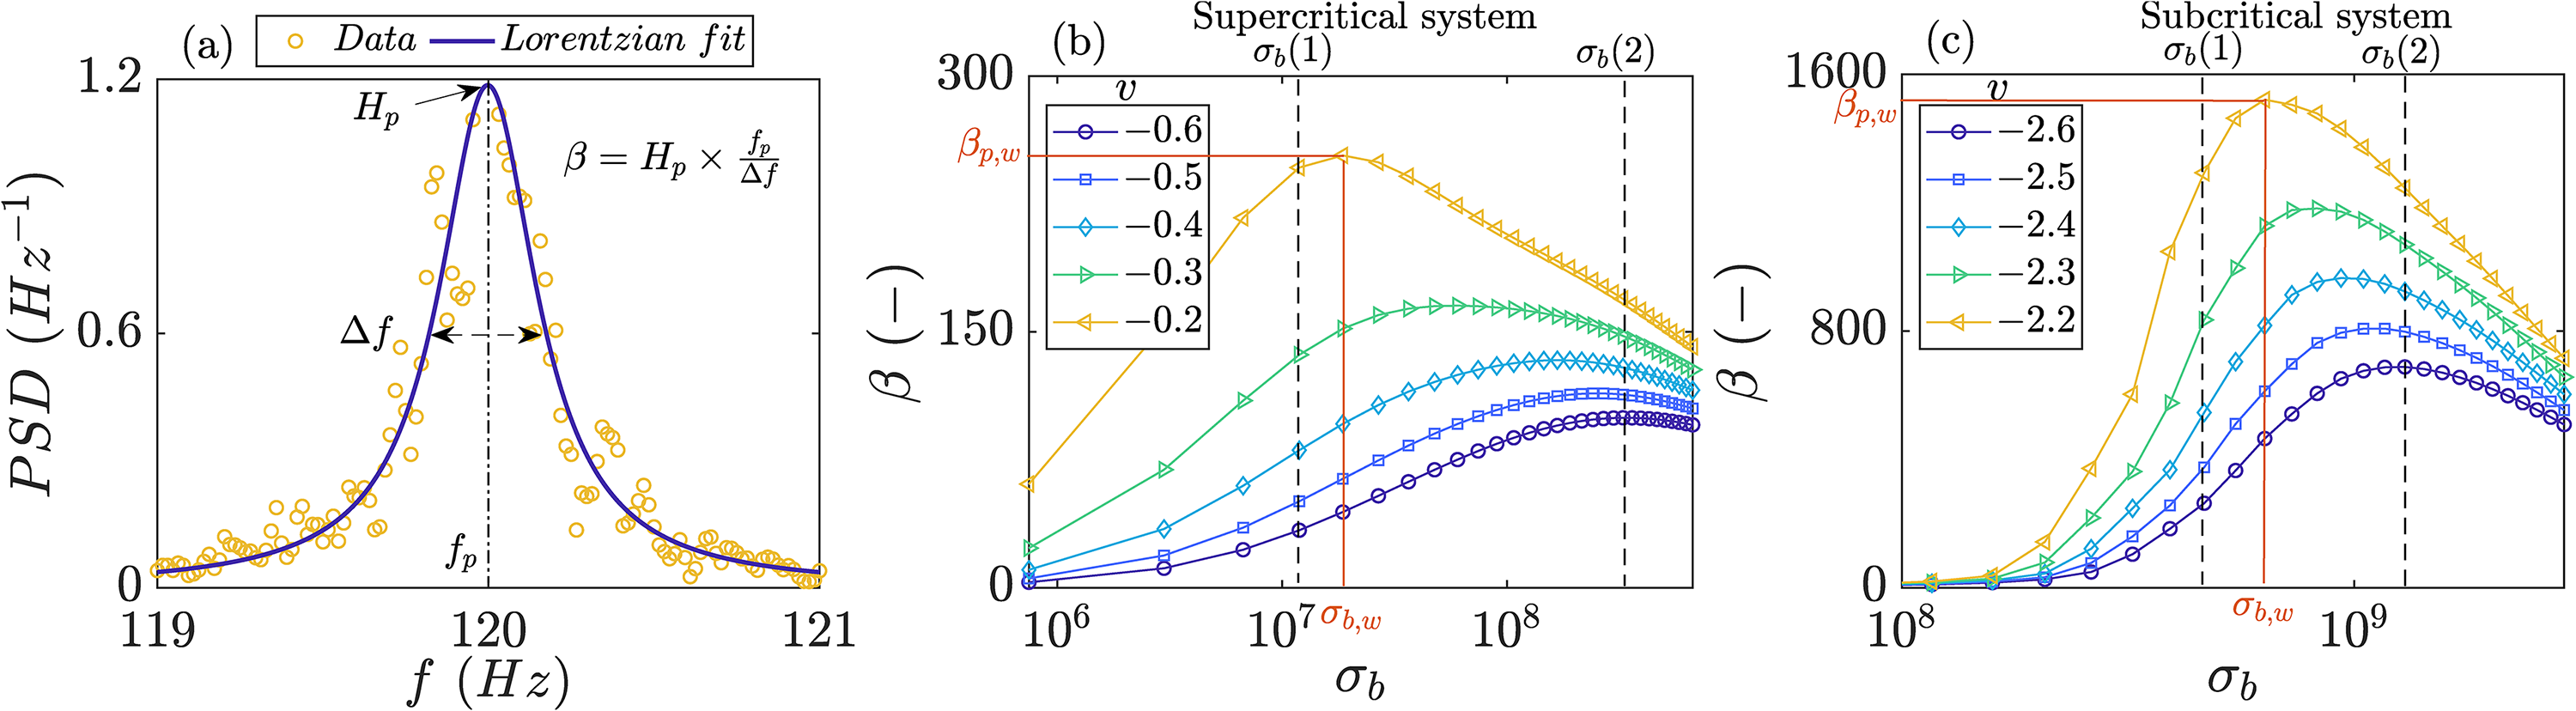
Coherent oscillations are induced by noise in a stable oscillator prior to the Hopf bifurcation such that the relative contribution from coherent oscillations in system response (a) increases as the system is brought closer to bifurcation and (b) exhibits a resonance-like behaviour with increasing noise intensity. This phenomenon is known as CR50,51 and is observed in several practical systems, including thermoacoustic systems2,21,22. The noise intensity at which peak coherence is induced is termed as the optimum noise intensity for CR. The induced coherence is quantified by coherence factor, ,35 defined as the ratio of spectral peak height to the spectral quality factor and is given as,
where and are the height and normalized width (normalized by the peak frequency) of a Lorentzian fit to the broad spectral peak; the width is measured at half the height of the peak of the fit as illustrated in Figure 3(a).
White noise driven Van der Pol systems: (a) An illustration for estimation of coherence factor, from the power spectrum of time series in the subthreshold regime. represents the spectral peak, represents the full width at half maximum, and represents the peak frequency. The markers represent the simulation data while the solid black line is the Lorentzian fit to the data for estimation of . Plots (b) and (c) show the variation of coherence factor () as a function of i.e. white noise intensity within and control parameter () for supercritical and subcritical systems respectively. The effect of noise color on coherence factor is shown at and (marked in red color) for both the systems respectively in the subsequent discussions. The effects of noise intensity on the two types of noise-induced precursors are discussed at and .
Hurst exponent
We estimate the Hurst exponent by performing detrended fluctuation analysis (DFA)52. For the implementation of DFA, firstly, the noisy-time series is divided into equal-sized, non-overlapping windows (segments) of size followed by the subtraction of a polynomial fit of order from the profile of each window (detrending process). We choose , which limits the smallest scale via . Then, a root-mean-square (RMS) fluctuation is computed for each window to capture the magnitude of the local fluctuations in the signal. The local RMS is subsequently averaged over all the windows. The relationship between the average fluctuation and the segment size is examined by plotting them on a logarithmic scale, the slope of which gives the scaling exponent (. The scaling exponent is then related to the Hurst exponent () as if and if .
In general, a time series will have a noise-like structure when and a random walk-like structure when 53. A time series will have a correlated structure when and an anti-correlated structure when . White Gaussian noise has an uncorrelated structure for which .
Results and discussions
Effects of noise color and intensity on coherence factor
Figure 3(b) and (c) present the variation of the coherence factor () against the white noise intensity within the band () in the subthreshold region for supercritical and subcritical Van der Pol systems respectively. The phenomenon of CR2,21,35 can be observed from the two plots: (a) For each control parameter (), coherence factor increases with noise intensity, peaks at a certain optimum noise intensity, and decreases thereafter; (b) The optimum noise intensity, at which the peak coherence is induced, decreases as the control parameter, , is increased towards the Hopf point; and (c) For a given noise intensity, coherence factor increases as the two systems approach the Hopf bifurcation.
In Figure 3, although exhibit similar variation with for both the systems, the mechanisms generating the peaks in differ between the two cases: for supercritical system, the peak in arises from a competition between a monotonic increase in and with increasing ; whereas the peak in for subcritical system is a result of co-occurrence of a maximum in and a minimum in at optimum . These results concur with the numerical investigation of Gupta et al.2.
Figure 4(a) and (c) show the variation of coherence factor with noise color and intensity at for supercritical system and at for subcritical system, respectively (control parameter values closest to the Hopf bifurcation, marked in red color in Figure 3). The x-axis is normalized by optimum white noise intensity (), and the y-axis is normalized by the peak value of coherence factor () at the respective control parameters, marked in Figure 3. We observe the occurrence of CR at all values of noise correlation times: attains a peak value at intermediate noise levels. We observe that, for a given , the optimum noise intensity (corresponding to peak coherence) first increases with an increase in noise color up to and then decreases with a further increase in noise color. The variation of optimum noise intensity with noise color is more significant in the subcritical system than in the supercritical system because of high-order non-linearity.
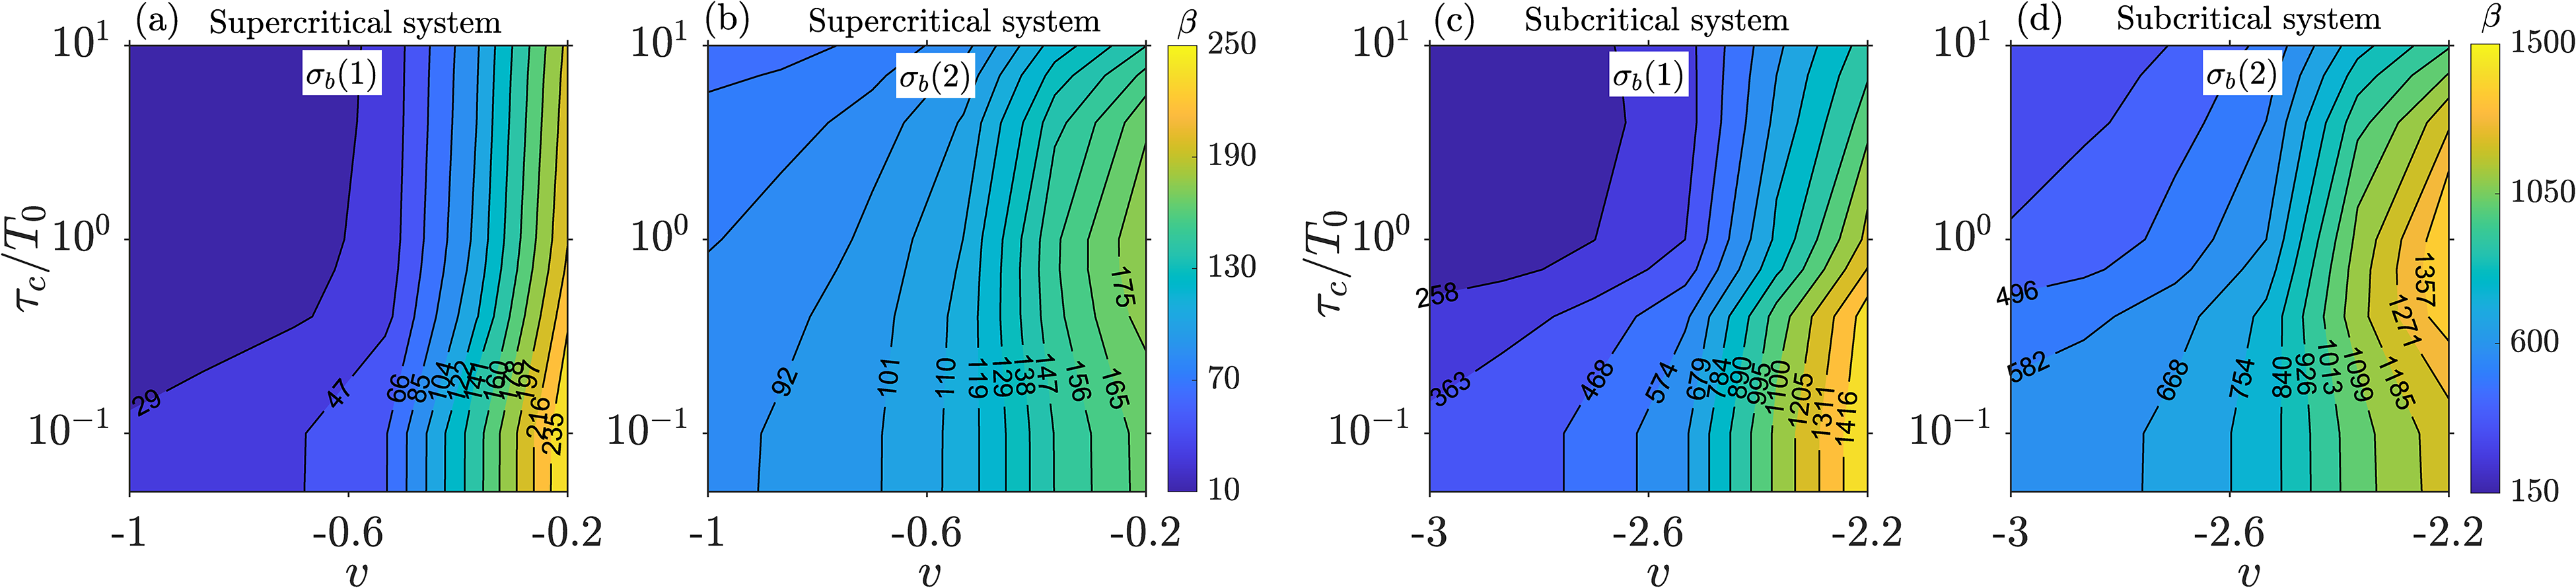
White and OU noise driven Van der Pol systems: Variation of coherence factor () as a function of , i.e. noise intensity within and noise correlation time () for (a) supercritical system at and (c) subcritical system at . and correspond to the optimum white noise intensity and corresponding maximum CR at specified control parameter values, marked in red color in Figure 3. Plots (b) and (d) represent the variation of peak value of coherence factor () in the parameter space, – , for supercritical and subcritical systems respectively. is normalized by the time period of oscillations ().
Figure 4(b) and (d) show the variation of the peak value of coherence factor () with noise color and control parameter for supercritical and subcritical systems, respectively. We observe that, for a given , the peak coherence decreases with an increase in noise correlation time. Although this trend holds for both systems, this decrease in is faster in the subcritical system than in the supercritical system. This decrease in with an increase in implies that noise color constantly deteriorates the quality of induced coherence. This observation is also reported by Brugioni et al.54 for an excitable electronic system whose dynamics obey the FitzHugh-Nagumo model system. Furthermore, we also observe that, for a given , increases monotonously as the two Van der Pol systems approach the Hopf bifurcation.
Figure 5 shows the variation of coherence factor with noise color and control parameter at two noise intensities ( and ) marked in Figure 3 for both supercritical (plots (a,b)) and subcritical (plots (c,d)) systems. We observe that, at low noise levels (i.e., at ), for a given , decreases with an increase in noise color for both systems. At high noise levels (i.e., at ), decreases with increase in noise color at all for supercritical system and for subcritical system and thereafter shows a resonance-like behaviour with for all : first increases with increase in , attains a peak near , and then decreases with a further increase in . Far from the Hopf bifurcation, the variation in is too small to distinguish a trend in the contour plots, especially at low noise levels. In such cases, the peak coherence is induced at very large noise intensities.
Variation of coherence factor () as a function of control parameter () and noise color () at two noise intensities ( and , marked in Figure 3) for (a, b) supercritical and (c, d) subcritical Van der Pol systems. is normalized by the time period of oscillations ().
Further, from Figure 5, we observe that, for a given noise color and intensity, coherence factor increases as the two systems approach the Hopf bifurcation. The coherence factor, therefore, indicates the approaching Hopf point when noise color and intensity do not change. The extent of the increase in coherence factor, however, depends on noise color and intensity, even if they do not vary. Thus, the implementation of coherence factor requires calibration for individual combustion systems based on the characteristics of the background noise.
For the subcritical system, the trends in coherence factor emerging from the Van der Pol oscillator qualitatively agree well with the experimental works of Vishnoi et al45. The coherence factor decreases with increase in noise color at low noise levels, while it shows a resonance-like behaviour with noise color at high noise levels, specifically in the vicinity of Hopf bifurcation.
Effects of noise color and intensity on Hurst exponent
Figure 6 shows the variation of Hurst exponent with noise color, intensity and control parameter for both supercritical (plots (a,b)) and subcritical (plots (c,d)) systems. We can note that the value of falls within the range of for all and . This suggests that the time series from both systems exhibit an anti-correlated signature. We observe that, for a given , Hurst exponent increases with an increase in noise color for both systems. The Hurst exponent rises as the noise intensity increases in a supercritical system but decreases in a subcritical system. Further, when noise color and intensity are kept constant, Hurst exponent decreases as both the systems approach the Hopf bifurcation.
Variation of Hurst exponent () with control parameter () and noise correlation time () at two noise intensities ( and , marked in Figure 3) for (a, b) supercritical and (c, d) subcritical Van der Pol systems. is normalized by the time period of oscillations ().
In real systems, a minimum threshold value of the Hurst exponent at a suitable distance from the Hopf point needs to be defined to track the system’s proximity to the Hopf bifurcation28. There are no standard criteria to set the minimum threshold value; hence, it varies among systems, whether experimental or simulation. From Figure 6, we observe that for all , the decrease in Hurst exponent is too small to distinguish a clear trend. Only at high noise correlation times could the threshold values be effectively defined. Further, we observe that a slight change in noise color (for example, to ) as is increased towards the Hopf point, causes significant variation in , which can result in non-monotonous trends. This has also been reported in the experimental works of Vishnoi et al.45 for the subcritical system: in the vicinity of the saddle-node point, the Hurst exponent show non-monotonous trends with changes in the control parameter up to .
Robustness of the noise-induced precursors
In practical combustion systems, inherent noise may deviate from the white noise assumption. Moreover, inherent noise, characterized by its color and intensity, may vary as the operating conditions are varied. Both these effects must be considered to detect the system’s proximity to thermoacoustic instability. Figure 7 shows the comparison between the two types of precursors investigated in this work – coherence factor and Hurst exponent – as a 2D map in the – plane for both supercritical (Figure 7(a), (c) and subcritical (Figure 7(b), (d) systems at in the subthreshold region. The dashed arrows roughly indicate the prominent direction of variation in and as the control parameter and noise color are varied. We observe from Figure 7(a) and (b) that changes in coherence factor are predominantly due to control parameter variation for both, supercritical and subcritical systems. Hence, the coherence factor will serve as a robust precursor even when noise characteristics vary with simultaneous changes in the control parameter.
Robustness of the noise-induced precursors: Variation of coherence factor (a, b) and Hurst exponent (c, d) as a function of and at for supercritical (a, c) and subcritical (b, d) Van der Pol systems in the subthreshold region. is normalized by the time period of oscillations (). The arrows roughly indicate whether the variation in and is mainly in the direction of noise color or control parameter.
We observe from Figure 7(c) and (d) that changes in Hurst exponent are predominantly due to changes in noise color rather than the control parameter for . The observation implies that the Hurst exponent can only be employed as a precursor at large noise correlation times, i.e. when . Examples for previous successful implementation of the Hurst exponent as a precursor include Nair et al.,28,55 Unni et al.,56 and Fu et al.,30 where the transition to periodic oscillations is reported to occur via intermittency. In these aforementioned studies, noise color may have satisfied the criterion for correlation time. It is also possible that the change in Hurst exponent is due to a combined effect of noise color variation and parameter variation, but was ascribed to the parameter. For instance, with reference to Figure 7(d), simultaneous increase in control parameter and decrease in noise color will result in a prominent monotonous decrease in the Hurst exponent. Whereas, the use of the Hurst exponent in an experiment where noise color increases with increase in parameter will lead to a much smaller decrease – or even an increase – in the Hurst exponent with increase in control parameter. Such an experiment on the Hurst exponent as an instability precursor would likely be considered as inconclusive, but as we see here, such trends are a manifestation of the effects of noise characteristics.
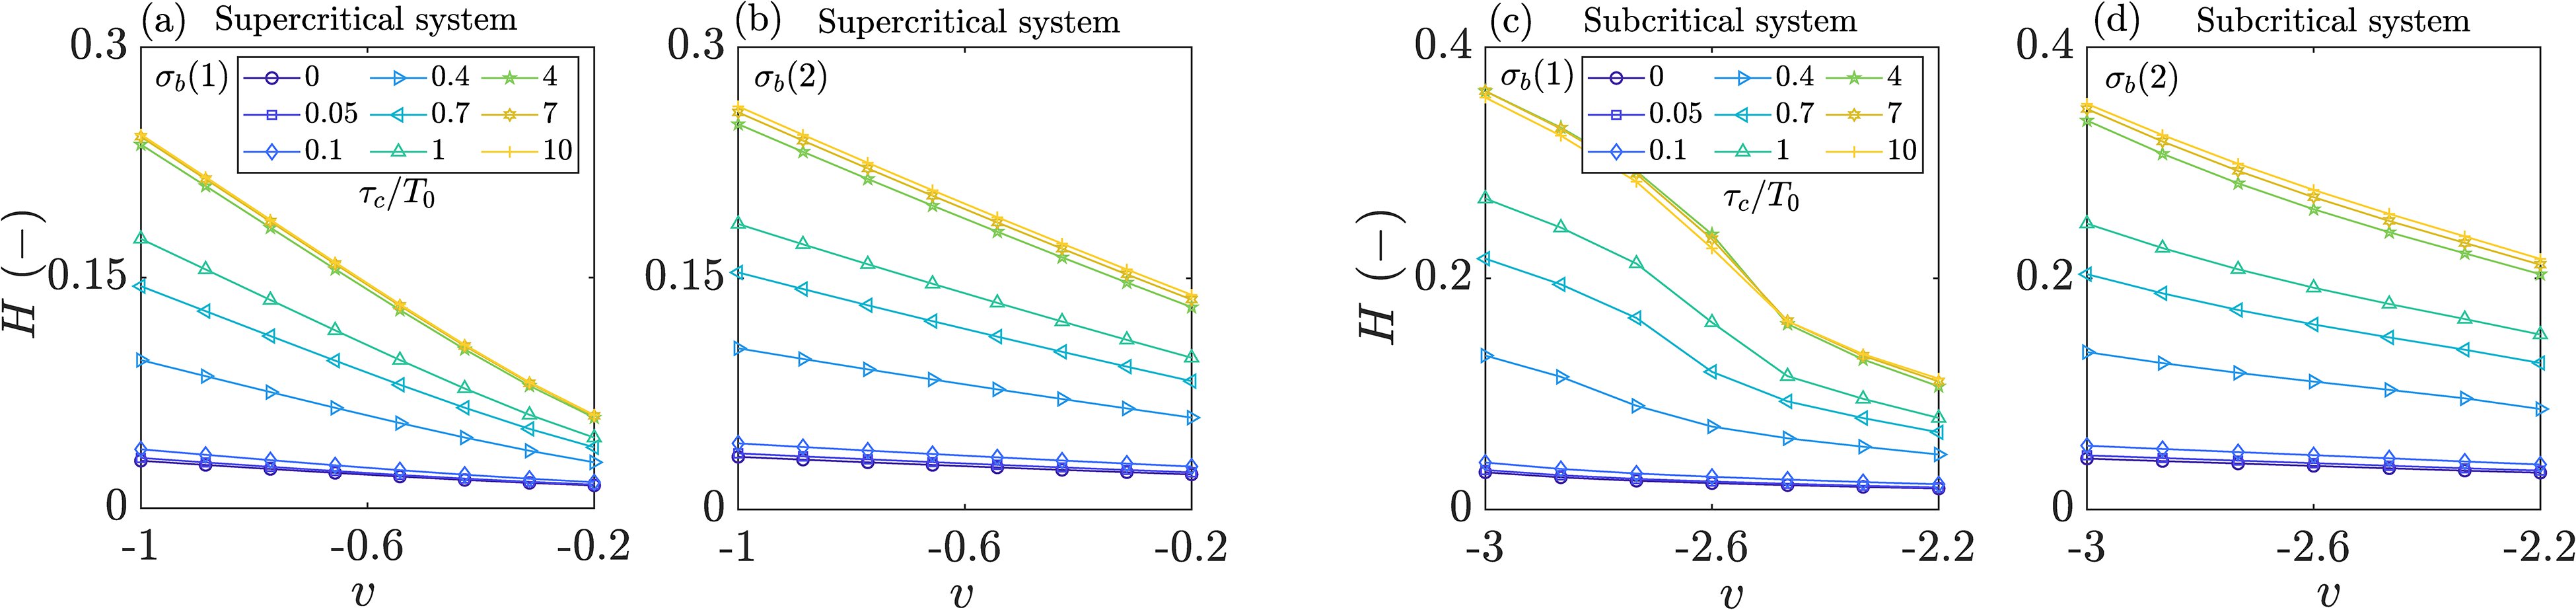
In practical combustion systems, the flame response to the acoustic forcing can occur after a time delay (), as shown in Bonciolini et al.49,57,58. In Appendices A and B, we show the effect of the time delay on the trends in the noise-induced precursors. In case the time delay of flame response is not negligible, we find that the coherence factor will work at most time delays and noise color, while the trends in the Hurst exponent are mostly dependent on the noise color of additive noise (i.e., ) than the time delay. We emphasize, however, that the inclusion of time delay as a parameter of the study and the additional (in addition to additive noise) source of multiplicative noise through noise in the time delay significantly increases the complexity of the stochastic dynamics of the system. More comprehensive dedicated studies are necessary; the results presented in the appendix are thus of a preliminary nature.
Conclusions
The study presents a numerical analysis of a prototypical thermoacoustic system, the generalized Van der Pol oscillator, with additive colored noise of varying correlation time and at intensity. Trends in instability precursors in response to changes in control parameter and noise color in the subthreshold regime are dependent on the definition of the precursor. We investigated two types of instability precursors: the coherence factor, which is estimated from the power spectrum; and the Hurst exponent, which depends on temporal correlation within noisy time series. The two measures have been previously proposed to have practical relevance as precursors of instability in practical thermoacoustic systems such as gas turbine combustors. In practical systems, the inherent/background noise characteristics may change depending on the system and even for any given combustor as the operating conditions change. Thus, the identified differences in trends provide a basis for commenting on the reliability of the coherence factor and the Hurst exponent as instability precursors. We draw the following conclusions regarding the effect of noise features, parameter variation, and the type of bifurcation from our study:
Concerning noise-induced coherence, noise correlation time affects the system response in such a way that peak coherence is induced at higher noise intensities compared to white noise forcing. The peak coherence factor also reduces in magnitude with correlation time. These changes are small for supercritical Hopf bifurcation but pronounced for subcritical Hopf bifurcation.
As a consequence of the effect of noise color, coherence factor () changes with increase in noise color: far from the bifurcation, decreases with noise color regardless of the noise intensity and bifurcation type. As system approaches the bifurcation, decreases with noise color when noise intensity is low while it exhibits resonance-like behaviour with noise color at high noise levels – for both subcritical and supercritical cases.
Coherence factor increases while approaching the Hopf bifurcation, regardless of all noise color. Accordingly, the coherence factor, , is a robust precursor.
The Hurst exponent strongly depends on the noise color: it increases sharply with increase in noise correlation time. The dependence of the Hurst exponent on the control parameter is stronger than its dependence on noise color only when the noise correlation is large with respect to the time scale of the instability: The decrease in the Hurst exponent can serve as a precursor in systems where the noise correlation time is larger than the system’s time scale (). For all , the variations in Hurst exponent are predominated by changes in noise color than the control parameter.
Footnotes
Acknowledgements
The authors thank the anonymous reviewers for their suggestions to include the time delay model.
Declaration of conflicting interests
The authors declare no potential conflicts of interest with respect to the research, authorship, and/or publication of this article.
Funding
The authors disclosed receipt of the following financial support for the research, authorship, and/or publication of this article: This work is supported by MHRD and the institute seed funding, IIT Ropar (grant no. 9-277/2017/IITRPR/4854). NV would also like to acknowledge the International Travel Grant (ITS) awarded by SERB, DST (grant no. ITS/2023/002971) to attend SoTiC conference (2023) held at ETH Zurich for presenting this work.
ORCID iD
Neha Vishnoi
Appendix A. Time delayed Van der Pol oscillators
References
1.
SubramanianPMariappanSSujithRIet al. Bifurcation analysis of thermoacoustic instability in a horizontal rijke tube. Int J Spray Combus Dynam2010; 2: 325–355.
2.
GuptaVSaurabhAPaschereitCOet al. Numerical results on noise-induced dynamics in the subthreshold regime for thermoacoustic systems. J Sound Vib2017; 390: 55–66.
3.
MoeckJBothienMSchimekSet al. Subcritical thermoacoustic instabilities in a premixed combustor. In 14th AIAA/CEAS Aeroacoustics Conference (29th AIAA Aeroacoustics Conference). American Institute of Aeronautics and Astronautics. ISBN 978-1-60086-983-9, p.2946.
4.
KabirajLSujithRI. Investigation of subcritical instability in ducted premixed flames. In Volume 2: Combustion, Fuels and Emissions, Parts A and B. ASMEDC. ISBN 978-0-7918-5462-4, pp.969–977.
5.
LieuwenTCYangV. Combustion instabilities in gas turbine engines: operational experience, fundamental mechanisms, and modeling. Reston, VA: American Institute of Aeronautics and Astronautics, 2005.
6.
CulickFPaparizosLSterlingJet al. Combustion noise and combustion instabilities in propulsion systems. Advisory Group Aero Res Dev, North Atl Treaty1992; 18: 1–27.
7.
BurnelyVCulickF. The influence of combustion noise on acoustic instabilities. Technical report, Air Force Research Lab, Edwards Air Force Base, CA Propulsion Directorate West, 1997.
SeywertCN. Combustion instabilities: issues in modeling and control. PhD Thesis, California Institute of Technology, 2001.
10.
NoirayNSchuermansB. Deterministic quantities characterizing noise driven hopf bifurcations in gas turbine combustors. Int J Non Linear Mech2013; 50: 152–163.
11.
NoirayN. Linear growth rate estimation from dynamics and statistics of acoustic signal envelope in turbulent combustors. J Eng Gas Turbine Power2017; 139: 041503.
12.
BoujoENoirayN. Robust identification of harmonic oscillator parameters using the adjoint fokker–planck equation. Proce R Soc A: Math, Phys Eng Sci2017; 473: 20160894.
13.
VishnoiNWahiPSaurabhAet al. On the effect of noise induced dynamics on linear growth rates of oscillations in an electroacoustic rijke tube simulator. In Turbo Expo: Power for Land, Sea, and Air, volume 84942. American Society of Mechanical Engineers, p.V03AT04A013.
14.
WaughICJuniperMP. Triggering in a thermoacoustic system with stochastic noise. Int J Spray Combust Dyna2011; 3: 225–241.
15.
JuniperMP. Triggering in the horizontal rijke tube: non-normality, transient growth and bypass transition. J Fluid Mech2011; 667: 272–308.
16.
JegadeesanVSujithRI. Experimental investigation of noise induced triggering in thermoacoustic systems. Proce Combust Inst2013; 34: 3175–3183.
17.
KabirajLVishnoiNSaurabhA. A Review on Noise-Induced Dynamics of Thermoacoustic Systems. Singapore: Springer, 2020.
18.
GopalakrishnanESharmaYJohnTet al. Early warning signals for critical transitions in a thermoacoustic system. Sci Rep (UK)2016; 6: 1–10.
19.
PavithranISujithR. Effect of rate of change of parameter on early warning signals for critical transitions. Chaos: Interdiscipl J Nonlin Sci2021; 31: 013116.
20.
ZhangXXuYLiuQet al. Rate-dependent tipping and early warning in a thermoacoustic system under extreme operating environment. Chaos: Interdiscip J Nonlin Sci2021; 31: 113115.
21.
KabirajLSteinertRSaurabhAet al. Coherence resonance in a thermoacoustic system. Phys Rev E2015; 92: 042909.
22.
SaurabhAKabirajLSteinertRet al. Noise-induced dynamics in the subthreshold region in thermoacoustic systems. J Eng Gas Turbine Power2017; 139: 031508.
BabaKKishiyaSGotodaHet al. Early detection of thermoacoustic instability in a staged single-sector combustor for aircraft engines using symbolic dynamics-based approach. Chaos: Interdiscipl J Nonlin Sci2023; 33: 073101.
25.
BandtCPompeB. Permutation entropy: a natural complexity measure for time series. Phys Rev Lett2002; 88: 174102.
26.
GotodaHAmanoMMiyanoTet al. Characterization of complexities in combustion instability in a lean premixed gas-turbine model combustor. Chaos: Interdiscipl J Nonlin Sci2012; 22: 043128.
27.
LeeM. Early warning detection of thermoacoustic instability using three-dimensional complexity-entropy causality space. Exp Therm Fluid Sci2022; 130: 110517.
28.
NairVSujithRI. Multifractality in combustion noise: predicting an impending combustion instability. J Fluid Mech2014; 747: 635–655.
29.
Waxenegger-WilfingGSenguptaUMartinJet al. Early detection of thermoacoustic instabilities in a cryogenic rocket thrust chamber using combustion noise features and machine learning. Chaos: Interdiscipl J Nonlin Sci2021; 31: 063128.
30.
FuYZhangYZangPet al. An early detection indicator of combustion instability for an industrial gas turbine combustor. Phys Fluids2024; 36: 015119.
31.
NairVSujithRI. Identifying homoclinic orbits in the dynamics of intermittent signals through recurrence quantification. Chaos: Interdiscipl J Nonlin Sci2013; 23: 033136.
32.
NairVThampiGSujithRI. Intermittency route to thermoacoustic instability in turbulent combustors. J Fluid Mech2014; 756: 470–487.
33.
RuizEAUnniVRPavithranIet al. Convolutional neural networks to predict the onset of oscillatory instabilities in turbulent systems. Chaos: Interdiscipl J Nonlin Sci2021; 31: 093131.
34.
NeimanASaparinPIStoneL. Coherence resonance at noisy precursors of bifurcations in nonlinear dynamical systems. Phys Rev E1997; 56: 270.
35.
UshakovOWünscheHJHennebergerFet al. Coherence resonance near a hopf bifurcation. Phys Rev Lett2005; 95: 123903.
36.
KantelhardtJWZschiegnerSAKoscielny-BundeEet al. Multifractal detrended fluctuation analysis of nonstationary time series. Phys A: Stat Mech Appl2002; 316: 87–114.
NawrothHPaschereitCOZhangFet al. Flow investigation and acoustic measurements of an unconfined turbulent premixed jet flame. In 43rd AIAA Fluid Dynamics Conference. p.2459.
39.
MahanJ. A critical review of noise production models for turbulent, gas-fueled burners. Technical report, Mahan, J. R. (Virginia Polytechnic Inst. and State Univ. Blacksburg, 1984.
40.
BoncioliniGBoujoENoirayN. Output-only parameter identification of a colored-noise-driven van-der-pol oscillator: Thermoacoustic instabilities as an example. Phys Rev E2017; 95: 062217.
41.
VishnoiNGuptaVSaurabhAet al. System parameter identification of a colored-noise-driven rijke tube simulator. J Eng Gas Turbine Power2022; 144: 091017.
42.
ZhangXXuYLiuQet al. Rate-dependent tipping-delay phenomenon in a thermoacoustic system with colored noise. Sci China Technol Sci2020; 63: 2315–2327.
43.
ZhangXXuYLiuQet al. Rate-dependent bifurcation dodging in a thermoacoustic system driven by colored noise. Nonlinear Dyn2021; 104: 2733–2743.
44.
LiXWangYWangNet al. Stochastic properties of thermoacoustic oscillations in an annular gas turbine combustion chamber driven by colored noise. J Sound Vib2020; 480: 115423.
45.
VishnoiNGuptaVSaurabhAet al. Effect of correlation time of combustion noise on early warning indicators of thermoacoustic instability. Chaos: Interdiscipl J Nonlin Sci2024; 34: 033129.
46.
BoncioliniGEbiDBoujoEet al. Experiments and modelling of rate-dependent transition delay in a stochastic subcritical bifurcation. R Soc Open Sci2018; 5: 172078.
47.
LiXXuBLiXet al. Effects of multiplicative and additive colored noises on the stability of a simplified thermoacoustic combustor. Combust Flame2023; 249: 112413.
48.
BoncioliniGEbiDBoujoEet al. Experiments and modelling of rate-dependent transition delay in a stochastic subcritical bifurcation. R Soc Open Sci2018; 5: 172078.
49.
BoncioliniGFaure-BeaulieuABourquardCet al. Low order modelling of thermoacoustic instabilities and intermittency: flame response delay and nonlinearity. Combust Flame2021; 226: 396–411.
50.
WiesenfeldK. Noisy precursors of nonlinear instabilities. J Stat Phys1985; 38: 1071–1097.
51.
PikovskyASKurthsJ. Coherence resonance in a noise-driven excitable system. Phys Rev Lett1997; 78: 775.
52.
PengCKBuldyrevSVHavlinSet al. Mosaic organization of dna nucleotides. Phys Rev E1994; 49: 1685.
53.
IhlenEAF. Introduction to multifractal detrended fluctuation analysis in matlab. Front Physiol2012; 3: 141.
54.
BrugioniSHwangDUMeucciRet al. Coherence resonance in excitable electronic circuits in the presence of colored noise. Phys Rev E2005; 71: 062101.
55.
NairVSujithR. Precursors to self-sustained oscillations in aeroacoustic systems. Int J Aeroacoust2016; 15: 312–323.
56.
UnniVRSujithR. Multifractal characteristics of combustor dynamics close to lean blowout. J Fluid Mech2015; 784: 30–50.
57.
DuroxDSchullerTGandelS. Self-induced instability of a premixed jet flame impinging on a plate. Proce Combust Inst2002; 29: 69–75.
58.
GhirardoGJuniperMPBothienMR. The effect of the flame phase on thermoacoustic instabilities. Combust Flame2018; 187: 165–184.
59.
GiuggioliLNeuZ. Fokker–planck representations of non-markov langevin equations: application to delayed systems. Phil Trans R Soc A2019; 377: 20180131.