
Abstract
Safe shutdown of a liquid rocket engine in ground testing prior to the onset of damaging combustion instabilities through reliable detection of instability precursors would translate to time and cost savings in engine development programmes. Methods derived from statistical, recurrence, and fractal analysis have been successfully applied in the literature to detect precursors in unsteady pressure signals from canonical combustion experiments, gas-turbine combustion experiments, and sub-scale rocket combustion experiments operated at low pressures. In the present work, several such methods were applied to data from two cryogenic oxygen-natural gas rocket experiments operated at higher pressures than previously reported; both sub- and supercritical with respect to oxygen. The goal was to identify methods that can discern limit-cycle instabilities from intermittently unstable operation and are sufficiently responsive to be applied as emergency shut-down criteria in engine tests. Among the methods applied were the standard deviation, variance of the auto-correlation, the second spectral moment, the ratio between determinism and recurrence rate, the Hurst-exponent, and the multifractal range. The second spectral moment, the Hurst-exponent, and a measure derived from the multifractal spectrum all have short detection delays for instability onset and short-lived could be discerned from self-sustaining instabilities with an appropriate choice of threshold value. They also have moderate computation cost which makes them of interest for potential real-time implementation. The Hurst-exponent has the additional advantage of a common threshold value for all test cases addressed, demonstrating its potential for broader application independent of combustion device or operating conditions.
Keywords
Introduction
The occurrence of high-frequency (HF) combustion instabilities poses a high risk to the safe operation of liquid-propellant rocket engines. 1 Generally stable combustion features pressure fluctuations below 5% of the mean chamber pressure. If the amplitude of the pressure oscillations exceeds this threshold but in a chaotic manner this is depicted as rough combustion. Unstable combustion displays organized oscillations and can be easily recognized against the broadband noise of the highly turbulent combustion. 2
The Rayleigh-Criterion provides a theoretical foundation for thermoacoustic driving, which can lead to combustion instabilities.
3
The mathematical description of this criterion is given in equation 1.

While extensive health monitoring with emergency shut-down logic is standard practice in ground testing, detecting and avoiding combustion instabilities before an engine sustains damage remains a challenge. Reliable detection of precursors of oscillatory combustion in an engine with unknown stability characteristics has enormous cost-saving potential for rocket engine development and operation.
Two approaches are prominent in predicting the onset of combustion instabilities, the first being model-driven. Sujith et al. 4 applied measures from recurrence and multifractal analysis to a multi-injector rocket combustor operating at chamber pressures below 30 bar. Within this study, a measure derived from recurrence quantification analysis (RQA) was identified as capable of distinguishing between the different operating states of the combustor. From fractal analysis, the Hurst-exponent and the multi-fractal spectrum width showed the same capabilities. Banerjee et al. 5 additionally investigated measures derived from autocorrelation and power-spectral-densities in a laboratory-scale combustor. It was found that, again, the Hurst-exponent, but also the variation of the auto-correlation (AC) and second spectral moment could be applicable as early-warning-signals (EWSs).
The second approach originates from machine learning. Sengupta et al. 6 combined nonlinear autoregressive models with exogenous variables and Bayesian neural network ensembles for a rocket thrust chamber to estimate the pressure amplitude with an uncertainty quantification. Waxenegger-Wilfing et al. 7 combined measures from recurrence analysis with a support vector machine to classify different stability regimes and applied the class prediction as an EWS.
The current work focuses on model-driven approaches from statistical, recurrence, and fractal analysis and aims at assessing the applicability of these EWSs in cryogenic oxygen-natural gas combustion under conditions representative of launcher engines. Data from two different sub-scale combustion devices were used as test cases. The first device is a single-injector, optically accessible combustor and the second is a multi-injector thrust chamber. Both devices used the propellant combination of liquid oxygen and compressed or liquefied natural gas (LOX/CNG/LNG). The inclusion of two different combustors with different numbers of injector elements and different power levels is motivated by the aim to have an EWS not limited to a specific combustion device.
In these experiments, self-excited thermoacoustic instabilities occurred, with both phases of short-lived (SL) bursts of oscillatory combustion as well as sustained, limit-cycle instabilities. In contrast to stable combustion which is dominated by low-amplitude broadband noise of the highly turbulent combustion, thermoacoustic instabilities are accompanied by a tremendous increase of mechanical and thermal loads which the structure containing the combustion is exposed to and thus the potential to destroy the rocket engine in short period of time. While the intermittent bursts of oscillatory combustion are not at all a desired combustion behaviour their destructive impact is limited due to the short period of heightened thermal loads. A desired EWS for testing at the test bench would therefore be able to distinguish between SL and self-sustaining instabilities. In the latter case, a test abort needs to be triggered, whereas SL instabilities should not lead to resource-intensive false test aborts.
This paper is structured as follows. First, the test cases are described, comprising two experimental setups and five tests in total. Then, the precursor detection methods assessed in this work are introduced. The methods applied for statistical analysis were the standard deviation, variance of the AC, and the second spectral moment. For recurrence analysis, the ratio between determinism and recurrence rate was utilized. For fractal analysis, the Hurst exponent and the multifractal range were employed. Next, all the methods are applied to time series unsteady pressure data from a single test with the single-injector combustor and their utility for precursor detection is assessed. Finally, three of the most promising methods are applied to the remaining sets of test data covering a wider set of operating conditions and including the multi-injector configuration. Advantages and disadvantages of these selected methods are discussed and recommended threshold values for instability detection are offered.
Experimental method
The hot-fire tests presented in this work were conducted at the European Research and Technology Test Facility P8 for cryogenic rocket engines with the DLR research combustion chamber BKN and research thrust chamber BKD. While BKN is an extensively instrumented single-element combustor limited in overall power density compared to flight engines, the multi-element BKD features power levels and densities comparable to small upper stage rocket engines but renders itself less accessible for diagnostics.
Combustion chamber N
For these tests, BKN consisted of a single-element injector head, an optical chamber segment with 50-mm diameter, up to three additional chamber segments and a convergent divergent nozzle.
In the presented tests three different combustion chamber lengths (
Combustor and injection element schematics in BKN. (a) Experimental combustor model ‘N’; (b) Injection element.
Thrust chamber D
BKD consists of a multi-element injector head, a measurement ring, at least one cylindrical chamber segment and a convergent divergent nozzle.
For the two presented tests with BKD it was configured with two cylindrical chamber segments resulting in an overall cylindrical length of 400 mm. Again, a schematic representation of the combustor also indicating the diagnostic capabilities is illustrated in Figure 2(a). The measurement ring mounted between the injector head and the first chamber segment is instrumented with four unsteady pressure sensors at the circumferential angular positions of 0∘, 80∘, 180∘, and 300∘. The acoustic measurements of the first unsteady pressure sensor were analyzed within this work. The sample rate of the signal is also 100 kHz with a 30 kHz second-order anti-aliasing filter. The measurement range was set to only
Combustor and injection element schematics in BKD. (a) Experimental thrust chamber (schematic) 9 model ‘D’; (b) Injection element.
Operating conditions
Acoustic measurements of five test runs are analyzed in this work. Within these tests the chamber pressure (
Injection conditions (envelope), chamber length and HF characteristics for combustor ‘N’.
HF: high-frequency; ROF: ratio of oxidizer to fuel mass flow rate; SL: short lived; LC: limit cycle.
Injection conditions (envelope), chamber configuration and HF characteristics for combustor ‘D’.

HF: high-frequency; ROF: ratio of oxidizer to fuel mass flow rate; IC: injection coupled; SL: short lived; LC: limit cycle.
The test sequences of the tests with BKN are shown in Figure 3 and the tests with BKD in Figure 4. The plots show a spectrogram (top) of the unsteady pressure signal (middle), along with traces of the static chamber pressure, LOX and CNG/LNG injection temperature and ROF (bottom). These traces of parameters describe the performed sequence of operating conditions, while the raw unsteady pressure signal (middle) and the spectrogram (top) describe the acoustic character.
Test sequence spectrograms of Tests N.1-N.3 showing solely short-lived bursts of oscillatory combustion in case of N.1, additional self-sustaining instabilities in N.2 and solely limit-cycle instabilities in N.2.
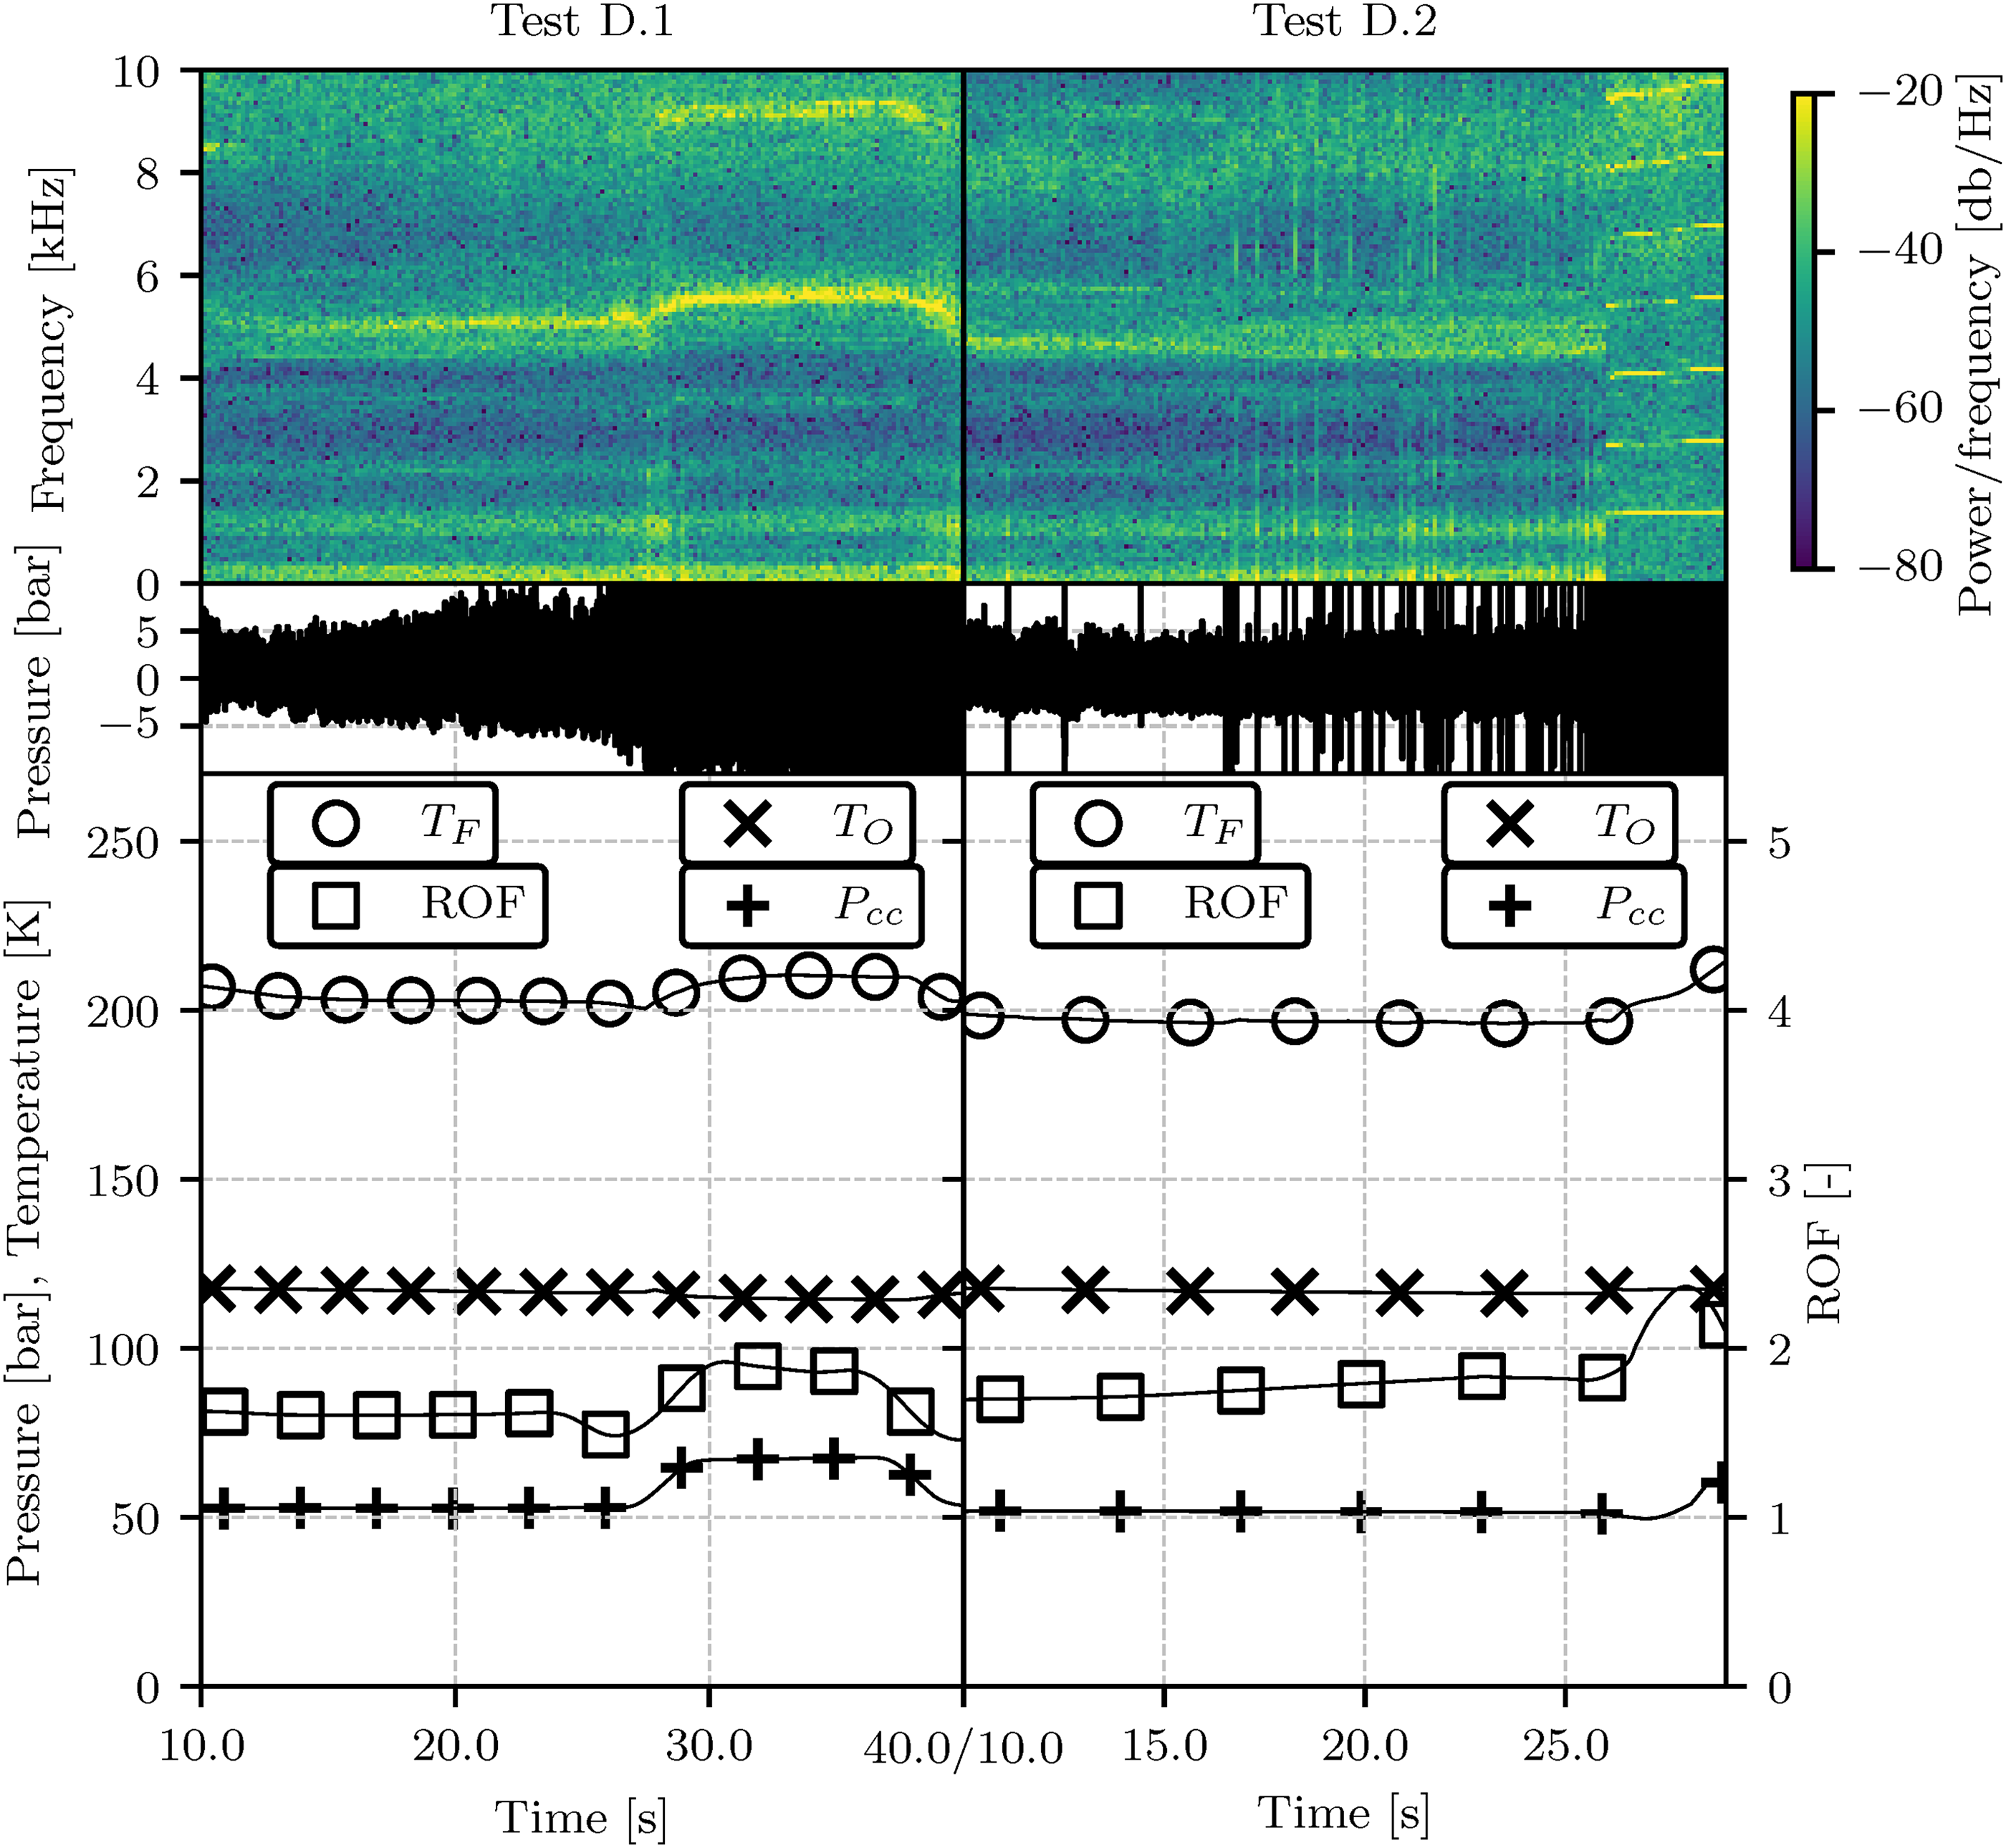
Test sequence spectrograms of Test D.1 and D.2 showing high-amplitude combustion instabilities for distinct operation conditions in D.1 and short-lived in combination with self-sustaining instabilities in D.2.
The test sequence spectrogram for the BKN test N.1 shows solely SL bursts of oscillatory combustion. These bursts resemble phenomena depicted as coherence resonance 10 or intermittency. 10 While both phenomena share common signatures in the pressure data they differ in their underlying mechanisms. In the case of test N.1 it is likely that coherence resonance is observed in the early phase of the test. Perhaps in the later phase, a transition to intermittency takes place with the recurrence rate of these bursts increasing as a system parameter is, most likely, approaching its critical value. However, due to the limited data a clear distinction between coherence resonance and intermittency is not feasible and does also not hinder the main goal of this work. The test N.2 also features those SL bursts but ultimately one of these bursts transitions into limit-cycle thermoacoustic instabilities. An abrupt change from stable to unstable combustion appears in Test N.3.
The test sequence in the BKD test D.1 shows slightly heightened amplitudes of the chamber’s first tangential mode which transition to high amplitude combustion instabilities due to a change of the operating conditions. BKD test D.2 shows similar characteristics as the BKN test N.2 even though BKD features a quite different combustion hardware.
In combination, all five tests cover a wide range of operating conditions, combustion stability dynamics and hardware. It should also be noted that combustion was initiated with a torch igniter. However, the analyzed pressure readings are extracted seconds after the completion of the ignition sequence. The residence time of propellants in these tests is in the order of miliseconds assuming no closed recirculation zones. Therefore it can be ensured that the ignition is not affecting the evaluation. The mass flows determining chamber pressure and ROF are controlled via regulation valves and flow metres.
Methodology
In the following the methods applied to analyze the data are presented. Analogue to a potential real-time application all measures were calculated with measurement values collected prior to the corresponding evaluation time. Further, no filters were applied to the data being evaluated by the following measures. However, in some of the following figures the instantaneous amplitude is presented as an indication of the level of thermoacoustic activity next to the corresponding measures. Here the Hilbert transform requires a monofrequent signal and thus a bandpass filter, including the resonance frequency of the combustion device, was applied to the pressure data for this visualization purpose.
Since flight engines are often equipped with only one unsteady pressure sensor an important requirement for all considered measures is the limitation to data from one measurement source.
Statistical measures
A popular approach for monitoring the combustion and detecting unfavourable behaviour is the calculation of statistical measures indicating the variance (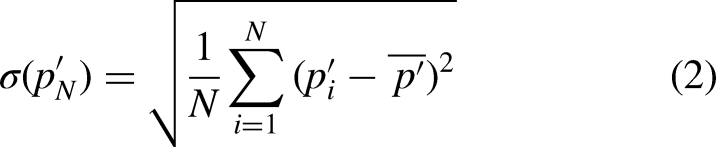
Banerjee et al.
5
proposed the variance of the 
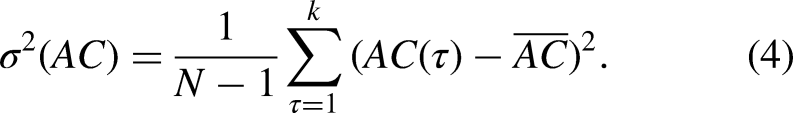
While the previous measures can be interpreted as the second central moments about their mean, the 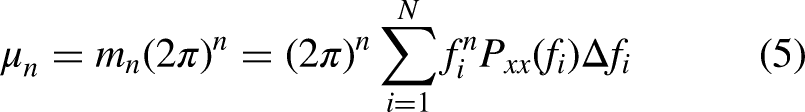
Recurrence measures
In deterministic dynamical systems the recurrence of state points (
From the recurrence matrix, a recurrence plot can be generated. Here every value in the matrix equalling one is plotted as a black dot and white otherwise. Measures can be derived from the organization of black and white dots in a recurrence plot. Sujith et al.
4
identified the ratio of the determinism and the recurrence rate as potential EWS. The determinism describes the percentage of ones in a recurrence matrix forming diagonal lines of a minimum length 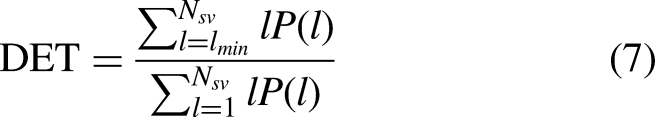

Fractal measures
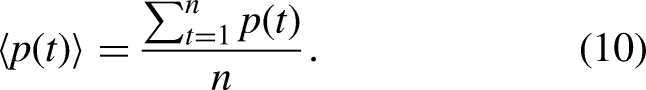
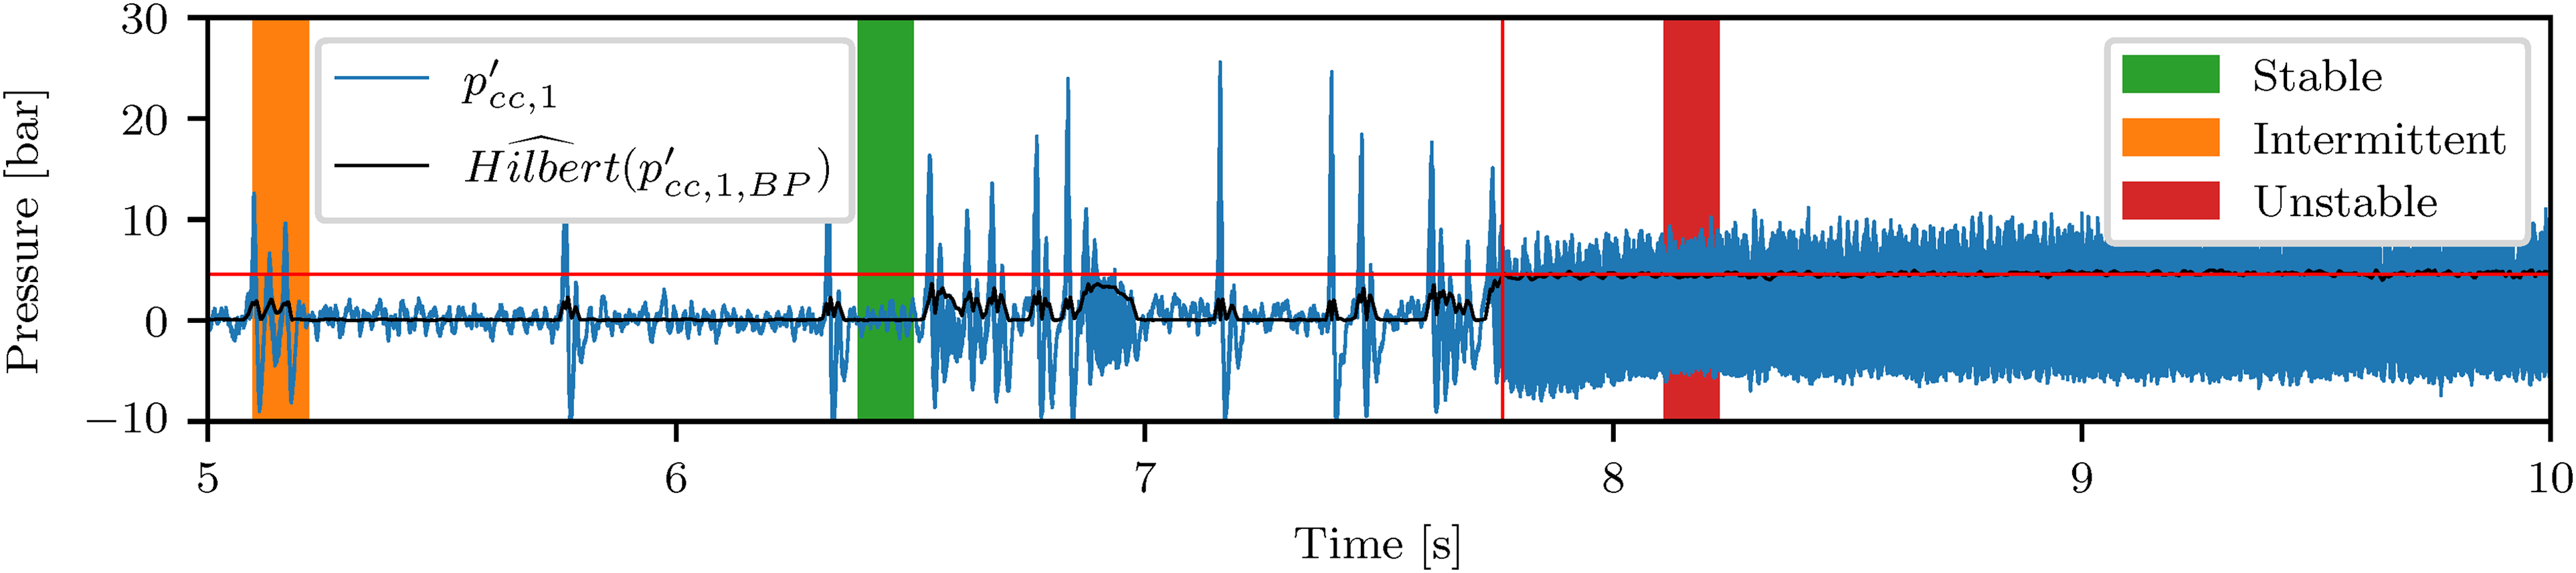
The Hurst-exponent originates from the fractal theory, which can be used to describe a fractal time series 15 . It quantifies the amount of correlation in the signal and relates to the fractal dimension. 16 H can be estimated in the following way 4 :
First the times series, here 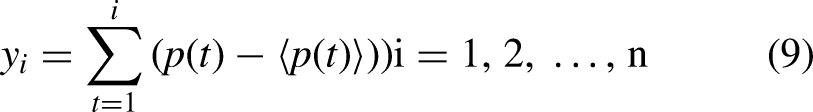


Results and discussion
Assessment of early warning signals
First the applicability of the measures presented in the previous section on combustion devices operating above 40 bar mean chamber pressure is assessed. All measures are evaluated each 4 ms, which is in the range of the minimal evaluation time of computer hardware used at corresponding test benches. The amount of samples (evaluation window) is varied between the methods adjusted to the necessary amount of samples with respect to each method.
The assessment will be conducted on the basis of the BKN test N.2, since BKN is more comparable in power (density) than BKD to the experiments, which were used in literature to assess the aforementioned measures as EWSs. The pressure trace of this test is characterized by stable combustion, bursts of oscillatory combustion, and high-amplitude limit-cycle instabilities, as illustrated in Figure 5.
Unsteady pressure signal (
The instantaneous amplitude based upon the band-pass (BP) filtered signal containing the frequency of the first longitudinal resonance mode (1L mode) is also visualized. Further three intervals of stable, intermittent and unstable combustion are highlighted in green, orange and red.
Figure 6 shows the phase portrait of the acoustic pressure in these three intervals in test N.2.
Phase portraits of the acoustic pressure for the stable, intermittent and unstable interval (Figure 5) in Test N.2.
As expected in the phase portrait for stable combustion no specific pattern can be recognized. This is due to the lack of an organized structure in the pressure trace which is dominated by aperiodic oscillation and broadband combustion noise. The phase portrait for the unstable interval draws a completely different picture. Here analogue to the data analyzed by Sujith et al. 4 a three-dimensional deformed triangle is observable. This structure is known from gas phase detonations. 18 The intermittent phase portrait shows periodic triangle-like structures similar to the unstable interval, but superimposed by a strong drift of the triangle’s centre. This can be explained by the behaviour of the chamber pressure. While for the sustained limit-cycle instabilities the mean chamber pressure stays constant, the chamber pressure rises with increasing HF amplitude and decreases afterwards.
Another presentation of the combustion behaviour are the Poincare sections in Figure 7.
Poincare sections of the acoustic pressure for the stable, intermittent and unstable interval (Figure 5) in Test N.2.
Here the successive local maxima of the acoustic pressure are traced. In the case of stable combustion the poincare section is a nearly straight line. For the unstable interval, a quadrilateral structure can be recognized, which implies that next to the dominant unstable frequency (1L) also subharmonics play a role. 19 The straight line with a high point density again shows that during the phase of decaying acoustic pressure, the signal is also superimposed by noise. Finally, the poincare section for the intermittent case shows a structure mixed from the stable and unstable case. Here the aforementioned pressure rise and decline during the phase of thermoacoustic oscillations is visible by the quadrilateral structure with its centre moving along the straight line.
Figure 8 visualizes the temporal development of the standard deviation, the variance of the AC and the second spectral moment in blue and the instantaneous amplitude of the 1L mode in black. It can be noticed that
Statistical measures (
The highest value of
The second spectral moment is capable of distinguishing between stable combustion, SL instabilities and unstable combustion since the spectral moment is slightly increased during the sustained instabilities compared to the intermittent instabilities. A threshold value of
The recurrence plots in Figure 9 visualize the recurrence matrix. Ideally for every interval which is evaluated the minimal embedding dimension and the optimal time lag should be calculated. This would result in time inefficient calculation process of the derived measures. Therefore it was decided to maintain

Recurrence plots of the acoustic pressure for the stable, intermittent and unstable interval (Figure 5) in Test N.2.
Apart from the centreline mainly isolated short diagonal lines can be seen for stable combustion. This is characteristic for aperiodic fluctuations. Perhaps the slight periodicity in the diagonal lines could indicate unstable periodic orbits between multiple attractors.
During predominant stable combustion with intermittent bursts of instabilities diagonal lines parallel to the centreline are visible indicating at least for a short time a periodic signal. After the decline of the thermoacoustic oscillations still some periodic structures are recognizable revealing some cyclicities in the process.
For unstable combustion, the whole recurrence plot is filled with parallel diagonal lines characterizing a stationary periodic signal with an identical evolution of state at different times and thus high recurrence rate and determinism.
Figure 10 illustrates the RQA measures discussed in the previous section.
RQA measures (
During bursts of oscillatory combustion there is only a minor rise in the recurrence rate (RR), its value approaches one during sustained instabilities. The determinism (DET) in the signal is quite high throughout the whole data but still increased during oscillatory combustion. Both values combined in the ratio of determinism to recurrence rate (RDR) show decreased values during SL instabilities compared to stable combustion and a drastically reduced value during sustained instabilities. If the threshold for the
Next, the multifractal spectrum is plotted in Figure 11.
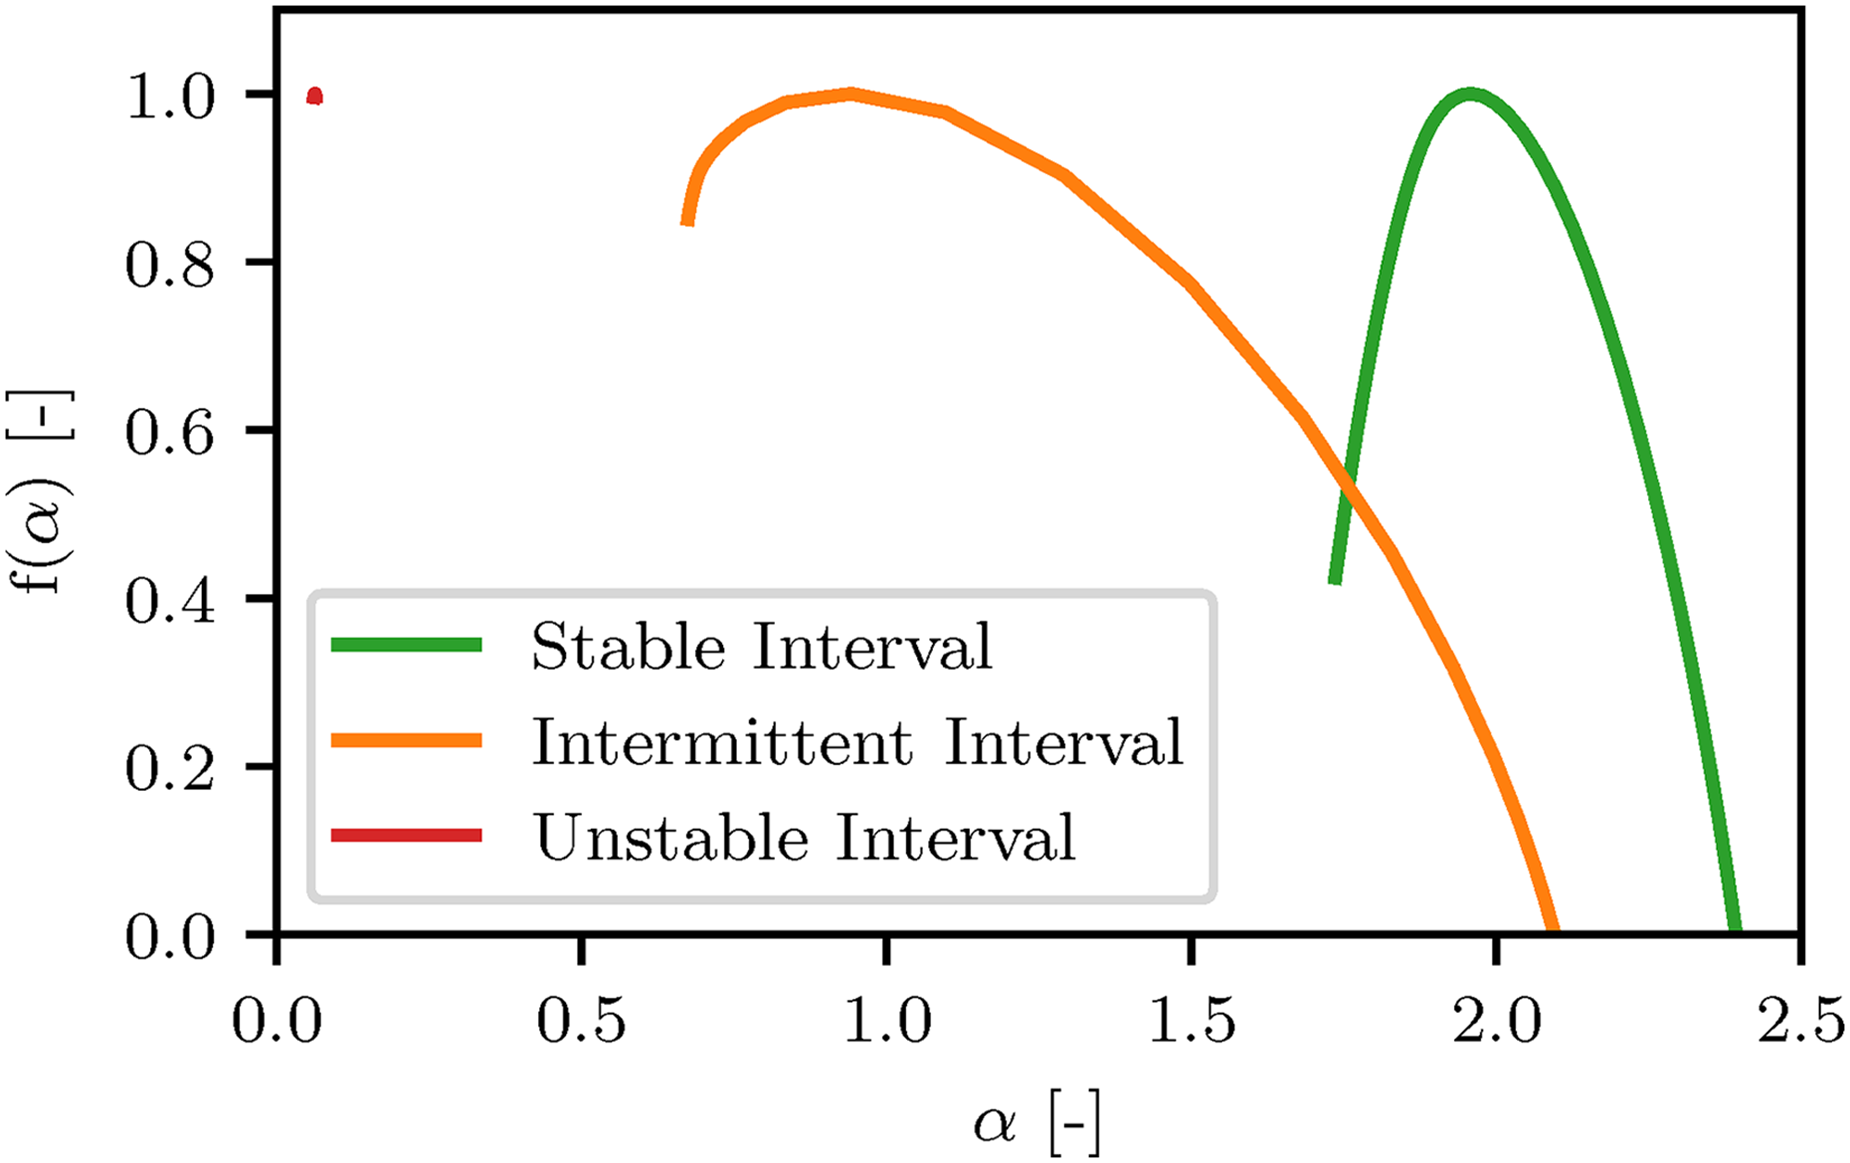
Multifractal spectrum of the acoustic pressure for the stable, intermittent and unstable interval (Figure 5) in Test N.2.
Here the different multifractal characteristics for stable intermittent and unstable combustion can be extracted. Stable combustion features a high mean value for the singularities
The temporal development of the Hurst-Exponent (
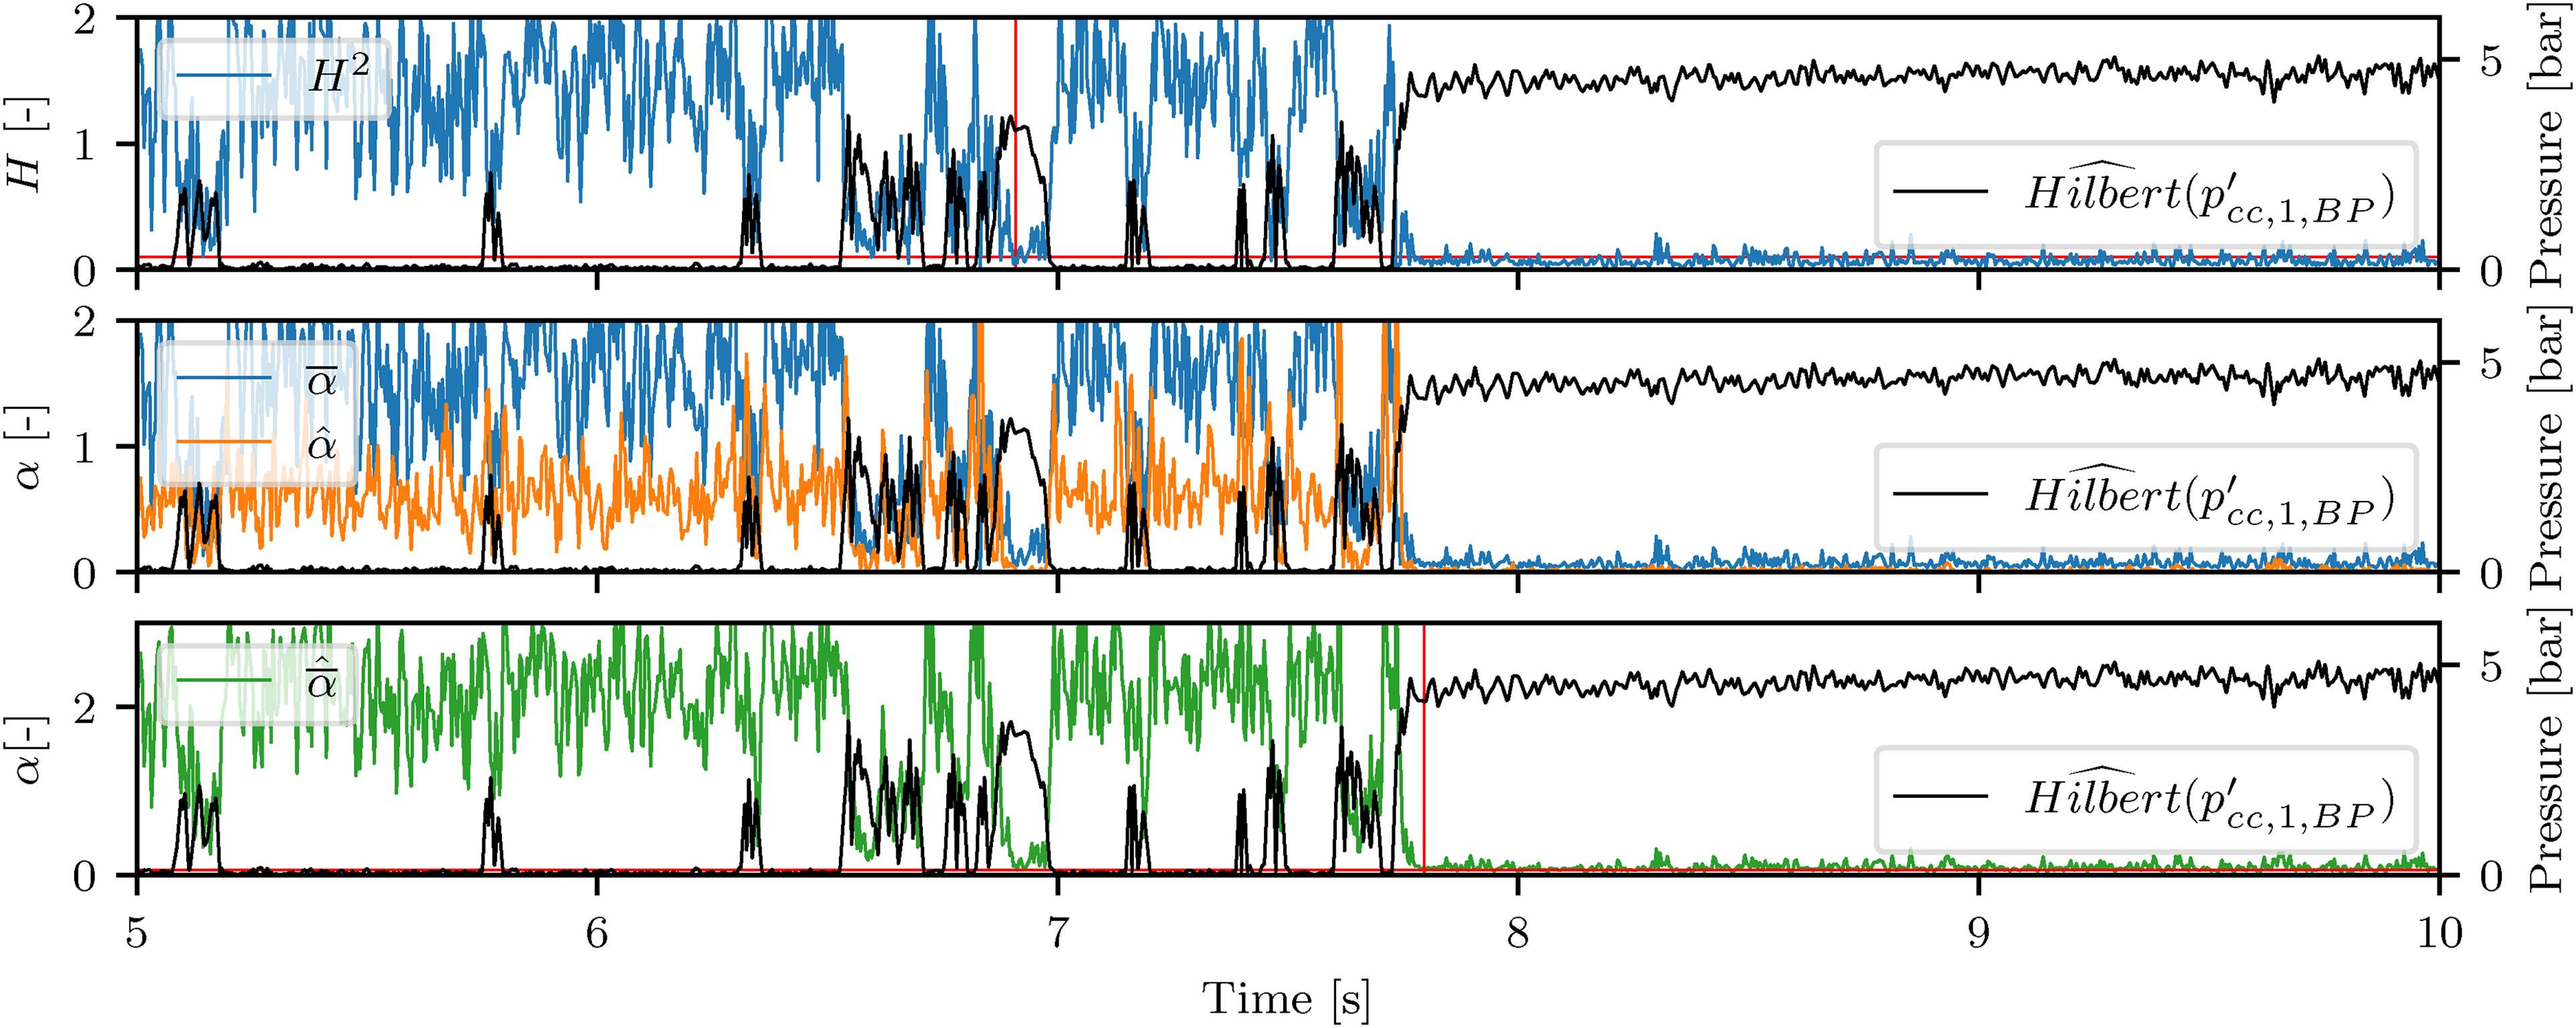
Multifractal measures (
In summary, the Hurst-exponent (
Application of early warning signals
The three measures identified as most promising in the previous section are now applied to further tests. In Figure 13 the Hurst-exponent, the combined multifractal measure and the second spectral moment are illustrated for the BKN test N.1 which features only intermittent bursts of oscillatory combustion but no sustained thermoacoustic instabilities.

Hurst-exponent (
Both fractal measures show the desired behaviour of maintaining values above their respective thresholds (
Test N.3 (Figure 14) features a direct onset of limit-cycle instabilities. All three measures exceed their critical thresholds during the transition to HF instabilities.

Hurst-exponent (
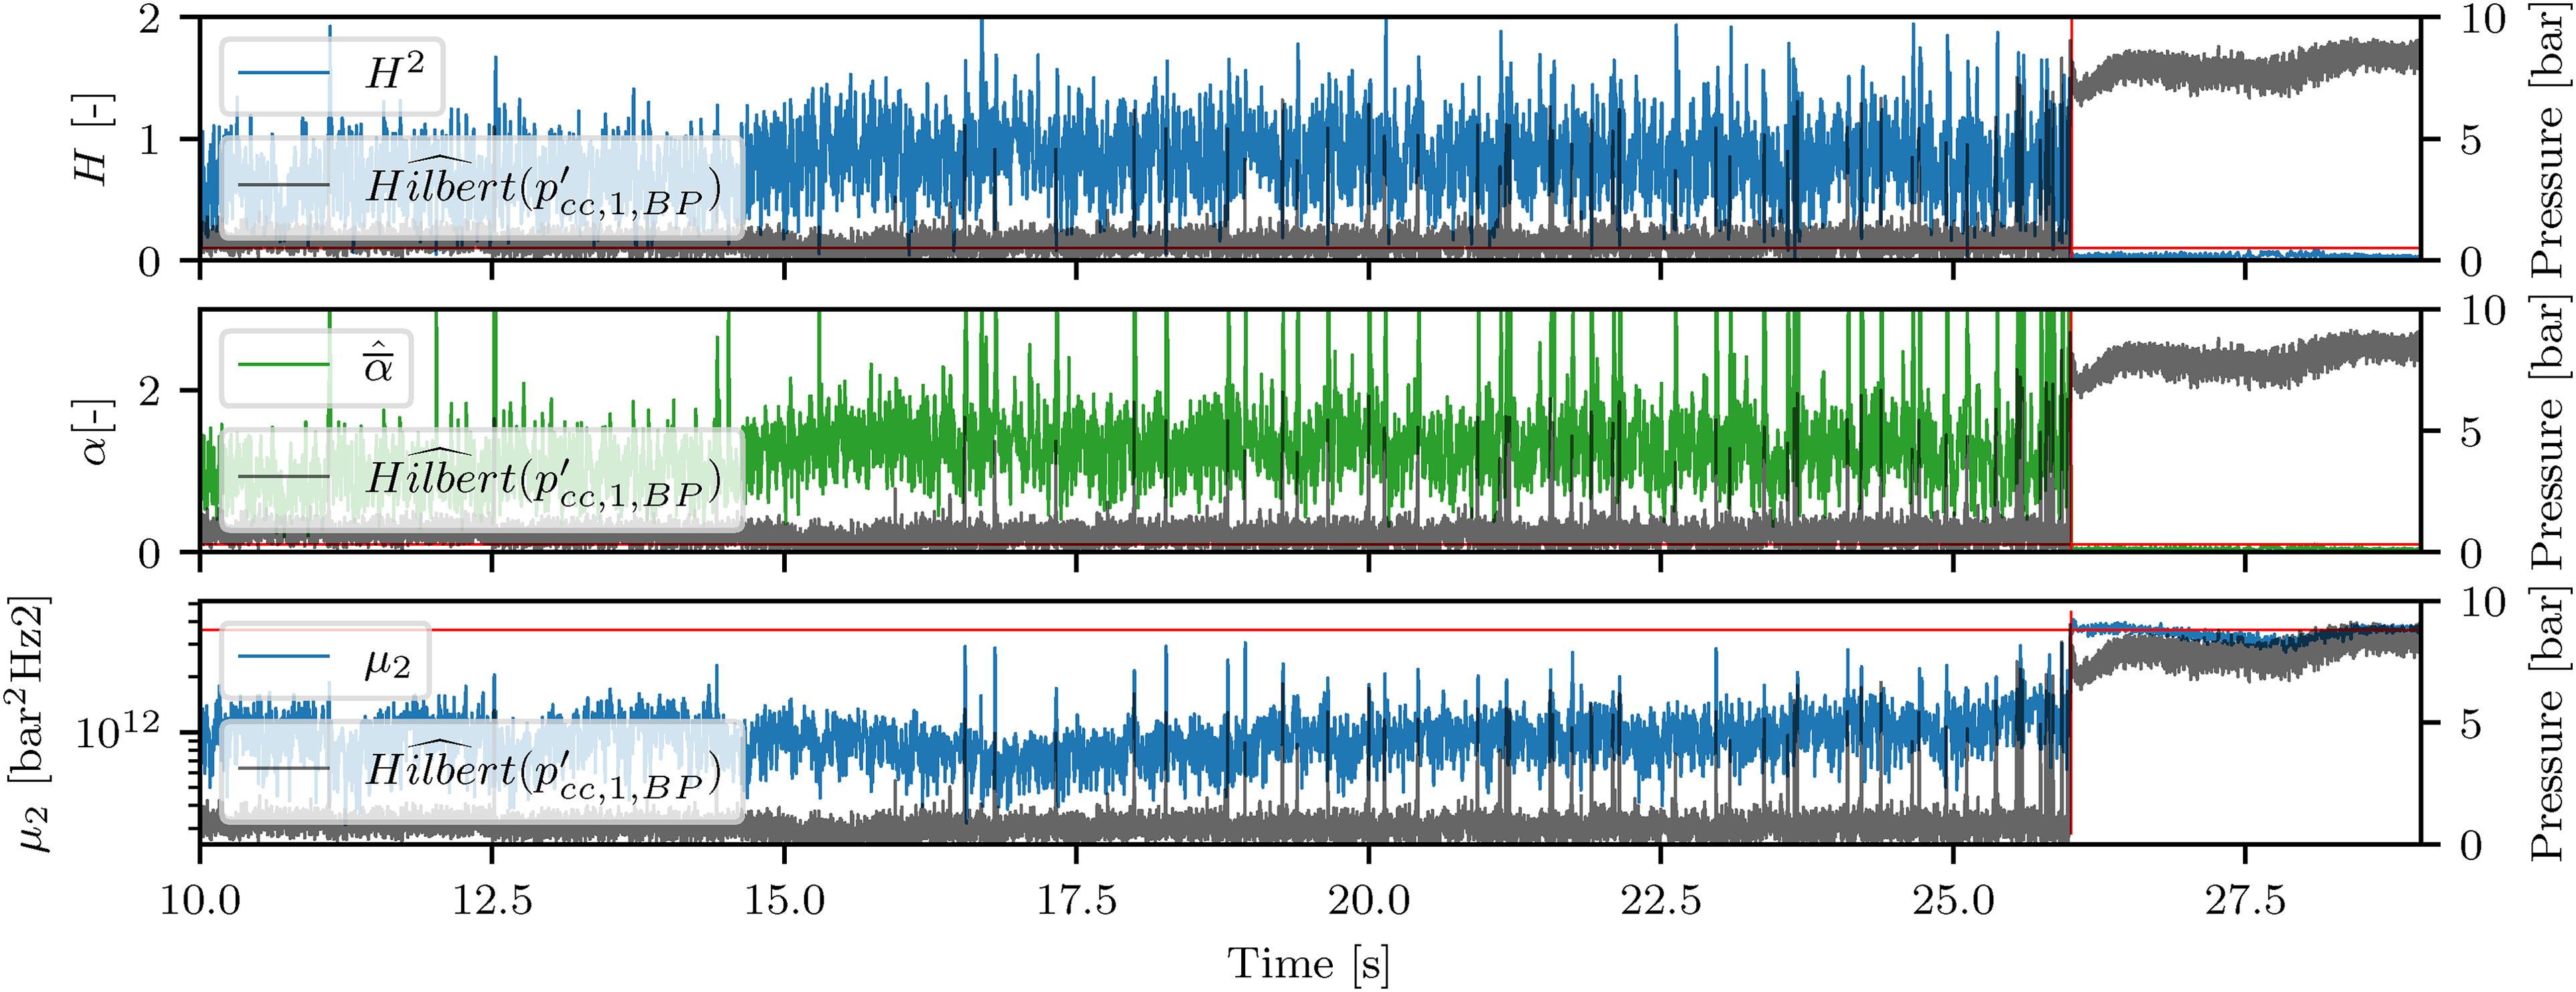
Next the behaviour of

Hurst-exponent (
In
Shortly prior to the onset of HF instabilities, between 27 and 29 s, a rise in
Finally, these values decrease below the critical threshold during the high-amplitude interval. It should be noted here that the threshold for the multifractral measure was doubled to
The behaviour of the combustion in D.2 (Figure 16) is similar to N.2. A phase of stable combustion precedes a phase with intermittent instabilities followed by sustained limit-cycle high-amplitude LC instabilities.
Hurst-exponent (
Analogue to the behaviour in N.2, the fractal measures decrease momentarily during intermittent bursts of oscillatory combustion and finally fall below the critical threshold of 0.1. The second spectral moment has a steep rise at the onset of instabilities. A suitable threshold would be
A summary of the EWS statistics is given in Table 3.
Thresholds for EWS, time of threshold violation with respect to each test and evaluation settings.
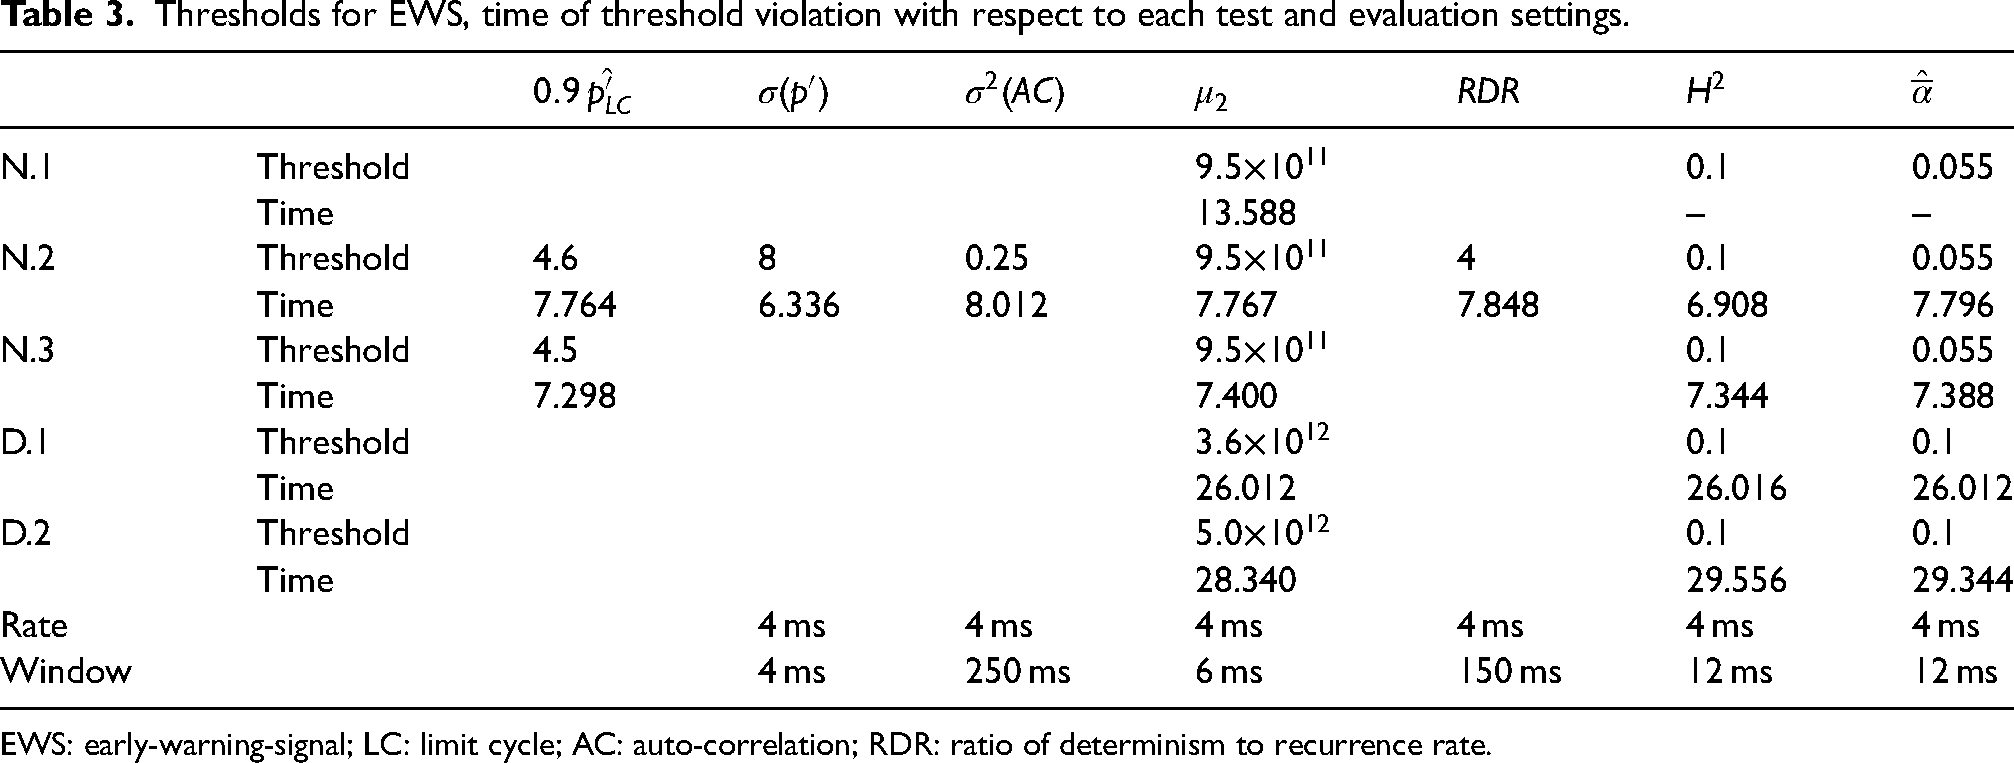
EWS: early-warning-signal; LC: limit cycle; AC: auto-correlation; RDR: ratio of determinism to recurrence rate.
The table incorporates the threshold and time when 90% of the limit-cycle amplitude (
In summary, the preselected measures seem to be, at least to some extent, applicable for a wider set of operating conditions, including various chamber pressures and ROFs, and different combustion devices. While for the Hurst-exponent a common threshold applies for both devices, the threshold for the multifractal parameter has to be adjusted for each combustion device and the second spectral moment even for each test.
Conclusion
The suitability of methods for detecting combustion instability precursors in cryogenic oxygen-natural gas rocket combustion at sub- and supercritical measures were assessed. Different methods from statistical, fractal and recurrence analysis were applied to five different tests from two different combustion devices featuring stable combustion, short-lived bursts of oscillatory combustion, and sustained, high-amplitude combustion instabilities.
The measure based on a standard deviation (
The measures based on the variance of the AC (
The fractal measures (
Finally, it should be noted that the Hurst-exponent
Footnotes
Acknowledgements
The work is associated with the Franco-German Rocket Engine Stability iniTiative (REST). The authors would also like to thank the crew of the P8 test bench. Special thanks to Alex Grebe for his assistance in preparing and performing the experiments.
Declaration of conflicting interests
The authors declare no potential conflicts of interest with respect to the research, authorship, and/or publication of this article.
Funding
The authors received no financial support for this article’s research, authorship, and/or publication.