We experimentally study the transition from a state of combustion noise to azimuthal thermoacoustic instability in a laboratory-scale turbulent annular combustor. This combustor has sixteen swirl-stabilized burners to facilitate continuous and spatially distributed combustion along the annular region. Our approach involves simultaneous measurement of CH* chemiluminescence emission of the flame using two high-speed cameras and the acoustic pressure fluctuations using eight piezoelectric pressure transducers mounted on the backplane of combustor. We observe that the transition from combustion noise to azimuthal instability occurs through mode shifting, where the system switches from a longitudinal mode to an azimuthal mode as the equivalence ratio is decreased. Throughout this progression, the combustor exhibits various dynamical behaviors, including intermittency, dual-mode instability, standing azimuthal instability, and beating azimuthal instability. These dynamical states are determined from the acquired pressure signals by decomposing the acoustic pressure fluctuations into clockwise (CW) and counterclockwise (CCW) waves, enabling a reconstruction of the amplitude of acoustic pressure fluctuations, nature angle, (anti-)nodal line location, and spin ratio. The global heat release response is then examined during various dynamical states, contrasting their behavior at different non-dimensional time steps by phase-averaging the fluctuations of the heat release rate over the acoustic pressure cycle. Distinctive flame behaviors were observed based on the direction of pressure wave propagation, showcasing characteristic CCW spinning, standing, and CW spinning heat release patterns. Moreover, our examination of relative phase distributions during various dynamical states, computed by analyzing the phase of heat release rate fluctuations across all burners with respect to one burner, reveals the emergence of diverse patterns in the interaction of neighboring flames influenced by acoustic field.
Gas turbine combustors typically employ an annular arrangement of multiple burners in aircraft engines and land-based power plants.1 This design choice is intended to achieve a shorter axial length for the combustor while also achieving a more uniform turbine inlet temperature profile. However, this arrangement of the combustor gives rise to longitudinal and azimuthal acoustic modes, each demonstrating unique characteristics in the acoustic field structure and flame responses.2 Significantly, the perimeter of the annular combustor typically being the largest physical dimension of the combustor in industrial gas turbines, the occurrence of thermoacoustic oscillations, particularly associated with the azimuthal acoustic eigenmode, becomes more probable.3 On the other hand, real engine designs often feature axial lengths that are of a similar order of magnitude as their perimeters. This proximity in dimensions enhances the potential for interactions between the longitudinal and azimuthal thermoacoustic modes.4 The present paper discusses the dynamical transition to azimuthal instability through the mode shifting from longitudinal to azimuthal mode in a turbulent annular combustor.
Thermoacoustic instability is characterized by self-excited periodic oscillations, resulting from a positive feedback between the acoustic pressure oscillations and the unsteady heat release rate from the flames.1,5,6 Within the combustor, these interactions can yield self-sustaining longitudinal or azimuthal thermoacoustic oscillations or a combination of both. Unfortunately, the outcomes of these interactions can be highly destructive, causing mechanical and thermal stresses that can compromise engine components.9,7,1,8 The rapid increase in pressure amplitude can inflict severe damage on critical combustor components such as liners, fuel injectors, and turbine blades, or significantly impair their functionality.10 Moreover, elevated acoustic pressure levels intensify heat transfer, overwhelming the thermal protection systems. Thus, rigorous investigation of thermoacoustic instabilities in annular combustors is imperative for ensuring their design integrity and safe operation.
During the unstable operation of an annular combustor, numerous interactions occur concurrently: turbulent flow interacts with flames, the interplay among adjacent flames, and both the flow and flames interact with the acoustic field of the combustion chamber.11,12 In these combustors, the interplay among adjacent flames gives rise to complex three-dimensional flame dynamics. The structure and behavior of interacting flames undergo substantial changes based on the distance between them and their flame-holding characteristics. A study by Worth and Dawson,13 investigated the impact of separation distance between flames within a configuration featuring two bluff-body stabilized flames. Their findings highlighted that shorter distances between burners lead to the merging of flames on a large scale, altering the mean flame structure and its corresponding thermoacoustic response. Subsequently, they extended this analysis to a complete annular combustor, revealing a shift in the flame structure from helical to a merged large-scale configuration as the inter-burner distance decreased.14 Another study by Bourgouin et al.,15 focused on an annular combustor with sixteen swirl-stabilized flames and analyzed the modal dynamics related to heat release rate perturbations during both longitudinal and azimuthal instabilities. Their observations indicated a certain level of desynchronization in flame dynamics during longitudinal instability. Together, these studies shed light on how the interaction of neighboring flames under the influence of an acoustic field impacts thermoacoustic responses across a range of annular combustor configurations. Hence, it is essential to gain a comprehensive understanding of the thermoacoustic behavior exhibited by annular combustors.
Due to rotational symmetry, thermoacoustic instabilities in annular combustors often manifest as eigenmodes featuring an azimuthally modulated distribution of acoustic pressure. The azimuthal modes are classified into three categories: (i) standing modes characterized by spatial nodes and anti-nodes, exhibiting either a fixed location or slow drift relative to the speed of sound, (ii) spinning modes propagating in either a clockwise (CW) or counterclockwise (CCW) direction, and (iii) mixed modes, representing a linear combination of spinning and standing modes.17,16,18 Recent observations have unveiled a unique form of thermoacoustic dynamics known as the “slanted mode,” identified in the annular combustor by Bourgouin et al.19. This mode arises from the concurrent presence of a standing azimuthal mode and a longitudinal mode, both exhibiting coinciding frequencies. Subsequent investigation on this dynamics was conducted by Prieur et al.20 within the same experimental framework. Additionally, Moeck et al.21 developed a model depicting this phenomenon as a synchronization between a pure longitudinal mode and an azimuthal mode characterized by remarkably close eigenfrequencies. Another interesting finding by Fang et al.22 reported a new dynamic state in the annular combustor, revealing the coexistence of both longitudinal and azimuthal modes at different frequencies.
Quite notably, the thermoacoustic behavior of a combustor can exhibit a relatively fixed modal character or intermittently shift between different wave directions,22 or the intermittent transition between standing and spinning dominant waves.23 More importantly, the influence of other factors such as non-degeneracy,24 non-uniformity,17 and background noise25 can change the direction, orientation as well as the nature of the thermoacoustic modes. For example, Krebs et al.3 and Worth and Dawson18,14 observed standing and spinning modes in the experiments, as well as switching between them. The occurrence of these modes depended on the operating conditions or the arrangement of burners. Another interesting aspect of azimuthal modes is the behavior of the nodal line during the limit cycle. In a system exhibiting rotational symmetry, the nodal line during azimuthal mode oscillations is not constrained to remain fixed, in contrast to nodal lines in axial or radial mode oscillations. For instance, experimental observations by Vignat et al.26 showed the movement of the nodal line as seemingly erratic. However, the presence of system non-uniformities can anchor the nodal line at specific azimuthal locations, as demonstrated in experiments27 and through reduced-order models.25,28 On the contrary, the deterministic motion of the nodal line has been observed in a few scenarios. Experimental investigations by Worth and Dawson18 and Kim et al.30,29 indicated that the nodal line periodically oscillates around a fixed azimuthal position on a slow time scale. Hence, understanding the fundamental principles driving the emergence of longitudinal, azimuthal, or combination of both modes in gas turbine engines during sudden power surges necessitates a thorough investigation of the onset of thermoacoustic instabilities in combustors. Therefore, it is essential to systematically vary the control parameters and understand the transition to thermoacoustic instabilities in the annular combustor.
Studies that capture the dynamical transition from stable operation to thermoacoustic instability in annular combustors by systematically varying the control parameters are currently scarce. An exemplary study by Prieur et al.20 stands out, where the authors systematically mapped combustor dynamics onto a parametric plane characterized by bulk flow velocity and equivalence ratio. In their observations, both longitudinal and azimuthal instabilities were identified, and a distinctive hysteresis cycle was noted, particularly when the equivalence ratio varied within the fuel-rich limit. They showed the transitions in the combustor from chugging to spinning and finally to standing azimuthal modes. Recently, Indlekofer et al.31 reported the transition from stable operation to self-excited azimuthal thermoacoustic modes. They showed a fascinating phenomenon wherein the self-oscillating azimuthal mode periodically alternates between CW and CCW spinning directions through standing mode. They termed this intricate behavior a beating azimuthal mode. The underlying deterministic mechanism driving this phenomenon was elucidated by Faure-Beaulieu et al.32. Furthermore, a recent investigation conducted by Ahn et al.33 explored the variations in the amplitude of self-excited azimuthal instabilities as a function of equivalence ratio and hydrogen power fraction. Their study scrutinized the response of heat release rates during the self-excited azimuthal thermoacoustic instabilities within a pressurized annular combustor, with a specific focus on flames blended with hydrogen and methane.
In the current study, we investigate the transition from the stable operation of the combustor to azimuthal thermoacoustic instability through the state of intermittency in a lab-scale turbulent annular combustor. Upon varying the equivalence ratio systematically, we demonstrate various dynamical behaviors: combustion noise, intermittency, dual-mode instability, standing azimuthal instability with the oscillatory nodal line, and beating azimuthal instability in a single experimental facility. We show that the simultaneous presence of longitudinal and azimuthal modes during dual-mode instability serves as a link between longitudinal and azimuthal thermoacoustic instabilities. Utilizing quaternion-based formalism, we gain insights into the different azimuthal modes within the annular combustor. We systematically examine the effect of the amplitude of acoustic pressure on the overall flame structure, drawing comparison and contrast specifically within the context of longitudinal and azimuthal modes of dual-mode instability. Subsequently, we assess the flame dynamics during the state of standing azimuthal instability and beating azimuthal instability. Studying the spatial variation of the acoustic pressure oscillations and heat release distribution in the annular combustor during the transition from combustion noise to azimuthal instability provides rich insight into the understanding of mode shifting from longitudinal to azimuthal modes.
Experimental facility and measurements
Premixed annular combustor setup
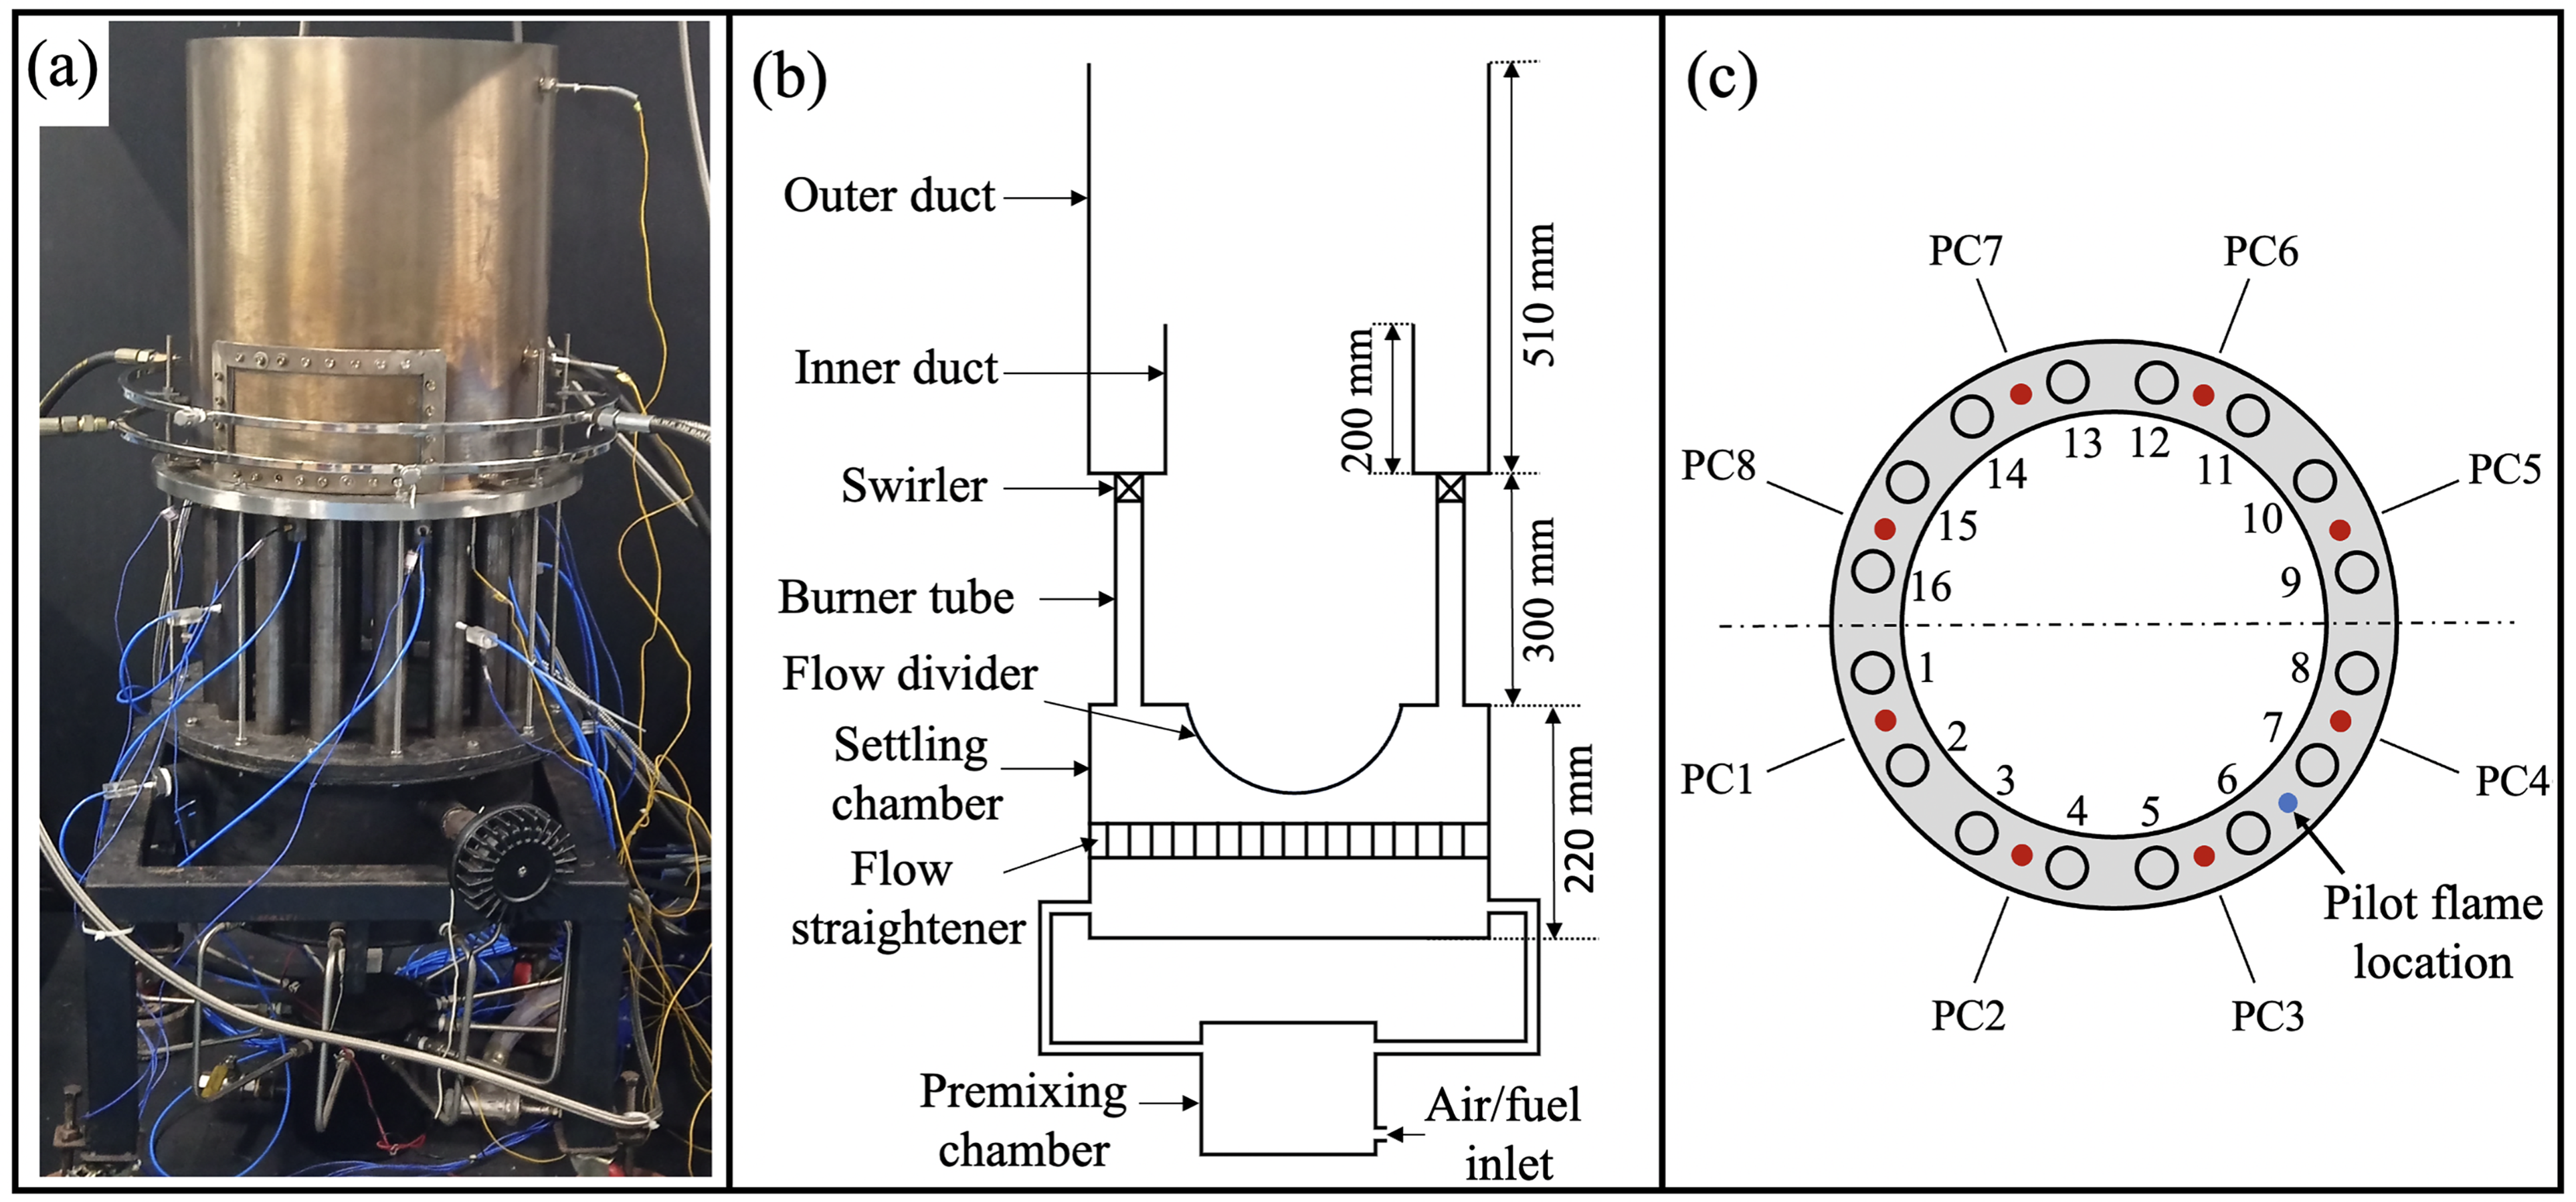
We performed experiments on a lab-scale annular combustor equipped with sixteen swirl-stabilized burners, as illustrated in Figure 1(a). Our setup includes a premixing chamber, a settling chamber, burner tubes, and outer and inner ducts forming the annulus (Figure 1(b)). In the premixing chamber, air and liquefied petroleum gas (40% propane and 60% butane by volume) are thoroughly mixed. The air-fuel mixture then flows in the settling chamber through twelve inlet ports. Each inlet port, having an internal diameter of 9.5 mm, is positioned perpendicular to the axis of the chamber.
(a) Photograph of the lab-scale turbulent annular combustor. Schematic of (b) the cross-section of the combustor, and (c) the dump plane. The location of the eight pressure transducers are named as PC1, PC2, …, PC8, and a port for pilot flame in (c).
A premixed liquified petroleum gas–air mixture is then passed through a honeycomb mesh and a hemispherical bluff body to improve flow uniformity. The plenum chamber has a diameter of 400 mm and a length of 220 mm. The flow is divided between sixteen burner tubes, each of the tubes having a diameter of 30 mm and a length of 300 mm that connects the annular chamber. Each burner tube contains a flame arrester at the bottom to prevent flashback and a swirler at the top. The swirler comprises six guide vanes mounted on a central shaft with a diameter of 15 mm, inclined at an angle of relative to the shaft axis. The swirling flow is introduced into the annular combustor through a converging section, where the converging nozzle features an exit diameter of 15 mm and a height of 18 mm, with a contraction area ratio of 2. In the combustion chamber, there are two concentric ducts—the inner duct measures 200 mm in length and 300 mm in diameter, while the outer duct spans 510 mm in length and has a diameter of 400 mm. The dump plane, illustrated in Figure 1(c), encompasses sixteen burner inlets, eight pressure measurement ports, and a port for a non-premixed pilot flame. A non-premixed pilot flame anchored between two injectors was used to ignite the premixed flames and subsequently extinguished after the ignition of flames. A pilot flame was ignited through the manual operation of a butane torch. Further details about the experimental setup can be explored in the works of Roy et al.34 and Singh et al.35.
Instrumentation and data acquisition
We concurrently measure the acoustic pressure fluctuations () and the heat release rate fluctuations () using the eight piezoelectric pressure transducers (named PC1, PC2,.., PC8) and the two high-speed cameras, respectively. Pressure measurements are performed using a PCB103B02 piezoelectric transducer mounted on the backplane of the combustor between two burners at eight locations (see Figure 1(c)).
The pressure transducers exhibit a sensitivity of 217.5 mV/kPa (an uncertainty of Pa). To capture fluctuating heat release rates around the annulus, we employed a Phantom v12.1 CMOS camera and a Phantom VEO 710S CMOS camera equipped with filters. Two high-speed cameras were employed to flawlessly capture all sixteen flames within the combustion chamber without any distortion caused by the inner duct. To protect the cameras from the hot exhaust gases, air-cooled mirrors were strategically positioned overhead of the combustor during the acquisition of the movies. Both cameras were equipped with Nikon AF Nikkor camera lenses ranging from 70 to 210 mm with apertures between to , strategically focusing on the region of interest in our experiments. We augmented the camera lenses with filters, characterized by a bandwidth of nm. In Figure 1(c), the burners numbered 1–8 were captured using a Phantom v12.1 CMOS camera, while burners numbered 9–16 were captured using a Phantom VEO 710S CMOS camera. Subsequently, we stitched together the images, each containing eight flames, as presented later in the flame dynamics section. Pressure signals were recorded for a duration of 5 s at a sampling rate of 10 kHz, complemented by camera operations at a frame rate of 5 kHz and a resolution of 1280 × 800 pixels. Each state of combustor operation was acquired with 5562 images using the Phantom v12.1 camera and 6240 images using the Phantom VEO 710S camera. To ensure synchronization of measurements, a pulse from the Tektronix AFG1022 function generator was employed to trigger both the cameras and the PCI card simultaneously.
Air () and fuel () flow rates are controlled using mass flow controllers (MFCs). Each MFC has an uncertainty of and an additional uncertainty of the full-scale. In these experiments, the equivalence ratio () is controlled by keeping fixed at kg/s and varying from to kg/s. Consequently, is systematically varied within the range of 1.38 to 1.02. The corresponding Reynolds number (Re) is around .
Analysis technique
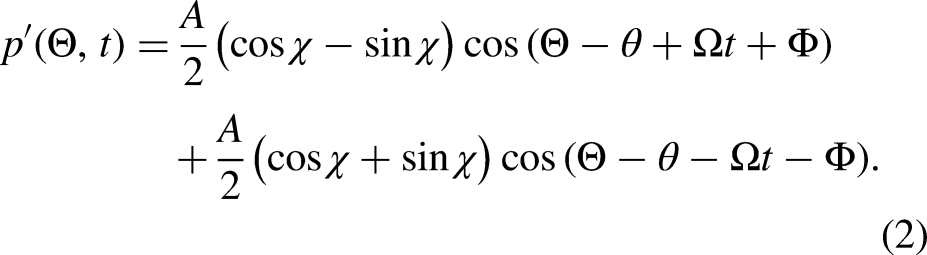
Recently, Ghirardo and Bothien36 proposed a new approach for describing the azimuthal eigenmodes in annular combustor by using the quaternions ansatz. With the obtained acoustic pressure data from eight locations, the quaternion-based ansatz is used for decomposing , according to:
where t is the time, is the angular frequency of the acoustic oscillations, and is the azimuthal coordinate. A set of four state variables, namely A, , , and , is then extracted from the time series of acoustic pressure. These variables vary slowly with respect to the fast acoustic timescale , and they enable a well-defined description of the state of an azimuthal thermoacoustic mode. The slowly varying amplitude A represents the amplitude of acoustic pressure oscillations, while the slowly varying angles and describe the position of the antinodal line and the nature of the azimuthal eigenmode (standing wave, pure CW or CCW spinning wave, or a mix of both). Additionally, the angle represents the slow temporal phase drift. We can express the pressure field in the form:
These two traveling waves yield:
and
where and denote the slowly varying amplitudes of the two counter-rotating spinning waves. Further, the slowly varying amplitude A representing the amplitude of acoustic pressure oscillations in equation (1) can be deduced from equations (3) and (4) as:
The distinction between standing mode and spinning mode is determined by the relationship between the two amplitudes: standing () or either spinning in a CW direction () or a CCW direction (). Alongside the slowly varying variables, we incorporate the spin ratio (SR) to delineate the characteristics of the azimuthal mode.15 This convenient mode indicator relies on the projection of two spinning waves and is expressed as . The relationship between the SR and the nature angle is elucidated by the following equation:
Given that the characteristics of a specific azimuthal mode encompass the amplitude A, the orientation angle , and the nature angle , a natural representation involves describing the azimuthal mode as a point on a Poincarè-Bloch sphere36(refer to Figure 2). The amplitude A serves to determine the distance between the point and the origin of the Bloch sphere. The orientation angle is the equatorial plane angle relative to the reference angle of the coordinate system, ranging between and . Meanwhile, twice the nature angle (2) defines the angle between the equatorial plane and the point representing the thermoacoustic mode. Here, determines whether the azimuthal eigenmode is a standing wave (), a purely CW or CCW spinning wave () or a combination of both for . Taken together, these slow-flow variables and SR provide a comprehensive description of the acoustic field () as a function of time and azimuthal position.
Poincaré–Bloch sphere representation of the azimuthal mode in the quaternion formalism. The amplitude A is representative of the radius, denotes the latitude, and signifies the longitude. Spinning modes of thermoacoustic states align with the poles, while standing modes are typically found near the equator, and mixed modes manifest at intermediate latitudes.
To investigate the dynamics of the heat release rate fluctuations, we use the non-dimensional phase-averaged fluctuations in the global heat release rate introduced by Worth and Dawson.14. In order to highlight the large-scale features of the global flame dynamics, we present the phase-averaged contours of . Here, represents the time-averaged mean heat release rate, while indicates its spatial average heat release rate fluctuations. This approach of phase averaging is particularly relevant as the dominant oscillations in the present combustion chamber are primarily governed by oscillations centered around a single frequency.
Results and discussions
Combustion noise to azimuthal instability transition
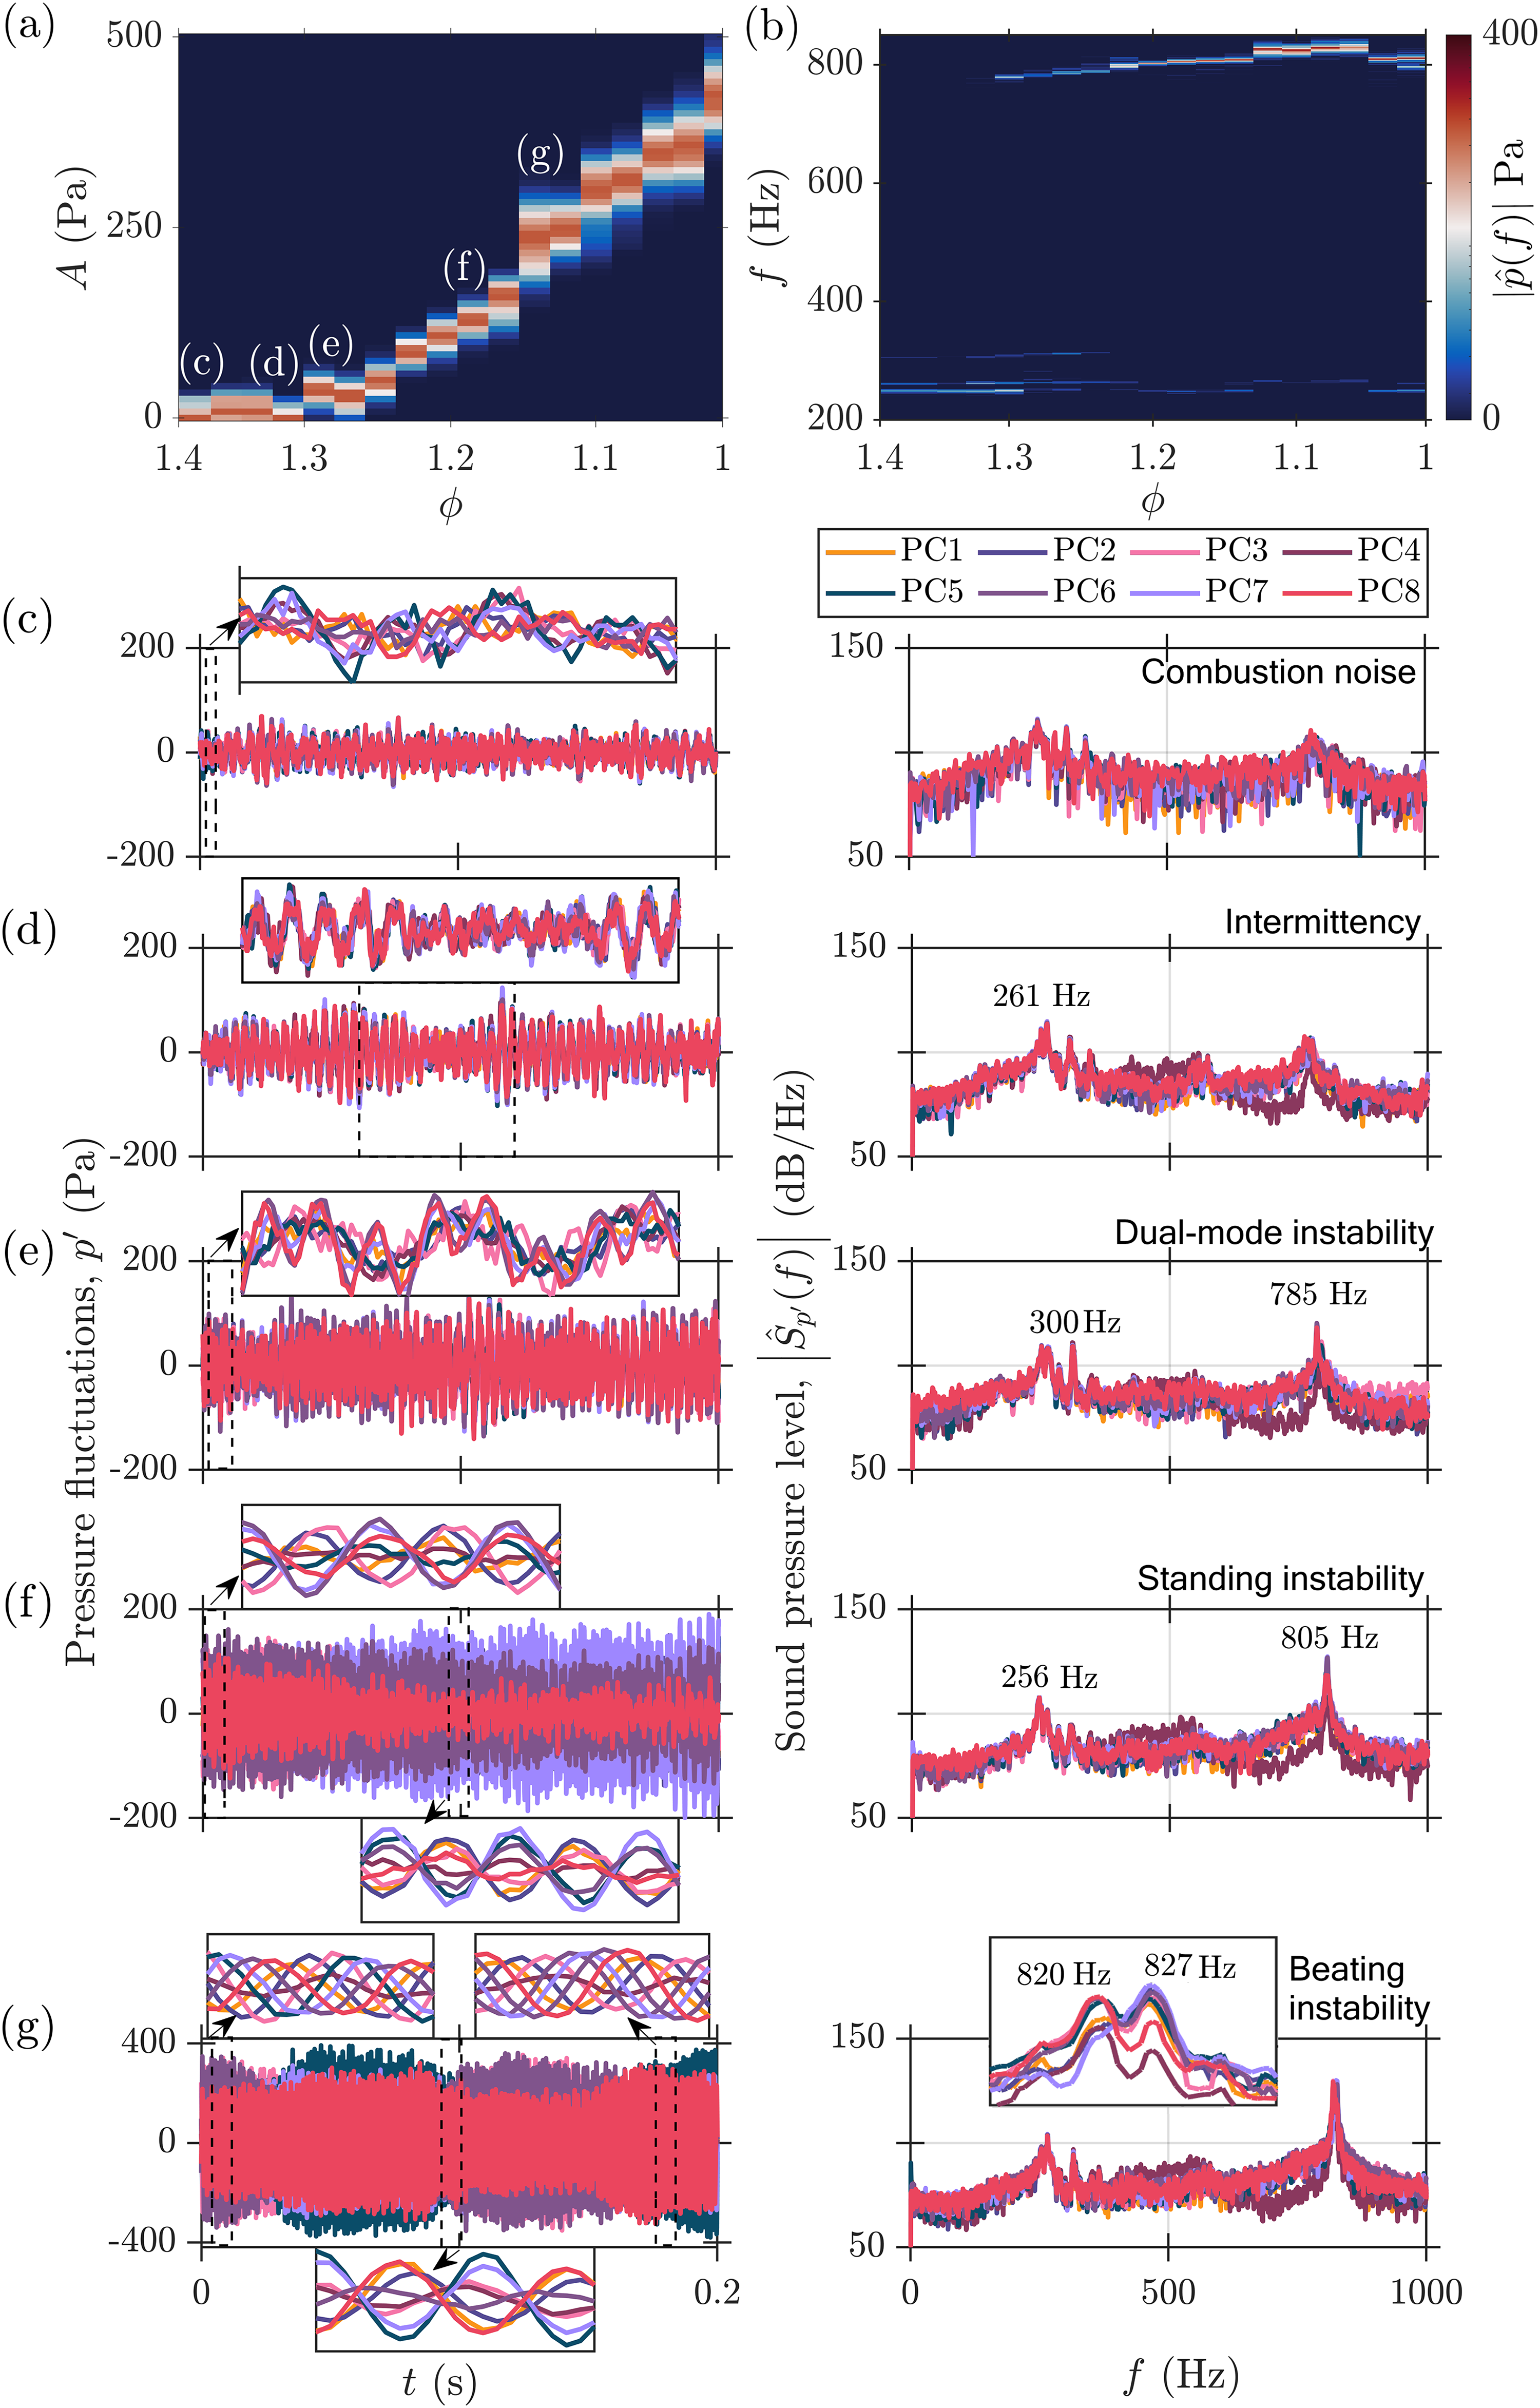
We begin our discussion by exploring the transition from a stable state to azimuthal thermoacoustic instability in the annular combustor, as shown in Figure 3. For the frequency analysis of the acoustic pressure () signal, we employed the fast Fourier transform algorithm (FFT). The datasets were sampled at 10 kHz to accurately capture the limit cycle signal. We have utilized 1 second duration of data for the current analysis, resulting in approximately 10,000 data points. To avoid any spectral leakage, we have implemented the FFT with a frequency resolution of 0.3 Hz per bin, spanning a total of 8193 bins. Figure 3(a) illustrates the variation in the amplitude of acoustic pressure (A), calculated using equation (6), as a function of the equivalence ratio (). Figure 3(b) highlights the change in the dominant frequency of the acoustic pressure at position PC2 (Figure 1(c)). Each value corresponds to a specific dominant frequency, which shifts from the low-frequency range of approximately Hz to the high-frequency range of around Hz. The frequency variation of 30 Hz is obtained through visual inspection from Figure 3(b). As we vary the equivalence ratio, we observed a continuous increase in A (Figure 3(a)), and a notable shift in frequency from a lower to a higher range in Figure 3(b). This shift in the frequency of the acoustic pressure signifies the transition from longitudinal to azimuthal thermoacoustic instability.
Observed transition from a state of combustion noise to azimuthal thermoacoustic instability in a turbulent annular combustor. (a) The variation of A and (b) the frequency of from position PC2 as a function of equivalence ratio (). Time traces and the sound pressure level of the acoustic pressure fluctuations () from eight equispaced pressure sensors during (c) combustion noise, (d) intermittency, (e) dual-mode instability, (f) standing azimuthal instability, and (g) beating azimuthal instability. The transition involves a frequency shift—from a low frequency associated with the longitudinal mode to a higher frequency associated with the azimuthal mode. Experimental conditions: (c) , (d) , (e) , (f) , and (g) .
In Figure 3(c) to (g), we show the time series and sound pressure level of from all eight locations during different states of combustor operations in a sequence as marked in Figure 3(a). At , in Figure 3(c), we observe aperiodic pressure fluctuations in the time series of (see insets) and broadband spectrum in the sound pressure level, indicating the state of combustion noise. As we decrease to 1.32, in Figure 3(d), we notice intermittent bursts of longitudinal periodic oscillations amidst aperiodic fluctuations (see insets), indicating the occurrence of intermittency.37 We confirmed that the epochs of the periodic fluctuations during the current state are predominantly longitudinal in nature, given the negligible phase difference observed among all eight pressure signals (not shown here). Notably, the sound pressure level corresponding to this state starts narrowing around 260 Hz, which corresponds to the longitudinal mode of the combustor. Upon further decreasing to 1.28, Figure 3(e) displays a coexistence of both azimuthal mode and longitudinal mode with distinct frequencies in the time series of . For a closer look at the time series of , refer to the zoomed-in view provided in Figure 5(a). The coexistence of two modes strongly indicates the presence of dual-mode instability, first observed by Fang et al.22 in their experimental study. Interestingly, the corresponding sound pressure level shows almost equal amplitudes for the longitudinal and azimuthal modes. The dominant frequency for the longitudinal mode has shifted from 261 to 300 Hz, while the azimuthal thermoacoustic mode is around 785 Hz. Upon closer examination, we observed two peaks in the low-frequency range, where one peak is located around 260 Hz, and the other is around 300 Hz. Recent studies have shown that combustors can exhibit multiple acoustic modes, which can either coexist or compete, depending on nonlinear interactions.40,39,38 The presence of these two closely-spaced modes in our combustor corresponds to longitudinal modes, as confirmed in Figure 5. Given that the sharp peak at 300 Hz exhibits a higher amplitude compared to the broader peak around 260 Hz, we consider the peak at 300 Hz as indicative of the longitudinal mode. The combined longitudinal and azimuthal modes exhibit specific time-varying modal dynamics during their occurrence, necessitating further analysis discussed in the next section.
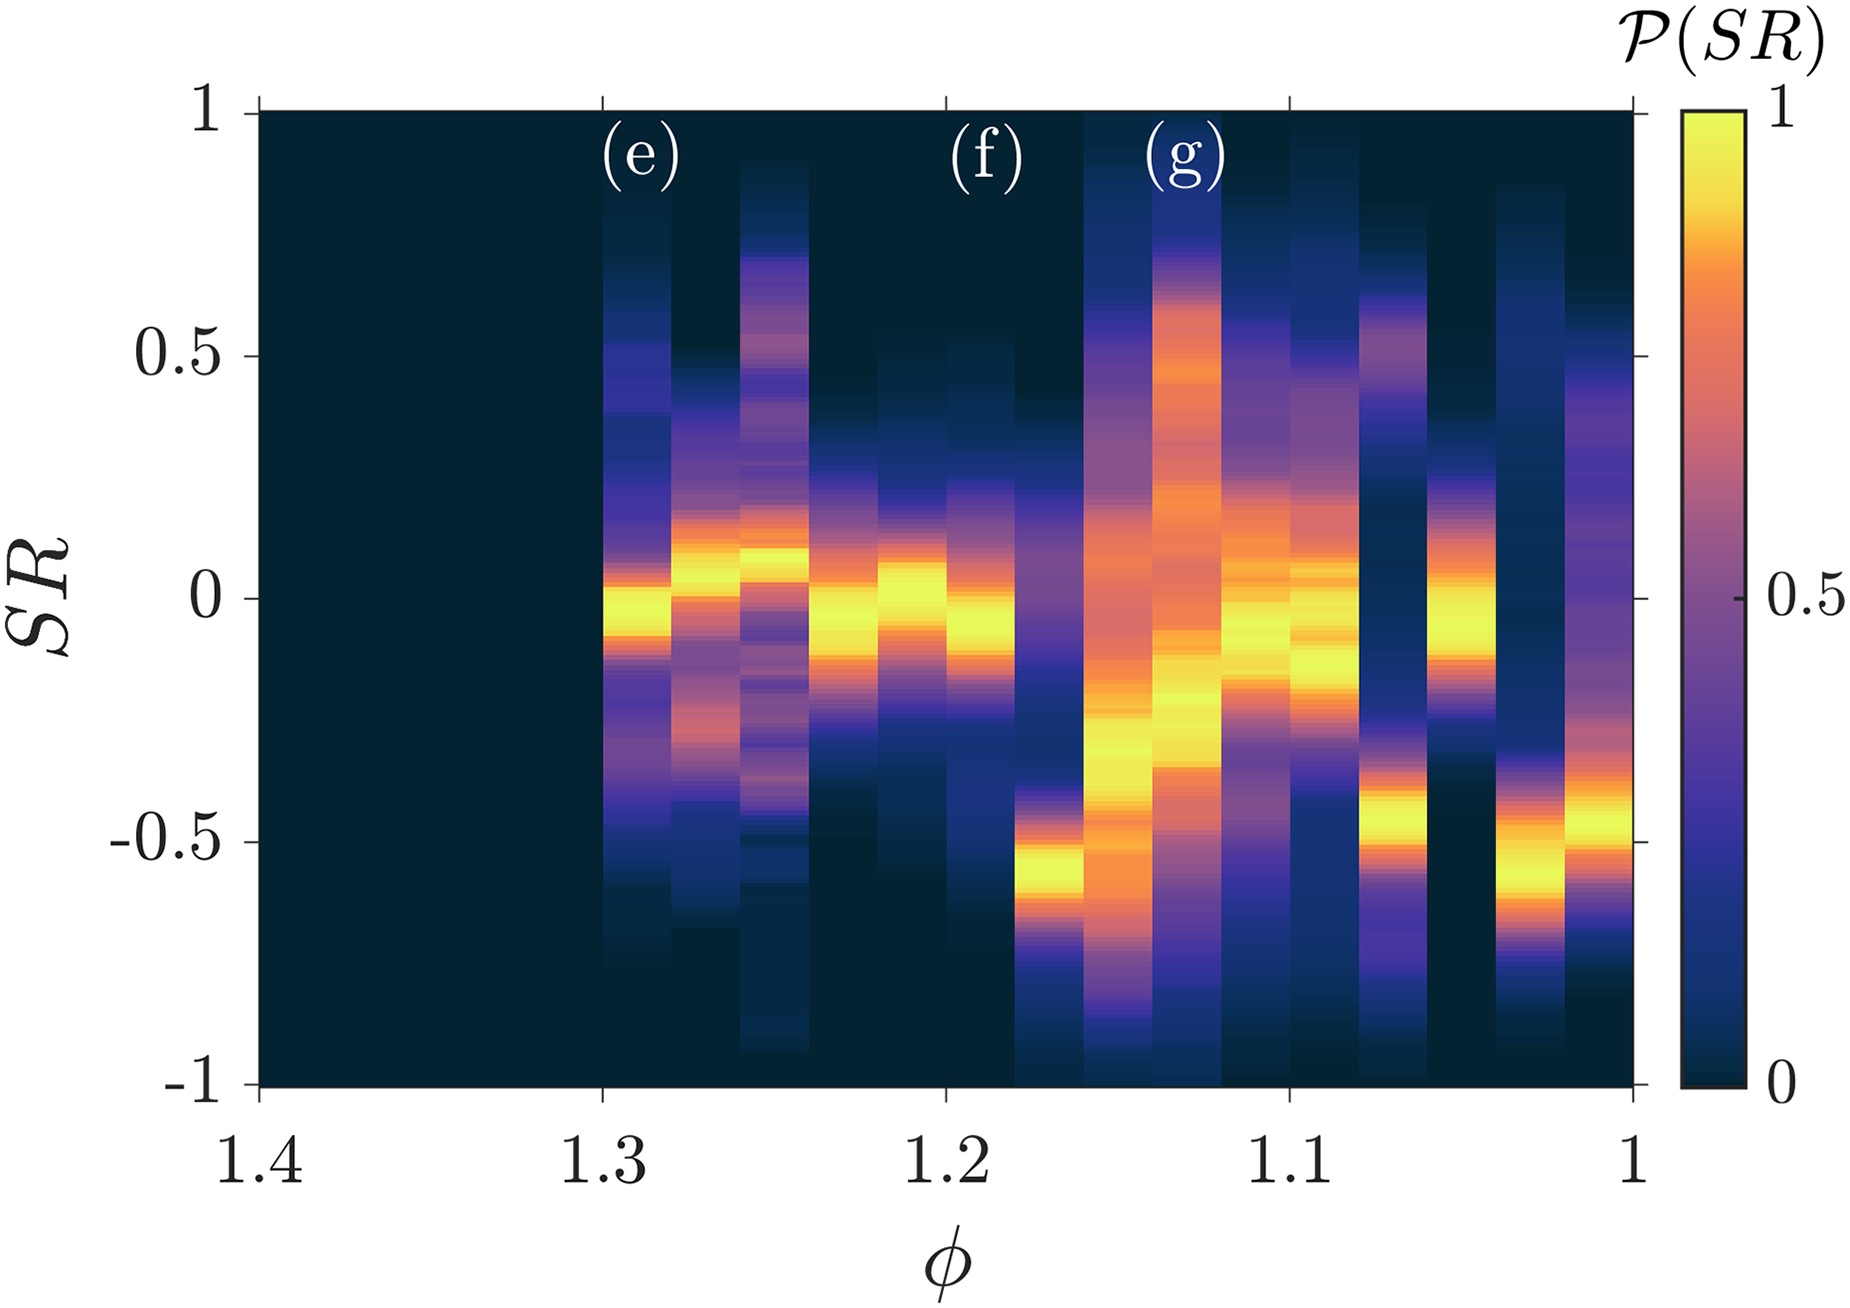
Variation in the distribution of SR as a function of equivalence ratio () indicates the change in the azimuthal mode dynamics during the thermoacoustic transition. The azimuthal mode changes from a standing azimuthal mode to a periodic alternation between CCW and CW spinning waves through the standing wave, later evolving into sporadic switching between CCW and CW spinning waves through the standing wave. SR: spin ratio; CCW: counterclockwise; CW: clockwise.
(a) and (b) Evolution of time series and scalogram of the acoustic pressure oscillations during the dual-mode instability at . (c) and (d) Selected windows in the pressure time series are bandpass filtered in the range Hz and Hz, respectively. (e) and (f) Probability density function of the phase difference () of all pressure signals with respect to the signal in PC2. As explained in the text, comparing panels (c) and (d) with (e) and (f) helps to clearly distinguish the co-existence of longitudinal and azimuthal modes during the state of dual-mode instability.
In Figure 3(f), we observe standing azimuthal oscillations with a slow rotation of the nodal line when reaches 1.20 (also refer to Figure 7(a) for a zoomed-in view). In the corresponding spectral plot, we identify two prominent peaks: one at approximately 256 Hz, indicating the presence of the longitudinal mode, and another at around 805 Hz, indicating the azimuthal mode. Remarkably, we notice the amplitude of the peak at 805 Hz is significantly higher than that of the peak at 256 Hz. Recent experimental studies have reported the rotation of the nodal line in a random26 and deterministic fashion.41,30 In our case, the motion of the nodal line appears to oscillate periodically in a deterministic fashion discussed in Figure 7(d). With further decrease in , we observe a complex sequence of dynamical states between spinning and standing azimuthal modes along with amplitude modulation in Figure 3(g) (at = 1.14). Please also refer to Figure 8(a) for a zoomed-in view. The combustor exhibits a CCW spinning mode, followed by standing mode, CW spinning mode, and again standing mode. The dominating peak frequency associated with the azimuthal thermoacoustic mode displays two peaks: one at approximately 820 Hz and the other at . Upon closer inspection of the spectrum, we notice two peaks separated by approximately Hz, which corresponds to the frequency of beating. This dynamical state is referred to as the beating azimuthal instability in literature.31,25 This dynamical state can arise due to tiny non-uniformities in the geometry, impedance variations of the cavity walls, or flow irregularities.
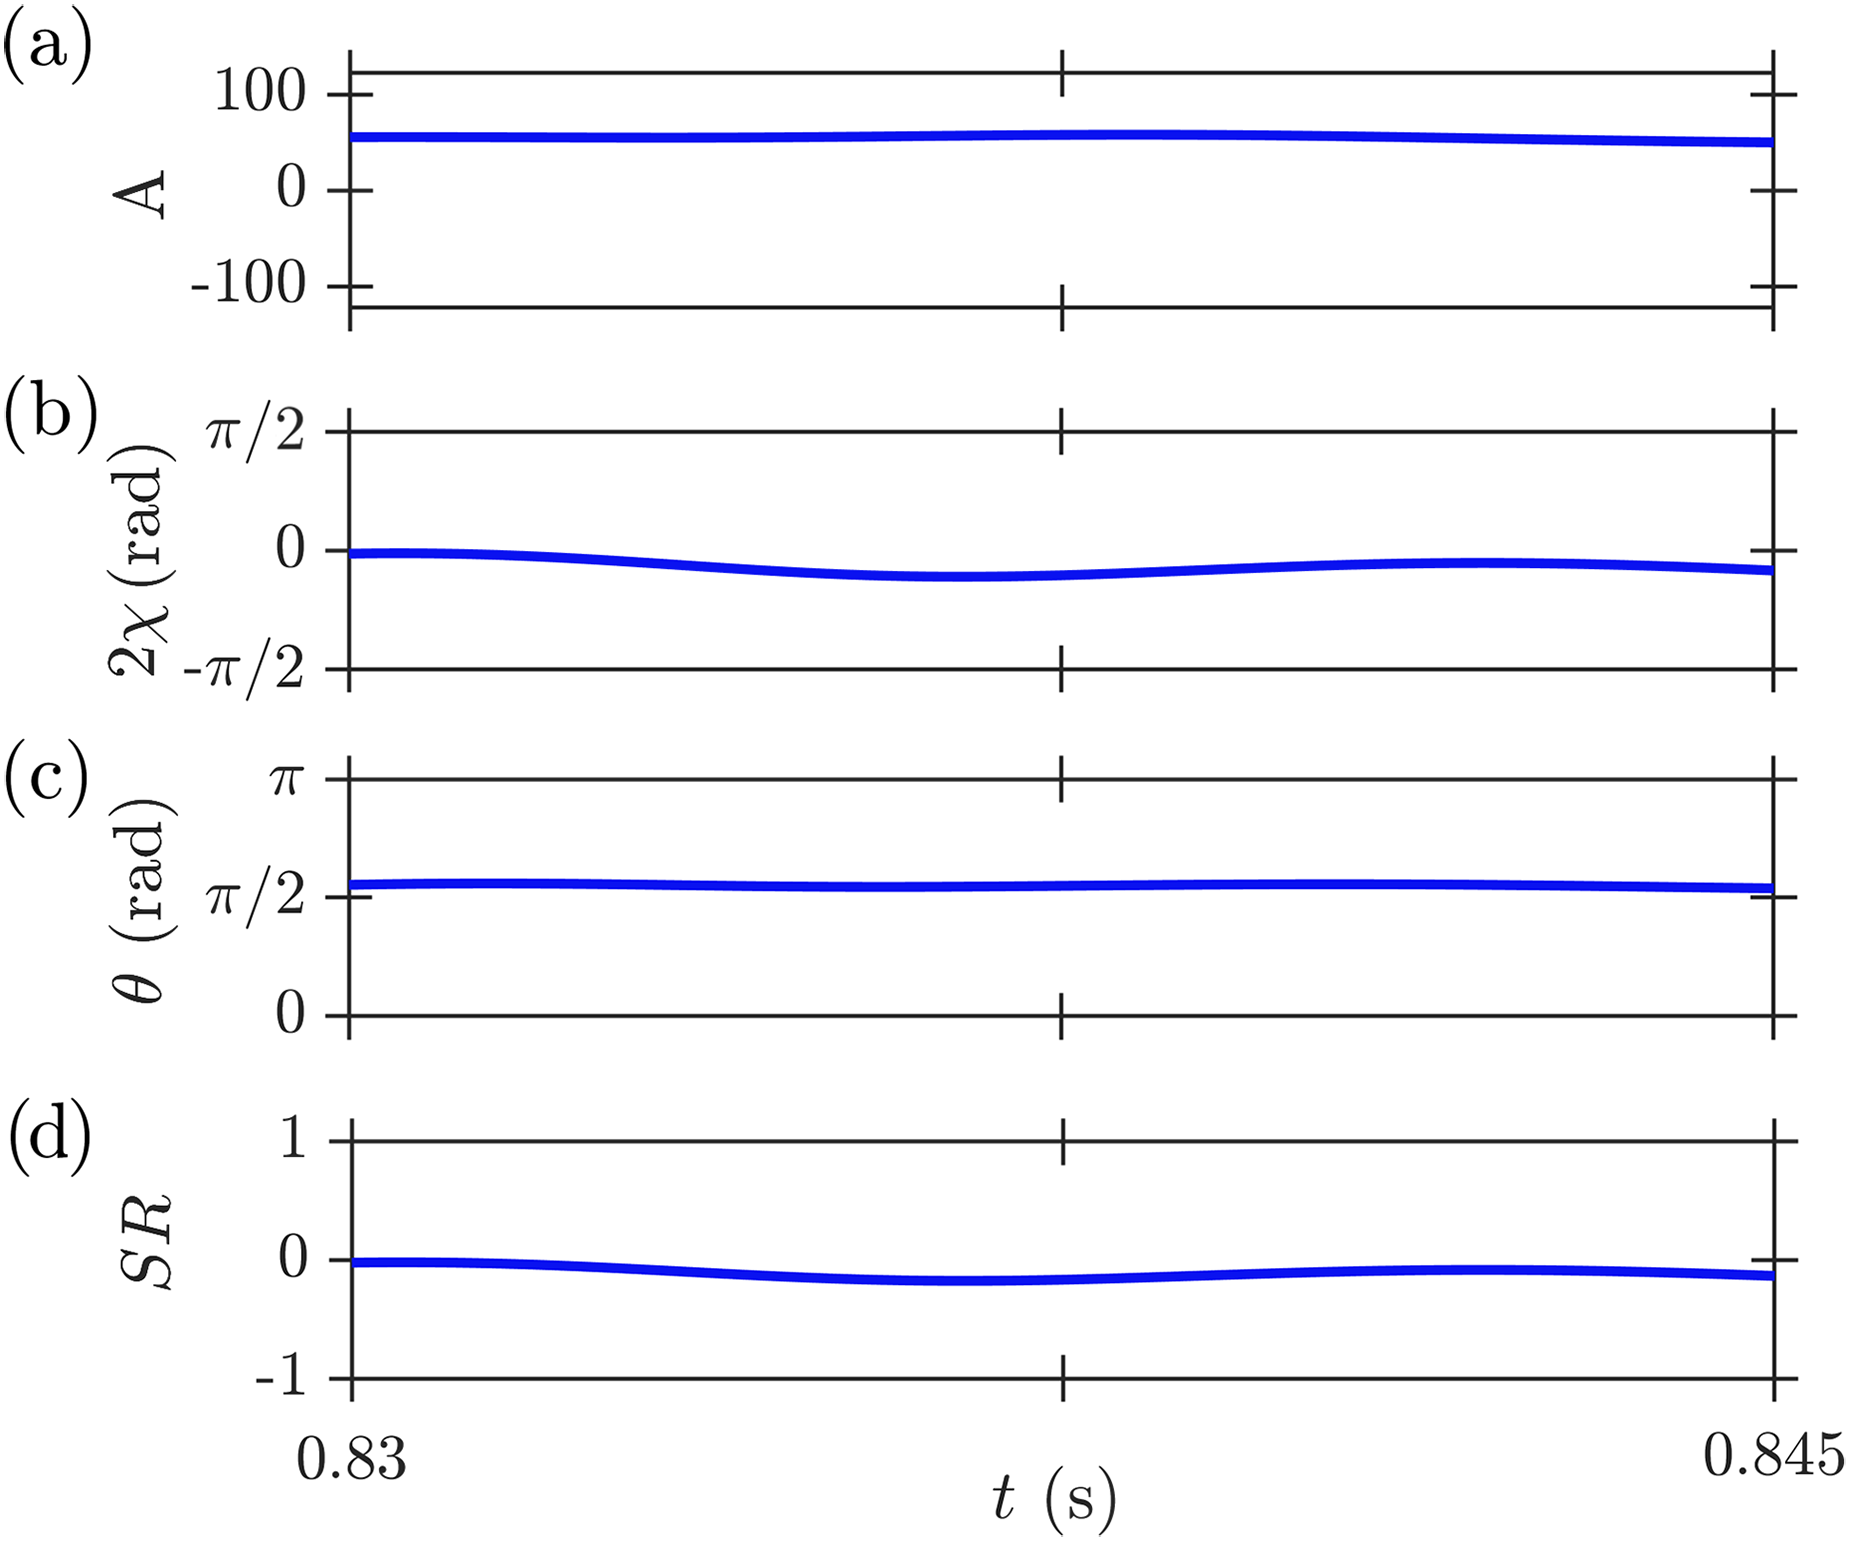
Evolution of (a) amplitude (A), (b) nature angle (), (c) orientation angle (), and (d) spin ratio (SR) exacted using time series of during the azimuthal mode of dual-mode instability. The extraction of the instantaneous state variables A, , and from the acoustic pressure signals is performed using the method proposed in Ghirardo and Bothien.36.
(a) Time series of the acoustic pressure along with slowly varying amplitude (A) and (b) the corresponding scalogram during the standing azimuthal instability at . (c) to (e) Evolution of the nature angle (), orientation angle (), and spin ratio (SR) defining the dynamical state of the azimuthal thermoacoustic mode. Here, the nodal line switches periodically during the standing azimuthal instability.
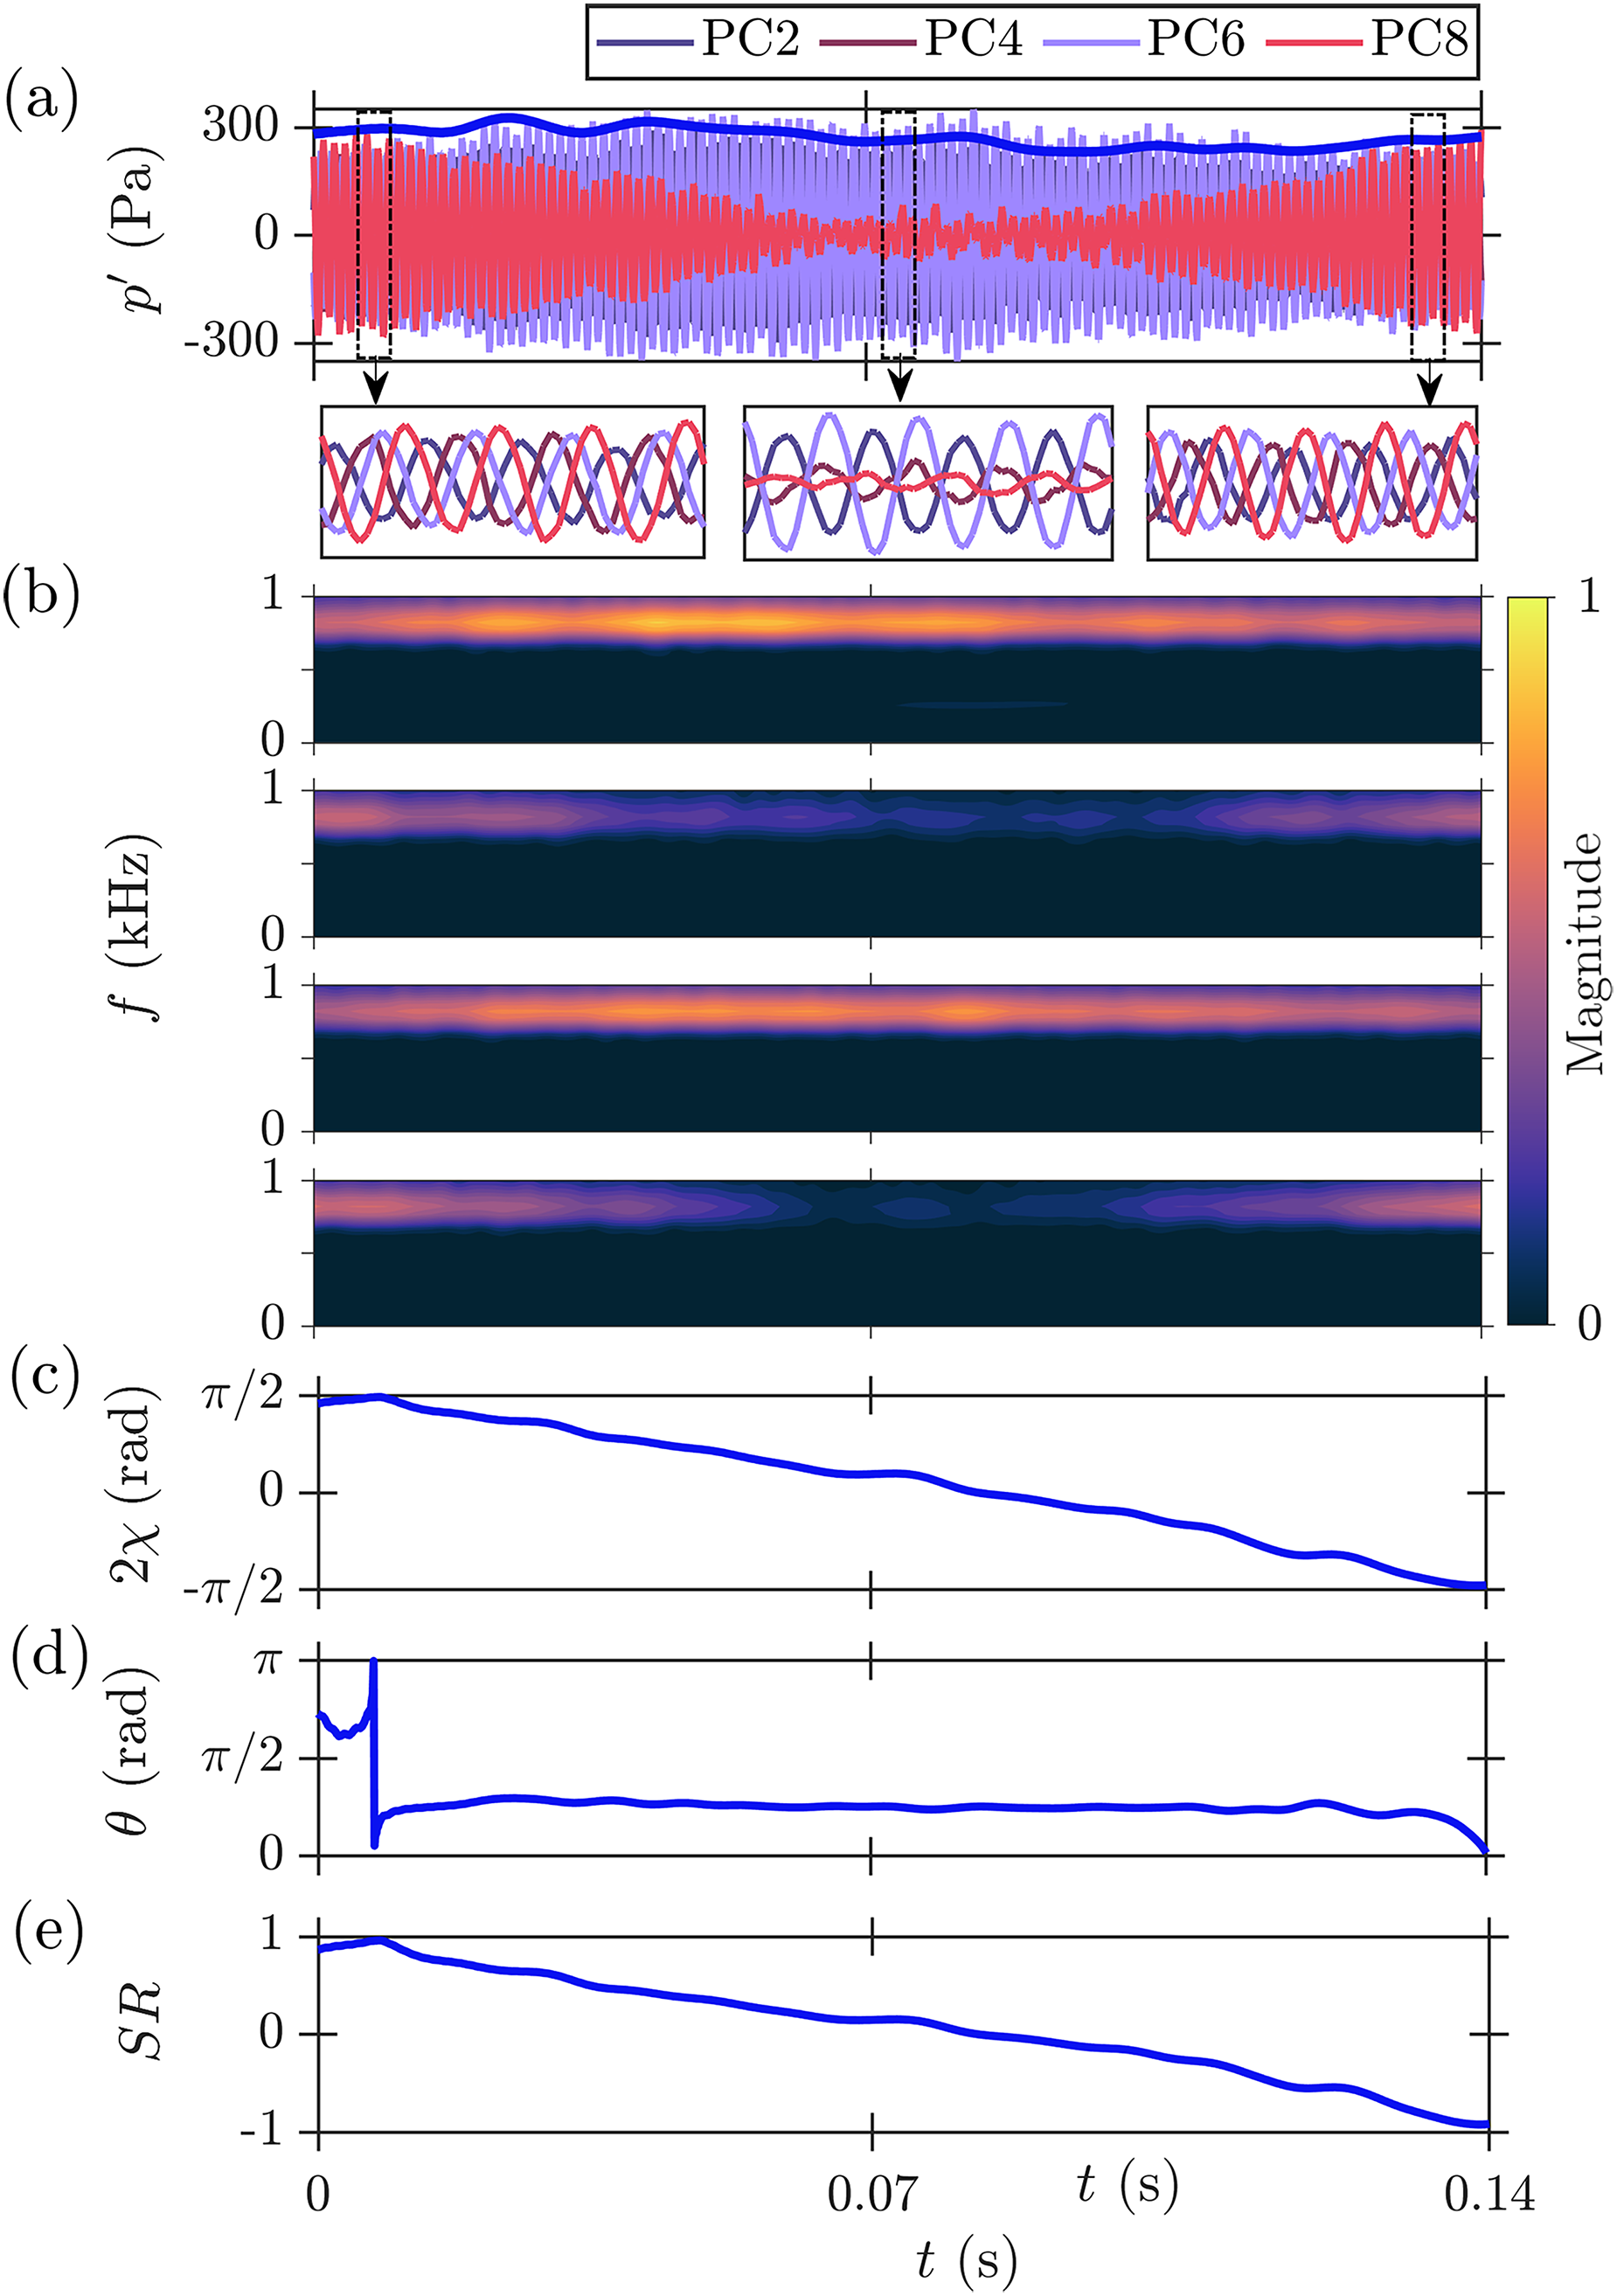
(a) Time series of the acoustic pressure along with slowly varying amplitude (A) and (b) the corresponding scalogram during the beating azimuthal instability at . (c) to (e) Evolution of the nature angle (), orientation angle (), and SR defining the dynamical state of the azimuthal thermoacoustic mode. Evidently, a sequence of CCW spinning, standing, and CW spinning waves is observed from left to right. SR: spin ratio; CCW: counterclockwise; CW: clockwise.
Azimuthal modal dynamics during the thermoacoustic transition
Using the mode indicator discussed in equation 7, we investigate the change in the azimuthal modal dynamics as a function of . We assess the modal dynamics by examining the distribution of SR across different values of , as shown through the probability density function of SR distributions. In Figure 4, we show the distribution in SR as a function of . For the value of between 1.4 and 1.3, we observed the state of combustion noise and intermittency, denoted by “(c)” and “(d)” in Figure 3. Given our emphasis on azimuthal modal dynamics, we neglect these states and commence analysis from onwards. Detailed explanations of these two dynamic states, namely combustion noise and intermittency, are extensively delineated in Roy et al.34 and Singh et al.35.
We first apply a bandpass filter to each time series of acoustic pressure with a bandwidth of Hz, centered around the peak frequency to calculate SR. At , we observe , indicating a standing azimuthal mode as . The spread in the suggests the time-varying SR between −0.5 and 0.5 with the maximum probability of forming standing azimuthal mode. This state is denoted as “(e)” in Figure 3(a) and referred to as the dual-mode instability. As is decreased, we notice a sharp peak in the distribution. Specifically, at , SR is very close to zero, indicating pure standing azimuthal mode. This state is denoted as ’‘(f)” in Figure 3(a). As the value of is varied past 1.2, we observe a spread in SR between −1 and 1, implying the thermoacoustic mode is switching between CCW and CW spinning through standing mode, highlighting the presence of beating azimuthal instability in the combustor. For instance, at , we observe the SR varying approximately between −1 and 1, with peak probabilities concentrated between −0.6 and 0.6. Here, indicates that the azimuthal mode switching between CCW and CW spinning waves is always through the standing wave. On further decreasing , we notice irregular switching between CCW and CW spinning mode through the standing mode.
Characterizing dynamical states during the transition to azimuthal thermoacoustic instability
In order to further understand each dynamical state observed in the annular combustor during the transition to azimuthal thermoacoustic instability, we examine the temporal behavior of different dynamical states. For brevity, we have not shown the temporal dynamics of the acoustic pressure and spatiotemporal dynamics of the flame during the state of combustion noise and intermittency as it is discussed elsewhere.34,35
Figure 5 shows the portion of the original time series and scalogram of , filtered time series of associated with the longitudinal and azimuthal modes, and the corresponding probability density function () of the phase difference () during the dual-mode instability discussed in Figure 3(e). To improve clarity, the time series from four pressure transducers (PC2, PC4, PC6, and PC8) located apart are displayed, and the scalogram plot for PC2 is shown. In Figure 5(a), the periodic amplitude modulation of is associated with dual tonal peaks before applying any spectral filtering. Specifically, the signal corresponds to the simultaneous existence of both the azimuthal mode and the longitudinal mode. The scalogram displaying two tonal peaks around 300 and 785 Hz is shown in Figure 5(b). The tonal peaks are of almost equal strength, where 300 Hz is associated with the longitudinal mode and 785 Hz is associated with the azimuthal mode. We apply a bandpass filter on the time series of to decouple the two modes, which simplifies our analysis.
Figure 5(c) shows the time series of associated with the longitudinal mode when bandpass filtered in the range [220, 320] Hz, while Figure 5(d) shows the same time series but now associated with the azimuthal mode when bandpass filtered in the range [735, 835] Hz. Figure 5(c) depicts the signals from all four pressure transducers are in-phase during the longitudinal mode, while in Figure 5(d) PC2 and PC4 are out-of-phase to PC6 and PC8, further confirms standing azimuthal mode in the combustor. Moreover, associated with the longitudinal mode shows the phase difference of PC4, PC6, and PC8 with respect to PC2 is negligible (see Figure 5(e)). In contrast, associated with the azimuthal mode shows the phase difference of PC4 with respect to PC2 is negligible, and the phase difference of PC6 and PC8 with respect to PC2 is (see Figure 5(f)).
To better understand the azimuthal thermoacoustic mode during the dual-mode instability shown in Figure 5(d), we adopt the quaternion-based formalism elucidated in the preceding section. We decompose the acoustic pressure oscillations () into CW and CCW waves using slow flow variables obtained from the eight pressure transducers (PC1, PC2, .., PC8), allowing a reconstruction of the pressure amplitude (A), nature angle (), orientation angle (), and SR. In Figure 6(a) depicts the evolution of the amplitude of the azimuthal mode (A). Figure 6(b) shows the evolution of , which oscillates around and corresponds to a mode near the equator in the Bloch sphere. This behavior indicates the presence of the standing azimuthal mode in the combustor.36,42,30Figure 6(c) presents the evolution of the orientation angle , which determines the location of the pressure antinodes of the standing azimuthal wave. It is worth noting that the angle for the dual-mode instability exhibits oscillations around , which strongly suggests that the position of the nodal line is almost constant in time. Finally, panel (d) displays the temporal variation of the SR, which exhibits oscillations centered around zero. Remarkably, SR remains around zero when decoupled from the longitudinal mode, implying that both CCW and CW waves exhibit nearly equal amplitudes (), as defined for the standing azimuthal mode in the combustor.
We next discuss the temporal dynamics of the pure standing azimuthal mode with a moving nodal line, which corresponds to marker “(f)” in Figure 3(a). In Figure 7(a) illustrates the time series of along with the zoomed-in views at two distinct windows in the same time series. These two time series windows reveal the modulation in amplitude and phase difference of from the eight pressure transducers (four are shown here) around the annulus. Figure 7(a) also depicts the evolution of the amplitude of the standing azimuthal instability (A) indicated in blue color. Figure 7(b) presents the evolution of the frequency from four transducers (PC2, PC4, PC6, and PC8), demonstrating the modulation in the amplitude of in the scalogram plots. For instance, at around 0.85 s, all four scalogram plots distinctly exhibit a nearly identical amplitude of , while at around 1.1 s, a noticeable disparity emerges: PC4 and PC8 manifest higher amplitudes of , whereas PC2 and PC6 display a minimized amplitudes. Therefore, we can be certain of the transitional switching of standing azimuthal mode and the nodal line position in the combustor. Figure 7(c) shows the evolution of , which oscillates around , indicating the standing azimuthal mode as the mode oscillates near the equator in the Bloch sphere. Figure 7(d) presents the evolution of the orientation angle , which determines the location of the pressure antinodes of the standing azimuthal wave. It is worth noting that the angle exhibits oscillations between and , which strongly suggests that the nodal line is moving in a seemingly periodic fashion. Lastly, Figure 7(e) displays the temporal variation of the SR, which exhibits oscillations centered around zero, implying that the amplitudes of the CCW and CW waves are nearly equal in strength.
In Figure 8, we show the temporal dynamics of the beating azimuthal instability corresponding to marker “(g)” in Figure 3(a). Here, Figure 8(a) depicts the time series of , complemented by the concurrently varying amplitude (A) highlighted in blue. Additionally, zoomed-in views are presented in three distinct temporal windows within the same time series. Moving from left to right, we can clearly identify the presence of a CCW spinning mode, a standing mode, and a CW spinning mode. Figure 8(b) displays the scalogram of the acoustic pressure obtained from PC2, PC4, PC6, and PC8 locations. The scalogram shows the CCW and CW spinning mode at the extreme left and right of the panel, where all four-time series exhibit nearly equivalent amplitudes of and narrowband spectrum. However, at 0.07 s, in the middle of the time series of , we observe the narrowband spectrums in PC2 and PC6 due to periodic oscillations in , while PC4 and PC8 exhibit broadband spectrum due to aperiodic fluctuations. This arrangement of the scalograms from four pressure transducers at to each other indicates the existence of the standing azimuthal mode. Figure 8(c) illustrates the oscillation in is between to (known as poles in Ghirardo and Bothien36), indicating the switching of azimuthal modes between two poles through the equatorial plane. Figure 8(d) shows that the location of the pressure anti-node () remains constant during the standing mode, indicating a fixed nodal line at . Finally, in Figure 8(e), we observe that the SR oscillates between 1 and −1 at the extremes and remains at 0 in the middle, indicating the switching from CCW spinning mode () to CW spinning mode () through the standing mode () at a beating frequency of 7 Hz.
We discussed the temporal behavior of various dynamical states using a quaternion-based formalism. Now, to understand the behavior of the flames during these dynamic states, we discuss the global flame dynamics and quantify the interaction of neighboring flames.
Flame dynamics during the transition to azimuthal thermoacoustic instability
In this section, we investigate the flame dynamics through the phase-average heat release distribution along the annulus and quantify the interaction of neighboring flames associated with the different dynamical states discussed in the previous section. We show the normalized phase-averaged value of the heat release rate from the mean-subtracted chemiluminescence images at non-dimensional time steps of the acoustic pressure cycle. Here, the phase-averaged heat release rate field is indicative of the evolution of the flame structure at different points in the acoustic cycle. The procedure to obtain the normalized phase-averaged heat release rate field is discussed in the preceding section. For our study, we divide the data into six non-dimensional time steps () in the acoustic cycle during the azimuthal mode and nineteen in the acoustic cycle during the longitudinal mode. This choice aligns with the sampling frequency of images and the frequency of the acoustic pressure oscillations, resulting in six images per acoustic cycle for the azimuthal mode and approximately nineteen images for the longitudinal mode. During the azimuthal mode, the non-dimensional time steps are considered as follows: , , , , , and of the acoustic pressure cycle.
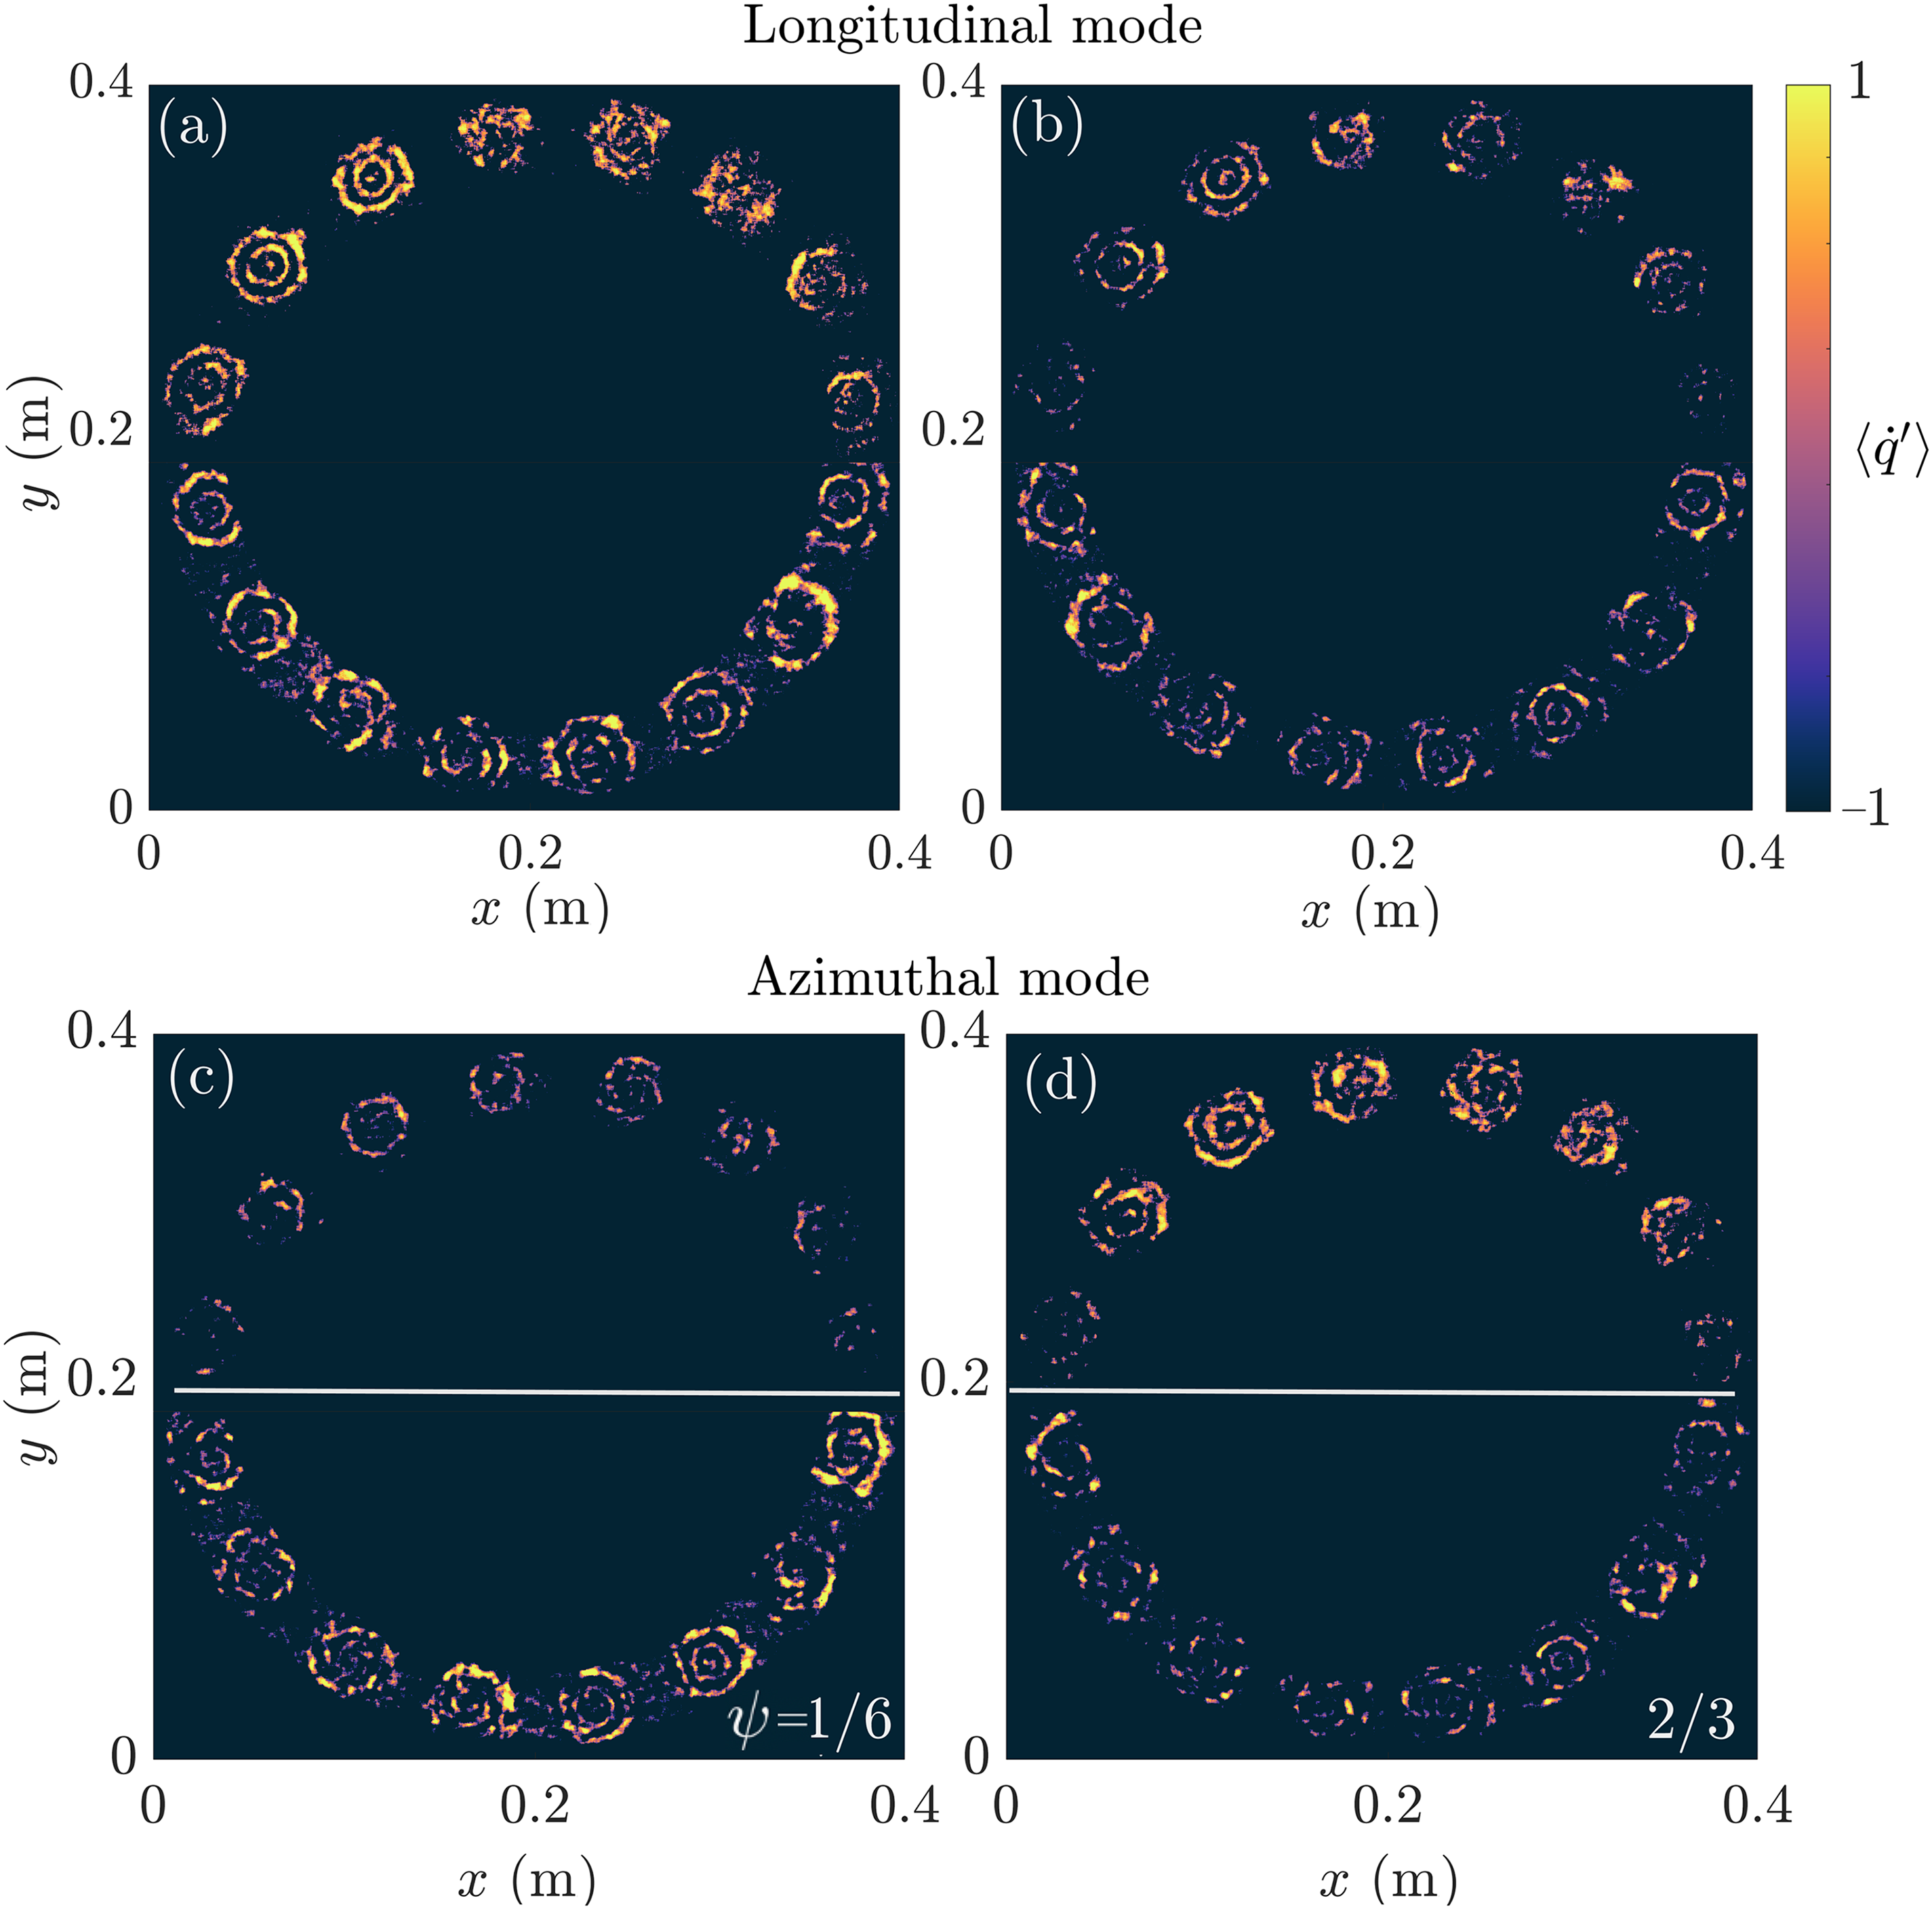
During the longitudinal mode of the dual-mode instability (Figure 5(c)), we illustrate the phase-averaged chemiluminescence image corresponding to the maxima and minima of in Figure 9(a) and (b)). The phase-averaged heat release rate field is shown at the pressure maxima and minima to facilitate a clear differentiation of the global swirling flame structures within flames. Across the majority of the sixteen burners, we observe the intensity to be maximum along the periphery of the swirling flames during the pressure maxima (see Figure 9(a)). These flames are bounded by the inner and outer shear layers with little recirculation, corroborating our earlier findings within the context of the low-amplitude longitudinal instability state discussed in Roy et al.34 and Singh et al.35. Since the two modes (longitudinal and azimuthal modes) are coupled, we notice certain burners, such as burners 14, 15, and 16, as per Figure 1(c), exhibit weak responses to the azimuthal mode. In contrast, during instances of pressure minima, the phase-averaged heat release rate field shows significantly diminished intensity along the periphery of the flame (see Figure 9(b)).
Phase-averaged global heat release rate viewed from above the annulus in two distinct scenarios: (a) and (b) during the pressure maxima and minima associated with the longitudinal mode of the dual-mode instability, and (c) and (d) and of the acoustic cycle associated with the azimuthal mode of the dual-mode instability. The white line represents the nodal line. This experimental investigation was conducted under the condition of .
During the azimuthal mode of the dual-mode instability (Figure 5(d)), we show the phase-averaged heat release rate field corresponding to two non-dimensional time-steps of the acoustic pressure cycle, specifically at and . In Figure 9(c) and (d), close to the pressure anti-node ( from the nodal line indicated in white), the flame response appears to be largely symmetric, which is associated with large axial and low transverse velocity fluctuations.43 In comparison, close to the pressure nodes (near the nodal line), a more asymmetric heat release distribution is observed, corresponding to negligible axial but strong transverse velocity fluctuations. Further, we notice the effect of the longitudinal mode on burners 14 and 15 in Figure 9(c) and burners 1 and 7 in Figure 9(d). The two coupled modes (longitudinal and azimuthal) clearly demonstrate the influence on the flame dynamics during the dual-instability mode.
Now, we discuss the flame dynamics during the pure standing azimuthal instability corresponding to marker “(f)” in Figure 3(a). In Figure 10, the pressure node regions are near the center of the flame image, indicated with a white line, while the pressure antinode regions are on the top and bottom. The non-dimensional time-steps and correspond to the instants in the cycle where the pressure oscillations are respectively maximum and minimum in the pressure signal from PC3. During these two non-dimensional time steps (), we observe the largest fluctuations in heat release rate appear close to the outer ring-like flame structures, which span almost half the annulus. These flame structures in the previous studies have been understood as the formation of coherent vortical structures responding to the acoustic pressure fluctuations.43 In swirling flames, the observed flame structures are specifically linked to the formation of vortex structures on the shear layers. These vortices undergo a roll-up process as they are advected downstream, rotating locally around each burner. We further notice that these ring-like flame structures exhibit clear symmetry in both width and oscillation magnitude, particularly in the combustor regions where the pressure reaches its maximum. Nevertheless, these flame structures are no longer continuous in the region of the combustion chamber where the acoustic pressure reaches its minimum level.
Phase-averaged chemiluminescence images at six normalized time steps () in the acoustic cycle during the standing azimuthal instability. Phase averaging is performed across the time trace of acoustic pressure fluctuations in the interval from 1.05 s to 1.15 s. The white line represents the nodal line. This experimental investigation was conducted under the condition of . Clearly, the flame dynamics manifest the formation of a standing wave pattern in the present dynamic state, observed while progressing through the images from (a) to (f) over the six normalized time steps.
Next, we discuss the flame dynamics during the beating azimuthal instability corresponding to marker “g” in Figure 3(a), where the temporal analysis shows the SR oscillating between 1 and −1 (refer Figure 8(e)). Illustrated from top to bottom, Figure 11(I) to (III) presents the flame dynamics (a) to (f) across the acoustic cycle at six normalized positions during the epochs of CCW spinning (), standing (), and CW spinning () modes. Figures 11(I) (a) to (f) illustrate the phase-averaged images of the fluctuating component of the heat release rate for a CCW spinning mode at six normalized time steps (). At , we notice a high intensity of heat release rate fluctuations in the top right-hand quadrant and a low intensity of heat release rate fluctuations at the diametrically opposite quadrant. The observed flame structure undergoes a CCW rotation around the annulus over the duration of the acoustic pressure cycle, as highlighted in Figure 11(I)(b) to (-f). These ring-like fluctuating flame structures exhibit clear symmetry in width and oscillation magnitude near pressure maxima. Additionally, larger oscillations in the heat release rate are evident on the sides of the flame aligned in the CCW azimuthal direction, away from pressure maxima. For instance, as illustrated in Figure 11(Ia), burner numbers 4–6 and 15–1 (as delineated in Figure 1(c)) exhibit maximum heat release rate oscillations on the respective sides of the flames aligned with the CCW wave direction. This observed pattern remains consistent across all six non-dimensional time steps.
(a) to (f) Phase-averaged chemiluminescence images at six normalized positions in the acoustic pressure cycle () during the epochs of (I) CCW spinning mode (), (II) standing azimuthal mode (), and (III) CW spinning mode () in the beating azimuthal instability. The flame dynamics distinctly illustrate the formation of CCW spinning, standing, and CW spinning wave patterns, observed while progressing through the images from (b) to (f) over the six normalized time steps. This experimental investigation was conducted with . SR: spin ratio; CCW: counterclockwise; CW: clockwise.
Figure 11(II) (a) to (f) illustrates the phase-averaged images of the fluctuating component of the heat release rate for a standing azimuthal mode at six different . In all six phase-averaged images, we notice a symmetric flame response close to the pressure anti-node located near PC1 and PC5. Close to anti-nodal positions, the flame response demonstrates significant symmetry, aligning with substantial axial and minimal transverse velocity fluctuations. Conversely, in proximity to pressure nodes, we notice a more asymmetric heat release distribution, corresponding to minimal axial but pronounced transverse velocity fluctuations. Next, in Figure 11(III) (a) to (f), we show the phase-averaged images of the fluctuating component of the heat release rate for a CW spinning azimuthal mode at six different . At , there is a noticeable high intensity of heat release rate fluctuations in the bottom right-hand quadrant and a low intensity at the diametrically opposite quadrant. The observed flame structure rotates around the annulus in a CW direction over the duration of the acoustic pressure cycle, as depicted in Figure 11(III) (b) to (f). These ring-like flame structures exhibit clear symmetry in terms of width and the magnitude of the intensity fluctuations near the pressure maxima. During the CW spinning azimuthal mode, larger oscillations in the phase-averaged heat release rate fluctuations are observed on the sides of the flames aligned in the CW azimuthal direction when away from pressure maxima. For example, in Figure 11(IIIa), burner numbers 2–4 and 11–13 (as identified in Figure 1(c)) showcase maximum heat release rate oscillations on the respective sides of the flames aligned with the CW wave direction. This trend persists consistently across all six non-dimensional time steps. Thus, the global flame behavior offers details of the overall thermoacoustic response of the annular combustor across various azimuthal modes.
Interestingly, during the azimuthal mode in dual-mode instability and the pure standing azimuthal instability, the nodal line (shown by the white line) consistently passes through the burners located near positions 1 and 9, as shown in Figures 9(c) and (d) and 10. In contrast, during the epochs of the standing azimuthal mode in the beating azimuthal instability, the nodal line shifts its position to pass near through the burners at positions 13 and 6, as indicated in Figure 11(II). The presence of the pilot flame tubing, extending into the combustion chamber from the backplane between burner numbers 6 and 7, may introduce some asymmetry. However, it is evident that this tubing alone may not be the sole factor influencing the preferred location of the nodal line.
Next, to quantify the interaction of neighboring flames under the influence of the acoustic field across various dynamical states, we present the distribution of phase differences in heat release rate fluctuations () with respect to the burner number. The calculation of involves subtracting the phase of heat release rate fluctuations from each flame, positioned from 2 to 16 by the phase of heat release rate fluctuations from the flame at position 1. The arrangement of the burners is depicted in Figure 1(c).
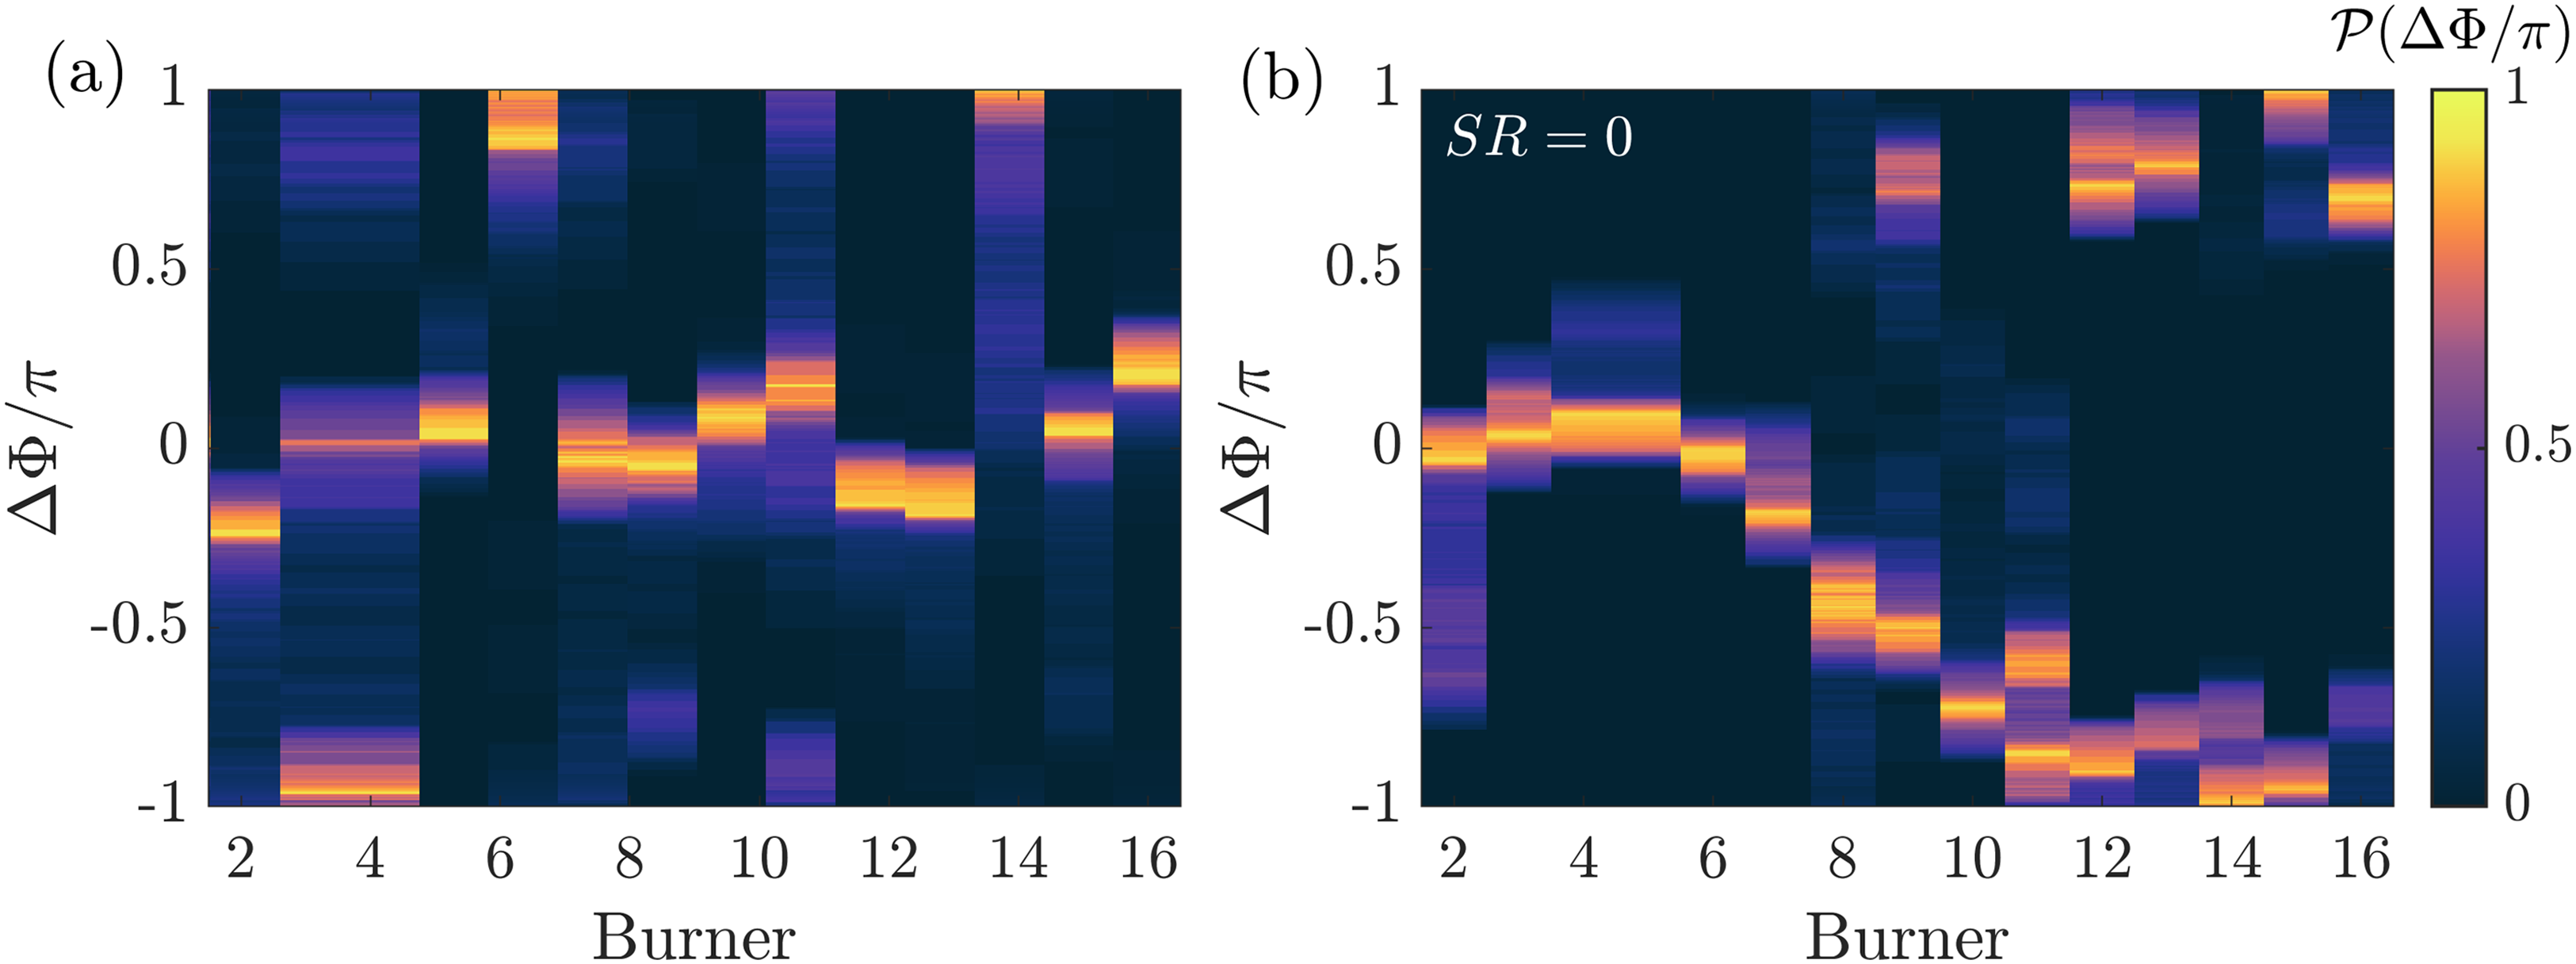
In Figure 12(a) and (b), we show the distribution of the normalized as a function of burner number during the dual-mode instability, associated with longitudinal and azimuthal mode separately (marked as “(e)” in Figure 3). During the occurrence of the longitudinal mode, Figure 12(a) shows that the distribution of normalized is near 0 for almost all the burners with a few burners near −1 and . This suggests that most of the flames are oscillating in-phase during this mode with a few flames exhibiting slight out-of-phase behavior. Notably, burner numbers 4, 6, and 14 are out of phase with respect to burner 1. This discrepancy could be influenced by acoustic wave propagation in the azimuthal direction, particularly as these burners are situated close to anti-nodal locations. In contrast, during the azimuthal mode of the dual-mode instability, as shown in Figure 12(b), flames positioned from 2 to 8 exhibit in-phase behavior, while flames at positions 9 to 16 are out-of-phase. Notably, flames 1–8 are located on one side of the nodal line, whereas the remaining eight flames are positioned on the opposite side, as illustrated in Figure 9(c) and (d). The spread observed in the distribution of normalized for certain burner numbers could be due to the coupling between the two modes.
Distribution of the normalized phase difference of heat release rate fluctuations from flames is examined as a function of burner number during the (a) longitudinal and (b) azimuthal modes of the dual-mode instability. Values of close to 0 signify that the heat release rate fluctuations from the adjacent burners are in-phase, whereas values near −1 and 1 denote that the heat release rate fluctuations from the adjacent burners are out-of-phase. The observed relative phase pattern implies a longitudinal mode when all adjacent burners are nearly in-phase and a standing azimuthal mode when flames at positions 2–8 demonstrate in-phase behavior, while flames at positions 9–16 exhibit an out-of-phase relationship.
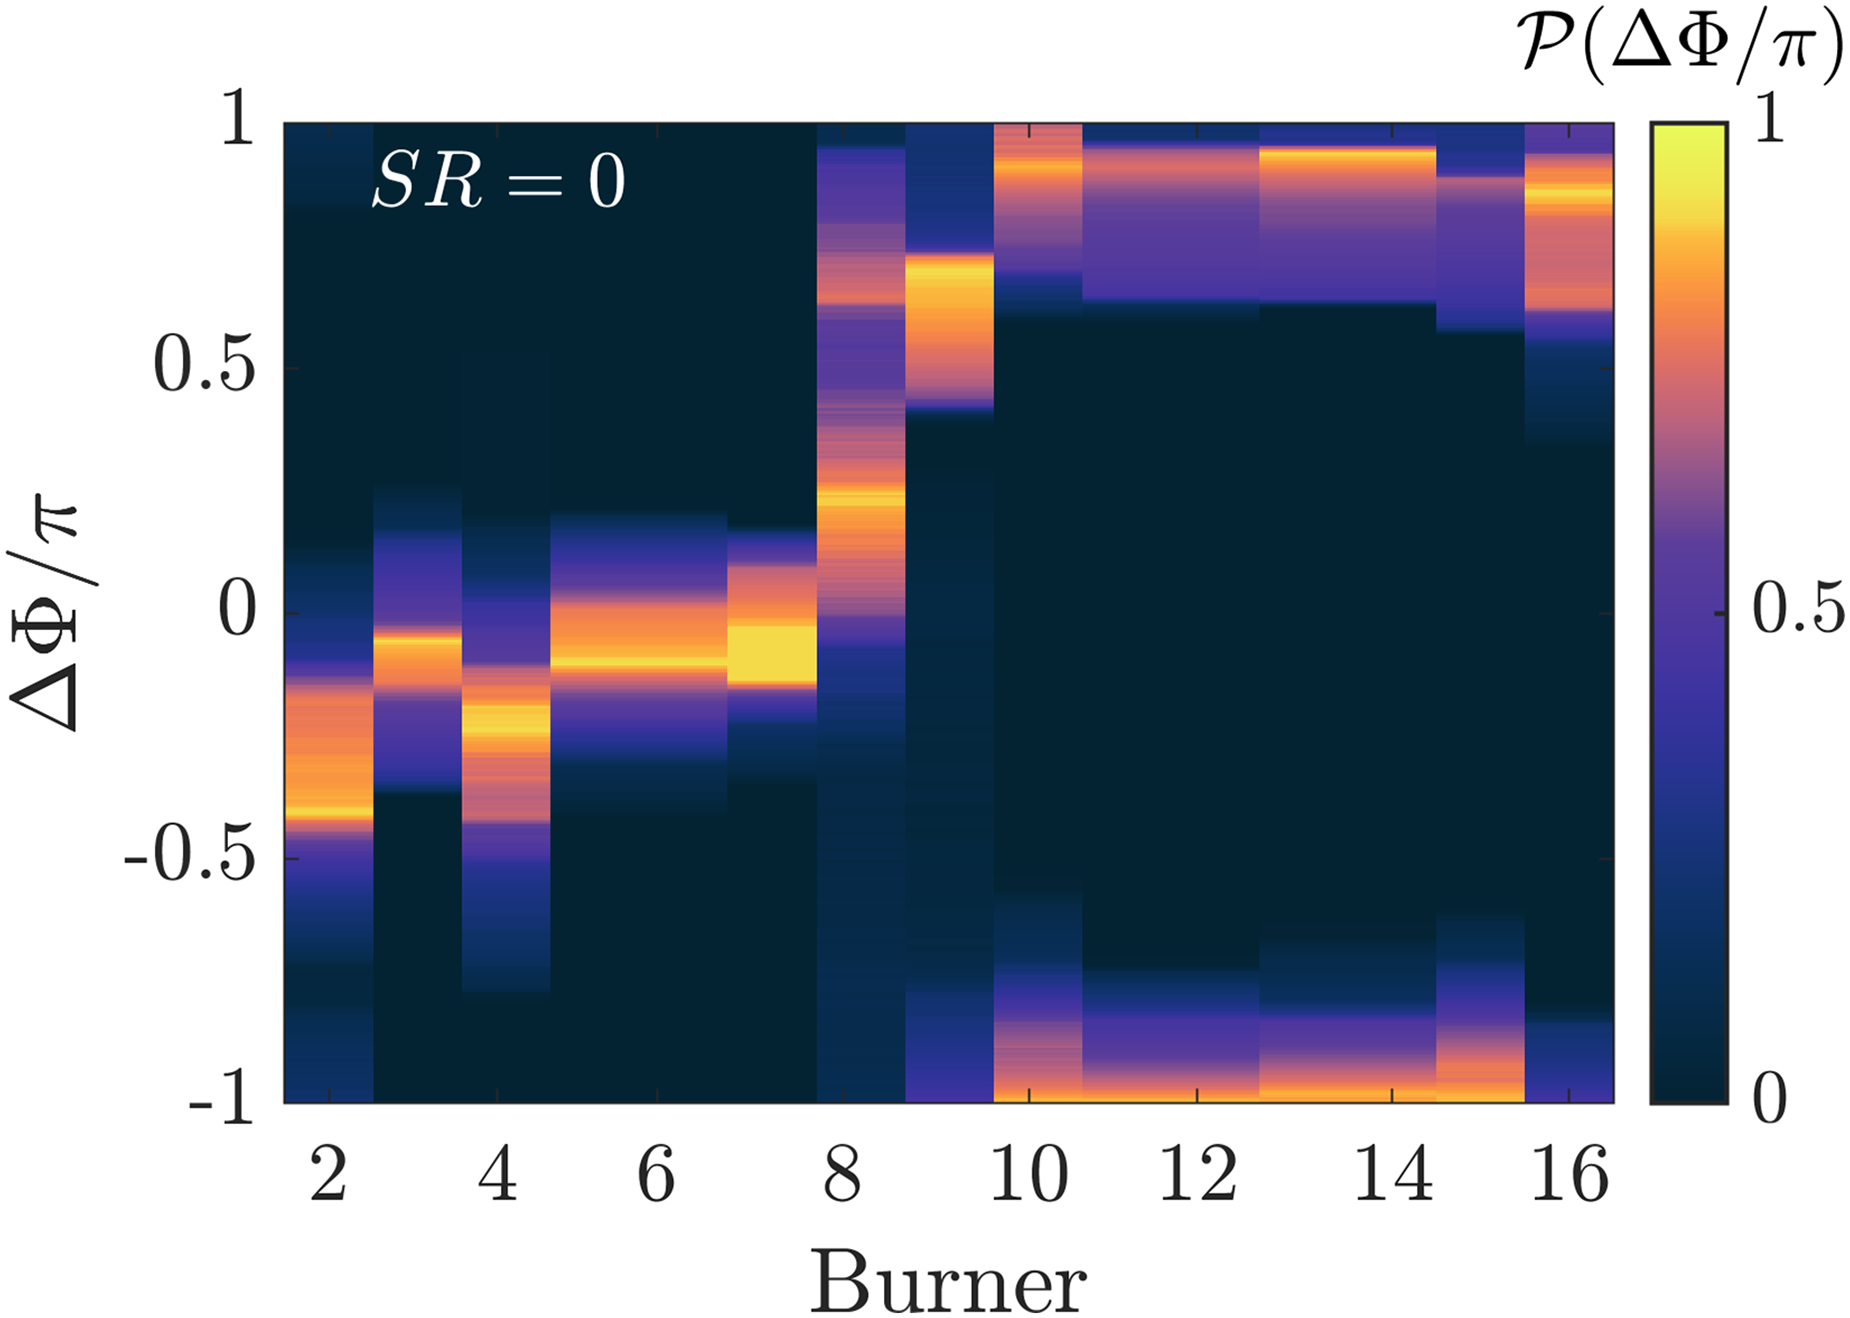
In Figure 13, we show the distribution of normalized across the burner numbers during the state of pure standing azimuthal instability, denoted as “(f)” in Figure 3. We observe the flames positioned from 2 to 8 exhibit the distribution in around , indicating their in-phase behavior. Conversely, flames located at positions 9 to 16 predominantly show the distribution in near −1 and , representing their out-of-phase characteristics. As before, flames 1–8 are situated on one side of the nodal line, while the remaining eight flames are positioned on the opposite side, as illustrated in Figure 10. Remarkably, the pattern in the distribution of relative phase during the pure standing azimuthal instability appears more distinct compared to the pattern observed during the azimuthal mode of the dual-mode instability.
Distribution of the normalized phase difference of heat release rate fluctuations from all the flames in the annular combustor is examined across burners during the pure standing azimuthal instability. Values of close to 0 signify that the heat release rate fluctuations from the adjacent burners are in-phase, whereas values near −1 and 1 denote that the heat release rate fluctuations from the adjacent burners are out-of-phase. Evidently, flames positioned from 2 to 8 demonstrate values of near zero, signifying in-phase behavior, while flames located at positions 9 to 16 exhibit values of near and −1, indicating their out-of-phase characteristics.
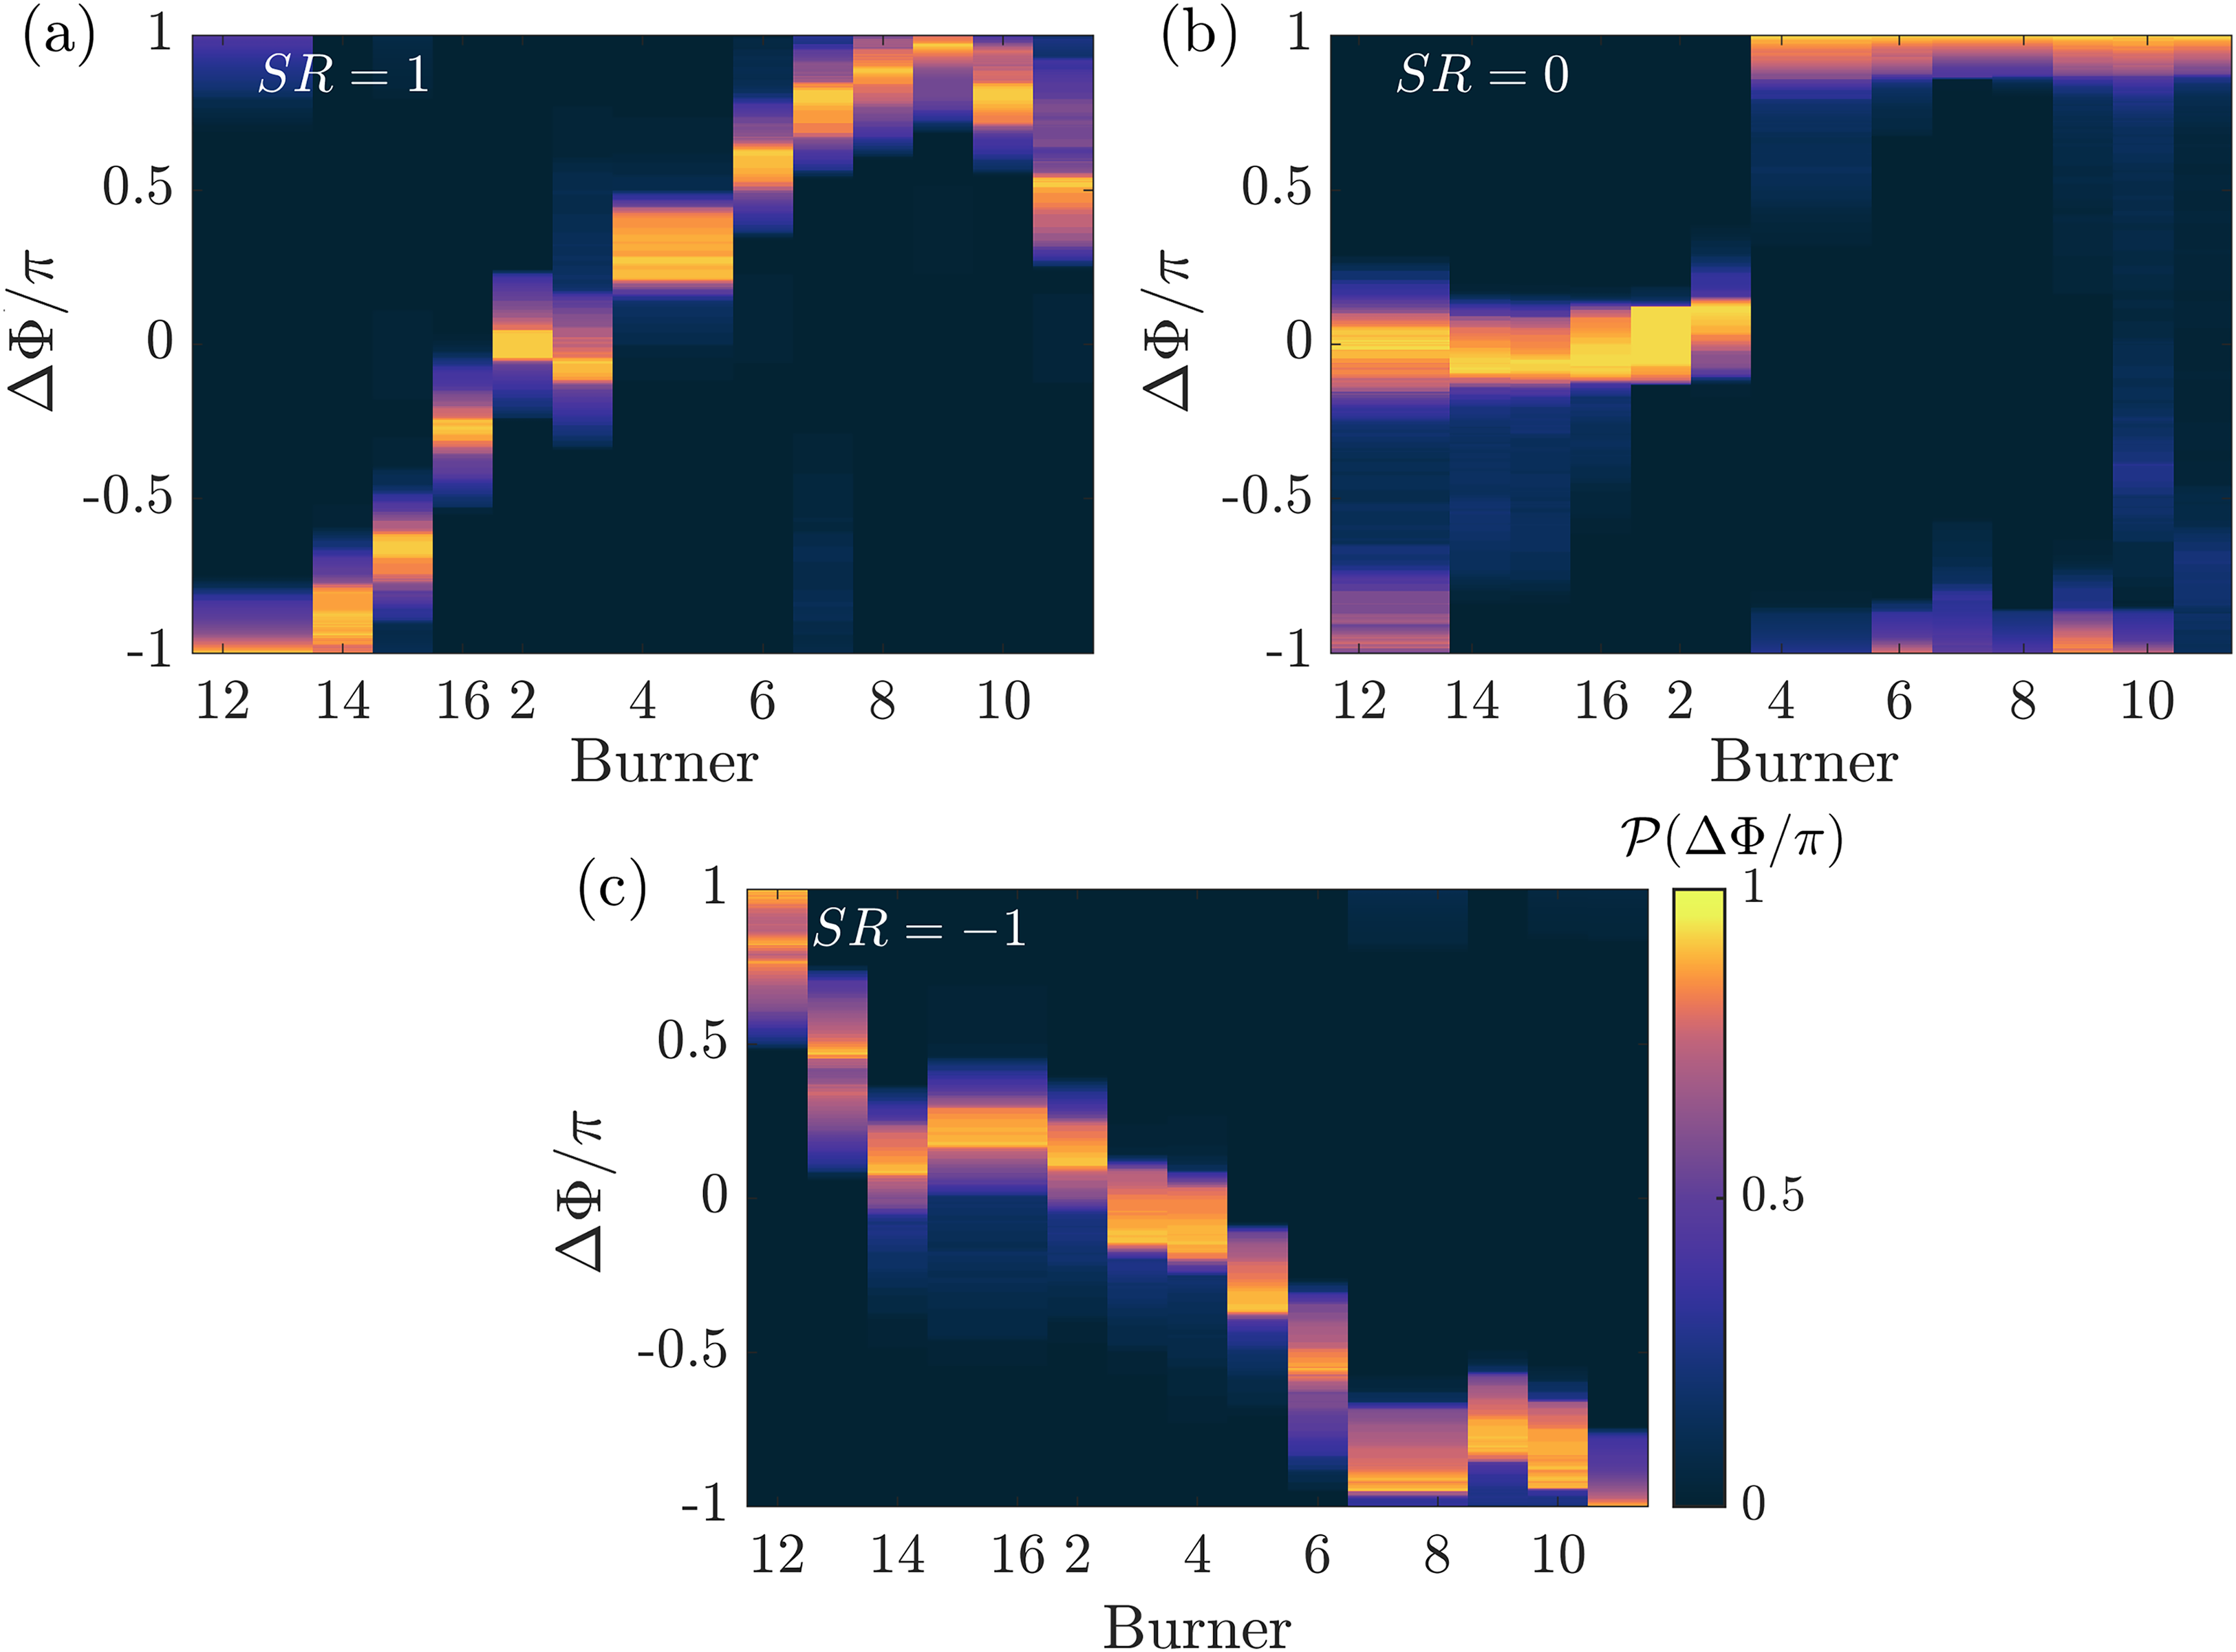
Finally, in Figure 14(a) to (c), we show the distribution of normalized across the burners during the beating azimuthal instability, marked as “(g)” in Figure 3(a). In particular, Figure 14(a) corresponds to the epochs of the CCW spinning wave, (b) corresponds to the epochs of the standing wave, and (c) corresponds to the epochs of the CW spinning wave. To maintain continuity in the observed pattern, we have rearranged the burner sequence, positioning burner 12 at the start and burner 11 at the end. In Figure 14(a), we notice the phase of heat release rate fluctuations from the flame at position 12 is entirely out-of-phase with respect to the fluctuations of the flame at position 1. The phase difference between flames at positions 13–16, relative to the flame at position 1, decreases and eventually reaches . As the burner number increases from 2 onwards, we observe the phase difference () starts to increase, reaching a maximum near burner 11. The observed pattern in the distribution of indicates that the wave is propagating from burner number 12 to 11 through burner 1, implying a spinning wave in the CCW direction.
Distribution of the normalized phase difference of heat release rate fluctuations from all the flames is examined across burners during the epochs of (a) CCW spinning wave, (b) standing wave, and (c) CW spinning wave in the beating azimuthal instability. Values of close to 0 signify that the heat release rate fluctuations from the adjacent burners are in-phase, whereas values near −1 and 1 denote that the heat release rate fluctuations from the adjacent burners are out-of-phase. The patterns of the distribution of the relative phase during the beating azimuthal instability change from the CCW spinning direction to CW spinning direction through the standing wave pattern. CCW: counterclockwise; CW: clockwise.
In Figure 14(b), the flames positioned from 12 to 3 exhibit the distribution in around , while flames located at positions 4 to 11 predominantly show the distribution in near −1 and . This flame behavior exhibits the standing wave pattern in the combustor. In Figure 14(c), we notice that the relative phase between the heat release rate fluctuations obtained from the flame at position 12 with the flame at position 1, is out-of-phase and has a value of . As we approach the flame positioned closer to flame 2, there is a gradual reduction in the value. The value of is near when we reach the flame at position 2. Moreover, as we move from flame 2 towards flame 11, we observe that the value of reaches approximately −1. This smooth change in the distribution of from burner 12 to 11 through burner 1 indicates the presence of a CW spinning wave within the combustor.
Conclusion
In summary, we investigated the dynamics of the annular combustor to understand the transition from stable operation to azimuthal thermoacoustic instability. As we varied the equivalence ratio, we discovered a new route to azimuthal thermoacoustic instability through intermittency in the annular combustor. Employing a quaternion-based formalism to characterize the thermoacoustic modes within the combustor provided a concrete understanding of the system in terms of slow flow variables. Our finding highlighted that the transition to azimuthal instability occurs through a frequency shift—from a low frequency corresponding to the longitudinal mode to a high frequency corresponding to the azimuthal mode.
Subsequently, we contrast the global flame behavior during the different dynamical states. During dual-mode instability, we illustrated how the coexistence of longitudinal and azimuthal modes influences the flame response. When it comes to pure standing azimuthal instability, we observe flames exhibiting a standing wave pattern. We show the maximum heat release rate fluctuations occur at pressure anti-nodes and the minimum fluctuations take place at pressure nodes. Moreover, during the beating azimuthal instability, we note distinct flame behaviors during epochs of CCW spinning, standing, and CW spinning modes.
Finally, we quantified the interaction of neighboring flames under the influence of acoustics during various dynamical states by closely examining the distribution of relative phases among all burners with respect to one burner. During the azimuthal mode of the dual-mode instability, we observed that the phase differences among the eight consecutive flames, relative to the flame at position 1, remained in phase. Conversely, the remaining eight flames exhibited out-of-phase behavior in relation to the flame at position 1. These observations pointed to the presence of a standing wave pattern within the combustor during this mode. A similar standing wave pattern was noted during the state of pure standing azimuthal instability. Intriguingly, during the beating azimuthal instability, we observed shifts in the pattern of the distribution of phase difference across burners during the epochs of CCW spinning, standing, and CW spinning modes. This quantification highlighted distinct patterns of relative phase during different azimuthal modes, emphasizing the significant role of the interaction of neighboring flames in the observed behavior of the annular combustor.
Footnotes
Acknowledgements
The authors would like to express their gratitude to Mr. Anand S., and Mr. Thilagaraj S. of the Aerospace Department, IIT Madras for their assistance in assembling setup and in conducting the experiments. The authors extend their gratitude to Dr. Amitesh Roy, Mr. Ankit Sahay, and Mr. Jayesh Dhalphade for their valuable contributions through insightful discussions regarding the design of the annular combustor. S. Singh acknowledges the International Immersion Experience travel award by IIT Madras and Mitacs Globalink Research Award for providing support to work at the University of Toronto as a Visiting student. S. Chaudhuri acknowledges support from the IoE program as a Visiting Faculty Fellow (2022–2023) in the Department of Aerospace Engineering, IIT Madras.
Declaration of conflicting interests
The authors declare no potential conflicts of interest with respect to the research, authorship, and/or publication of this article.
Funding
The authors disclosed receipt of the following financial support for the research, authorship, and/or publication of this article: R.I. Sujith received funding from the Institute of Eminence (IoE) initiative of IIT Madras (SP/22-23/1222/CPETWOCTSHOC) and the Office of Naval Research Global (Grant No. N62909-18-1-2061; Funder ID: 10.13039/100007297). S. Chaudhuri received funding from the Natural Sciences and Engineering Research Council of Canada Discovery Grant (RGPIN-2021-02676).
ORCID iD
Samarjeet Singh
References
1.
LieuwenTCYangV. Combustion instabilities in gas turbine engines: Operational experience, fundamental mechanisms, and modeling. Reston, VA: AIAA, 2005.
2.
VignatGDuroxDSchullerT, et al. Combustion dynamics of annular systems. Combust Sci Technol2020; 192: 1358–1388.
3.
KrebsWFlohrPPradeB, et al. Thermoacoustic stability chart for high-intensity gas turbine combustion systems. Combust Sci Technol2002; 174: 99–128.
4.
MazurMKwahYHIndlekoferT, et al. Self-excited longitudinal and azimuthal modes in a pressurised annular combustor. Proc Combust Inst2021; 38: 5997–6004.
5.
SujithRIPawarSA. Thermoacoustic instability: A complex systems perspective. London: Springer Nature, 2021.
CandelSM. Combustion dynamics and control: Progress and challenges. Proc Combust Inst2002; 29: 1–28.
8.
JuniperMPSujithRI. Sensitivity and nonlinearity of thermoacoustic oscillations. Annu Rev Fluid Mech2018; 50: 661–689.
9.
McManusKRPoinsotTCandelS. A review of active control of combustion instabilities. Prog Energy Combust Sci1993; 19: 1–29.
10.
CulickFEKuentzmannP. Unsteady motions in combustion chambers for propulsion systems. Technical report, NATO Research and Technology Organization (France), 2006.
11.
CandelSDuroxDSchullerT, et al. Dynamics of swirling flames. Annu Rev Fluid Mech2014; 46: 147–173.
12.
O’ConnorJAcharyaVLieuwenT. Transverse combustion instabilities: Acoustic, fluid mechanic, and flame processes. Prog Energy Combust Sci2015; 49: 1–39.
13.
WorthNADawsonJR. Cinematographic OH-PLIF measurements of two interacting turbulent premixed flames with and without acoustic forcing. Combust Flame2012; 159: 1109–1126.
14.
WorthNADawsonJR. Self-excited circumferential instabilities in a model annular gas turbine combustor: Global flame dynamics. Proc Combust Inst2013; 34: 3127–3134.
15.
BourgouinJFDuroxDMoeckJP, et al. Self-sustained instabilities in an annular combustor coupled by azimuthal and longitudinal acoustic modes. In: Proceedings of the ASME Turbo Expo 2013: Turbine Technical Conference and Exposition. Volume 1B: Combustion, Fuels and Emissions. San Antonio, Texas, USA, June 3–7, 2013. V01BT04A007, ASME, 2013
16.
GhirardoGJuniperMP. Azimuthal instabilities in annular combustors: standing and spinning modes. Proc R Soc2013; 469: 20130232.
17.
NoirayNBothienMSchuermansB. Investigation of azimuthal staging concepts in annular gas turbines. Combust Theory Model2011; 15: 585–606.
18.
WorthNADawsonJR. Modal dynamics of self-excited azimuthal instabilities in an annular combustion chamber. Combust Flame2013; 160: 2476–2489.
19.
BourgouinJFDuroxDMoeckJ, et al. A new pattern of instability observed in an annular combustor: The slanted mode. Proc Combust Inst2015; 35: 3237–3244.
20.
PrieurKDuroxDSchullerT, et al. A hysteresis phenomenon leading to spinning or standing azimuthal instabilities in an annular combustor. Combust Flame2017; 175: 283–291.
21.
MoeckJPDuroxDSchullerT, et al. Nonlinear thermoacoustic mode synchronization in annular combustors. Proc Combust Inst2019; 37: 5343–5350.
22.
FangYYangYHuK, et al. Experimental study on self-excited thermoacoustic instabilities and intermittent switching of azimuthal and longitudinal modes in an annular combustor. Phys Fluids2021; 33: 084104.
23.
IndlekoferTFaure-BeaulieuANoirayN, et al. The effect of dynamic operating conditions on the thermoacoustic response of hydrogen rich flames in an annular combustor. Combust Flame2021; 223: 284–294.
24.
BauerheimMCazalensMPoinsotT. A theoretical study of mean azimuthal flow and asymmetry effects on thermo-acoustic modes in annular combustors. Proc Combust Inst2015; 35: 3219–3227.
25.
Faure-BeaulieuAIndlekoferTDawsonJR, et al. Experiments and low-order modelling of intermittent transitions between clockwise and anticlockwise spinning thermoacoustic modes in annular combustors. Proc Combust Inst2021; 38: 5943–5951.
26.
VignatGDuroxDRenaudA, et al. High amplitude combustion instabilities in an annular combustor inducing pressure field deformation and flame blow off. J Eng Gas Turbines Power2020; 142: 011016(1-11).
27.
PrieurKDuroxDSchullerT, et al. Strong azimuthal combustion instabilities in a spray annular chamber with intermittent partial blow-off. J Eng Gas Turbines Power2018; 140: 283–291.
28.
GhirardoGNygårdHTCuquelA, et al. Symmetry breaking modelling for azimuthal combustion dynamics. Proc Combust Inst2021; 38: 5953–5962.
29.
KimJGillmanWJohnT, et al. Experimental investigation of fuel staging effect on modal dynamics of thermoacoustic azimuthal instabilities in a multi-nozzle can combustor. In: Proceedings of the ASME Turbo Expo 2021: Turbomachinery Technical Conference and Exposition. Volume 3A: Combustion, Fuels, and Emissions. Virtual, Online. June 7–11, 2021, V03AT04A037, ASME, 2021.
30.
KimJwGillmanWEmersonB, et al. Modal dynamics of high-frequency transverse combustion instabilities. Proc Combust Inst2021; 38: 6155–6163.
31.
IndlekoferTFaure-BeaulieuADawsonJR, et al. Dynamics of azimuthal thermoacoustic modes in imperfectly symmetric annular geometries. Preprint, arXiv:2104.07380, 2021.
32.
Faure-BeaulieuAIndlekoferTDawsonJR, et al. Imperfect symmetry of real annular combustors: beating thermoacoustic modes and heteroclinic orbits. J Fluid Mech2021; 925: R1.
33.
AhnBIndlekoferTDawsonJR, et al. Heat release rate response of azimuthal thermoacoustic instabilities in a pressurized annular combustor with methane/hydrogen flames. Combust Flame2022; 244: 112274.
34.
RoyASinghSNairA, et al. Flame dynamics during intermittency and secondary bifurcation to longitudinal thermoacoustic instability in a swirl-stabilized annular combustor. Proc Combust Inst2021; 38: 6221–6230.
35.
SinghSRoyAReejaKV, et al. Intermittency, secondary bifurcation and mixed-mode oscillations in a swirl-stabilized annular combustor: Experiments and modeling. J Eng Gas Turbines Power2021; 143: 051028.
NairVThampiGSujithRI. Intermittency route to thermoacoustic instability in turbulent combustors. J Fluid Mech2014; 756: 470–487.
38.
LieuwenTC. Unsteady combustor physics. Cambridge University Press, 2021.
39.
MoeckJPPaschereitCO. Nonlinear interactions of multiple linearly unstable thermoacoustic modes. Int J Spray Combust Dyn2012; 4: 1–27.
40.
NoirayNDuroxDSchullerT, et al. A unified framework for nonlinear combustion instability analysis based on the flame describing function. J Fluid Mech2008; 615: 139–167.
41.
WorthNADawsonJR. Effect of equivalence ratio on the modal dynamics of azimuthal combustion instabilities. Proc Combust Inst2017; 36: 3743–3751.
DawsonJRWorthNA. Flame dynamics and unsteady heat release rate of self-excited azimuthal modes in an annular combustor. Combust Flame2014; 161: 2565–2578.