
Abstract
Background:
Although gemcitabine plus nab-paclitaxel (Gem-NabP), modified FOLFIRINOX (mFOLFIRINOX), and NALIRIFOX are all recommended by current clinical guidelines as first-line treatment options for metastatic pancreatic ductal adenocarcinoma (mPDAC), the optimal regimen in real-world practice remains uncertain.
Objective:
To compare the efficacy and safety of different first-line chemotherapy regimens for mPDAC.
Design:
This was a single-center retrospective study. We included 215 patients with previously untreated mPDAC who received first-line chemotherapy at our institution between September 2023 and February 2025: Gem-NabP (n = 121), mFOLFIRINOX (n = 55), and NALIRIFOX (n = 39).
Methods:
The primary endpoints were progression-free survival (PFS), objective response rate (ORR), and disease control rate (DCR), while overall survival (OS) was a secondary endpoint. Tumor response was evaluated according to Response Evaluation Criteria in Solid Tumors version 1.1. Survival outcomes were analyzed using the Kaplan–Meier method and Cox proportional hazards models. Exploratory subgroup analyses were also performed.
Results:
NALIRIFOX showed the most favorable efficacy profile, with a median PFS of 9.0 months, a 6-month OS rate of 92.0%, an ORR of 30.77%, and a DCR of 89.74%, compared with 3.5 months, 74.6%, 18.18%, and 64.46% in the Gem-NabP group and 5.0 months, 82.6%, 16.36%, and 76.36% in the mFOLFIRINOX group, respectively (PFS, p < 0.001; ORR, p = 0.171; DCR, p = 0.007). Median OS was not reached in any group, and the between-group difference in OS was not statistically significant (p = 0.062). In multivariable Cox analyses, both mFOLFIRINOX and NALIRIFOX remained associated with lower risks of disease progression and death than Gem-NabP, whereas alcohol consumption was independently associated with poorer survival. Toxicities were manageable across regimens, with most adverse events being Grade 1-2 and no treatment-related deaths. Grade ⩾3 adverse events were infrequent and generally comparable among groups. Exploratory analyses suggested a more favorable response distribution with NALIRIFOX in patients with mild-to-moderate cancer pain and those with tumors in the pancreatic head, neck, or tail.
Conclusion:
In this retrospective single-center cohort, NALIRIFOX was associated with longer PFS and favorable short-term survival, with manageable toxicity. These findings require validation in larger prospective multicenter studies.
Plain language summary
Background:
Metastatic pancreatic ductal adenocarcinoma is a highly aggressive cancer with limited treatment options. Several chemotherapy regimens are used as first-line treatment in clinical practice, including gemcitabine plus nab-paclitaxel, modified FOLFIRINOX, and NALIRIFOX. However, it remains unclear how these treatments compare in real-world settings.
Methods:
We retrospectively reviewed 215 patients with metastatic pancreatic ductal adenocarcinoma who received one of these three first-line chemotherapy regimens at our center. We compared how long patients lived without their disease getting worse, overall survival, tumor response, and treatment-related side effects.
Results:
Among the three regimens, NALIRIFOX showed the most favorable overall results. Patients treated with NALIRIFOX had longer progression-free survival and better short-term survival. This group also had better tumor response and disease control than the other two treatment groups. Side effects were generally manageable across all regimens, and serious side effects were uncommon. We also found that alcohol use and cancer-related pain were associated with worse outcomes.
Conclusion:
Our findings suggest that NALIRIFOX may be a promising first-line treatment option for metastatic pancreatic ductal adenocarcinoma in routine clinical practice. However, because this was a retrospective study from a single center, larger studies are needed to confirm these results.
Keywords
Introduction
Pancreatic ductal adenocarcinoma (PDAC) is one of the most lethal solid malignancies, with the majority of patients diagnosed at a locally advanced or metastatic stage, and the overall prognosis remains poor, with a 5-year survival rate of less than 5%.1,2 Systemic chemotherapy remains the standard first-line treatment for patients with metastatic pancreatic ductal adenocarcinoma (mPDAC), aiming to prolong survival and improve quality of life. 3 Currently, the most commonly used first-line regimens include gemcitabine plus nab-paclitaxel (Gem-NabP), modified FOLFIRINOX (mFOLFIRINOX), and the recently introduced NALIRIFOX regimen, which consists of liposomal irinotecan, oxaliplatin, leucovorin, and fluorouracil.
The Metastatic Pancreatic Adenocarcinoma Clinical Trial (MPACT) demonstrated that Gem-NabP significantly improved overall survival (OS) and progression-free survival (PFS) compared with gemcitabine monotherapy, leading to its widespread adoption as a first-line treatment for mPDAC. 4 The Gem-NabP regimen is generally well tolerated, with myelosuppression and peripheral neuropathy (PN) being the most common adverse events, and is often considered a preferred option for elderly patients or those with poor performance status.5,6 The FOLFIRINOX regimen demonstrated superior efficacy over gemcitabine monotherapy in the PRODIGE 4/ACCORD 11 trial; however, its clinical use has been limited by severe hematologic and gastrointestinal toxicities. 7 A single-arm prospective study conducted in China (NCT02028806) indicated that the efficacy of mFOLFIRINOX was comparable to the original regimen, while the incidence of adverse events was substantially reduced. 8 In the phase III NAPOLI-3 trial, the NALIRIFOX regimen was compared with Gem-NabP. The results demonstrated that NALIRIFOX conferred significant survival advantages (median OS: 11.1 vs 9.2 months; p = 0.036) and progression-free survival (median PFS: 7.4 vs 5.6 months; p < 0.0001). 9
However, real-world evidence has yielded inconsistent findings. In the JCOG1611-GENERATE study, mFOLFIRINOX did not confer a survival benefit compared with Gem-NabP (p = 0.96) and was associated with a higher incidence of gastrointestinal adverse events. 10 Furthermore, a recent meta-analysis suggested that both NALIRIFOX and FOLFIRINOX may be preferred as first-line chemotherapy regimens for patients with locally advanced unresectable or mPDAC. 11 To date, no clinical trials or retrospective studies have directly compared the NALIRIFOX regimen with mFOLFIRINOX.
In summary, achieving an optimal balance between efficacy and tolerability when selecting a first-line chemotherapy regimen for patients with mPDAC directly impacts overall patient outcomes and the feasibility of subsequent treatments. This rationale underpins the background and clinical significance of the present study.
Methods
Patient characteristics and study design
This single-center, retrospective study enrolled chemotherapy-naïve patients with mPDAC who were treated at Shandong Cancer Hospital between September 2023 and February 2025. Inclusion criteria were as follows: (I) age > 18 years and an eastern cooperative oncology group (ECOG) performance status of 0 or 1; (II) histologically or pathologically confirmed pancreatic ductal adenocarcinoma without evidence of another primary malignancy; (III) receipt of chemotherapy alone during the treatment period, without concurrent or sequential combination with other therapeutic modalities; and (IV) availability of complete clinical and follow-up data. This study strictly selected patients during the inclusion phase, including only those with complete key clinical information and follow-up data. Patients with incomplete baseline variables or survival outcome data were excluded. While survival outcome data were complete for all patients, some patients may have lacked certain imaging data during treatment because of various factors. For these cases, we classified the missing data as Not Evaluated according to standard evaluation procedures. Detailed inclusion and exclusion criteria are summarized in Figure 1. The ethics committee approved this retrospective study. The reporting of this study conforms to the STROBE statement. 12
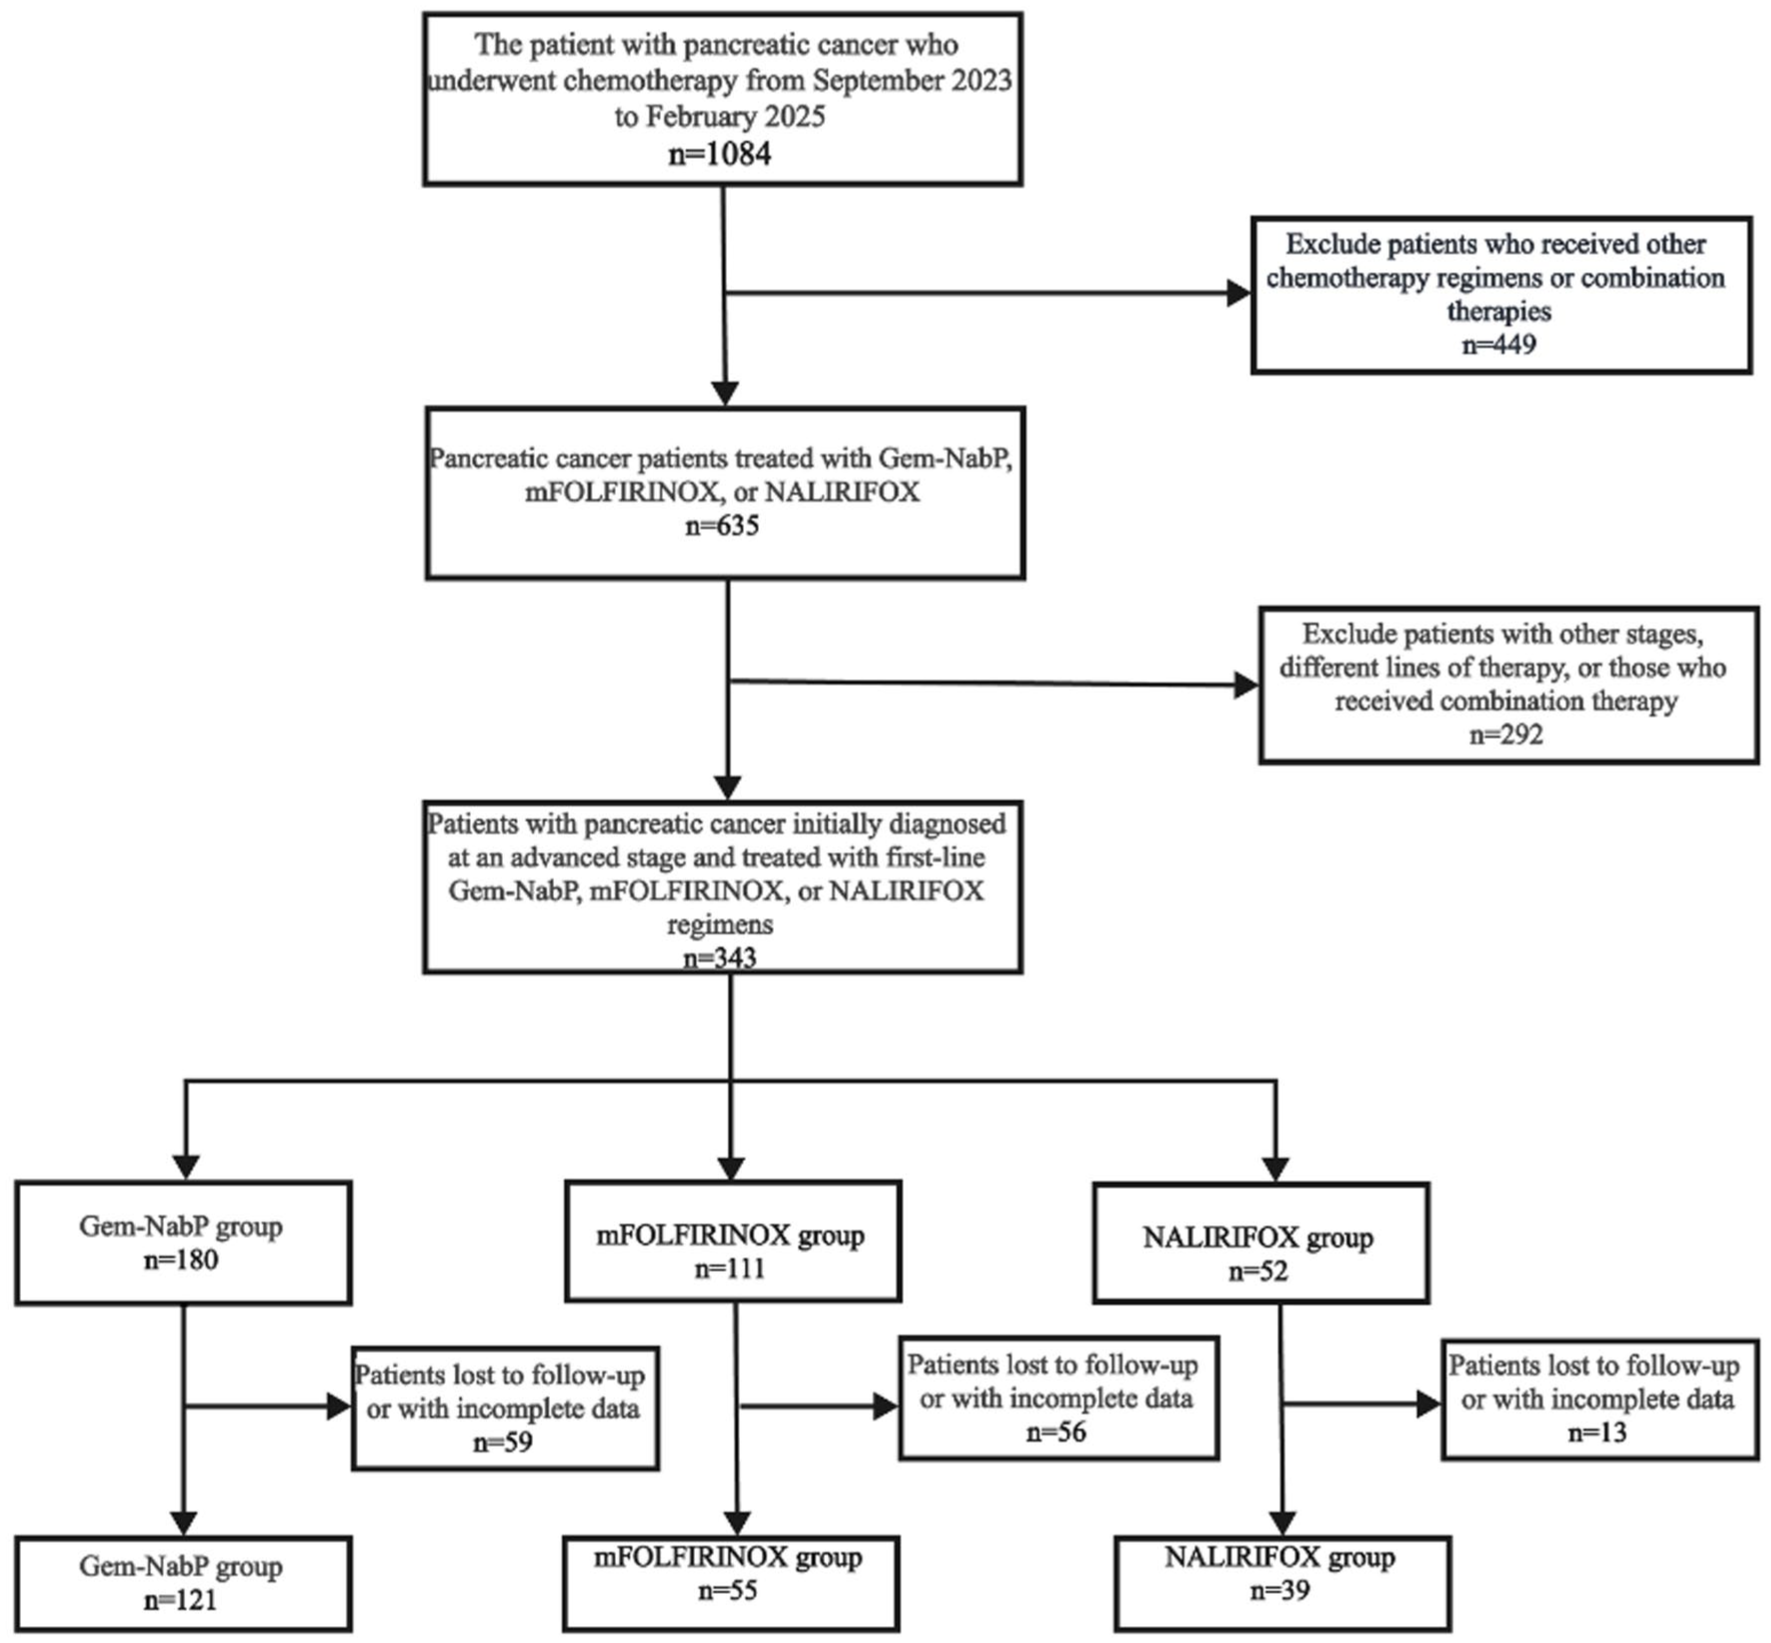
Flow chart for patient selection for this analysis.
Treatment regimens and safety assessment
The three first-line treatment plans were not randomly assigned; the initial treatment plan for each patient was determined through comprehensive decision-making by the multidisciplinary team (MDT) at our institution, based on the patient’s individual circumstances. The selection of the treatment plan considered multiple factors, including the patient’s performance status (e.g., ECOG), age, comorbidities, organ function, and allergy history. Furthermore, factors such as the patient’s personal preference and insurance status were also incorporated into the decision-making process, with the final treatment plan being jointly determined by the patient and the physician.
Gem-NabP included nab-paclitaxel (125 mg/m2) and gemcitabine (1000 mg/m2) on days 1 and 8 of a 3-week cycle. mFOLFIRINOX consisted of oxaliplatin (65–85 mg/m2), irinotecan (150–165 mg/m2), leucovorin (400 mg/m2), and 5-fluorouracil (2400 mg/m2 over 46 hours) every 2 weeks. NALIRIFOX comprised liposomal irinotecan (50 mg/m2), oxaliplatin (60 mg/m2), leucovorin (400 mg/m2), and 5-fluorouracil (2400 mg/m2 over 46 h) every 2 weeks. Chemotherapy doses or cycles were adjusted based on patient tolerance and adverse events.
Treatment-emergent adverse events (AEs) were graded according to the National Cancer Institute’s Common Terminology Criteria for Adverse Events (CTCAE), version 5.0, and their incidence and severity were analyzed. During treatment, all patients routinely received prophylactic antiemetic and gastroprotective medications.
Efficacy evaluation and survival analysis
Tumor response was assessed in all enrolled patients according to the Response Evaluation Criteria in Solid Tumors, version 1.1 (RECIST 1.1). Imaging evaluation of the primary lesions was performed using computed tomography (CT) or magnetic resonance imaging (MRI) at least once every 6–8 weeks. Survival outcomes were analyzed using the Kaplan–Meier method.
The primary endpoints were PFS, objective response rate (ORR), and disease control rate (DCR). PFS was defined as the time from initiation of first-line chemotherapy to disease progression, while ORR and DCR were based on tumor response evaluations. The secondary endpoints included OS and the 6-month OS rate. OS was defined as the time from treatment initiation to death from pancreatic cancer. Given the rapid progression and limited survival in mPDAC, the 6-month OS rate was chosen as an early measure of treatment benefit, as it is clinically relevant and more feasible to assess in a real-world setting with limited follow-up duration. This time point provides useful insight into early survival outcomes, particularly in a cohort with a poor prognosis.
Statistical analysis
Comprehensive clinical data were collected, and categorical variables were expressed as percentages, with a two-sided p < 0.05 considered statistically significant. Variables identified as p < 0.1 in univariate Cox regression were entered into multivariate analysis, and those with p < 0.05 in the final model were recognized as independent prognostic factors for PFS and OS. To reduce the impact of confounding factors on effect estimates as much as possible, we treated age, smoking, alcohol consumption, ECOG performance status, cancer pain, and metastatic sites as potential confounders and adjusted for them in a multivariate Cox model. Kaplan–Meier survival curves were used to compare OS and PFS among treatment groups. Subgroup analyses were performed using univariate Cox regression.
The best response during treatment was assessed according to the RECIST 1.1. The distribution of response categories across groups is presented using line charts and bar charts. Patients lacking baseline or treatment-related imaging data, or with uncertain single lesion measurements, were classified as not evaluable (NE). Furthermore, among patients who developed progressive disease by the end of follow-up, progression patterns were categorized as isolated primary-lesion progression (iPLP), defined as progression limited to the primary pancreatic lesion without concurrent progression at preexisting metastatic sites or the appearance of new lesions, and other progression patterns (OPP), which included metastatic-lesion progression, new-lesion progression, and mixed progression.
AEs were graded and categorized according to the CTCAE version 5.0. The incidence of each chemotherapy-related toxicity was presented as a dimension on a radar chart, with each axis representing the frequency of a specific event. Major treatment-related toxicities included hematologic toxicity, abnormal liver function, neurotoxicity, and electrolyte imbalance.
To explore the relationships among treatment regimen, primary tumor site, and cancer pain severity with treatment efficacy, a Sankey diagram was employed to visualize the flow and proportional associations among these variables. Cancer pain was assessed at first admission using the numeric rating scale (NRS), with the following grading criteria: None (NRS 0), Mild (NRS 1–3), Moderate (NRS 4–6), and Severe (NRS ⩾7). Primary tumor location was determined based on patients’ baseline imaging examinations (e.g., CT, MRI, and PET-CT) along with the corresponding radiology reports. Tumors were categorized into four anatomical locations: head, neck, body, and tail of the pancreas, based on the anatomical site documented in the reports. Finally, a Cox proportional hazards regression model was applied to verify whether these factors were independent prognostic indicators for PFS and OS.
Results
Patient characteristics
A retrospective analysis was conducted on 215 patients newly diagnosed with mPDAC who received first-line chemotherapy between September 2023 and February 2025. The patients were divided into three groups: Gem-NabP (n = 121), mFOLFIRINOX (n = 55), and NALIRIFOX (n = 39). Baseline characteristics were well-balanced among the three treatment groups (all p > 0.05), as detailed in Table 1.
Baseline characteristics of all patients in the three groups.
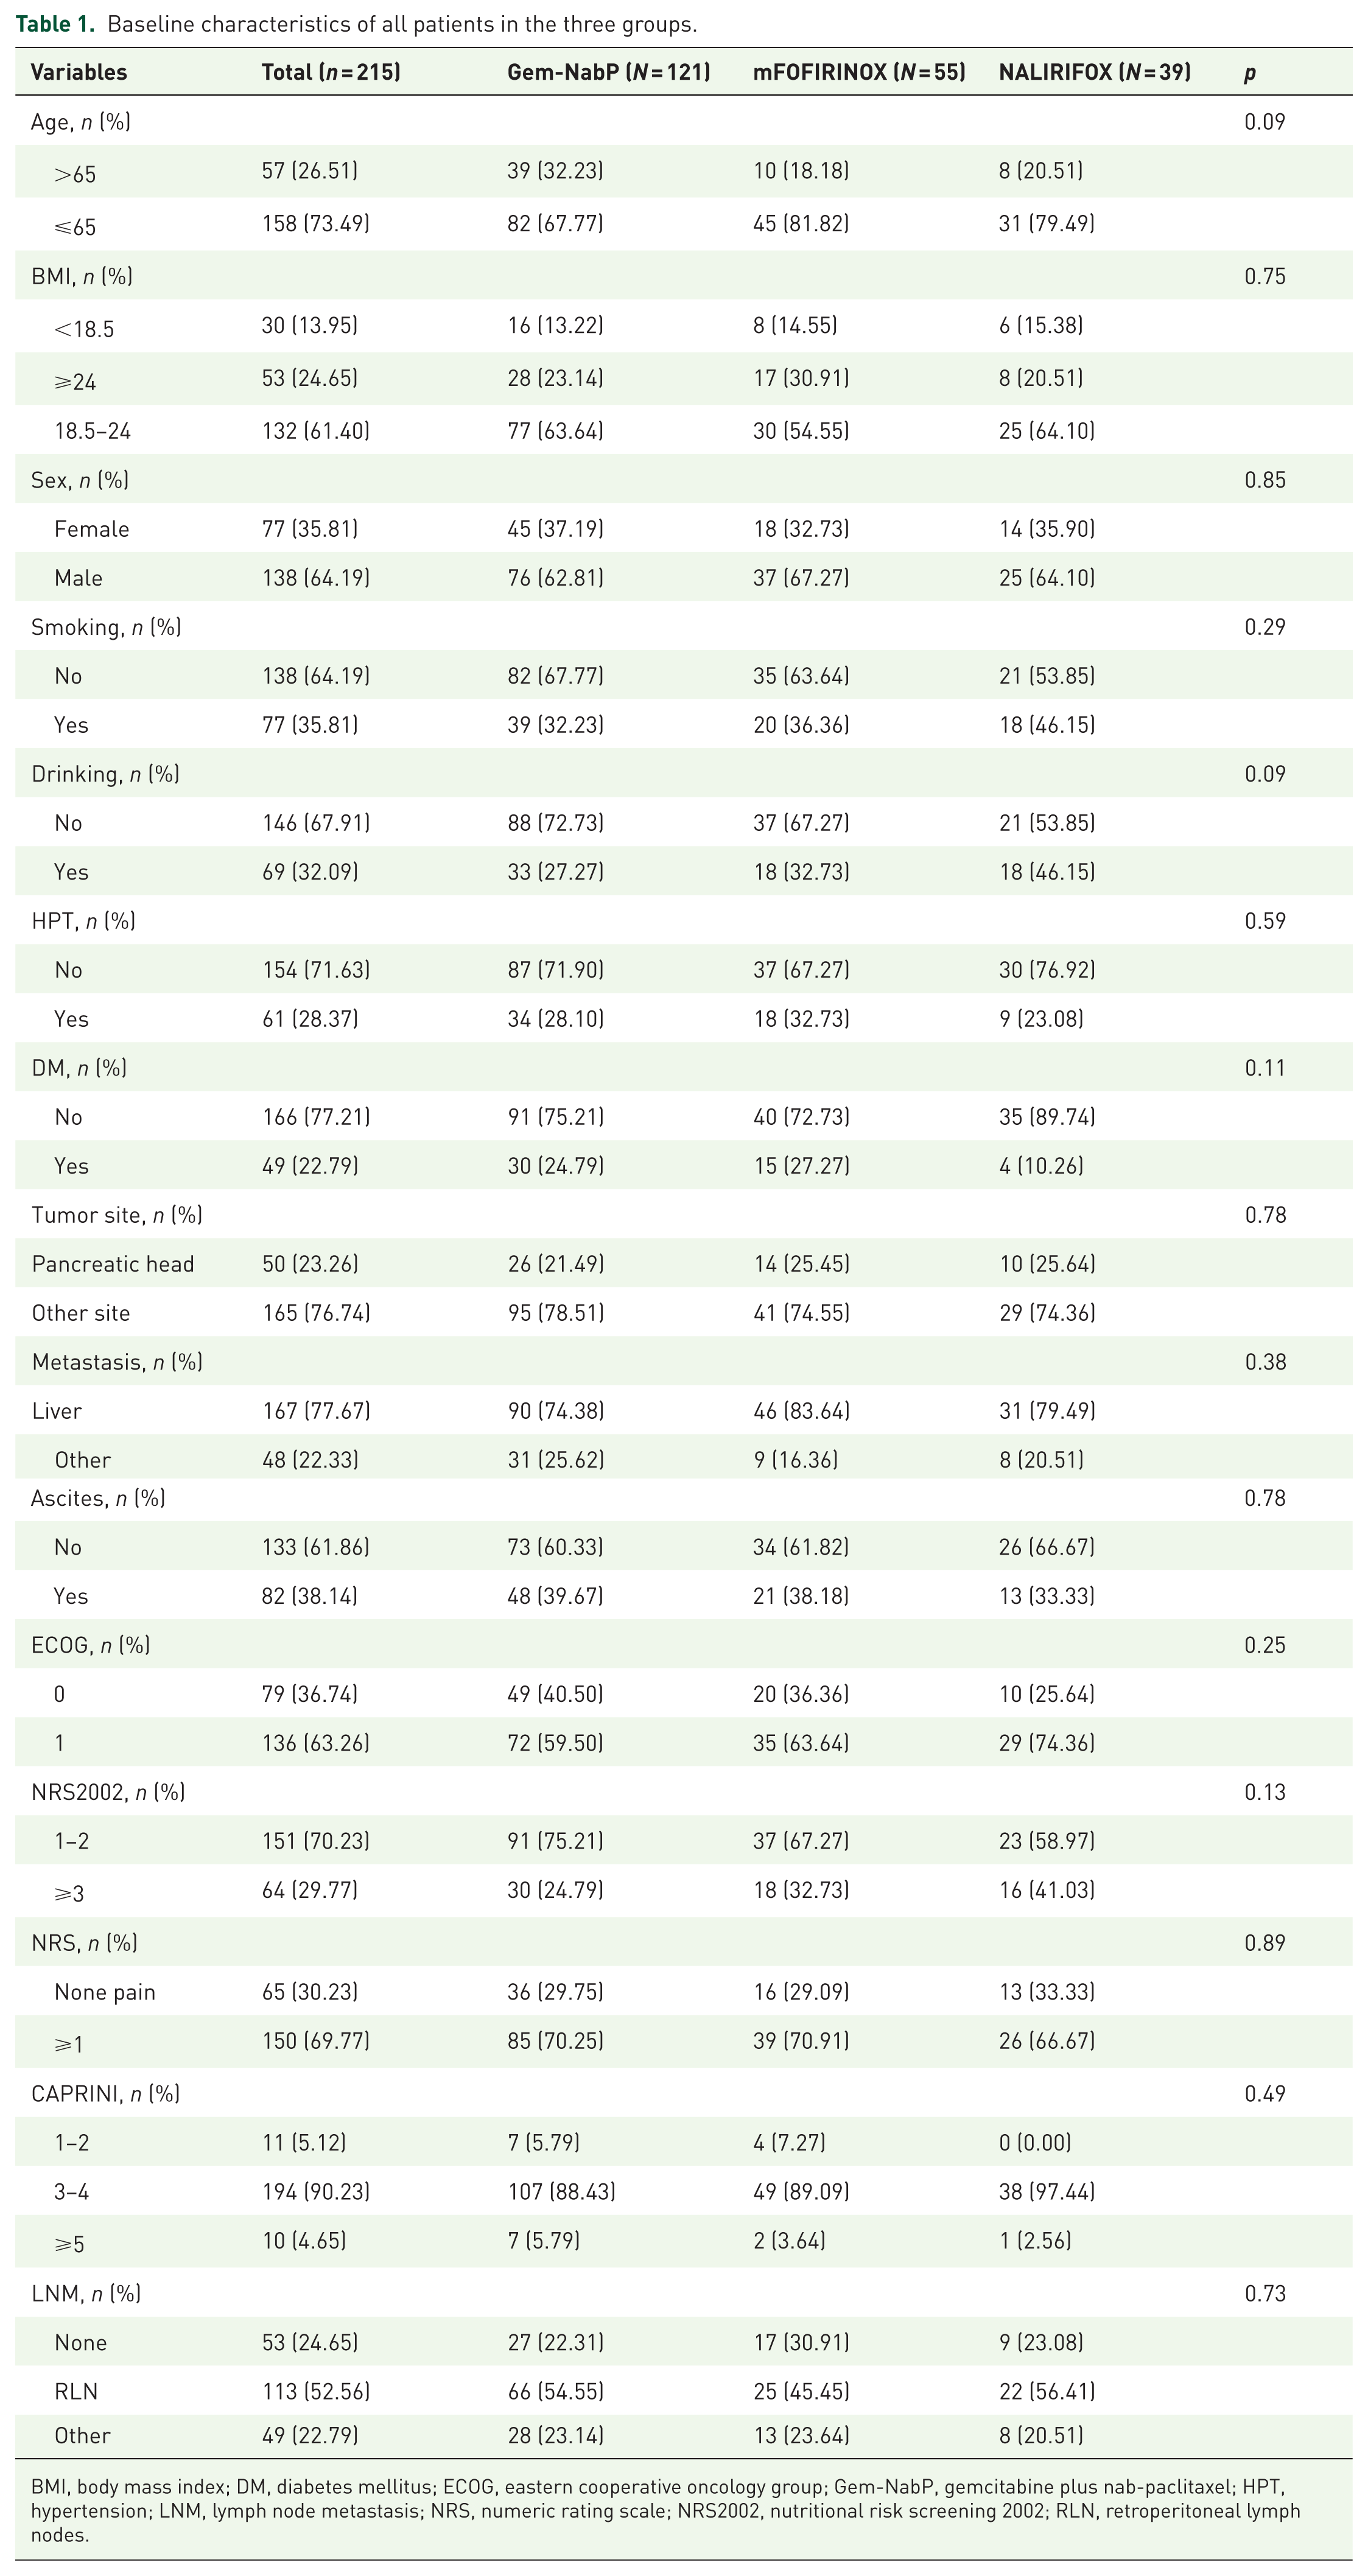
BMI, body mass index; DM, diabetes mellitus; ECOG, eastern cooperative oncology group; Gem-NabP, gemcitabine plus nab-paclitaxel; HPT, hypertension; LNM, lymph node metastasis; NRS, numeric rating scale; NRS2002, nutritional risk screening 2002; RLN, retroperitoneal lymph nodes.
Treatment efficacy
As of April 30, 2025, the median follow-up time for the overall cohort was 10 months. According to RECIST version 1.1, treatment efficacy was visualized using line charts and bar charts (Figure 2).
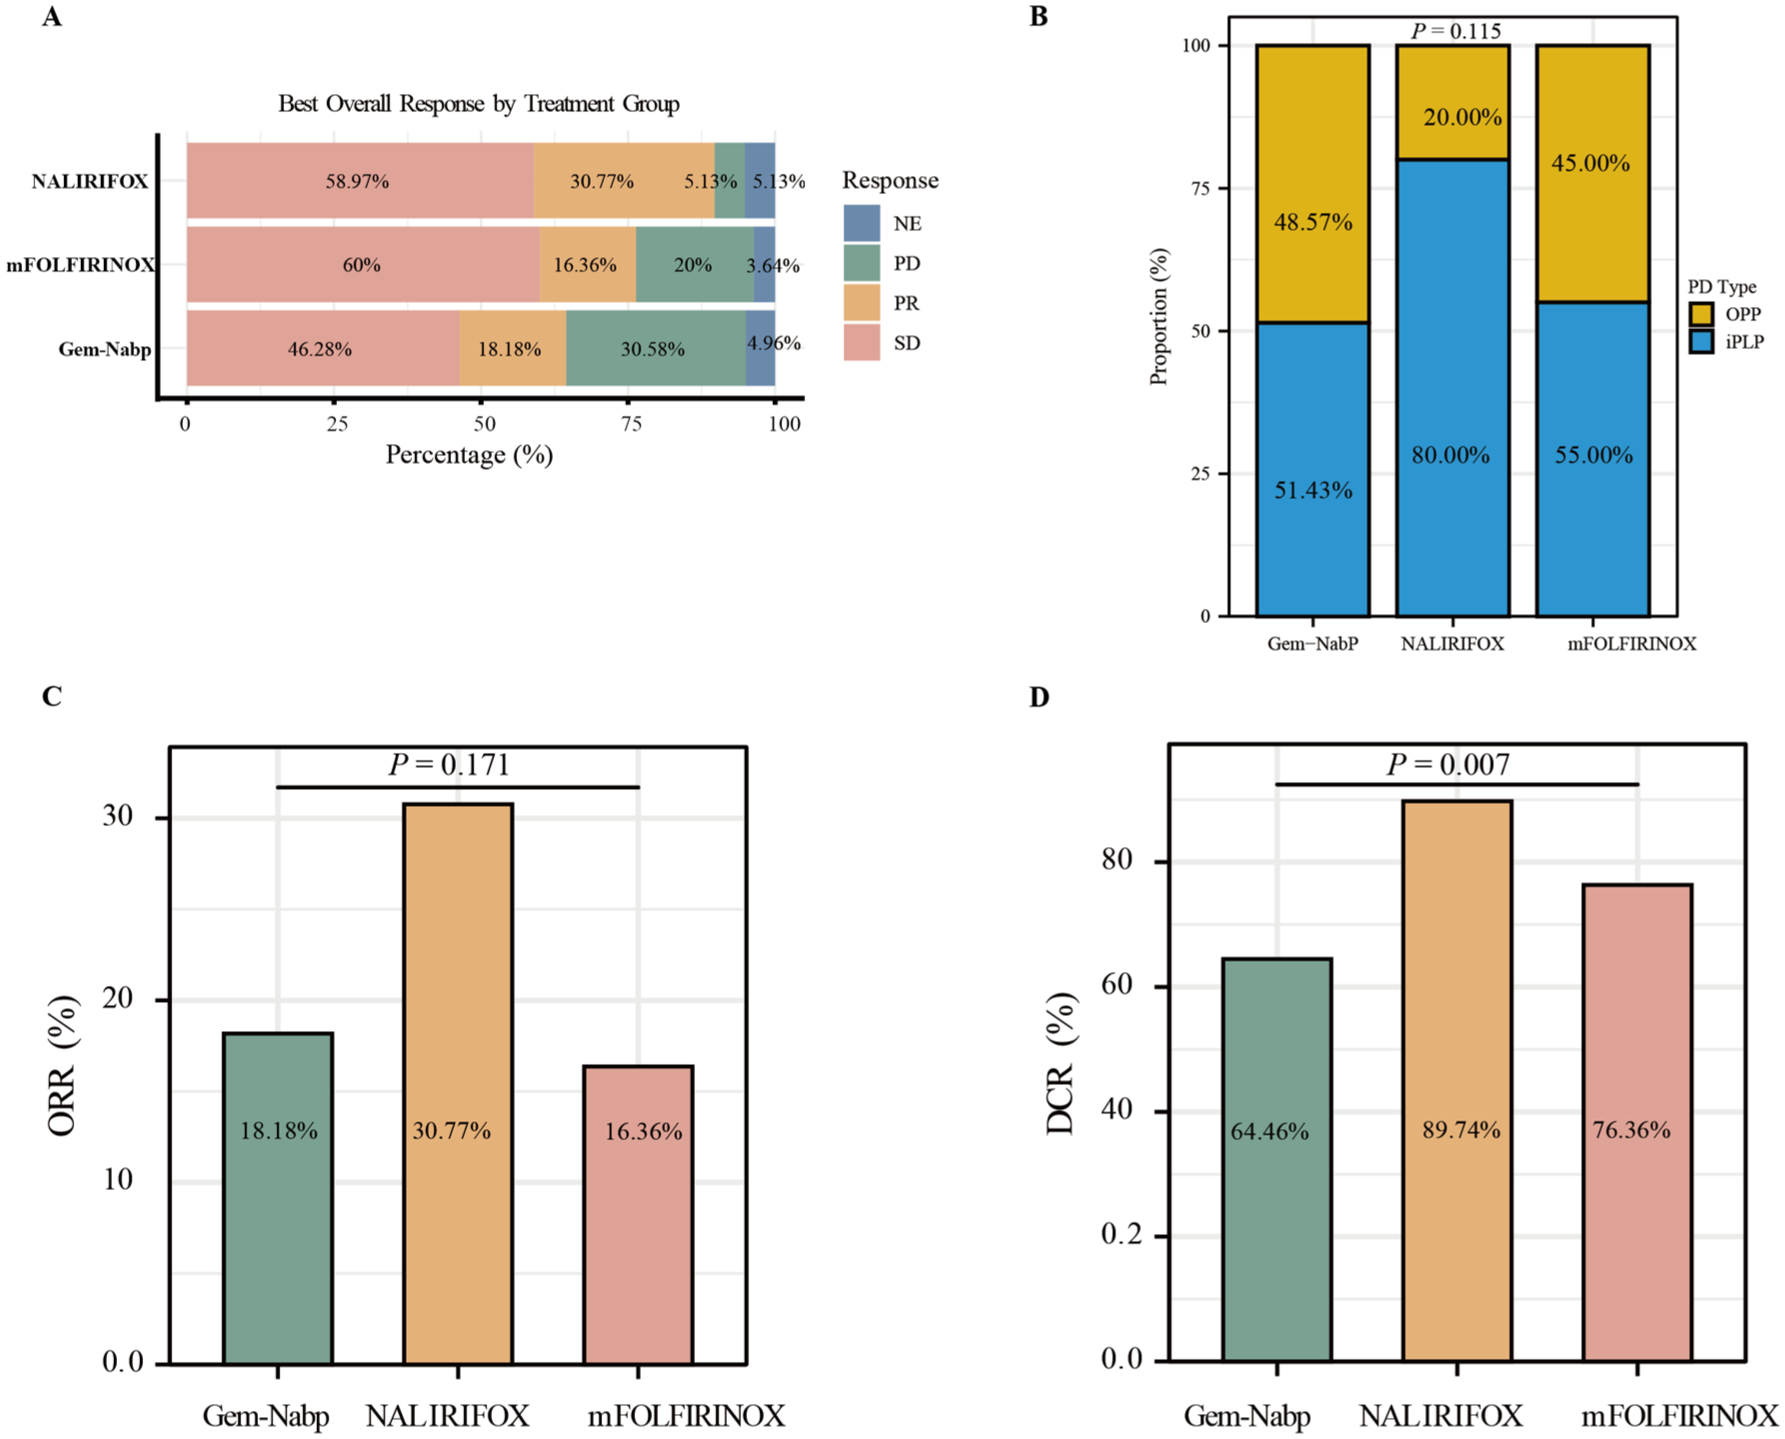
Tumor response and progression pattern across treatment groups. (a) BOR by treatment group, including SD, PR, PD, and NE, in patients treated with Gem-NabP, mFOLFIRINOX, and NALIRIFOX. (b) Distribution of progression patterns among treatment groups, including progression limited to iPLP and OPP. A significant difference was observed among groups (p = 0.115). (c) ORR according to treatment group. ORR was 18.18% in the Gem-NabP group, 30.77% in the NALIRIFOX group, and 16.36% in the mFOLFIRINOX group, with no statistically significant difference among groups (p = 0.171). (d) DCR according to treatment group. DCR was 64.46% in the Gem-NabP group, 89.74% in the NALIRIFOX group, and 76.36% in the mFOLFIRINOX group, showing a statistically significant difference among groups (p = 0.007).
We have presented the distribution of three sets of BOR data using bar charts (Figure 2(a)). At the follow-up cutoff, among the three groups of patients with PD, the iPLP rates for Gem-NabP, mFOLFIRINOX, and NALIRIFOX were 51.43%, 55.00%, and 80.00%, respectively, while the OPP rates were 48.57%, 45.00%, and 20.00%, respectively. No significant difference was observed in the progression-pattern distribution (p = 0.115; Figure 2(b)).
The ORR and DCR were 18.18% and 64.46% in the Gem-NabP group, 16.36% and 76.36% in the mFOLFIRINOX group, and 30.77% and 89.74% in the NALIRIFOX group. There was no significant difference in ORR among the three groups (p = 0.171), but the DCR in the NALIRIFOX group was significantly superior to that in the other treatment groups (p = 0.007; Figure 2(c) and (d)).
Survival outcomes
PFS and OS outcomes for the three treatment groups are presented in Figure 3. The NALIRIFOX regimen achieved a median PFS of 9.0 months, markedly longer than that observed in the Gem-NabP (3.5 months) and mFOLFIRINOX (5.0 months) groups (p < 0.001). Owing to the relatively short follow-up and the use of subsequent therapies after progression, the median OS was not reached in any group, and no significant difference in OS was detected (p = 0.062). The 6-month survival rates were 74.6%, 82.6%, and 92.0% for the Gem-NabP, mFOLFIRINOX, and NALIRIFOX groups, and the 1-year survival rates were 54.7%, 68.2%, and 54.0% (Supplemental Table 1), respectively.
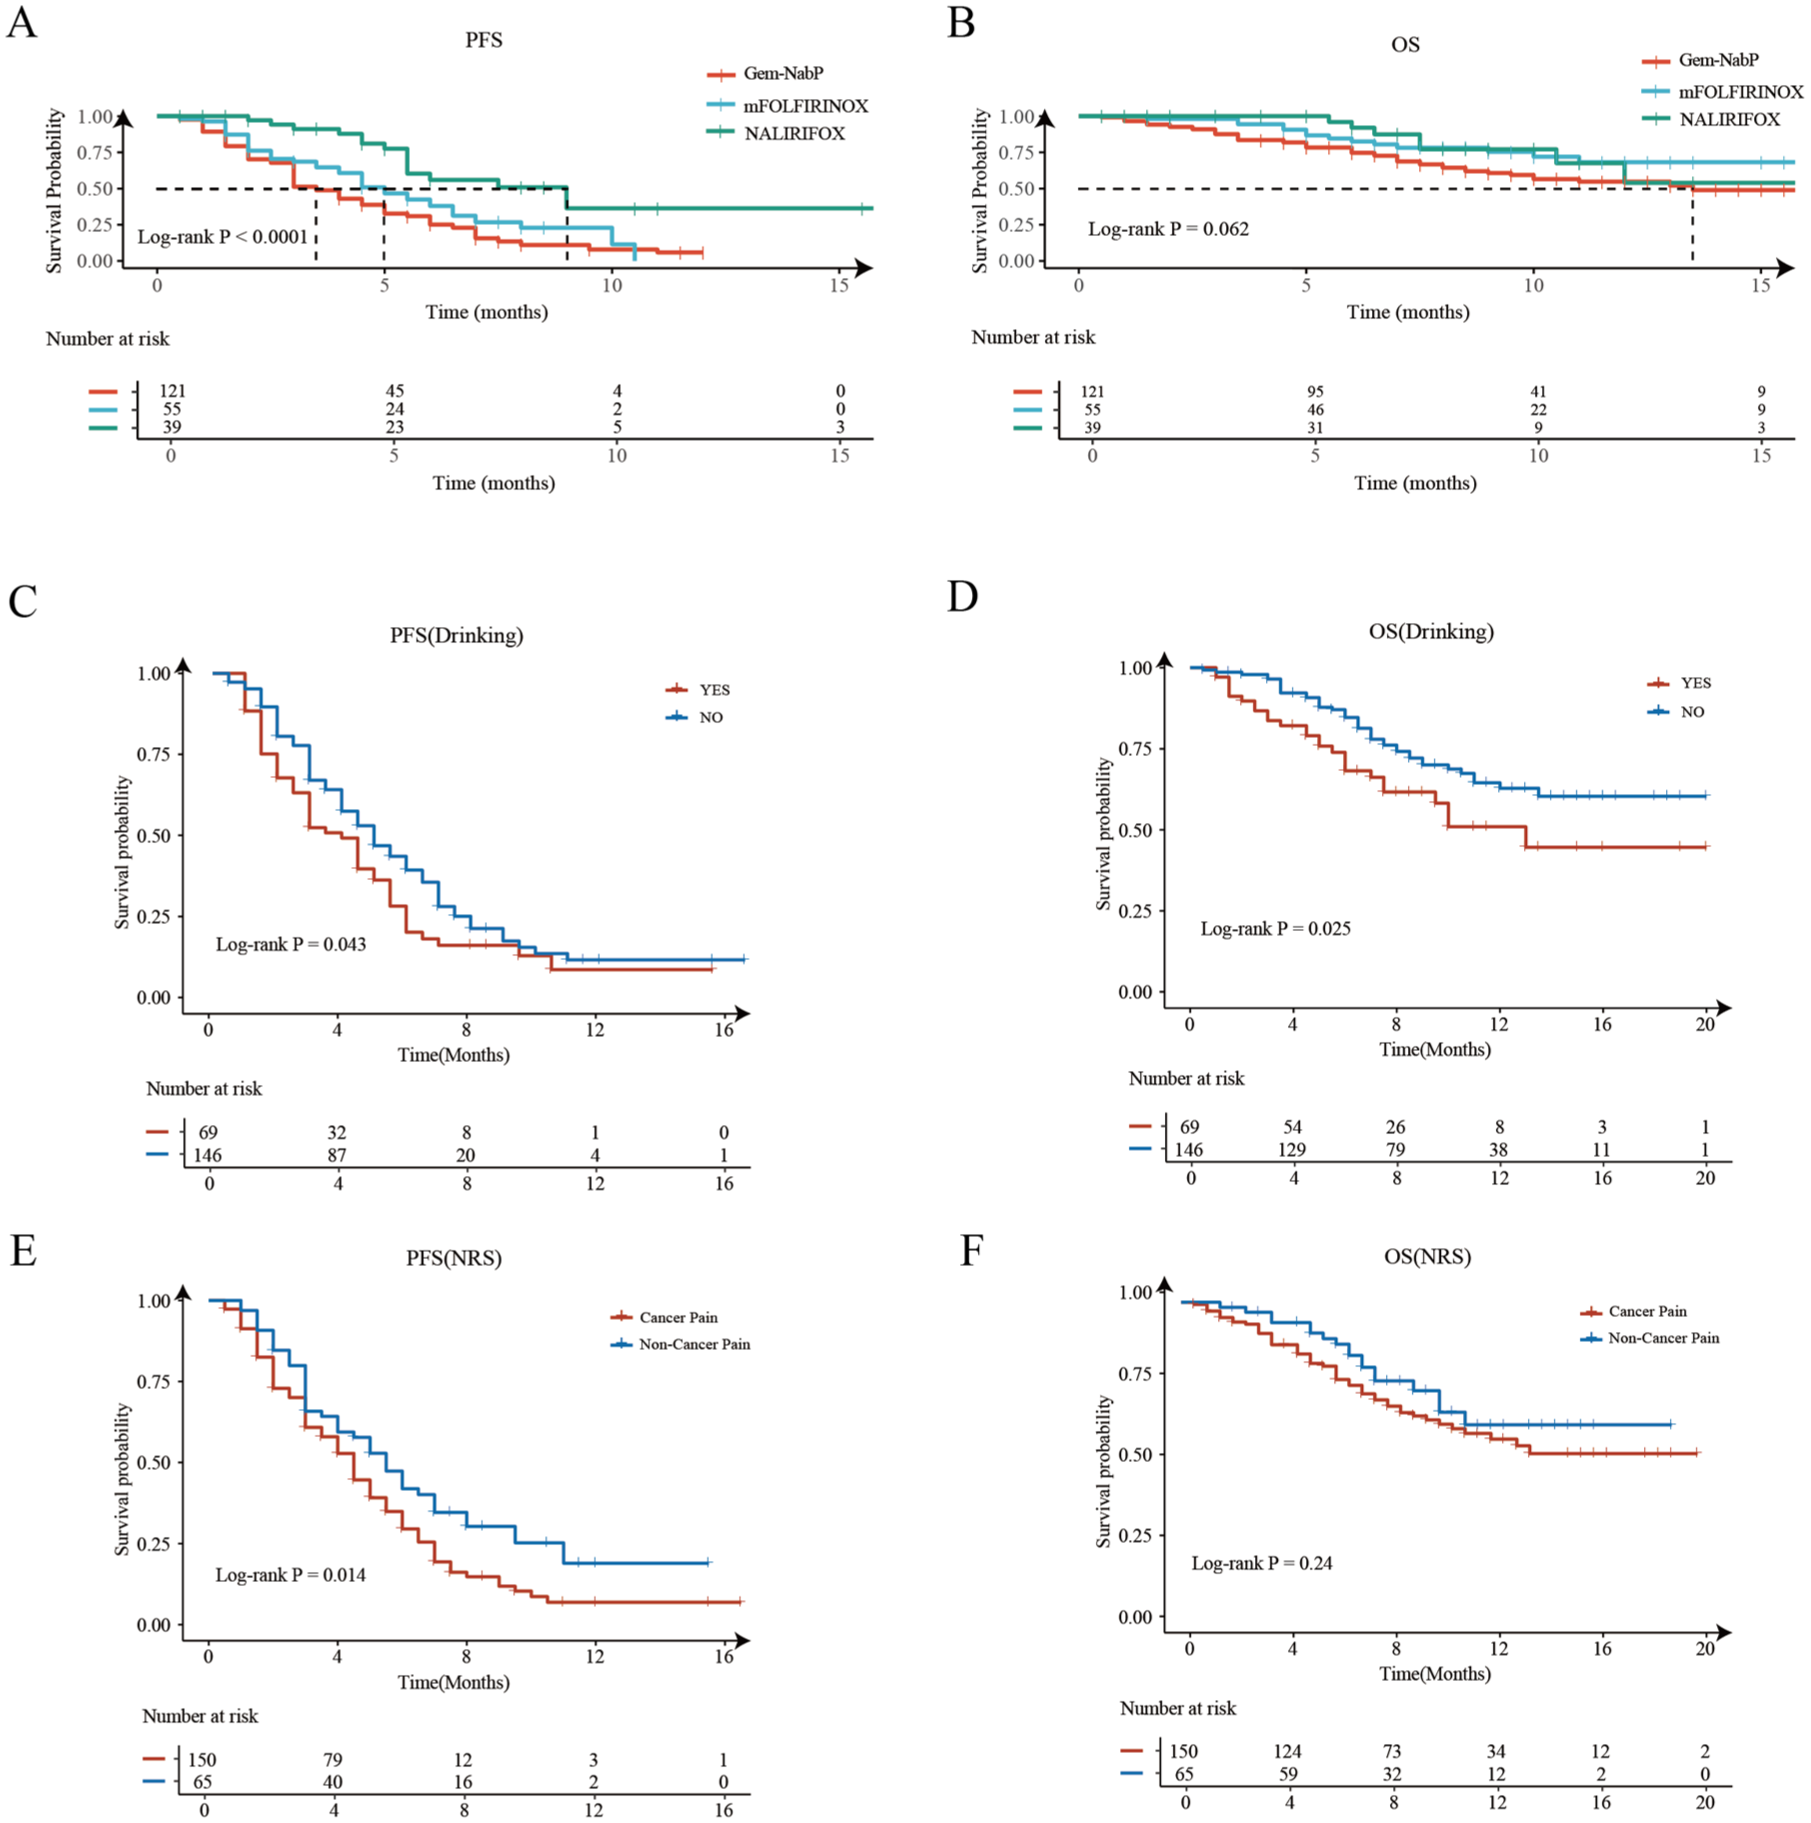
Survival analysis among the three treatment groups. (a) Kaplan–Meier curves for PFS show a significant difference among treatment arms (Log-rank p < 0.0001). (b) OS curves revealed no statistically significant difference between the three groups (Log-rank p = 0.062). (c) Effect of alcohol consumption on PFS (Log-rank p = 0.043); (d) Effect of alcohol consumption on OS (Log-rank p = 0.025); (e) Effect of pain status on PFS (Log-rank p = 0.014); (f) Effect of pain status on OS (Log-rank p = 0.24).
Tolerance and safety
AEs across the three regimens are presented in Figure 4 and Supplemental Table 2. Overall, the safety profile was manageable, with the most common AEs being hematologic toxicity, gastrointestinal reactions, liver function abnormalities, and electrolyte disturbances, predominantly Grade 1–2. No treatment-related deaths (Grade 5) were reported.
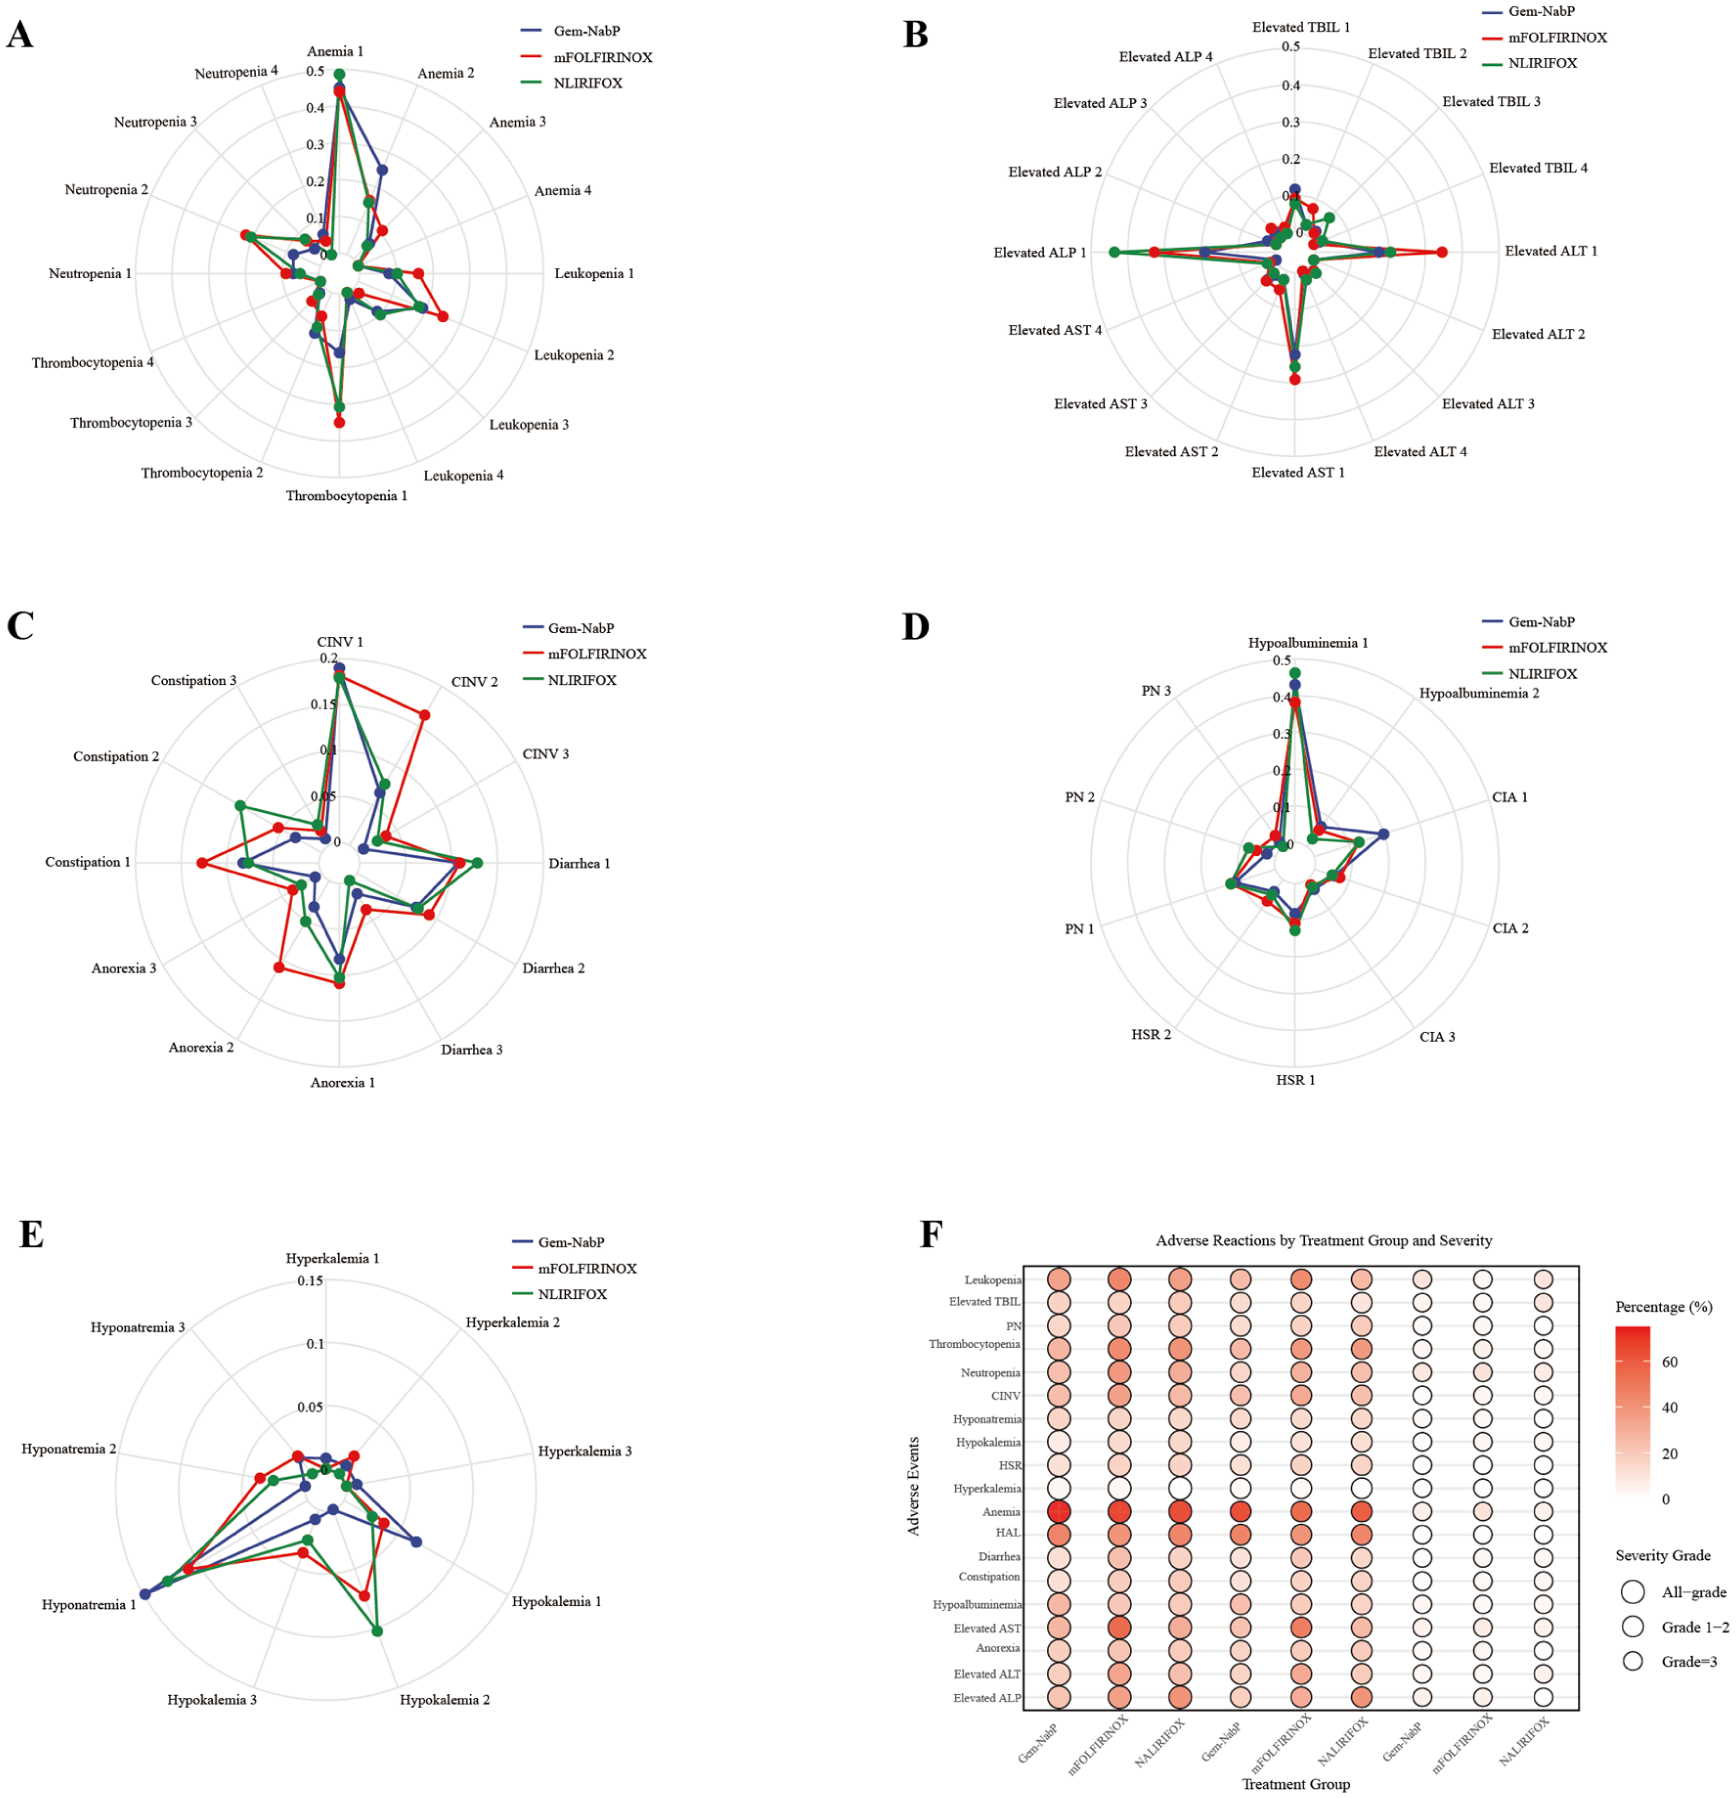
Radar and bubble plots of adverse events across different treatment regimens (based on CTCAE v5.0). (a) Common hematologic adverse events, including neutropenia, thrombocytopenia, leukopenia, and anemia; (b) Common hepatic adverse events, including elevated ALT, AST, ALP, and TBIL; (c) Common gastrointestinal adverse events, including nausea, vomiting, diarrhea, constipation, and anorexia; (d) Other related adverse events, including hypoalbuminemia, HSR, and PN; (e) Electrolyte-related adverse events, including hyperkalemia, hypokalemia, and hyponatremia; (f) The bubble plot summarizes the overall incidence and severity distribution of adverse events among treatment groups.
Hematologic toxicity was the most common adverse event (Figure 4(a)). Neutropenia and thrombocytopenia were most frequent in the mFOLFIRINOX group, with Grade 1–2 incidences of 30.91% and 41.82%, respectively. Anemia occurred across all groups, with the highest rate in the Gem-NabP cohort (69.42%), mainly Grade 1–2. Total bilirubin (TBIL) elevation showed no significant differences among groups (p = 0.43), while the mFOLFIRINOX group had higher Grade 1–2 alanine aminotransferase (ALT) and aspartate aminotransferase (AST) elevations (both 34.55%, p > 0.05). In contrast, alkaline phosphatase (ALP) elevation was more common in the NALIRIFOX group, both overall (p = 0.05) and for Grade 1–2 events (p < 0.01) (Figure 4(b)). Gastrointestinal reactions were slightly more frequent in the mFOLFIRINOX group (Figure 4(c)), but without significant intergroup differences (p > 0.05). Hypoalbuminemia and rash were more common in the Gem-NabP group, whereas PN and hypersensitivity reaction (HSR) were more frequent with mFOLFIRINOX (Figure 4(d)). Hypokalemia occurred more often in the NALIRIFOX group (15.38%, p < 0.01), while other electrolyte abnormalities showed no significant differences (Figure 4(e)). Overall, hematologic toxicity remained the most common AE, with mFOLFIRINOX presenting a higher concentration of such events, and hypokalemia was more frequent in the NALIRIFOX group (Figure 4(f)).
Prognostic analysis
Multivariate analysis showed that the NALIRIFOX regimen (HR = 0.32; 95% CI: 0.18–0.55; p < 0.01) and mFOLFIRINOX (HR = 0.65; 95% CI: 0.45–0.95; p = 0.02) were independent favorable prognostic factors for PFS, whereas alcohol consumption (HR = 1.62; 95% CI: 1.15–2.27; p < 0.01) and cancer-related pain (HR = 1.64; 95% CI: 1.15–2.34; p < 0.01) were associated with increased progression risk (Table 2). For OS, the NALIRIFOX regimen (HR = 0.42; 95% CI: 0.19–0.95; p = 0.04) remained independently associated with improved survival, while alcohol consumption (HR = 1.99; 95% CI: 1.22–3.25; p < 0.01) significantly increased mortality risk (Table 3). These independent prognostic factors were further validated by survival analysis (Figure 3(c)–(f)).
Analysis of prognostic factors using Cox proportional hazard for PFS in patients.
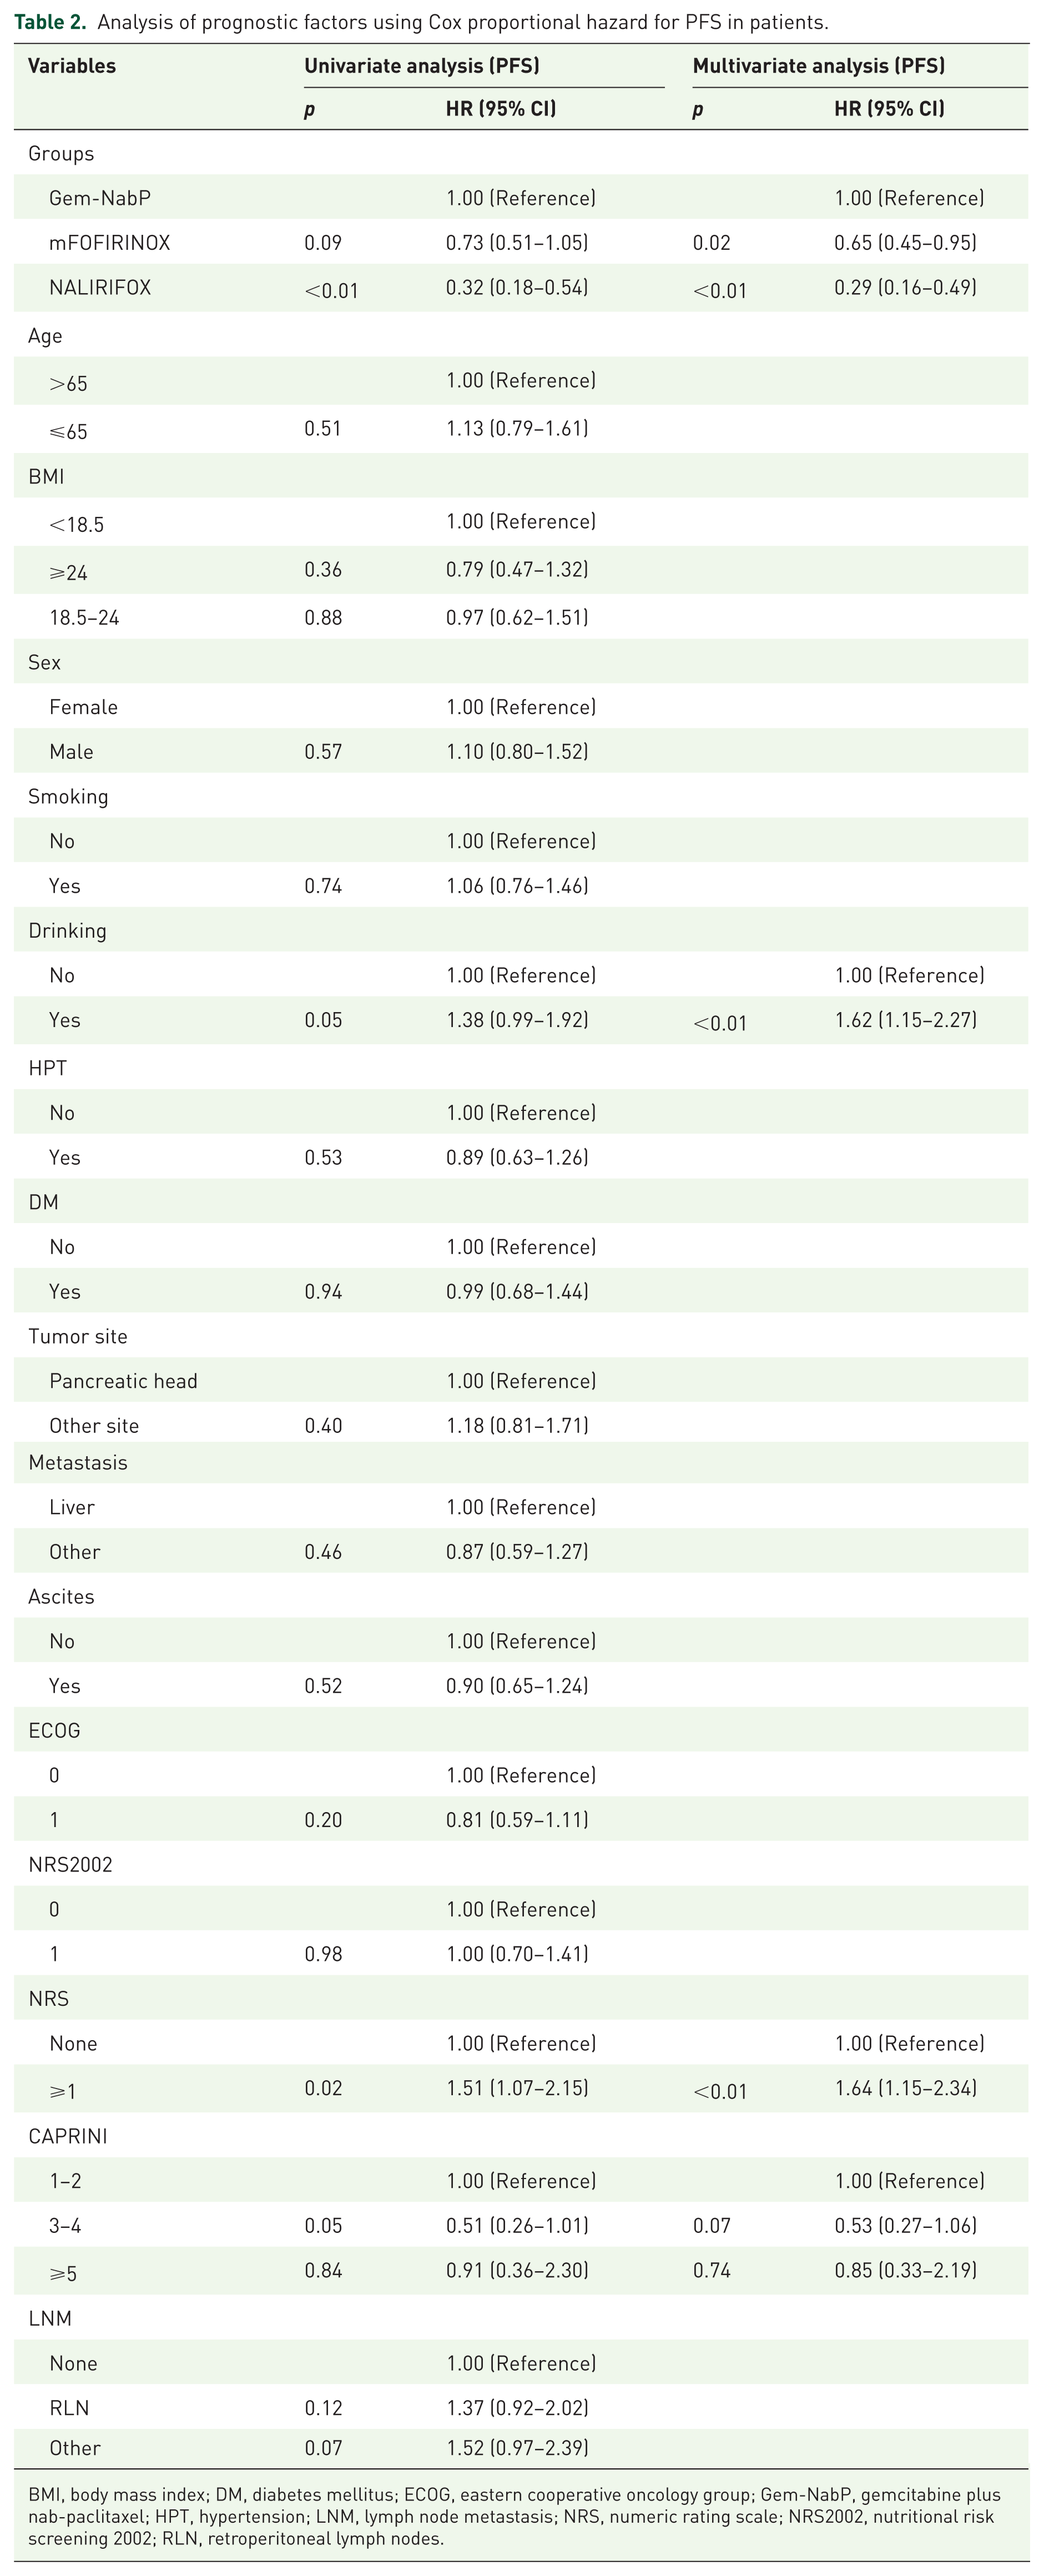
BMI, body mass index; DM, diabetes mellitus; ECOG, eastern cooperative oncology group; Gem-NabP, gemcitabine plus nab-paclitaxel; HPT, hypertension; LNM, lymph node metastasis; NRS, numeric rating scale; NRS2002, nutritional risk screening 2002; RLN, retroperitoneal lymph nodes.
Analysis of prognostic factors using Cox proportional hazard for OS in patients.
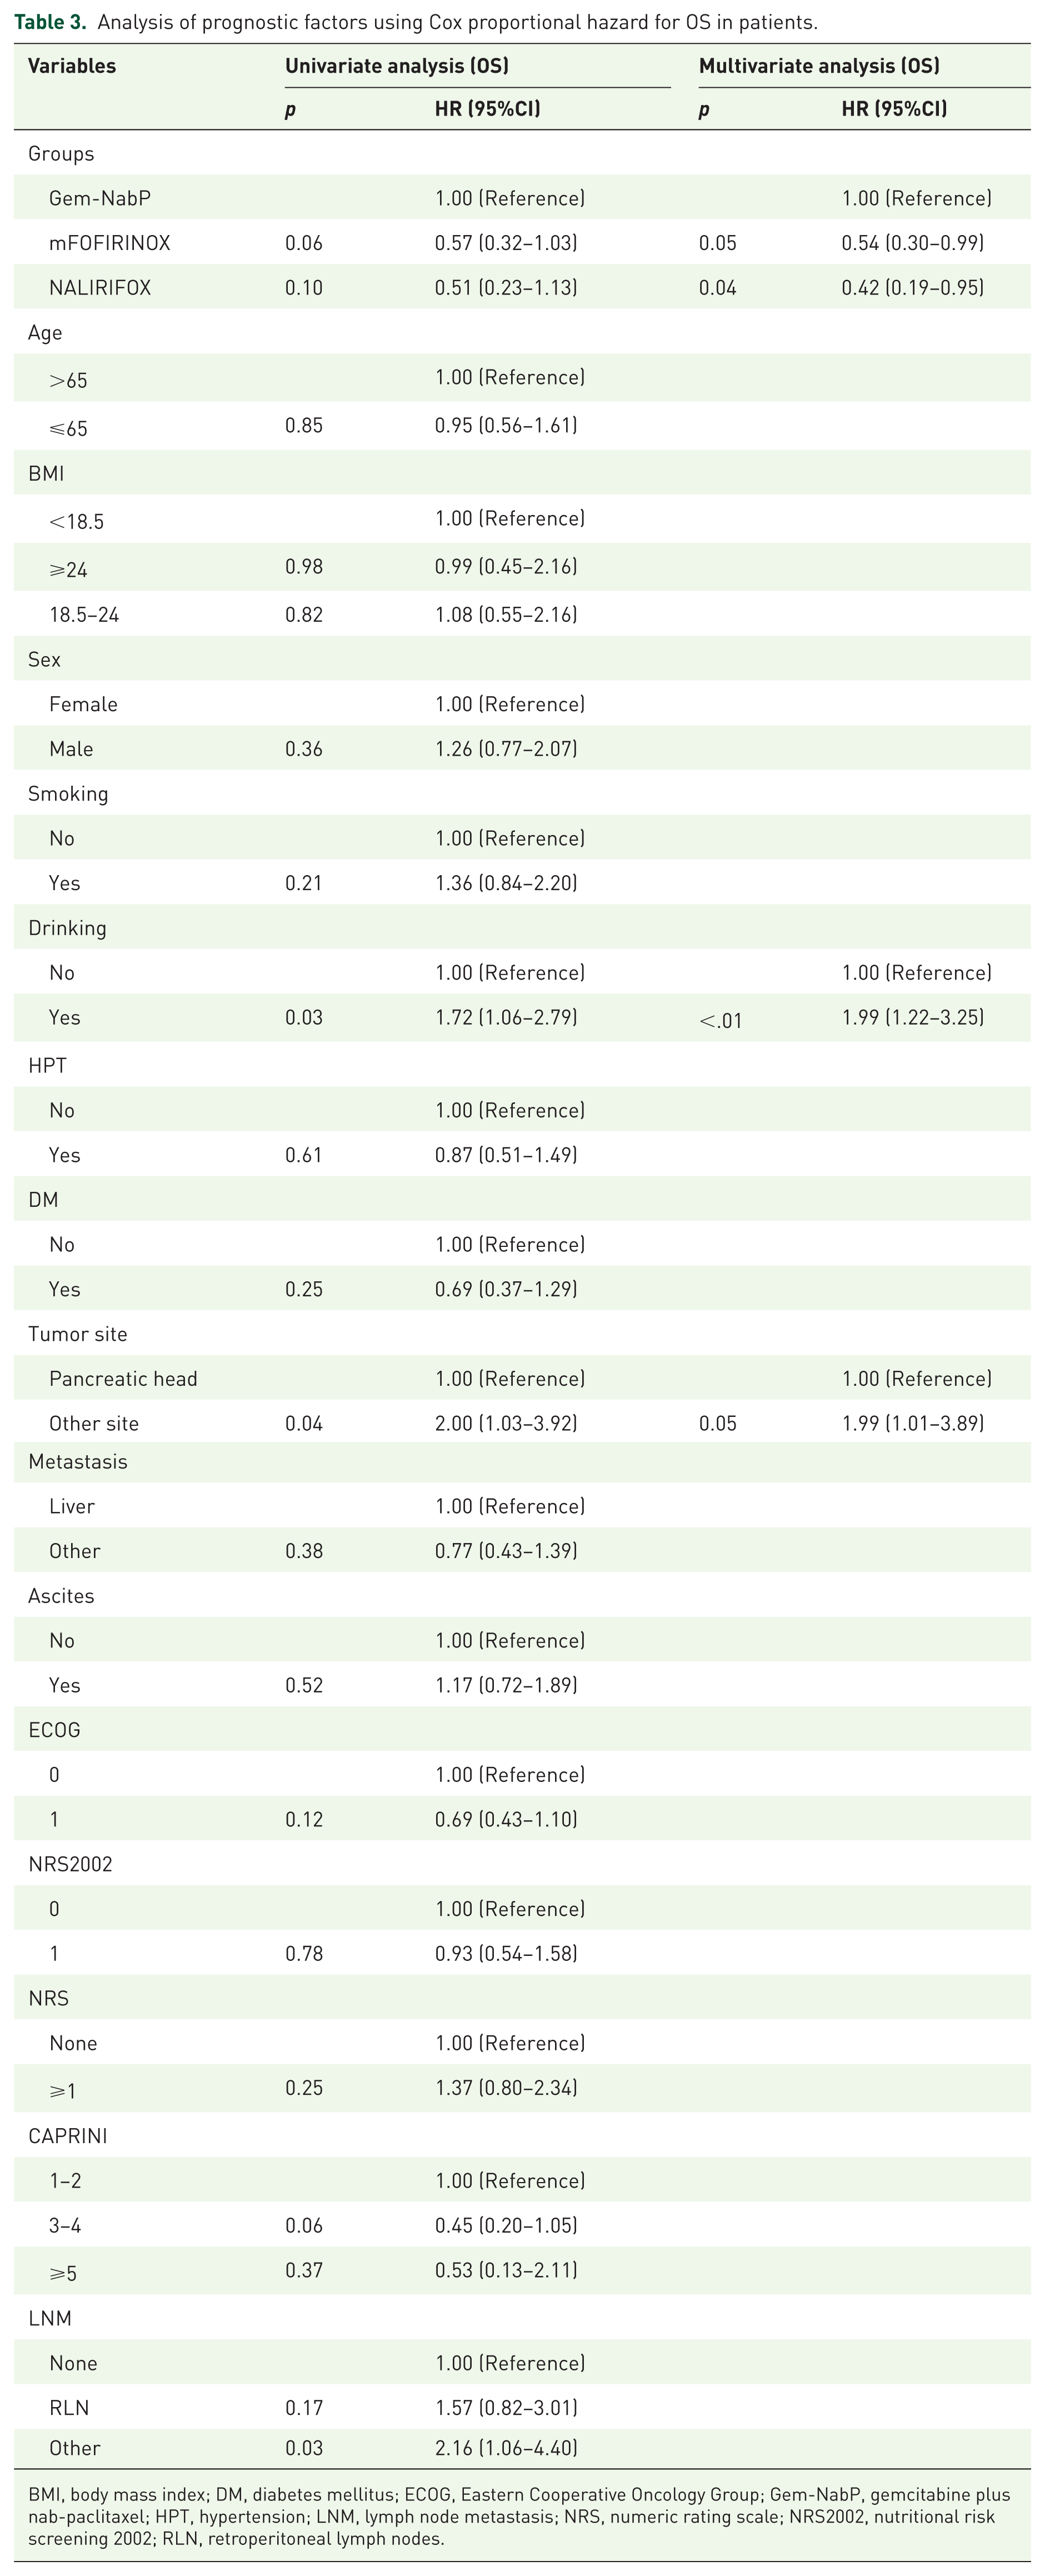
BMI, body mass index; DM, diabetes mellitus; ECOG, Eastern Cooperative Oncology Group; Gem-NabP, gemcitabine plus nab-paclitaxel; HPT, hypertension; LNM, lymph node metastasis; NRS, numeric rating scale; NRS2002, nutritional risk screening 2002; RLN, retroperitoneal lymph nodes.
To further control for potential confounding, multivariable Cox proportional hazards regression analyses were performed for PFS and OS. After adjustment, compared with the Gem-NabP group, both the mFOLFIRINOX regimen (PFS: HR = 0.64, 95% CI: 0.44–0.94, p = 0.02; OS: HR = 0.50, 95% CI: 0.27–0.93, p = 0.03) and the NALIRIFOX regimen (PFS: HR = 0.28, 95% CI: 0.16–0.49, p < 0.01; OS: HR = 0.43, 95% CI: 0.19–0.97, p = 0.04) remained significantly associated with lower risks of disease progression and death. Among the adjusted covariates, alcohol consumption was independently associated with worse survival outcomes (PFS: HR = 1.99, 95% CI: 1.24–3.20, p < 0.01; OS: HR = 2.05, 95% CI: 1.09–3.87, p = 0.03). In addition, an NRS score ⩾1 was independently associated with shorter PFS (HR = 1.59, 95% CI: 1.11–2.29, p = 0.01). In the multivariable analysis, age, smoking status, metastatic site, and ECOG performance status were not significantly associated with either PFS or OS (Supplemental Table 4).
Association analysis
To evaluate treatment efficacy across different levels of cancer pain and primary tumor sites (Figure 5), data were visualized using a Sankey diagram.
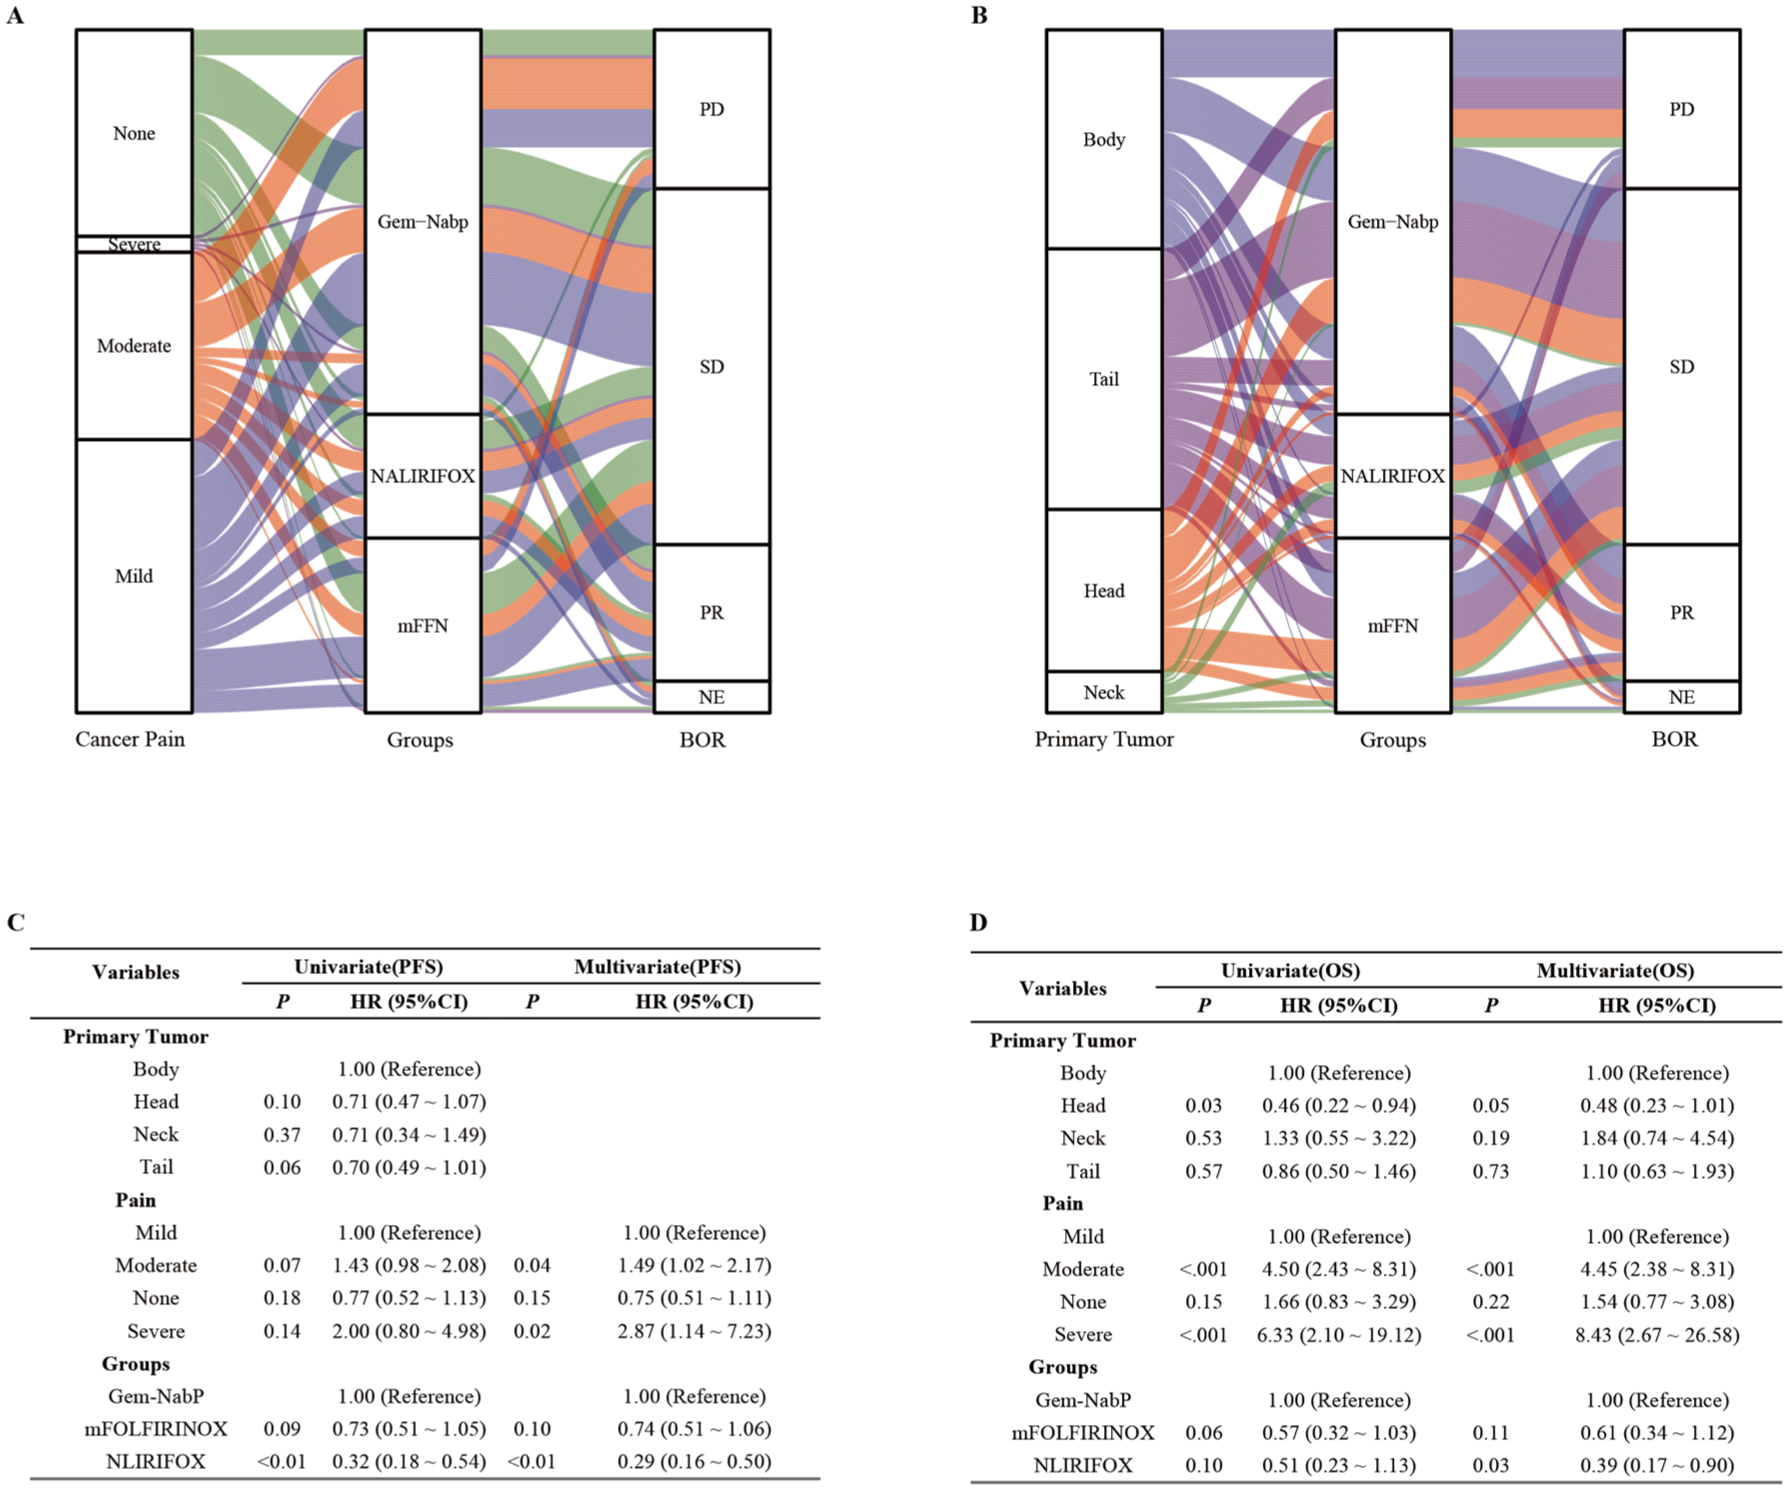
Sankey diagram analysis of different factors and evaluation by Cox regression models. (a) Sankey diagram depicting the relationship between cancer pain severity, treatment regimen, and BOR; (b) Sankey diagram depicting the relationship between primary tumor site, treatment regimen, and BOR; (c) Univariate and multivariate Cox regression analysis for PFS; (d) Univariate and multivariate Cox regression analysis for OS.
Among patients without pain, SD was predominant in all three groups, with SD rates of 50.00%, 81.25%, and 69.23% in the Gem-NabP, mFOLFIRINOX, and NALIRIFOX groups, respectively, and PD rates of 22.22%, 6.25%, and 15.38%, respectively. Among patients with mild or moderate pain, the NALIRIFOX group exhibited the highest PR rates (35.71% and 45.45%, respectively), with no PD observed. In contrast, the PD rates in both the Gem-NabP and mFOLFIRINOX groups were no less than 20%. (Figure 5(a)).
For pancreatic head tumors, the NALIRIFOX group showed the highest PR rate (40.00%), no PD was observed in the mFOLFIRINOX group, while the Gem-NabP group had a PD rate of 33.33%. For pancreatic neck tumors, PD was predominant in the Gem-NabP group (75.00%), whereas all patients in the NALIRIFOX group exhibited SD (100.00%). For pancreatic body tumors, SD was the primary outcome across all three groups. For pancreatic tail tumors, the NALIRIFOX group demonstrated the highest PR rate (41.18%) with no PD observed, while the PD rates in the Gem-NabP and mFOLFIRINOX groups were 22.73% and 28.57%, respectively. Overall, the alluvial diagram suggests that NALIRIFOX was associated with a relatively more favorable BOR distribution in patients with mild-to-moderate cancer pain and in those with primary tumors located in the pancreatic head, neck, and tail. In contrast, Gem-NabP was more frequently associated with PD in most subgroups (Figure 5(b)).
Multivariate Cox regression analysis results indicated that moderate pain (HR = 1.49; HR = 4.45) and severe pain (HR = 2.87; HR = 8.43) were identified as independent adverse prognostic factors for PFS and OS. Differences in primary tumor location showed no significant correlation with disease progression. However, patients with pancreatic head tumors exhibited a trend toward improved survival compared to those with pancreatic body tumors (HR = 0.48, 95% CI: 0.23–1.01, p = 0.05; Figures 5(c) and (d)).
To further validate whether primary tumor location influences patient prognosis, we conducted a supplementary survival analysis. Results showed that differences in PFS and OS between patients with tumors in different locations did not reach statistical significance (PFS: p = 0.17; OS: p = 0.102). Comparing head/neck versus body/tail regions also revealed no significant differences in PFS or OS (PFS: p = 0.33; OS: p = 0.13). Subsequent comparisons revealed that the PFS difference between patients with primary tumors in the pancreatic head and body was not statistically significant (p = 0.079), but OS was superior in patients with primary tumors in the pancreatic head compared to those in the body (p = 0.028). In contrast, no significant differences in either PFS or OS were observed between pancreatic head and tail patients (PFS: p = 0.96; OS: p = 0.091; Supplemental Figure 1).
In summary, NALIRIFOX demonstrated superior disease control and a lower risk of progression across different pain severities and primary tumor sites. In contrast, Gem-NabP consistently showed the highest progression rates, particularly in patients with cancer pain, indicating limited effectiveness in this subgroup (Supplemental Table 3). These findings warrant validation in larger prospective studies.
Subgroup analysis
Given the superior efficacy of mFOLFIRINOX and NALIRIFOX over Gem-NabP, subgroup analyses were performed (Figure 6). In the PFS analysis (Figure 6(a)), NALIRIFOX significantly improved PFS in the overall population (HR = 0.41, 95% CI: 0.22–0.76, p = 0.004), with particularly pronounced benefit in female patients (p for interaction = 0.017). In contrast, no significant differences in OS were observed in the overall cohort or across subgroups (Figure 6(b)).
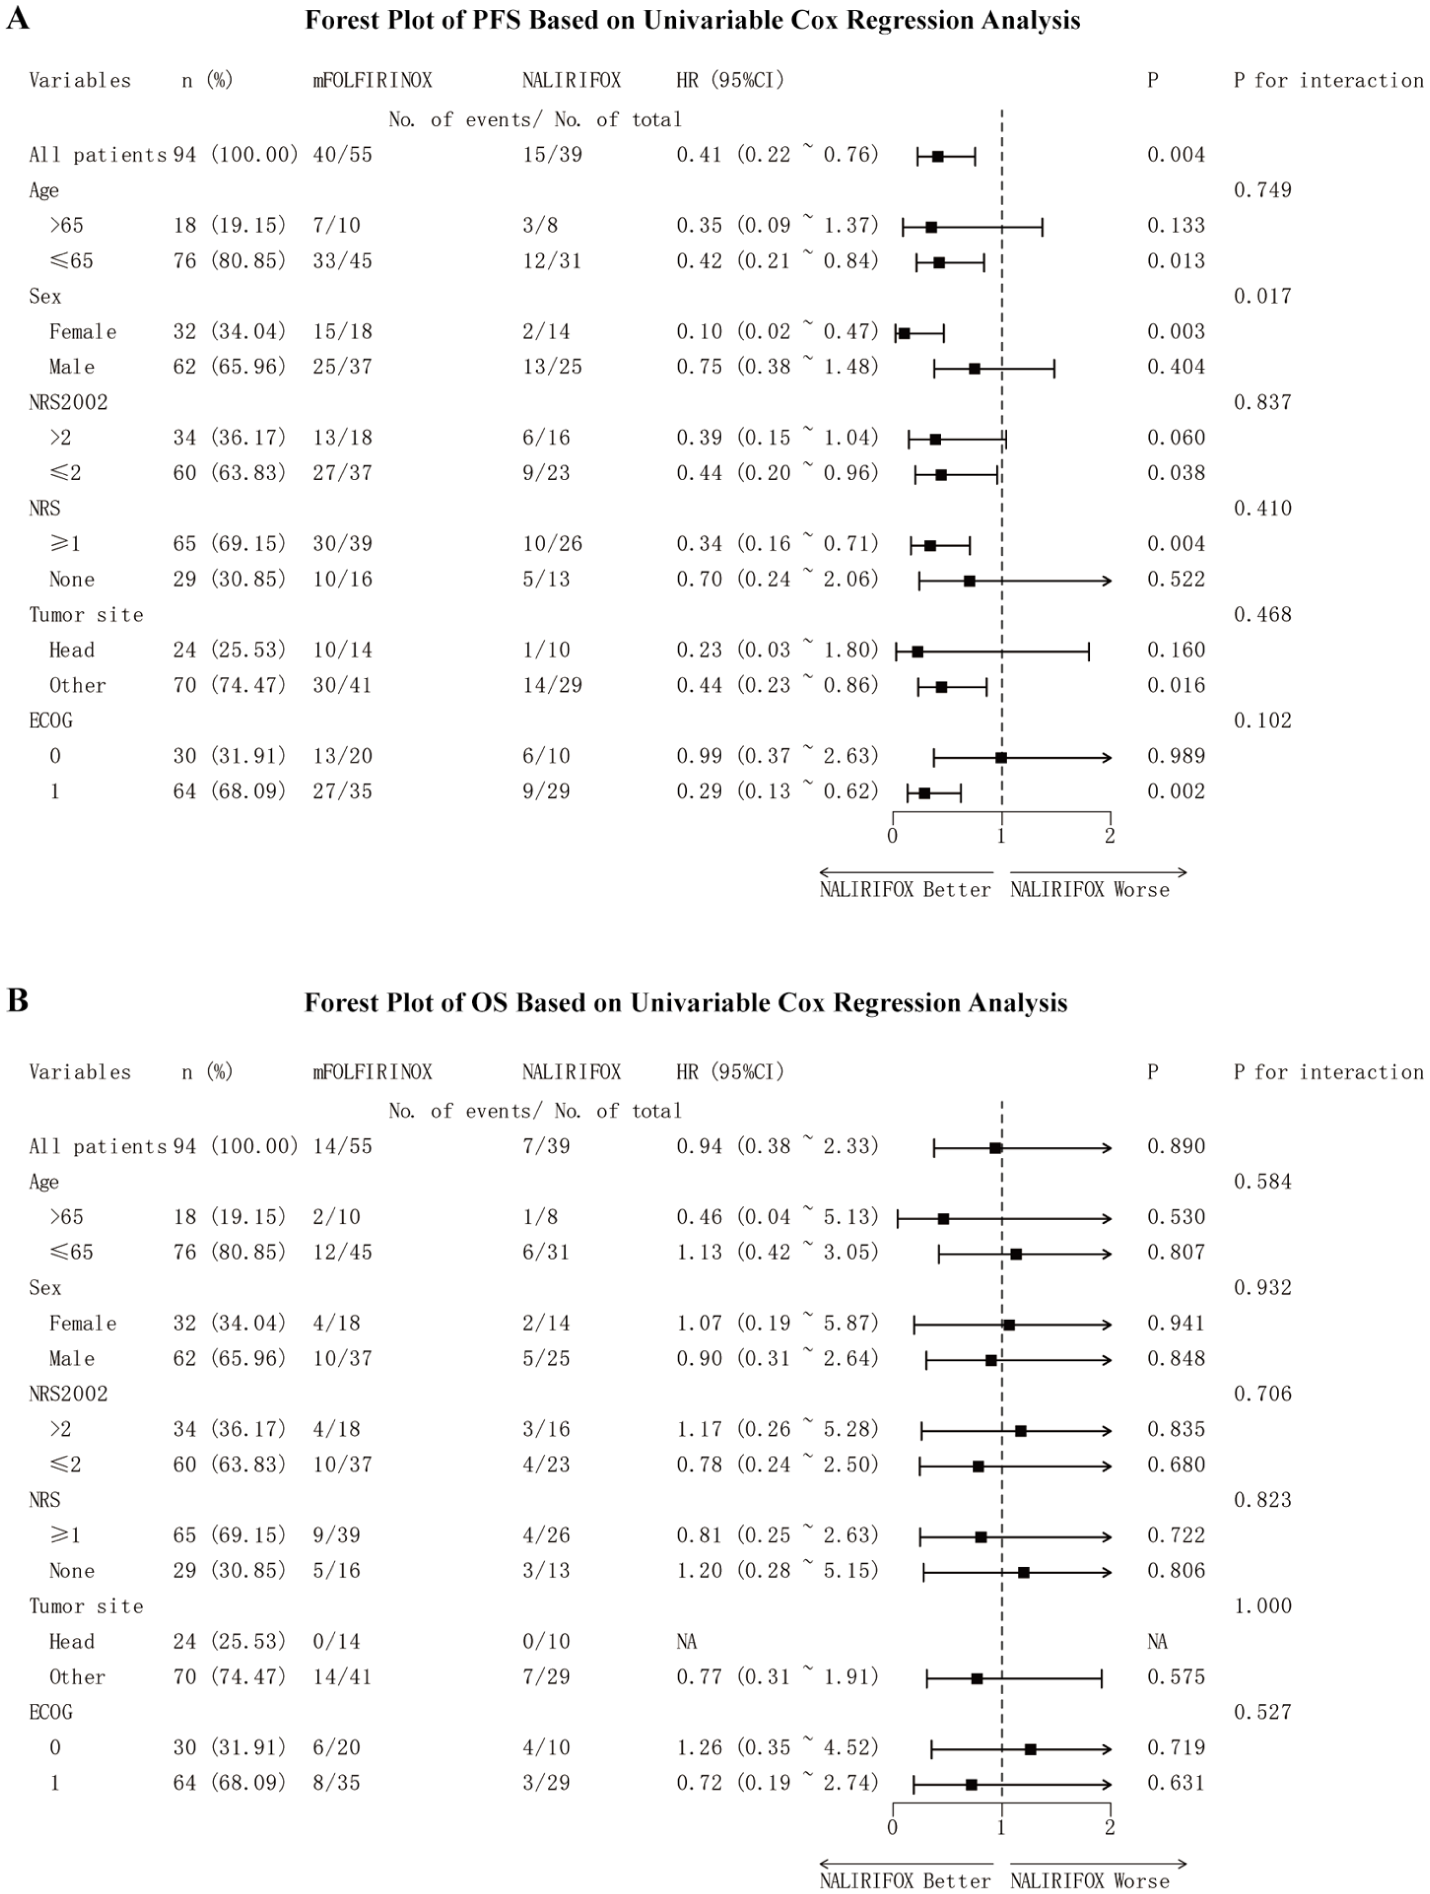
Subgroup analysis forest plots based on univariate Cox models. (a) Subgroup analysis for PFS; (b) Subgroup analysis for OS.
Discussion
The MPACT established the superiority of Gem-NabP over gemcitabine monotherapy, while the NCT02028806 study confirmed the clinical non-inferiority of mFOLFIRINOX compared with FOLFIRINOX. More recently, the NAPOLI-3 trial demonstrated the distinct survival advantage of NALIRIFOX.5,8,9 However, direct clinical comparisons among these regimens remain limited, and real-world evidence guiding the selection of optimal first-line therapy for patients with different clinical characteristics is lacking.
The results of this study demonstrated that the NALIRIFOX regimen achieved significantly longer PFS and higher 6-month survival rates. The lower 12-month survival rate observed in the NALIRIFOX group may be attributed to the shorter follow-up duration and the impact of subsequent treatments, leading to patient censoring. Continued follow-up is warranted to strengthen the robustness of these findings. The JCOG1611-GENERATE trial reported that mFOLFIRINOX did not confer a survival advantage over Gem-NabP. 10 Unlike our study, it included patients with recurrent advanced pancreatic cancer, which may explain the differing results. Another retrospective analysis also demonstrated comparable efficacy between mFOLFIRINOX and Gem-NabP, 13 though its small sample size limited the strength of the conclusion. In line with our observations, the NAPOLI-3 trial confirmed the significant survival benefit of NALIRIFOX. 9 From a pharmacoeconomic standpoint, NALIRIFOX improves quality-adjusted life years (QALYs) and is cost-effective, particularly under higher willingness-to-pay thresholds or reduced drug costs.14,15
This study found that alcohol consumption was significantly associated with increased risks of disease progression and mortality in patients with mPDAC. A large meta-analysis found a significant association between increased alcohol intake and pancreatic cancer risk: each additional 10 grams of alcohol consumed per day was associated with an approximately 3% increase in risk. 16 This association was observed across different populations and remained independent of smoking status and other confounding factors. Studies indicate that alcohol and its metabolite, acetaldehyde, can induce oxidative stress, DNA damage, and chronic inflammation in pancreatic tissue, all of which promote tumorigenesis and progression.17,18 Alcohol may also contribute to chronic pancreatitis, creating a microenvironment conducive to malignant transformation. Preclinical studies have shown that alcohol exposure enhances pancreatic tumor growth and metastatic potential through pathways such as C/EBPβ-VIRMA-mediated m6A regulation. 19 These findings provide mechanistic support for the potential adverse effects of alcohol on PDAC progression. These studies also confirm that alcohol consumption may not only promote the development of pancreatic cancer but also influence clinical outcomes following diagnosis.20,21
Our findings demonstrated that moderate-to-severe pain markedly increased the risk of disease progression and was strongly associated with poorer survival outcomes. Mechanistically, nociceptive neurons in the pancreas have been shown to induce CD8+T-cell exhaustion, thereby facilitating tumor progression to a certain extent. 22 Previous studies have reported that patients with no pain, mild pain, and moderate-to-severe pain had median OS times of 21.5, 15.0, and 10.0 months, respectively. 23 Cancer pain in PDAC is typically caused by tumor invasion or compression of the peripancreatic nerves, surrounding tissues, and visceral structures. Therefore, patients with higher pain scores (moderate-to-severe) are more likely to have larger tumor volumes, more extensive local invasion, or metastatic spread, leading to an increased overall tumor burden. Clinically, this greater tumor burden is often associated with a more aggressive disease course and reduced OS. 24 Recent studies further indicate that increased nociceptor innervation within PDAC tissue may suppress immune surveillance, thereby impacting patient OS. This mechanism supports the view that the severity of cancer pain can serve as an indirect indicator of the aggressiveness of the tumor microenvironment and the tumor burden, and is associated with poorer survival outcomes. 22 Pancreatic head tumors tend to show more favorable survival than body or tail tumors. Head cancers are often detected earlier due to symptoms like obstructive jaundice, allowing timely intervention, whereas body and tail tumors are usually diagnosed at a more advanced stage due to their insidious onset. 25 Moreover, pancreatic body/tail tumors show higher incidences of vascular invasion and distant metastasis,26,27 and mutations in genes such as KRAS and SMAD4 are more frequent in mPDAC, suggesting a more aggressive biological phenotype.28,29
The overall safety profiles of the three chemotherapy regimens were manageable, with no treatment-related deaths observed, and most AEs were Grade 1–2 in severity. Overall, these findings are largely consistent with previous clinical trials and real-world studies,8,9,30 indicating that all three regimens demonstrate acceptable tolerability. However, it should be noted that in routine clinical practice, prophylactic use of agents such as proton-pump inhibitors and antiemetics prior to chemotherapy may mitigate some of these toxicities, potentially influencing the observed incidence of AEs.
This single-center retrospective study may be subject to inherent selection bias and unmeasured confounding, which could have influenced treatment allocation and clinical outcomes. In particular, patients with missing key baseline information or outcome data were excluded during the selection process, and this complete-case approach may have further increased the risk of selection bias and limited the generalizability of the findings. In addition, although multivariable Cox regression analyses were used to adjust for several clinically relevant confounders, residual confounding cannot be completely ruled out because some potentially important variables may not have been measured, accurately captured, or fully controlled in this retrospective analysis. Larger multicenter prospective studies are needed. In addition, only chemotherapy effects on survival were assessed, while chemoradiotherapy can also improve survival, relieve pain, and enhance quality of life.31,32 Thus, the role of combined treatment strategies merits further investigation in future studies. In addition, molecular profiling and genetic mutation data were not included in our analysis. Prior studies have demonstrated that alterations in BRCA1/2, KRAS, TP53, and SMAD4 are closely associated with the prognosis of PDAC.33,34 Integrating molecular features could improve personalized treatment decisions. Short follow-up and the impact of subsequent therapies may explain the lack of significant OS differences. A longer follow-up is needed to better assess long-term survival.
Conclusion
In summary, this real-world study showed that chemotherapy regimens for mPDAC differ in efficacy and safety. NALIRIFOX offered longer PFS with manageable toxicity. Alcohol use and moderate-to-severe cancer pain were linked to worse outcomes, highlighting the importance of lifestyle and pain management. Larger prospective studies are needed to confirm these results and guide personalized treatment.
Supplemental Material
sj-docx-1-tam-10.1177_17588359261449092 – Supplemental material for Comparative efficacy and safety of NALIRIFOX versus other first-line chemotherapy regimens in metastatic pancreatic ductal adenocarcinoma: a retrospective study
Supplemental material, sj-docx-1-tam-10.1177_17588359261449092 for Comparative efficacy and safety of NALIRIFOX versus other first-line chemotherapy regimens in metastatic pancreatic ductal adenocarcinoma: a retrospective study by Yuqi Wang, Jiayi Liu, Jiaxin Wang, Xiaoli Liu, Jingxin Zhang and Dawei Chen in Therapeutic Advances in Medical Oncology
Supplemental Material
sj-png-2-tam-10.1177_17588359261449092 – Supplemental material for Comparative efficacy and safety of NALIRIFOX versus other first-line chemotherapy regimens in metastatic pancreatic ductal adenocarcinoma: a retrospective study
Supplemental material, sj-png-2-tam-10.1177_17588359261449092 for Comparative efficacy and safety of NALIRIFOX versus other first-line chemotherapy regimens in metastatic pancreatic ductal adenocarcinoma: a retrospective study by Yuqi Wang, Jiayi Liu, Jiaxin Wang, Xiaoli Liu, Jingxin Zhang and Dawei Chen in Therapeutic Advances in Medical Oncology
Footnotes
Acknowledgements
We sincerely appreciate Shandong Cancer Hospital and Institute for granting us access to their valuable learning platform. We are also grateful to the patients whose contributions have advanced medical research.
Declarations
Supplemental material
Supplemental material for this article is available online.
References
Supplementary Material
Please find the following supplemental material available below.
For Open Access articles published under a Creative Commons License, all supplemental material carries the same license as the article it is associated with.
For non-Open Access articles published, all supplemental material carries a non-exclusive license, and permission requests for re-use of supplemental material or any part of supplemental material shall be sent directly to the copyright owner as specified in the copyright notice associated with the article.