
Abstract
Rapid growth in petrol and diesel-powered vehicles has resulted in significant increases in tailpipe greenhouse gas emissions and air pollution, both of which harm public health in Indian cities. Furthermore, India’s dependence on imported fuel to transport people and goods threatens its fuel security. Therefore, electric mobility has been sought to deal with these issues. The governments have framed several plans and policies to promote electric vehicles (EVs) and achieve the target of EV30@30. However, EV adoption in Indian states has been slow. Therefore, this paper aims to estimate the number of EVs needed to be registered to achieve the desired target by 2030 by taking a case study of four states: Delhi, Uttar Pradesh, Karnataka, and Gujarat. The vehicular registration data used in this paper has been obtained from the government database. The study looks at the EV adoption rates of passenger vehicles such as two-wheelers, cars, auto-rickshaws (including e-rickshaws), and buses. According to the findings, the average annual share of passenger EVs is less than 2% in Delhi, less than 1% in Uttar Pradesh, and less than 0.5% in Karnataka and Gujarat during the study period. According to the models’ estimates, Delhi, Uttar Pradesh, Gujarat, and Karnataka will need to register 0.31 million, 1.51 million, 0.88 million, and 0.79 million passenger EVs, respectively, in FY 2030–2031 to achieve a 30% EV share of total registrations.
Introduction
India has undergone massive industrialisation and economic growth in the past three decades, which has resulted in the rapid growth of motorised vehicles, especially in metropolitan cities. However, vehicular growth has certainly come at the cost of environmental degradation, as petrol- and diesel-powered vehicles emit GHG (e.g., CO2) and pollutants (e.g., NOx and Particulate Matter) from their tailpipe (Acharya, 2009). For instance, the transport sector contributes 13.5% of India’s energy-related CO2 emissions (New Climate Institute, 2020). The toxic gases and Particulate Matter severely affect public health, particularly in densely populated metropolitan cities (Singh, 2012), which is evident from the fact that Delhi, Kolkata, and Mumbai are among the world’s top 20 most polluted cities (Indian Express, 2022). The above issues can largely be attributed to the strong dependence on petrol- and diesel-powered vehicles to move people and goods (Sasana & Ghozali, 2017). The consumption of these fuels has increased over the period to cater for the need of the transport sector, as shown in Figure 1. Sector-wise oil products consumption in India (Source: IEA).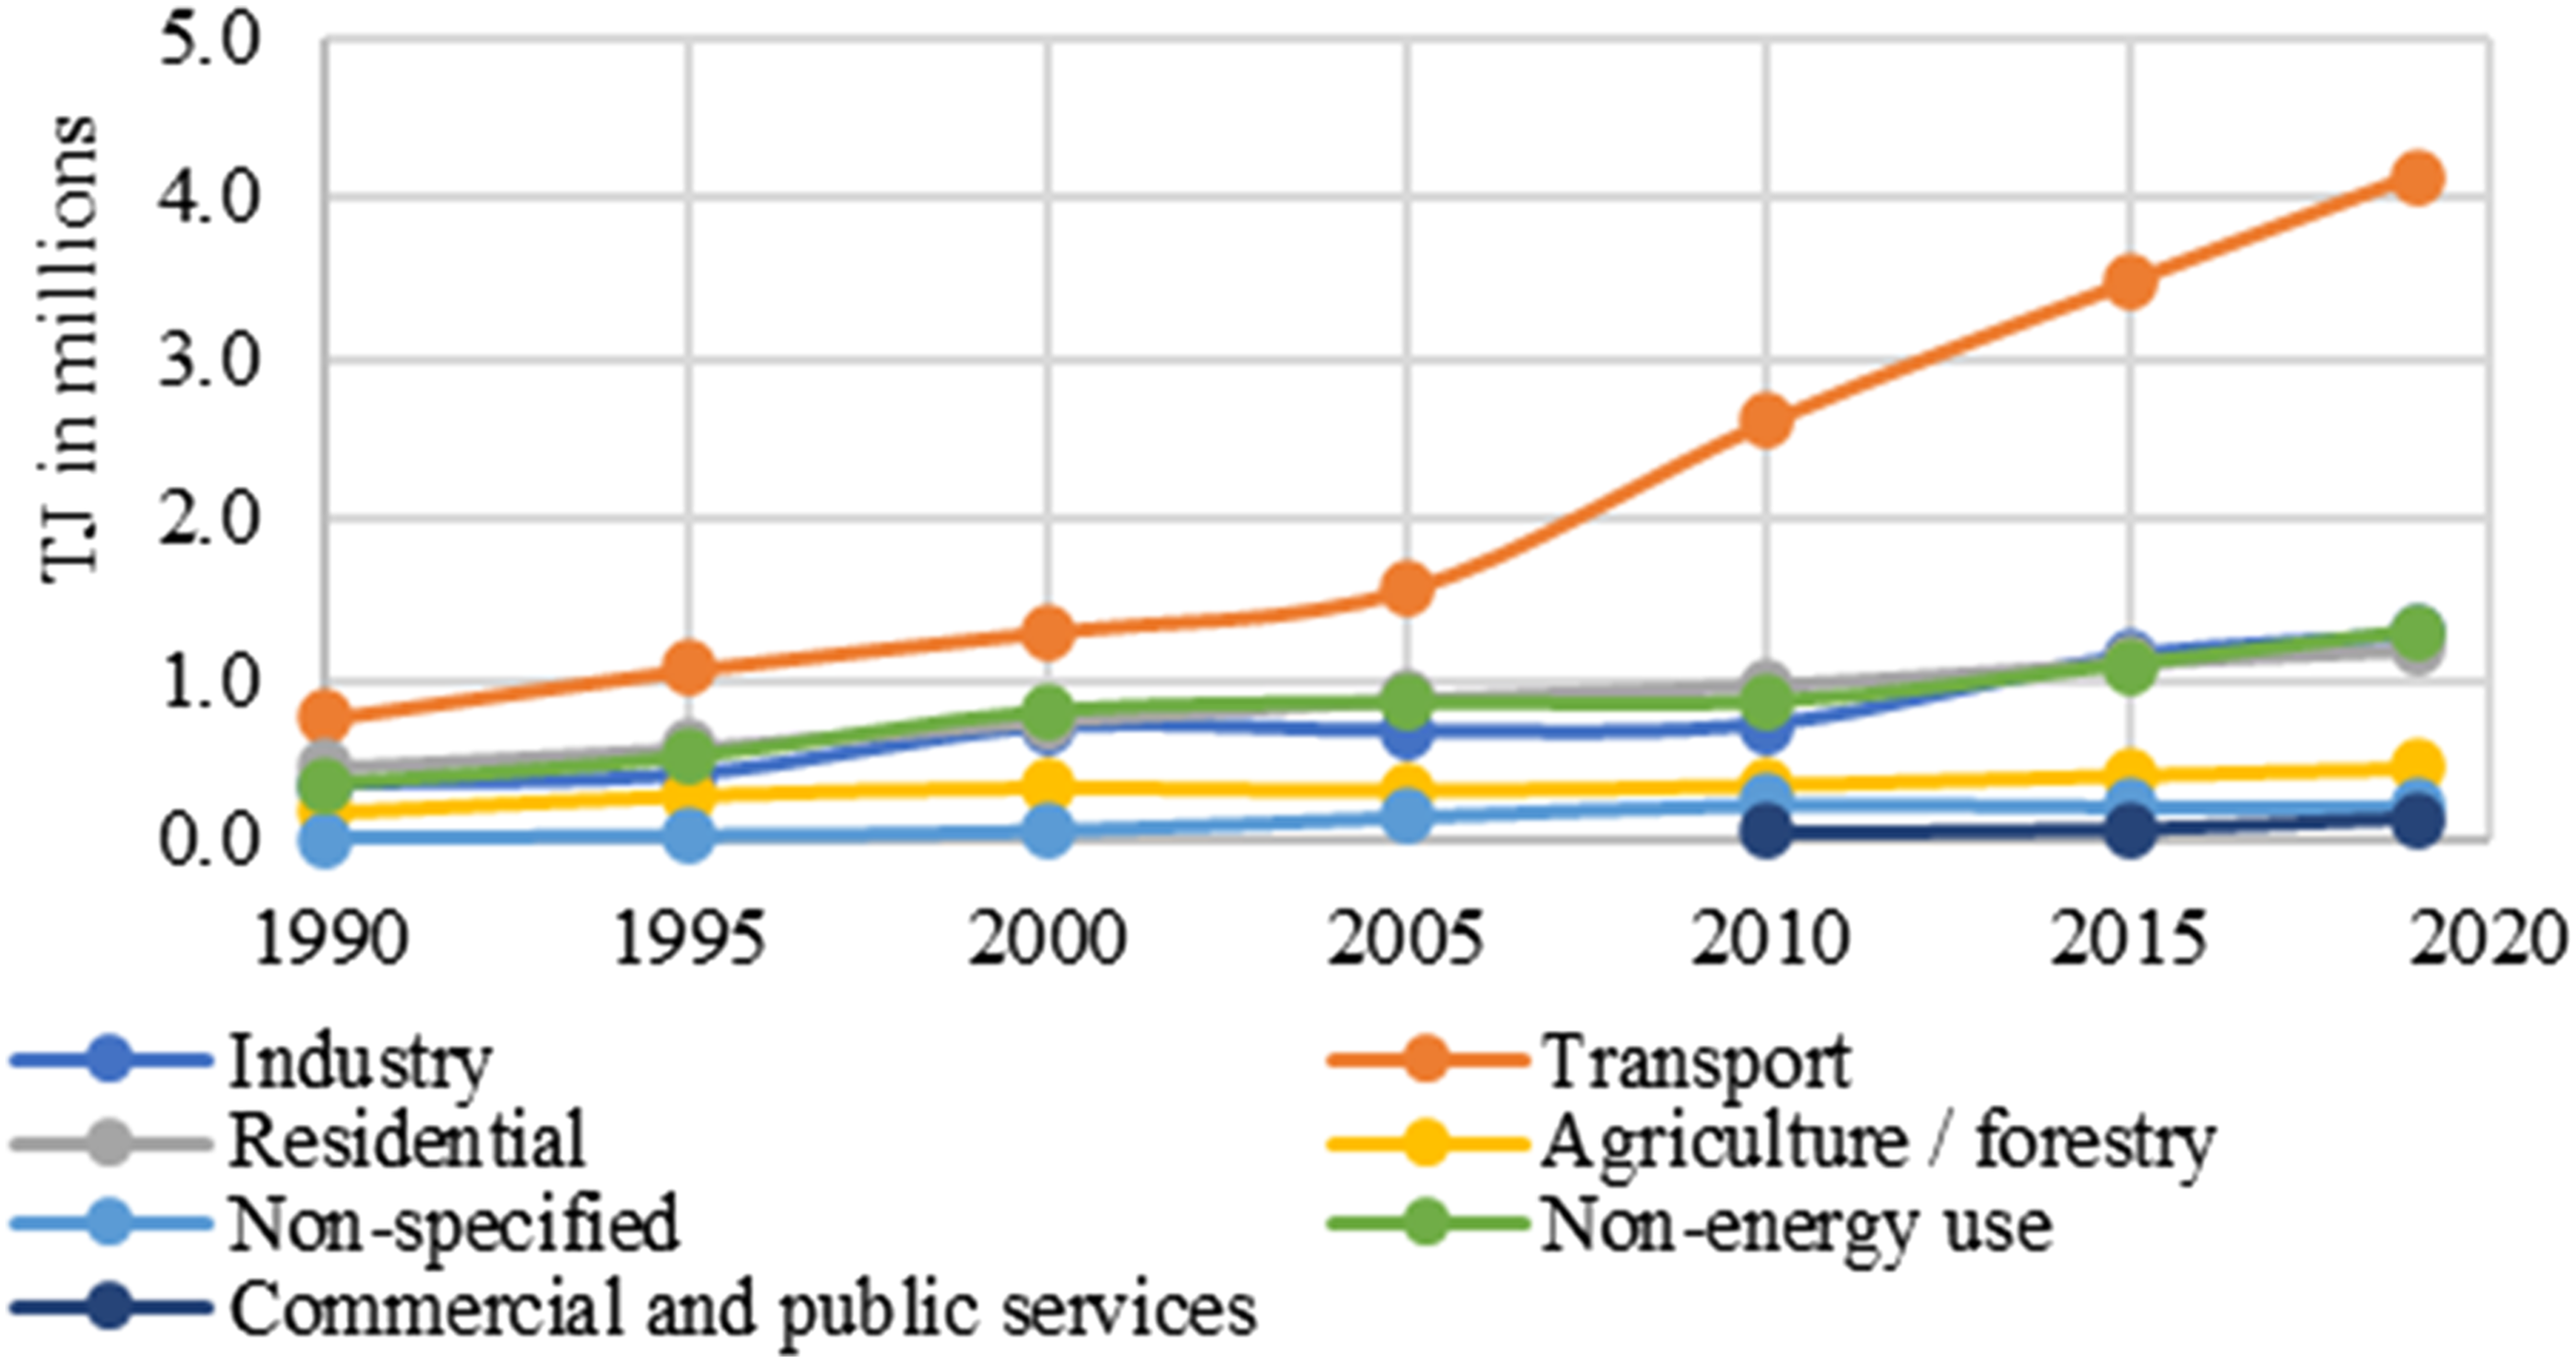
Moreover, while the oil and natural gas production in India has plateaued, the crude oil imports in India have increased rapidly during the past three decades, threatening India’s fuel security (IEA, 2019). The majority of the crude oil used in India is imported from middle eastern countries, such as Iraq (22%), Saudi Arabia (19%), United Arab Emirates (9%), and Kuwait (5%) (Statista, 2019). Any disruption to oil imports due to political instability in these countries or oil extinction may lead to a setback to India’s economic growth. Therefore, India must decrease its dependency on petrol and diesel. The transition to alternative energy sources such as electricity may lessen reliance on fuel and diesel. In India, the principal sources of energy generation are coal (50%), solar (16%), hydro (11%), wind (10%), and other (13%) (Ministry of Power - Government of India, 2023).
The increasing levels of air pollution and GHG emission, and the dependency on petrol and diesel, have drawn the attention of policymakers towards promoting alternative sources of fuel. Besides, India is committed to decarbonizing the transport sector to achieve carbon-neutral mobility. Thus, India ratified various global environmental pacts, namely, the Kyoto Protocol (Metz, 2013) and the Paris Agreement (Rogelj et al., 2016), and it is working on decreasing its GHG emissions to fulfil those commitments. Given this, electric mobility has been sought as one of the initiatives that have the potential to reduce tailpipe GHG emissions and pollution from the transport sector. Electric mobility refers to powering vehicles using an electric motor and recharging those vehicles externally from the power grid (Gartner, 2022). India has come up with various plans and strategies to promote electric mobility. The first plan was announced as National Electric Mobility Mission Plan (NEMMP) 2020 in 2012 (Ministry of Heavy Industries, 2012). Further, the schemes, namely, Faster Adoption and Manufacturing of (Hybrid &) Electric Vehicles (FAME)-I and FAME-II, were launched to help accelerate electric vehicle (EV) manufacturing and adoption by providing subsidies to both manufacturers and end-consumers of EVs (Ministry of Heavy Industries, 2019). Besides, India aims to achieve the EV30@30 target (i.e., 30% of all new registrations will be EVs by 2030) (Singh et al., 2022). However, despite the support provided by the government, the demand for EVs in India has long been stagnant, with an EV sales share of less than 2% (Agrawal et al., 2020; Kumar et al., 2020).
Therefore, the study aims to assess EV adoption trends and estimate the number of EVs needed to be registered to achieve the desired target, taking a case study of four states, namely, Delhi, Gujarat, Karnataka, and Uttar Pradesh in India.
The paper is structured as follows. The research context is outlined in Introduction section. EV policies of India are outlined in EV Policies section. The background of EV adoption is covered in EV Adoption: Background section. A review of studies that estimated vehicular growth is given in Estimation of Vehicular Growth: Literature Review section. The estimation method adopted in the study is described in Methodology section. Data Collection section describes the data used in the study. The analysis of EV adoption trends in case study states makes up Analysis of EV Adoption section. EV Estimation section comprises the EV estimation results. A discussion on EV adoption patterns and the underlying problems is provided in Results and Discussion section. The study is concluded in Conclusion section.
EV Policies
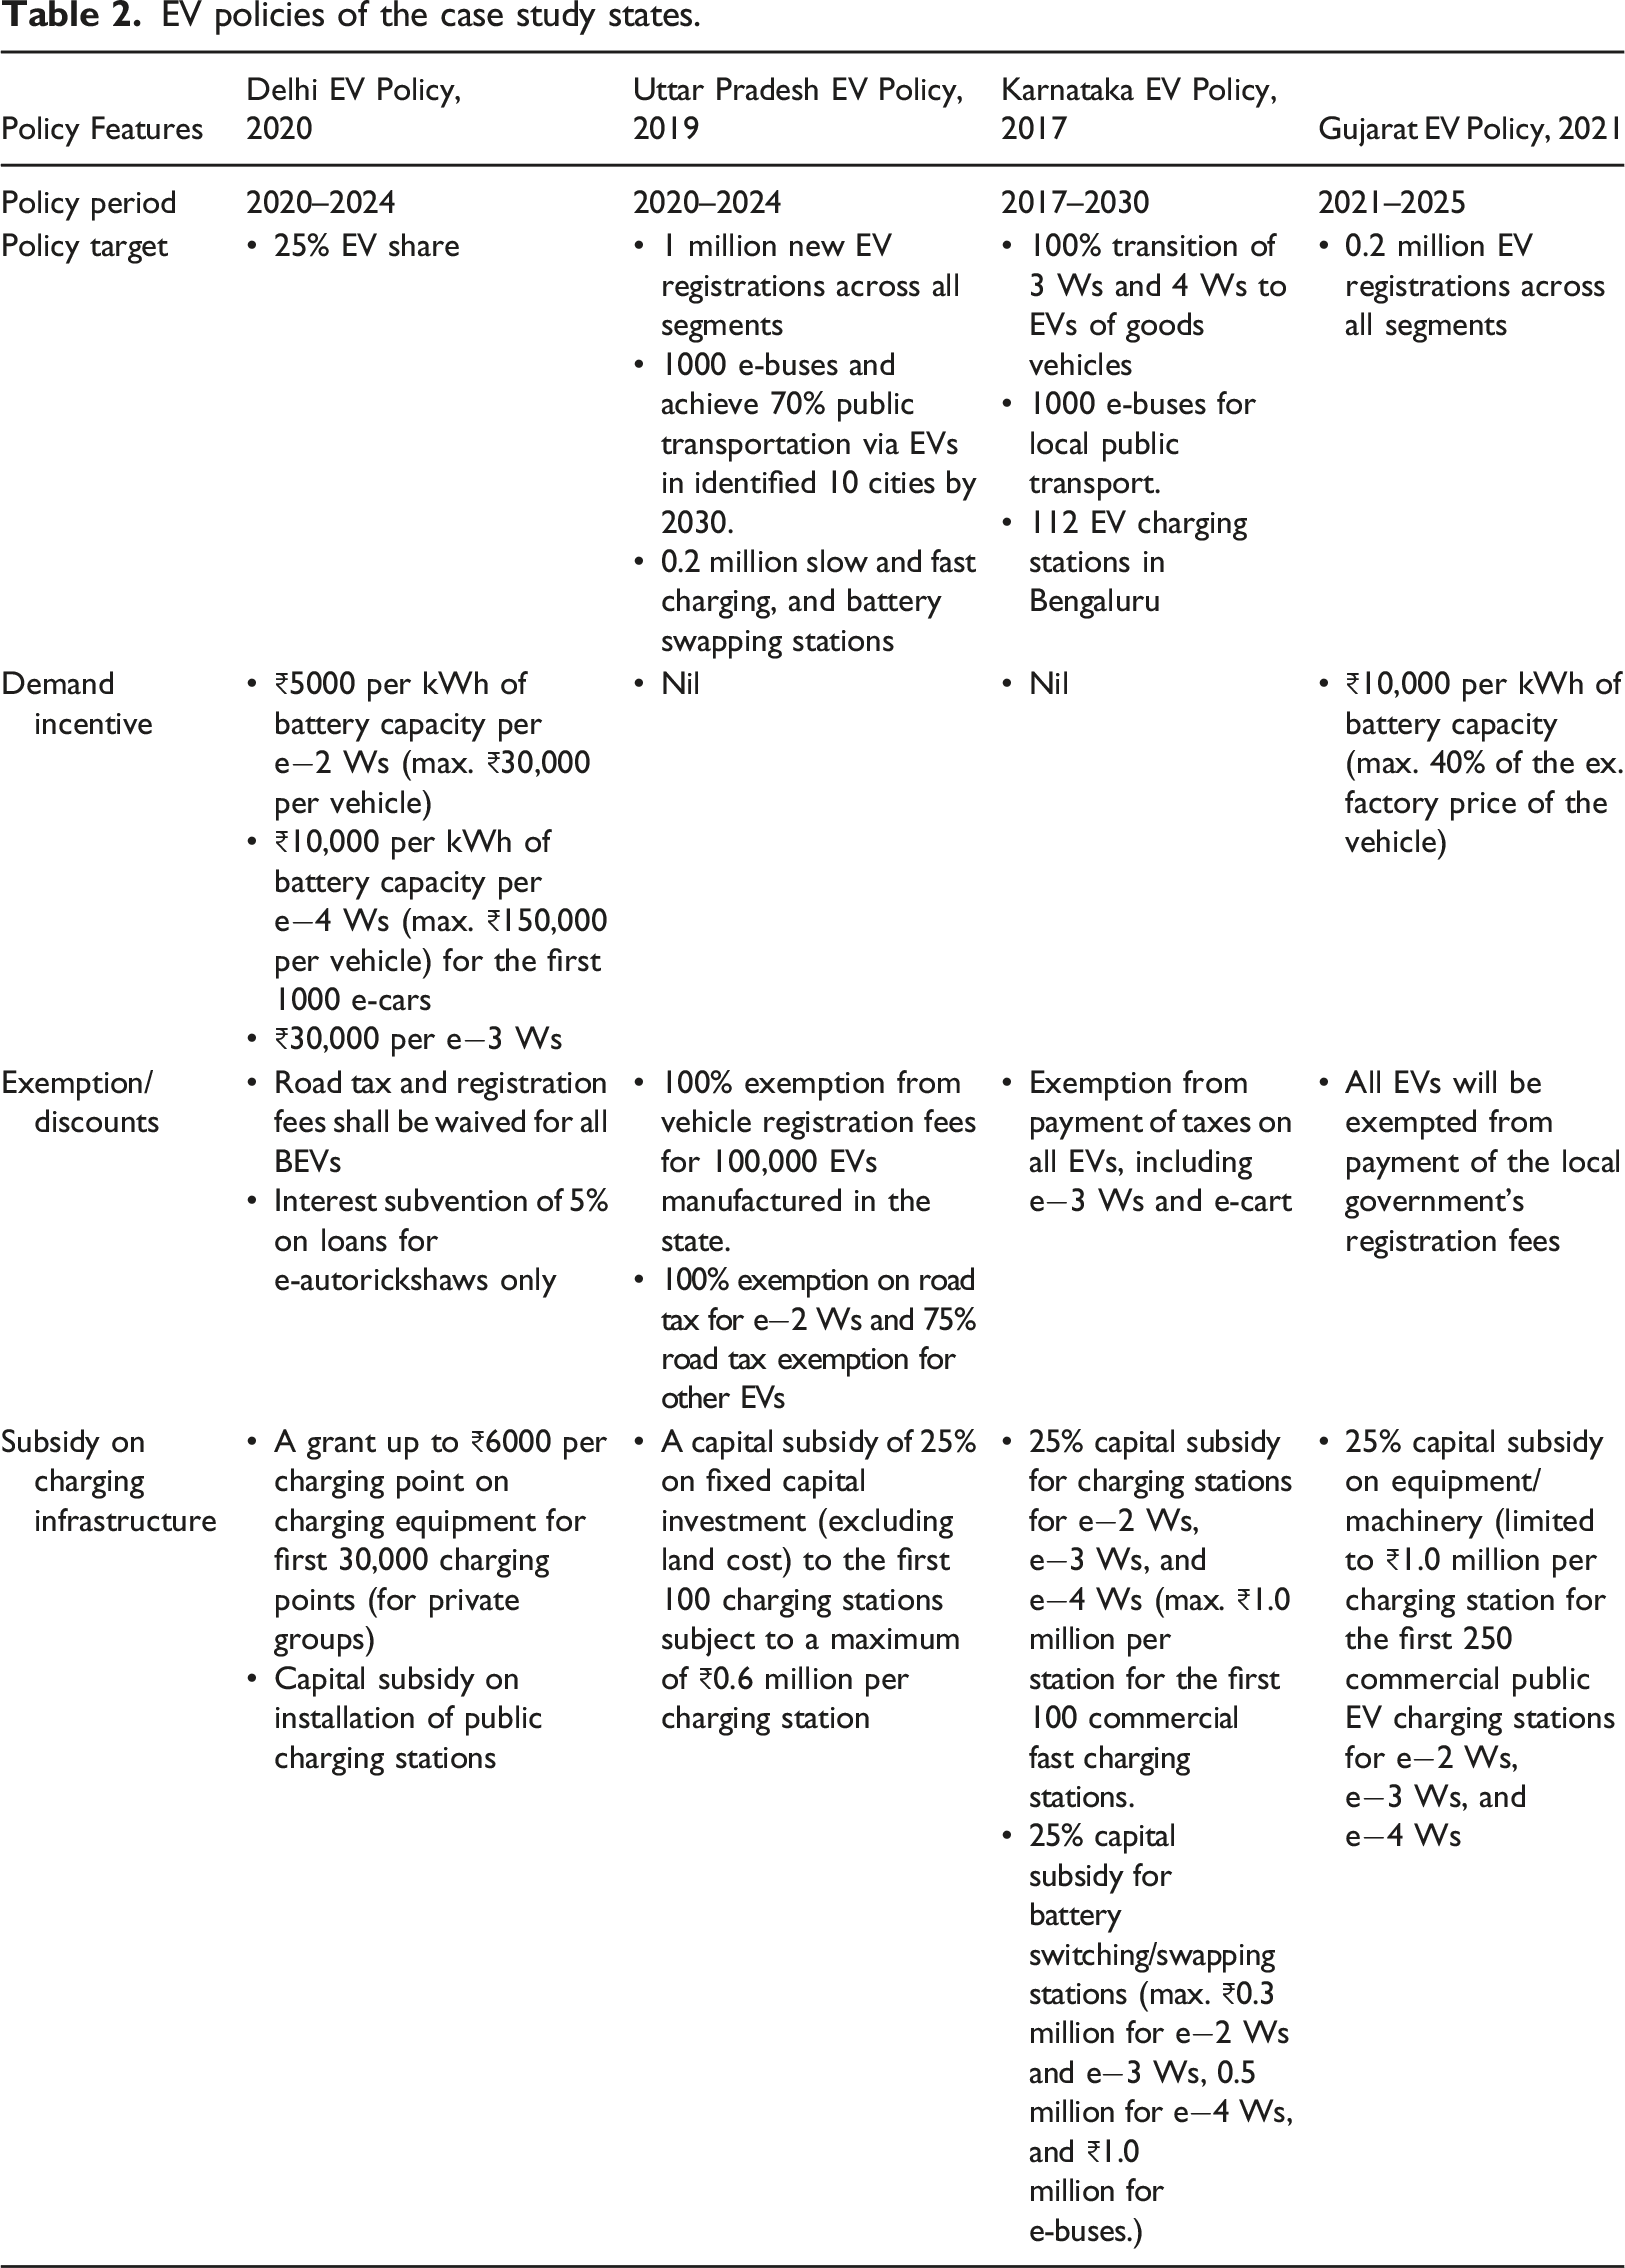
Demand incentives for various vehicle segments.

Note. e−4 Ws include vehicles used for commercial purposes only.
Some of the proposed incentives to support charging infrastructure under FAME are as follows. It is proposed to provide the buyer with one slow charger per e-bus and one fast charger for every ten e-buses. Besides, the funding to cover 100% of the cost of establishing public charging stations for a certain number of charging stations is also provided.
EV policies of the case study states.
EV Adoption: Background
EVs are comparatively new technology, and they are categorised into three groups, namely, battery electric vehicles (BEVs), hybrid electric vehicles (HEVs), and plug-in hybrid electric vehicles (PHEVs). Passenger EVs are adopted in both personal vehicles (e.g., two-wheelers and cars) and commercial vehicles (e.g., taxis and buses) segments. The commercial vehicle segment is the fastest-growing market in the EV industry. For instance, in Western Europe, the number of electric bus registrations increased by three times in 2019 (Sustainable Bus, 2022). This is primarily due to their policies limiting carbon dioxide (CO2) emissions and EV subsidies (Bibra et al., 2021). The adoption of electric buses is also notable in China (Chandak, 2022). This is likely due to significant monetary incentives for EVs and other exemptions, such as free license plate registrations. Apart from commercial EVs, efforts are also being made worldwide to promote personal EVs. In 2020, the number of registered electric cars surpassed 10 million, a 43% increase over 2019 and representing a 1% share globally (Bibra et al., 2021). Notably, two-thirds of the newly registered electric cars were BEVs in 2020.
As discussed in EV Policies section, the Indian Government has offered monetary incentives for buying personal and commercial EVs. Some Indian states have also added e− buses to their public transport operation. However, the rate of EV adoption in India is sluggish (Kumar et al., 2020; Rastogi et al., 2021). The reasons for slow EV adoption in India are being studied. Gujarathi et al. (2018) studied EV adoption in India, and they found the high upfront cost, lack of charging infrastructure, and inadequate availability of skilled manpower as reasons for the low adoption of EVs. Notably, the initial purchase cost across all EVs is higher than for internal combustion engine (ICE) vehicles. 70% of the ICE cars sold in India cost ranging from ₹0.6 million to ₹1.0 million, whereas the purchase cost of an EV car is typically in the range of ₹1.0 million to ₹2.5 million (Jain, 2022).
Goel et al. (2021) studied barriers to EV adoption, and they include - vehicle servicing, purchase cost, consumer perception, raw materials for batteries, the efficiency of the battery, charging time, safety, environmental impacts, electricity tariff policies, barriers related to charging infrastructure and battery recycling. As per (Bhalla et al., 2018; Khalid & Khuman, 2022), environmental concerns and consumer trust in technology are preceding determinants of EV uptake, while factors such as cost, infrastructure, and societal acceptance hinder EV adoption. A study by Rastogi et al. (2021) in Delhi shows that 50% of respondents are willing to adopt EVs. However, the two top concerns of respondents were purchase cost and battery cost, which is similar to the observations by (Varghese et al., 2021).
As discussed above, since India aims to achieve 30% of EV registrations by 2030, it is necessary to estimate the number of EV registrations required to meet the target.
Estimation of Vehicular Growth: Literature Review
Future vehicular growth is typically investigated to understand the impact on oil demand, energy consumption, vehicle emissions and policy formulation. The estimation of vehicular growth is a challenging subject due to the involvement of various factors. Many studies have estimated vehicular growth using various techniques, such as the econometric model, time series analysis using auto-regressive moving average, and growth factor using the Gompertz function. (Jha et al., 2013) used time series analysis and econometric model methods to forecast India’s vehicular growth in the short term. (S & Raj, 2019) used the time-series econometric analysis to analyse the influence of GDP on vehicular growth in India. (Agunbiade & Peter, 2013) used an auto-regressive moving-average approach for forecasting vehicle registration in the short term. Singh et al. (2020) estimated the growth in private vehicles for a long-term period in India, using the Gompertz function and GDP per capita. (Bouachera & Mazraati, 2007) forecasted car ownership using growth models, namely, logistic, quasilogistic, and Gompertz functions for India to estimate fuel demand from 2007 to 2030. (Arora et al., 2011) used the Gompertz function to project the two-wheeler and highway vehicle stock for 2040, which includes automobiles, taxis, three-wheelers, buses, and trucks. It is pertinent to note that econometric modelling and time series analysis methods are used for short-term period estimation, while the other functions are suitable for long-term estimation.
Methodology
The number of passenger vehicle registrations in a country is directly related to that country’s economic growth (Sharma et al., 2011). The nature of the above relationship depends on the per capita income and the time period of analysis. For instance, as per United Nations’ Report (2014), this relationship follows an S-shaped curve for a long period (e.g., 50 years), especially for developed nations, such as the USA and France, where the per capita income and growth in income have been very high (Mayer, 2013). The ‘S-shaped curve implies that vehicle ownership increases slowly at the lowest income levels, then more rapidly as income rises, and finally slows down as saturation is approached (Dargay et al., 2007; Wu et al., 2014). Further, the report also indicates that the relationship tends to be linear in the case of developing countries (e.g., India), where the per capita income and the income growth are meagre. It is likely to remain linear for a long time, as the growth in income levels in such countries may not catch up with levels typical in advanced economies. Singh et al. (2020) also found that the relationship between GDPs per capita and vehicular registration in India is linear based on historical data of 45 years. The present study also found a good linear relationship between past vehicular registrations and NSDP (see EV Policies section) for the data spanning from 2012 to 2021. One of the probable reasons for the linear relationship is the low vehicle ownership rate in India compared to developed countries, such as the USA. It is noted that the motor vehicle ownership rate in India was 225 vehicles per 1000 individuals in 2019, compared to 837 vehicles in the USA in 2018 (Statista, 2018). It indicates that India will take a long time to reach the saturation stage for vehicle ownership. The linearity of the vehicular registration data can be modelled using an econometric modelling method (i.e., growth factors based on the elasticity of transport demand) (IRC, 2015).
This study aims to estimate the number of year-on-year (Y-O-Y) EV registrations needed to achieve the target of 30% of all new passenger vehicle registrations by 2030–2031. To estimate the same, the annual number of new passenger vehicle registrations till 2030 is required to be forecasted. In the present study, the estimation of annual new vehicle registrations in the segment of 2 Ws, 3 Ws, 4 Ws, and buses has been carried out using an econometric model considering the goodness of fit of the past data. The econometric model below provides elasticity of transport demand, considering NSDP a dependent parameter. The adopted econometric model has been taken from IRC 108:2015 (IRC, 2015) and is as follows.

Data Collection
The four case study states were chosen for the following reasons. Delhi, the nation’s capital, appeared to be leading the electric mobility effort; Uttar Pradesh, the most populous state in the country, was naturally expected to have EV penetration. Gujarat and Karnataka are industrial hubs, each with sizeable cities, including Ahmedabad and Bangalore.
The data used in this study have been obtained from government databases, such as the Vahan database, maintained by the Indian Ministry of Road Transport and Highways, and from the Handbook of Statistics on the Indian States, maintained by the Reserve Bank of India (Reserve Bank of India, 2021). The data about the number of motor vehicles registered in various states of India were obtained from the Vahan database. The Vahan database provides flexibility regarding downloadable vehicular registration data for various parameters (Vahan Dashboard, 2021). For this study, the vehicular registration data by fuel type and vehicle category were extracted for nine FYs (2012–2021). Passenger vehicles considered in this study comprise 2 Ws, 4 Ws (including taxis), 3 Ws, and buses. The NSDP data were obtained from the Handbook of Statistics on the Indian States. Vehicle registrations by state.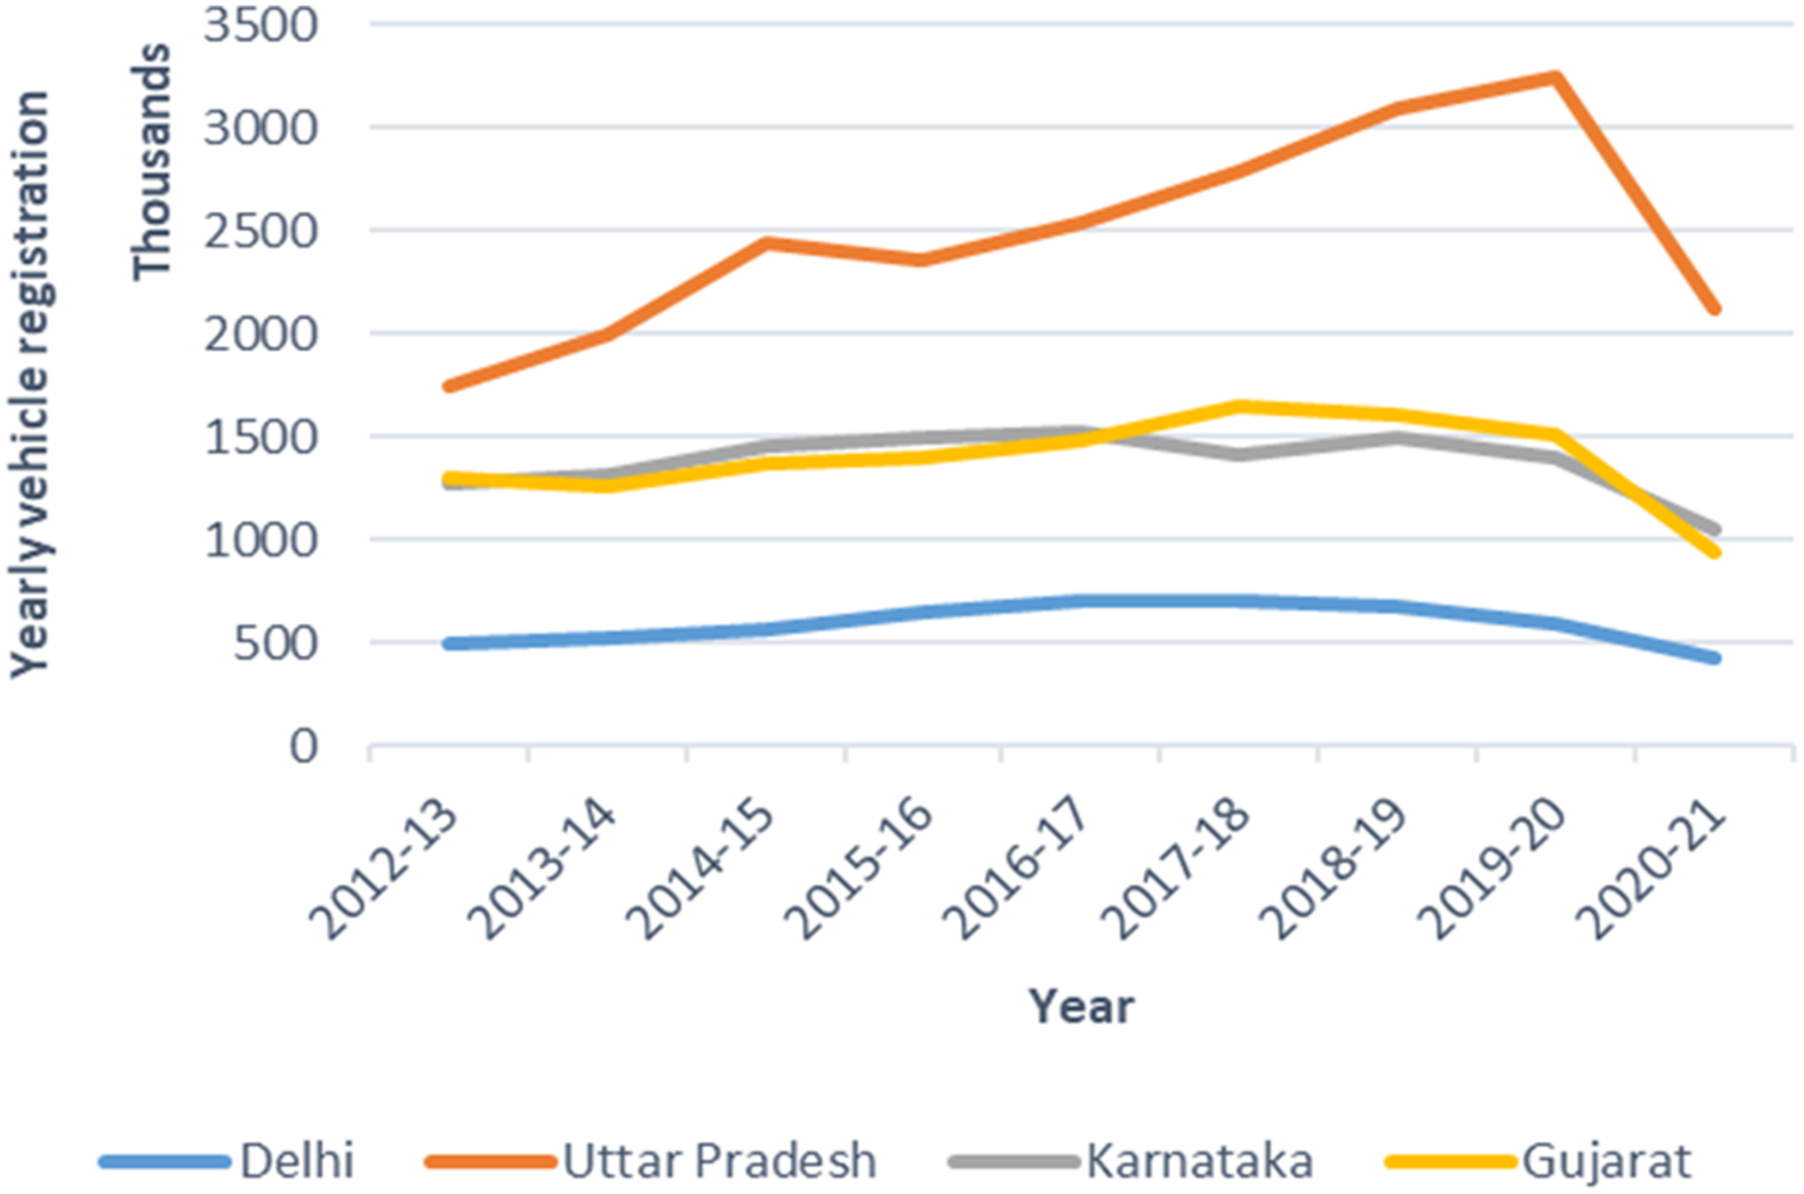
Analysis of EV Adoption
The analysis includes EVs’ adoption pattern, growth trends, and composition for the four case study states.
Passenger Vehicle Registration Trend
The Y-O-Y registrations of total passenger vehicles are shown in Figure 2. It indicates that the number of passenger vehicle registrations has been increasing in all four states till FY 2019–2020. However, a declining trend has been observed during FY 2020–2021, perhaps due to COVID-19. The average number of vehicles registered per FY during the 2012–2021 period for Delhi, Uttar Pradesh, Karnataka and Gujarat was 591,526; 2,479,416; 1,380,664; and 1,392,202, respectively. EV registrations by state.
CAGR of vehicles (%).

Passenger EV Registration Trend
The total number of EVs registered in the study states during FY 2012–2021 is shown in Figure 3. During the study period, the total EV registrations in Delhi, Uttar Pradesh, Karnataka and Gujarat were 98,800; 207,765; 39,570; and 3,188, respectively. EV registrations by state.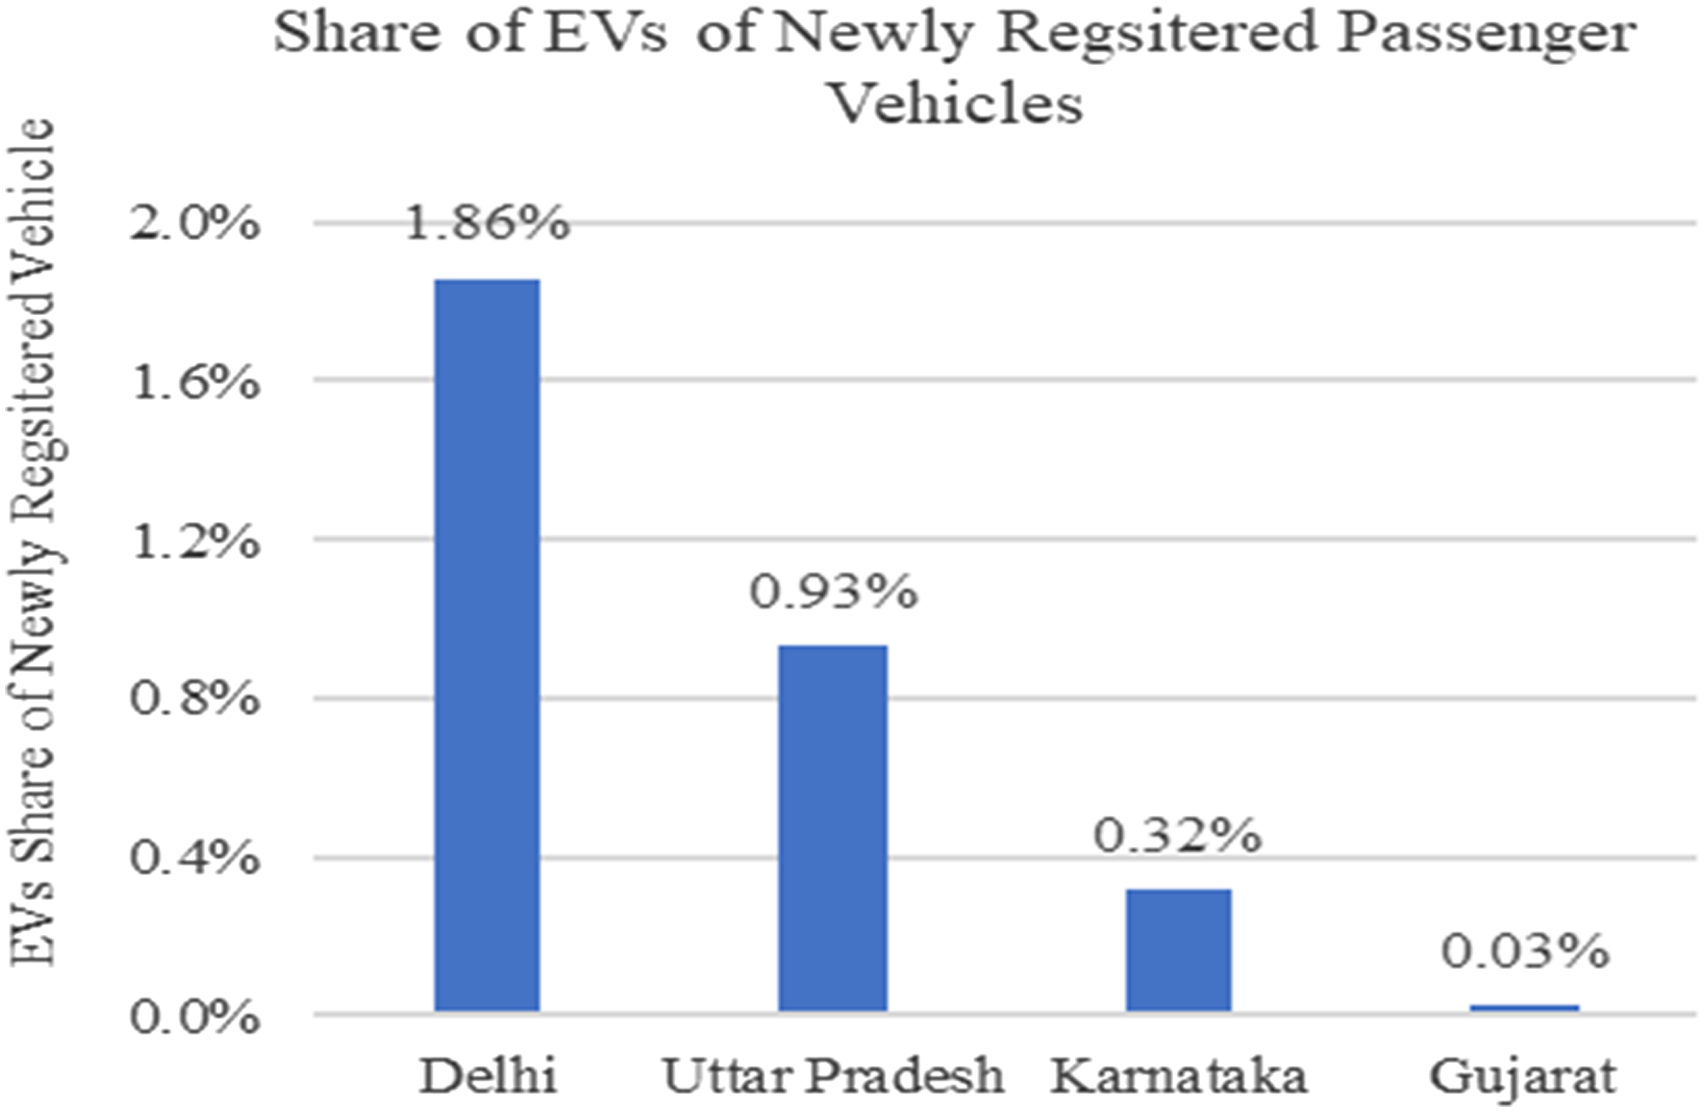
On an annual basis, the average number of EVs registered during FY 2012–2021 in Delhi, Uttar Pradesh, Karnataka, and Gujarat were only 10,981, 23,085, 4,397, and 354 passenger vehicles, respectively. This indicates that Delhi had the highest EV percentage at about 1.9%, followed by Uttar Pradesh, Karnataka, and Gujarat, as shown in Figure 4. It is important to note that Gujarat’s EV share was only 0.03%. EV registrations by state.
The average share of each passenger EV in total EV registration during the study period (FY 2012–2021) is shown in Figure 5. It indicates that the proportion of e−3 Ws (around 95%) dominated the EV share in Delhi and Uttar Pradesh, possibly due to an increase in e−3W registrations following the implementation of FAME II subsidies. The e−2 Ws led the EV share in Karnataka and Gujarat, with a proportion of 56% and 70%, respectively. The share of e−4 Ws is low in all four states. Notably, Gujarat has been dominating in e-bus registrations. Typical relation between registrations and NSDP.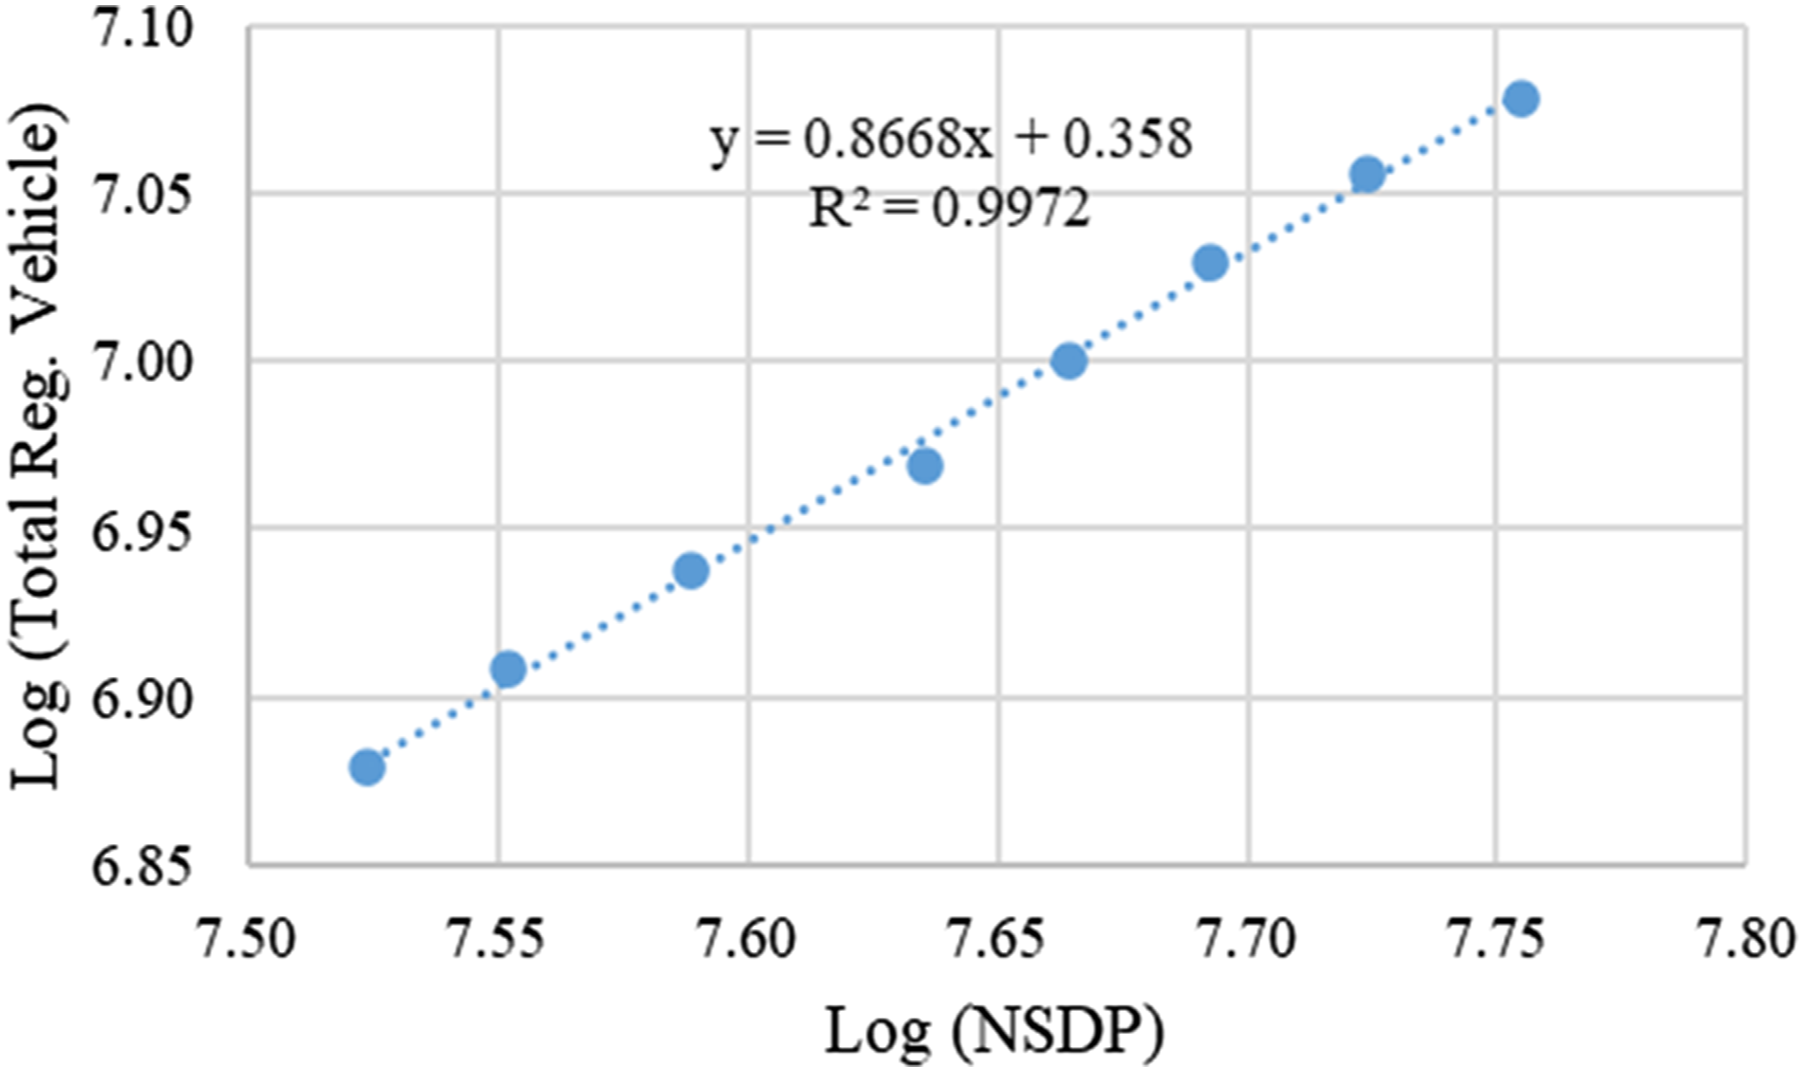
EV Estimation
As discussed above, India aims to achieve 30% EV registrations of the total new vehicle registrations by 2030. Similarly, states have set targets for EV registrations (see EV Policies section). For example, Delhi aims for 25% of newly registered vehicles to be EVs by 2024, and Uttar Pradesh seeks to achieve 70% electrification of public transportation by 2030. An attempt has been made to estimate the number of EV registrations needed to reach the 30% mark in FY 2030-2031 based on annual new passenger vehicle registrations. The new vehicle registrations, in the segment of 2 Ws, 4 Ws, 3 Ws, and buses, have been estimated using an econometric model, as discussed in Methodology section.
The econometric model provides elasticity of vehicle demand based on a relationship between the number of vehicle registrations and the NSDP, as shown in Figure 6, for example, for Delhi.
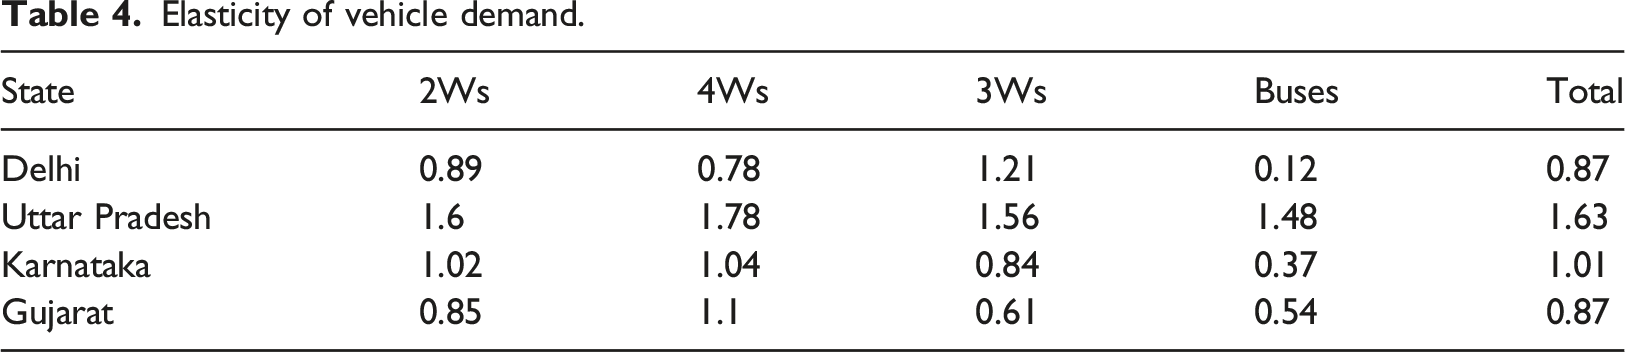
In this context, the term ‘elasticity of vehicle demand’ refers to the relationship between the percentage change in the number of vehicles and the percentage change in socioeconomic factors, such as NSDP.
Elasticity of vehicle demand.
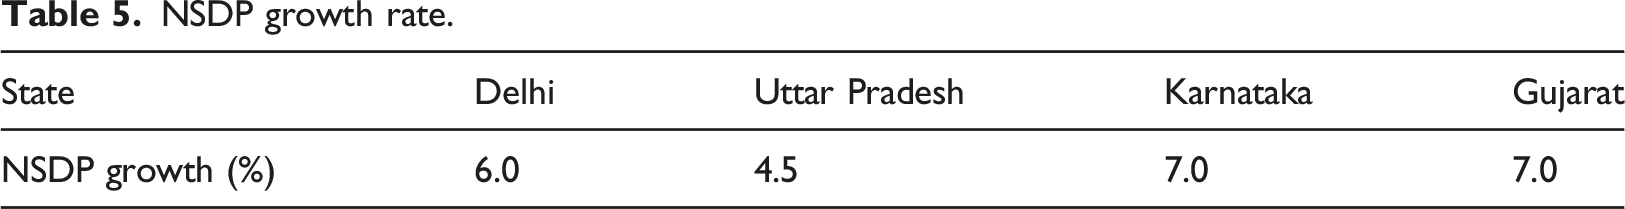
NSDP growth rate.
Est. annual growth of vehicles during FYs 2021 – 2030 (%).

Est. number of new registrations (FY 2030 – 2031).

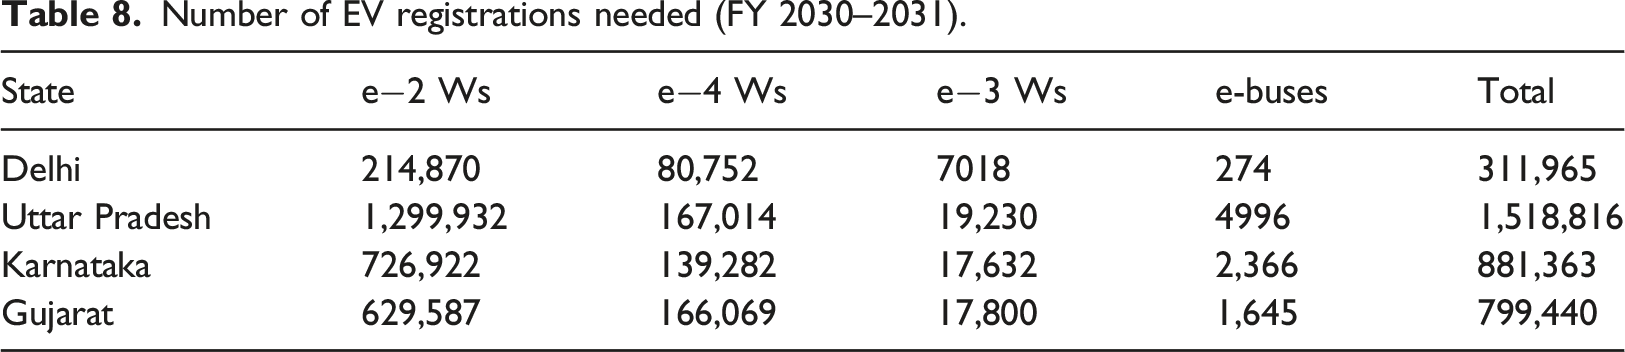
Number of EV registrations needed (FY 2030–2031).
Results and Discussion
An estimation of EV registrations needed to reach 30% share has been carried out. It indicates that Delhi will need to register over 0.31 million EVs in the FY 2030–2031. However, only 98,828 EV registrations in e−2 Ws, e−4 Ws, e−3 Ws, and e-buses took place by the end of FY 2020–2021. Noteworthy among these EVs are about 92,398 e-rickshaws. It is estimated that Uttar Pradesh would need to register about 1.51 million EVs in the FY 2030–2031. On the contrary, by the end of the FY 2020–2021, only 0.2 million EVs were registered, including e−2 Ws, e−4 Ws, e−3 Ws, and e-buses. It is noted that 0.19 million of those 0.2 million EVs were e-rickshaws only. In the case of Karnataka, 0.88 million EVs will need to be registered in FY 2030–2031. However, only 22,290 EVs had been registered in Karnataka by the end of FY 2020–2021. Gujarat had just 3188 registered EVs by the end of FY 2020–2021, which will have to be about 0.79 million in the FY 2030–2031. In all four states, a considerable gap prevails in existing EV registrations and the number of EV registrations needed to reach 30% share. To enhance EV adoption and achieve the objectives stated by the government, each study state will, therefore, need to work on the underlying problems, which are covered below.
The upfront costs, battery replacement costs, lack of charging infrastructure, range anxiety, and associated limitations are some of the obstacles to EV adoption in India, including in the four study states. All EV vehicle segments have greater initial purchase costs than ICE vehicles. For instance, 70% of ICE 4 Ws (cars) sold in India cost between ₹0.6 million and ₹1 million, but the price range for e−4 Ws (cars) is between ₹1.0 million and ₹2.5 million (Jain, 2022). Similarly, the ex-showroom price (in December 2022) of ICE 2 Ws ranges from around ₹70,000 to ₹120,000. However, the cost of e−2 Ws ranges between ₹110,000 and ₹170,000 (Rokadiya et al., 2021).
The share of the battery cost for EVs is around 40%–50% of the vehicle cost (Economic Times, 2022), and it is primarily governed by the global market, as the raw materials for batteries are imported from other countries, e.g., China. Although the battery costs have reduced substantially in recent years (e.g., from 917 USD per kWh in 2010 to 137 USD per kWh in 2020), it is still on the higher side from the Indian affordability point of view. The limited battery life and their replacement costs are other challenges in increasing EV registrations. For instance, the batteries may need to be replaced after around 0.16 million km of service for e−4 Ws (EDF Energy, 2022) and 80,000 km for e−2 Ws (Wangchuk, 2019). The useful life of vehicles could be 15 years or more. In contrast to this, the service life of batteries used in EVs is typically in the range of 6–10 years (Financial Express, 2021). Hence, the EV user will need to get the battery replaced at least once during the service life of a vehicle. Another reason for slow adoption of EVs is lack of EV charging infrastructure, which provides the same level of convenience as petrol pumps provide to ICE vehicles. A network of accessible and affordable charging stations may lead to EV uptake.
It is important to consider initiatives taken by other countries to facilitate EV adoption. China, Canada, and the U.S. adopted regulatory interventions like the zero-emission vehicle mandate, which turned out to be successful in increasing the EV uptake. Korea adopted non-economic incentives, such as waivers from traffic management restrictions, lower toll charges or public parking fees, which increased the value proposition of EVs. Moreover, it is essential to scale up the public procurement programme for e-buses, as observed in China and European countries.
Policies have provided incentives mainly for demand generation and charging infrastructure development to support EV uptake. However, these incentives alone do not increase EV adoption. The focus should be on the development of the ecosystem for EVs that includes the availability of vehicles at an affordable price, low maintenance costs, and easy access to fuel from the user’s point of view. The ecosystem shall also cover the land and energy requirement for the charging infrastructure, the skills needed to support repair and maintenance and handling of any mishaps, in addition to the reuse and recycling of EV batteries. The whole EV ecosystem may help build the confidence of potential EV users.
Conclusion
Most Indian metropolitan cities face transportation problems such as GHG emissions, air pollution, and excessive transportation expenses on account of ICE vehicles in cities. The government emphasizes encouraging electric mobility to reduce the adverse effects of ICE vehicles, and initiatives are being taken to encourage the adoption of EVs through various policies at the state and national levels. Using the case studies of Delhi, Uttar Pradesh, Karnataka, and Gujarat, this study estimated passenger EV registrations needed to meet the EV30@30 target. Based on secondary data, the trend of both ICE and EV registrations were assessed. It is found that EV adoption has been very slow despite the governments’ pushing for it. The average annual share of EVs registered was less than 2% in Delhi, less than 1% in Uttar Pradesh, and less than 0.5% in Karnataka and Gujarat, compared to newly registered vehicles during 2012–2021. It is important to note that e-rickshaws contributed significantly to EV shares in Delhi and Uttar Pradesh, while the shares of other modes were negligible. However, the share of e−2 Ws is significantly higher than other vehicles in Gujarat and Karnataka. According to EV estimates, Delhi, Uttar Pradesh, Karnataka and Gujarat, will need to register over 0.31 million, 1.51 million, 0.88 million, and 0.79 million EVs, respectively, in FY 2030–2031 to meet the EV30@30 target.
High upfront costs, battery replacement costs, a lack of private and public charging infrastructure, range anxiety, and limited access to domestic charging points are likely the main causes of the slow adoption of EVs. To achieve the target, these issues need to be addressed in time. The reduction in the battery cost may lead to reduced upfront EV costs. The challenge of charging infrastructure can be dealt with by developing fast public charging stations. The widespread deployment of public charging stations will aid consumers in overcoming range anxiety and encourage them to switch to EVs.
Delhi’s EV programme includes financial incentives on purchase of EVs. In Gujarat, there was no EV policy before 2021; after that year, an EV policy with financial incentives was put into place, and EV adoption has since risen. Karnataka and Uttar Pradesh may consider offering financial incentives to end consumers. According to experience worldwide, regulations for zero-emission vehicles, non-financial incentives (such as free parking for EVs in public places), improving public procurement of e-buses, and changing building bye-laws have all led to an increase in EV uptake. The rising use of EVs is projected to bring various difficulties, including a significant increase in urban energy needs and many retired EV batteries. To increase EV adoption, a comprehensive EV ecosystem must be developed.
Future studies may also consider commercial vehicles in addition to passenger vehicles, using other suitable approaches of estimation.
Footnotes
Declaration of Conflicting Interests
The author(s) declared no potential conflicts of interest with respect to the research, authorship, and/or publication of this article.
Funding
The author(s) received no financial support for the research, authorship, and/or publication of this article.