



Abstract
Since the 1990s, different reforms have been implemented in the electricity sector of many Latin American countries. Those embraced vertical disintegration, privatization, and the introduction of incentive regulation, while vertically integrated public monopolies prevailed in other Latin American countries. We explore the technology of the electricity distribution sector in Latin America to analyze productive efficiency. We use a parametric stochastic distance function which includes controls, companies’ features, private versus public property, vertically integrated versus unbundled sectors, and the regulatory model which defines the pitch, among others. The focus is on the distribution segment within the electricity industry. We examined a sample of 73 electricity distribution companies from 9 countries over 14 years and found a 70% average efficiency. This study differs from the preceding literature (discussed extensively) because: (1) it encompasses several Latin American countries (while most existent studies focus on national cases); (2) it uses a specially developed database, which standardizes variables and covers longer periods than preceding studies to employ econometric estimation techniques; (3) it addresses various aspects of the efficiency discussion. The results reveal differences in efficiency scores (being the unit an indication of full efficiency) by regulatory regime, with the best average results for Reference Firms (0.74) concerning Price Cap (0.66) and Cost-Plus (0.71). Private companies show higher average efficiency levels (0.72) than public ones (0.66). Vertically integrated monopolies, on average, behave poorly in efficiency comparative terms (0.46 versus 0.71 of unbundled firms). Nevertheless, the quantitative differences are not overwhelming, except in the last case.
Introduction
Over the last 40 years, technological change enabled the electricity sector worldwide to shift from a vertically integrated monopoly to a vertically disintegrated sector, where some stages remained natural monopolies while others became competitive. During the same period, regulation practices evolved from the Cost-Plus paradigm to incentive-based forms. Latin American countries experienced a transformation in their electricity sector with heterogeneous trajectories and results: the current landscape is mixed, from vertically integrated state-owned monopolies to privatized vertically disintegrated sectors. The sector is experiencing a new wave of changes related to smart grids (Ferro et al., 2023).
Our motivation is to evaluate, using the highest-quality data and sound empirical techniques, how the reforms impacted the efficiency of the electricity distribution sectors of Latin American countries. Reforms promised gains in efficiency, we have many years of reforms, where the countries and the sectors were subject to several exogenous shocks, and where the differences between countries’ style of reform (including not reform at all) allow us to answer some questions on comparative performance. It means analyzing differences in efficiency between countries with different reform paths, made at different times, with diverse intensity, where the disparate regulatory treatment and degree of vertical integration provides variability in the results to be studied.
The results we arrive at should not be interpreted as a predictive model or normative advice on the superiority of one regulatory regime over others. Instead, they provide elements to analyze comparative results, providing more detailed explanations of the causes of the effects we detected.
A study of this nature should be humble in its reach and recognize that some interesting questions would be unanswered. For instance, the contribution of these sectors to the general competitiveness of the economies is an open question, and our study is beyond its reach. Also, the impact of all the shocks in the countries studied over quite a long period is difficult to trace: Brazil experienced outages, Argentina tariff freezing, and in some countries, political winds determined more or less impulse to reforms and counter reforms. Institutions are not all alike in these countries. It is too ambitious to examine all these facts in a single study. Thus, our perimeter limits the analysis to comparative efficiency, trying to trace the influence of regulatory regimes and vertical integration in the process, and leaving idiosyncratic institutions to be grasped in an aggregate fashion as country effects.
In economics, technology is the set of efficient available techniques; techniques are combinations of inputs that yield certain outputs, and efficient techniques reach more output given the inputs. Thus, an efficiency gain consists of producing more output with the same inputs or the same output with less input usage, and technical change (improvement) means finding ways to save inputs given the output or increase output given the inputs. Technical efficiency does not necessarily mean economic efficiency, since the latter dimension also considers the cost of inputs saved or the prices of the outputs (Coelli & Perelman, 2001).
Efficiency measurement is helpful for many reasons: for policy assessment and management decisions, for academics and practitioners, for accountability concerns, and for policy evaluation. Frontier studies, which we examine, provide comprehensive and more complete measures than partial productivity or average cost ratios.
We explore the technology of the electricity distribution sector in Latin America to analyze productive efficiency. In so doing, we employ a parametric distance function, which allows us to distinguish between efficiency evolution over time and technical change and to identify specifics by treating them as “environmental” (contextual) variables in the estimates. The focus is on the distribution segment within the electricity industry.
We aim to answer: (1) Which average technical efficiency was attained by electricity distributors in the Latin American region during 2003-2016? (2) What are the main drivers? (3) Was there any measurable technical change in the sector over the period (frontier shift)? Was there any shift towards the frontier? (4) Under which regulatory regimes were the distributors more efficient? Moreover, (5) How did the efficiency differ among the firms’ characteristics (vertical integration, property)?
Our sample encompasses 2003-2016, for 73 distributors, 951 observations from 9 countries (Argentina, Brazil, Chile, Ecuador, El Salvador, Mexico, Paraguay, Peru, and Uruguay) in a slightly unbalanced panel (because of some missing data). We employ a parametric approach by estimating a distance function to answer our questions. Parametric, especially Stochastic Frontier Analysis, and non-parametric, mainly Data Envelopment Analysis (DEA), are the most common frontier approaches to studying relative efficiency.
This study differs from the preceding literature (discussed extensively) because: (1) it encompasses several Latin American countries (while most existent studies focus on national cases); (2) it uses a specially developed database, which standardizes variables from different sources, and covers more extended periods than preceding studies to employ econometric estimation techniques; (3) it addresses various aspects of the efficiency discussion (its drivers, differences in efficiency owing to private versus public property, disintegrated versus vertically integrated sectors, traditional versus incentive regulations, dense versus sparse networks, etc.).
We intended to build a statistical series of quality indexes (such as SAIDI, SAIFI, CAIDI, et cetera) to explore the incidence of quality regulation on efficiency. However, the limited scope and heterogeneity of the data would significantly limit the geographical reach and sample size, so we left this discussion for future research and limited our analysis to comparative efficiency. However, within our sample, we had a variable to assess indirectly quality: technical losses, correlated to the state of the infrastructure and CAPEX. In the same vein, tariff evolution during the analysis period posed another difficulty level, and we also decided to leave its analysis for further research.
The results reveal differences in efficiency scores (being the unit an indication of full efficiency) by regulatory regime, with the best average results for Reference Firms (0.74) concerning Price Cap (0.66) and Cost-Plus (0.71). Private companies show higher average efficiency levels (0.72) than public ones (0.66). Vertically integrated monopolies, on average, behave poorly in efficiency comparative terms (0.46 versus 0.71 of unbundled firms). Nevertheless, the quantitative differences are not overwhelming, except in the last case.
After this Introduction, the following section summarizes the empirical literature on technical efficiency and provides some context about the electricity distribution systems that integrate the sample. The next section discusses the estimation method, presents the estimated model, and describes and analyzes data. The antepenultimate section discusses the results and the final section concludes.
Empirical Literature Review and Context of the Investigation
The “textbook model” of the 1990s reform comprehends (1) the corporatization and even privatization of state-owned utilities; (2) the liberalization or deregulation in power generation and retail sectors; (3) the unbundling or vertical separation of the main segments; (4) the introduction of incentive-based regulation, and (5) the establishment of an independent regulatory agency (Jamasb et al., 2015). Formal regulations in the region have historically been designed based on best practices, mainly of the United States and the United Kingdom. Implemented regulations were adapted to the local economic and institutional context and political will. The result is that some regimes are mixed, each with a certain edge between formal and effective regulations (Estache & Serebrisky, 2020).
Electricity distribution is a capital-intensive industry, dimensioned for consumption peaks since energy is hardly stored with the current technology (Newbery, 2002). It presents scale and scope economies (Llona, 1999), shows cost subadditivity (Arias & Cadavid, 2004), and network externalities since some central dispatch coordination, interconnection, and standardization are necessary. In addition, it is a natural monopoly. For these reasons, electricity distribution is a regulated industry. Governments created independent regulatory agencies to address the potentially disruptive effect that political opportunism could have on investment and concentrate valuable specialized knowledge and information processing capabilities to overcome information asymmetries that benefit operators (Castaneda et al., 2014). De Halleux et al. (2018) match country-specific performance and governance characteristics to take stock of earlier governance reforms’ outcomes. Countries differ in whether they still have a vertically integrated provider, create an independent regulator, rely on privatization, or opt for wholesale markets.
Regional Context of the Investigation
Comparison of the Electricity Distribution Sector Sampled in Each Country
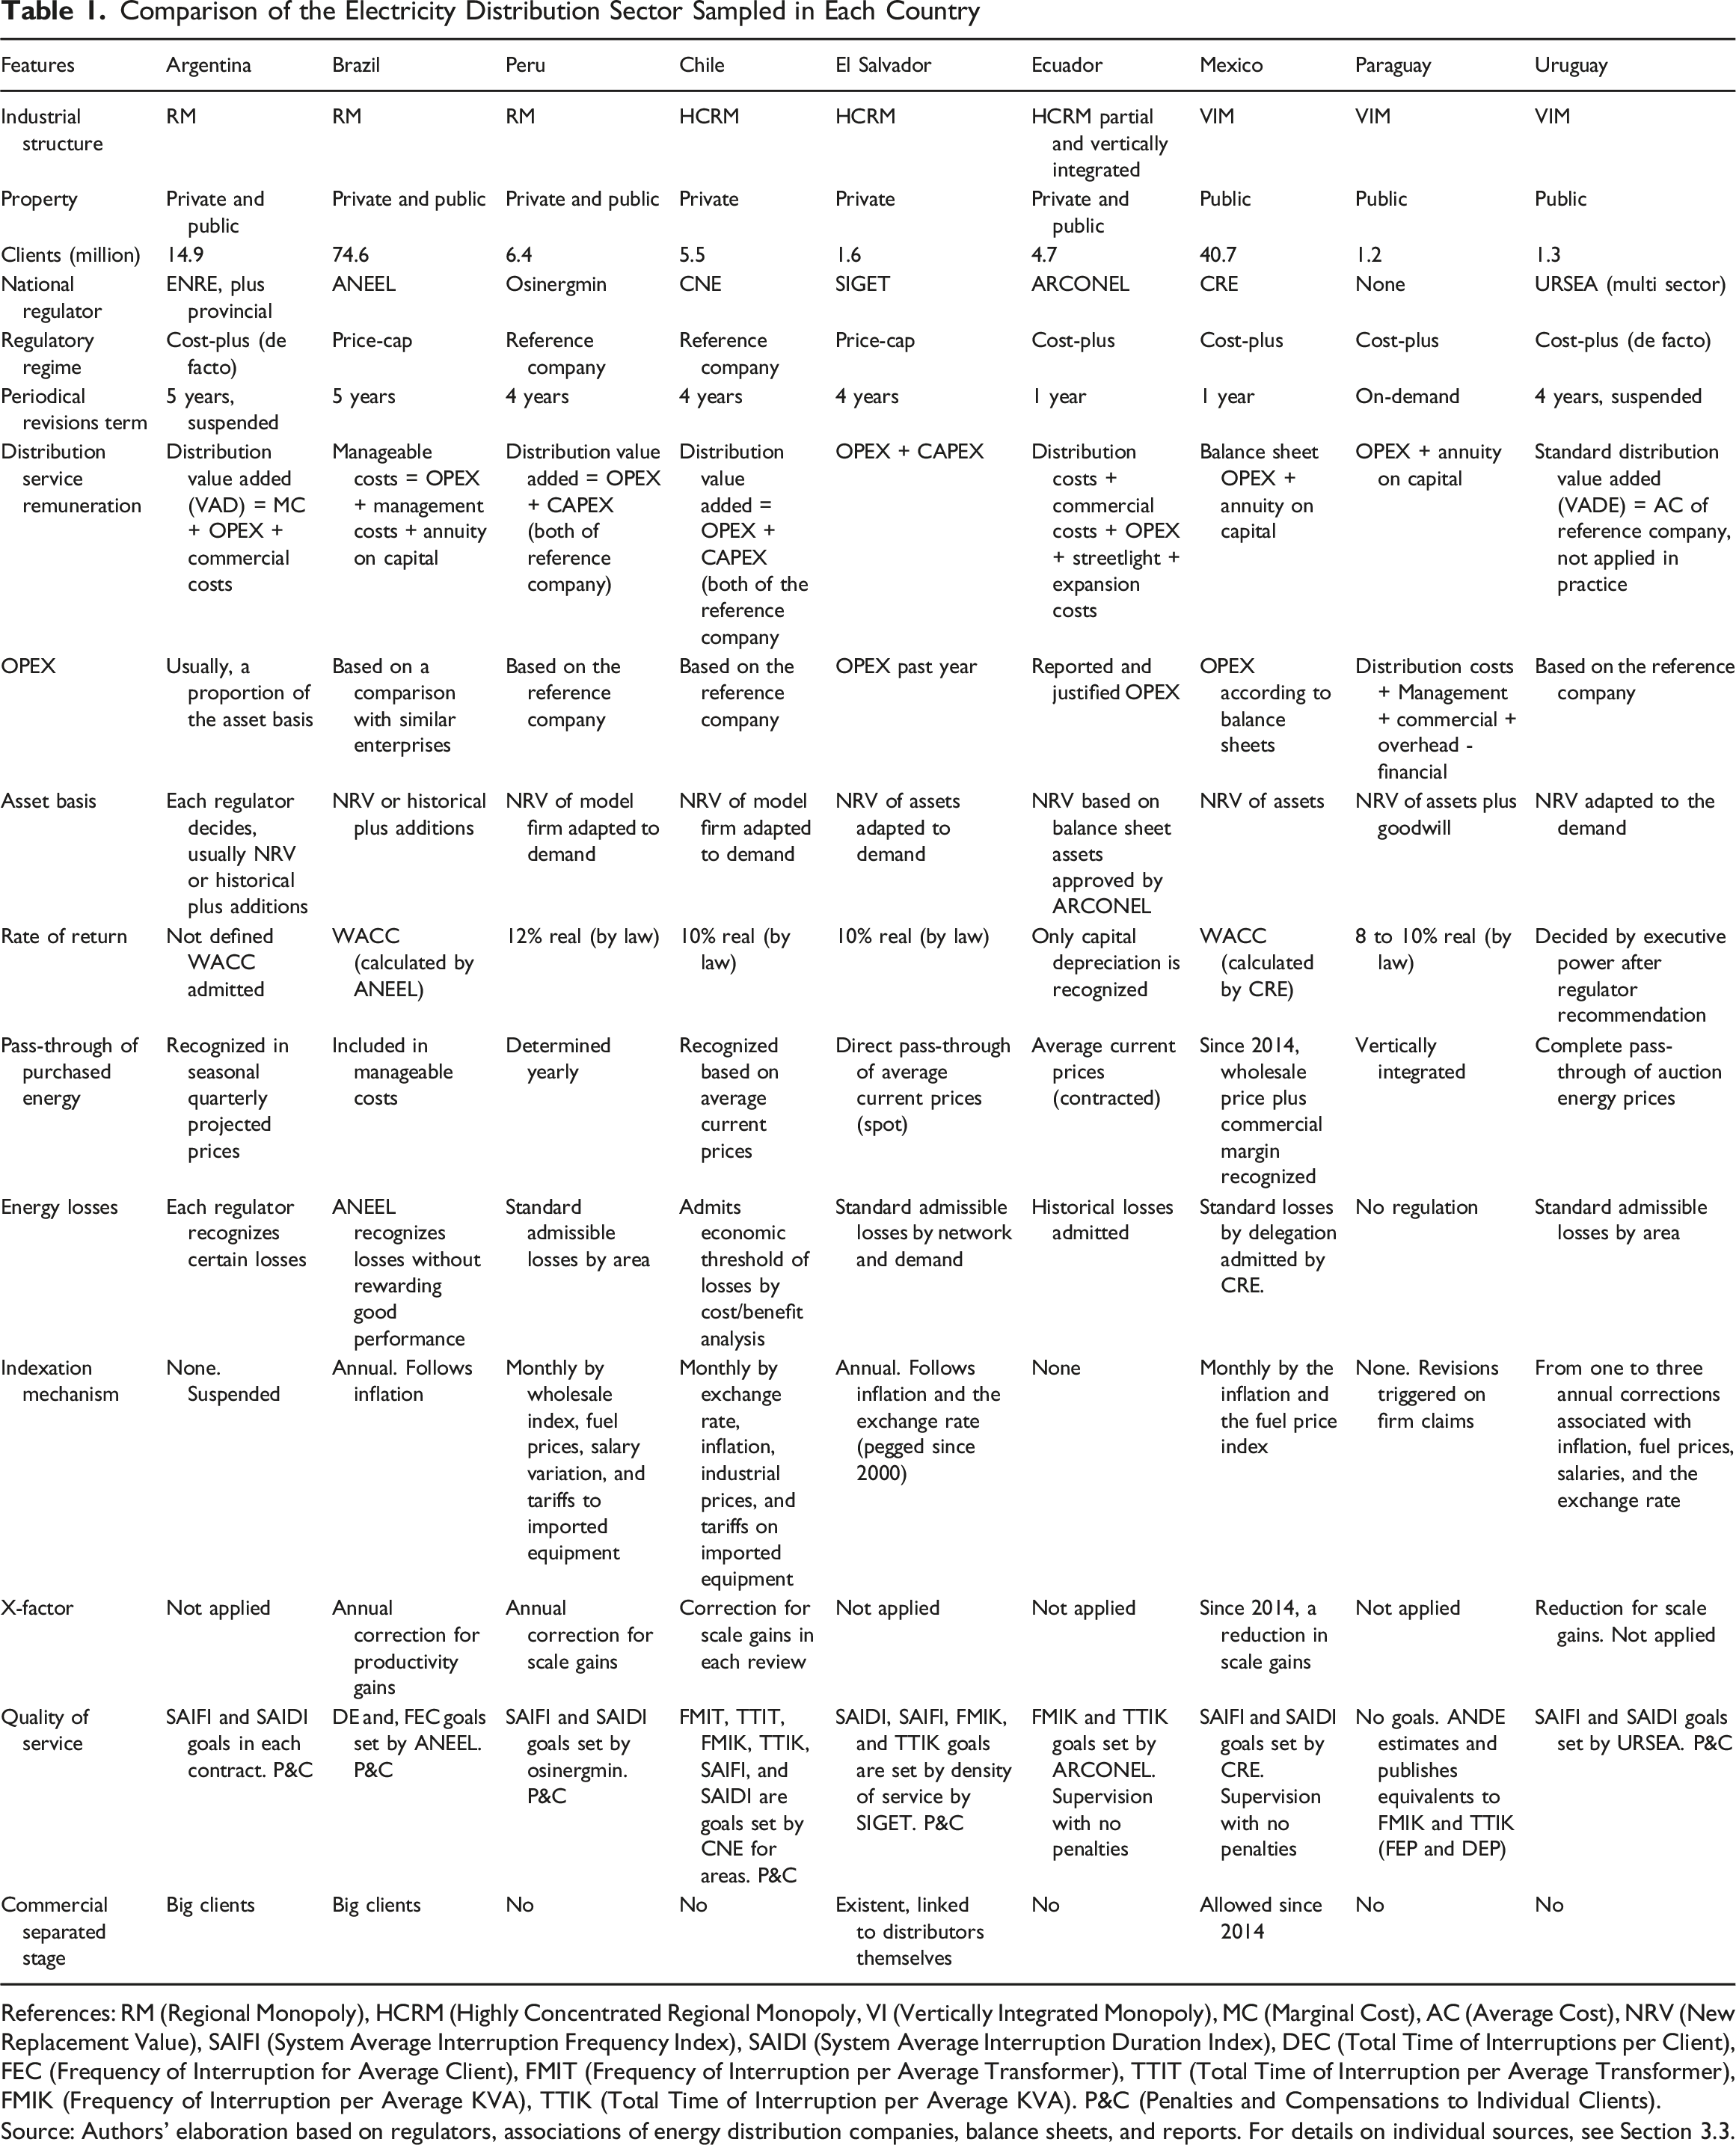
References: RM (Regional Monopoly), HCRM (Highly Concentrated Regional Monopoly, VI (Vertically Integrated Monopoly), MC (Marginal Cost), AC (Average Cost), NRV (New Replacement Value), SAIFI (System Average Interruption Frequency Index), SAIDI (System Average Interruption Duration Index), DEC (Total Time of Interruptions per Client), FEC (Frequency of Interruption for Average Client), FMIT (Frequency of Interruption per Average Transformer), TTIT (Total Time of Interruption per Average Transformer), FMIK (Frequency of Interruption per Average KVA), TTIK (Total Time of Interruption per Average KVA). P&C (Penalties and Compensations to Individual Clients).
Source: Authors’ elaboration based on regulators, associations of energy distribution companies, balance sheets, and reports. For details on individual sources, see Section 3.3.
As Sappington and Weisman (2016) state, regulated firms often object to Cost-Plus because “it provides a little reward for exceptional performance and can invite regulatory micromanagement of its activities”. Alternative regimes are included under the label performance-based or incentive regulation. Price-Cap is the paradigm developed in the United Kingdom, which in some cases evolved into some hybrid form (revenue or profit sharing, for example).
The engineering Reference (or “Model”) Company approach is not based on the network itself, but on a hypothetical “optimized” network—starting from scratch (Damonte et al., 2013). According to Silva (2011), it consists of a bottom-up regulatory regime based on the engineering knowledge of the industry process. Prices are based on the estimated costs of a hypothetical efficient firm facing the same operating conditions as the concessionary under the review process. As future prices are not linked to realized costs, the method sets incentives for efficiency improvement. Also, it controls for heterogeneity in operating conditions since the regulator does not need to base its decisions on cost information firms provide. On the other hand, the approach does not solve the informational asymmetry between the regulated firm and the regulator. Moreover, the method is detailed, time-consuming, and resource-intensive, which seems to be the rule in regulatory activity, regardless of its methodology. This approach has been used in Spain, Sweden, and some Latin American countries, mainly Chile, Peru, Argentina, El Salvador, and Brazil.
Including the countries selected for the study obeys several statistical and practical criteria. A study of this nature requires a representative sample encompassing as many periods as possible, with homogeneous definitions of the variables. At the same time, the sample requires variability since our purpose is to compare countries that followed different paths. We included countries with very different regulatory regimes and sector history. It was easy with countries that have integrated national monopolies. Between reformers, we have included countries with different models of reform. The countries we cannot include were those whose data was unavailable, insufficient, or incomplete. We had to resort to trade-offs; for example, if we would like to include quality variables, we would have to lose two countries out of the nine in the final sample; thus, we let aside that consideration. See also the bottom of Table 4 for the sources for variables and limitations.
Empirical Literature Review on Efficiency in Electricity Distribution
Empirical Literature Review (Selected References)
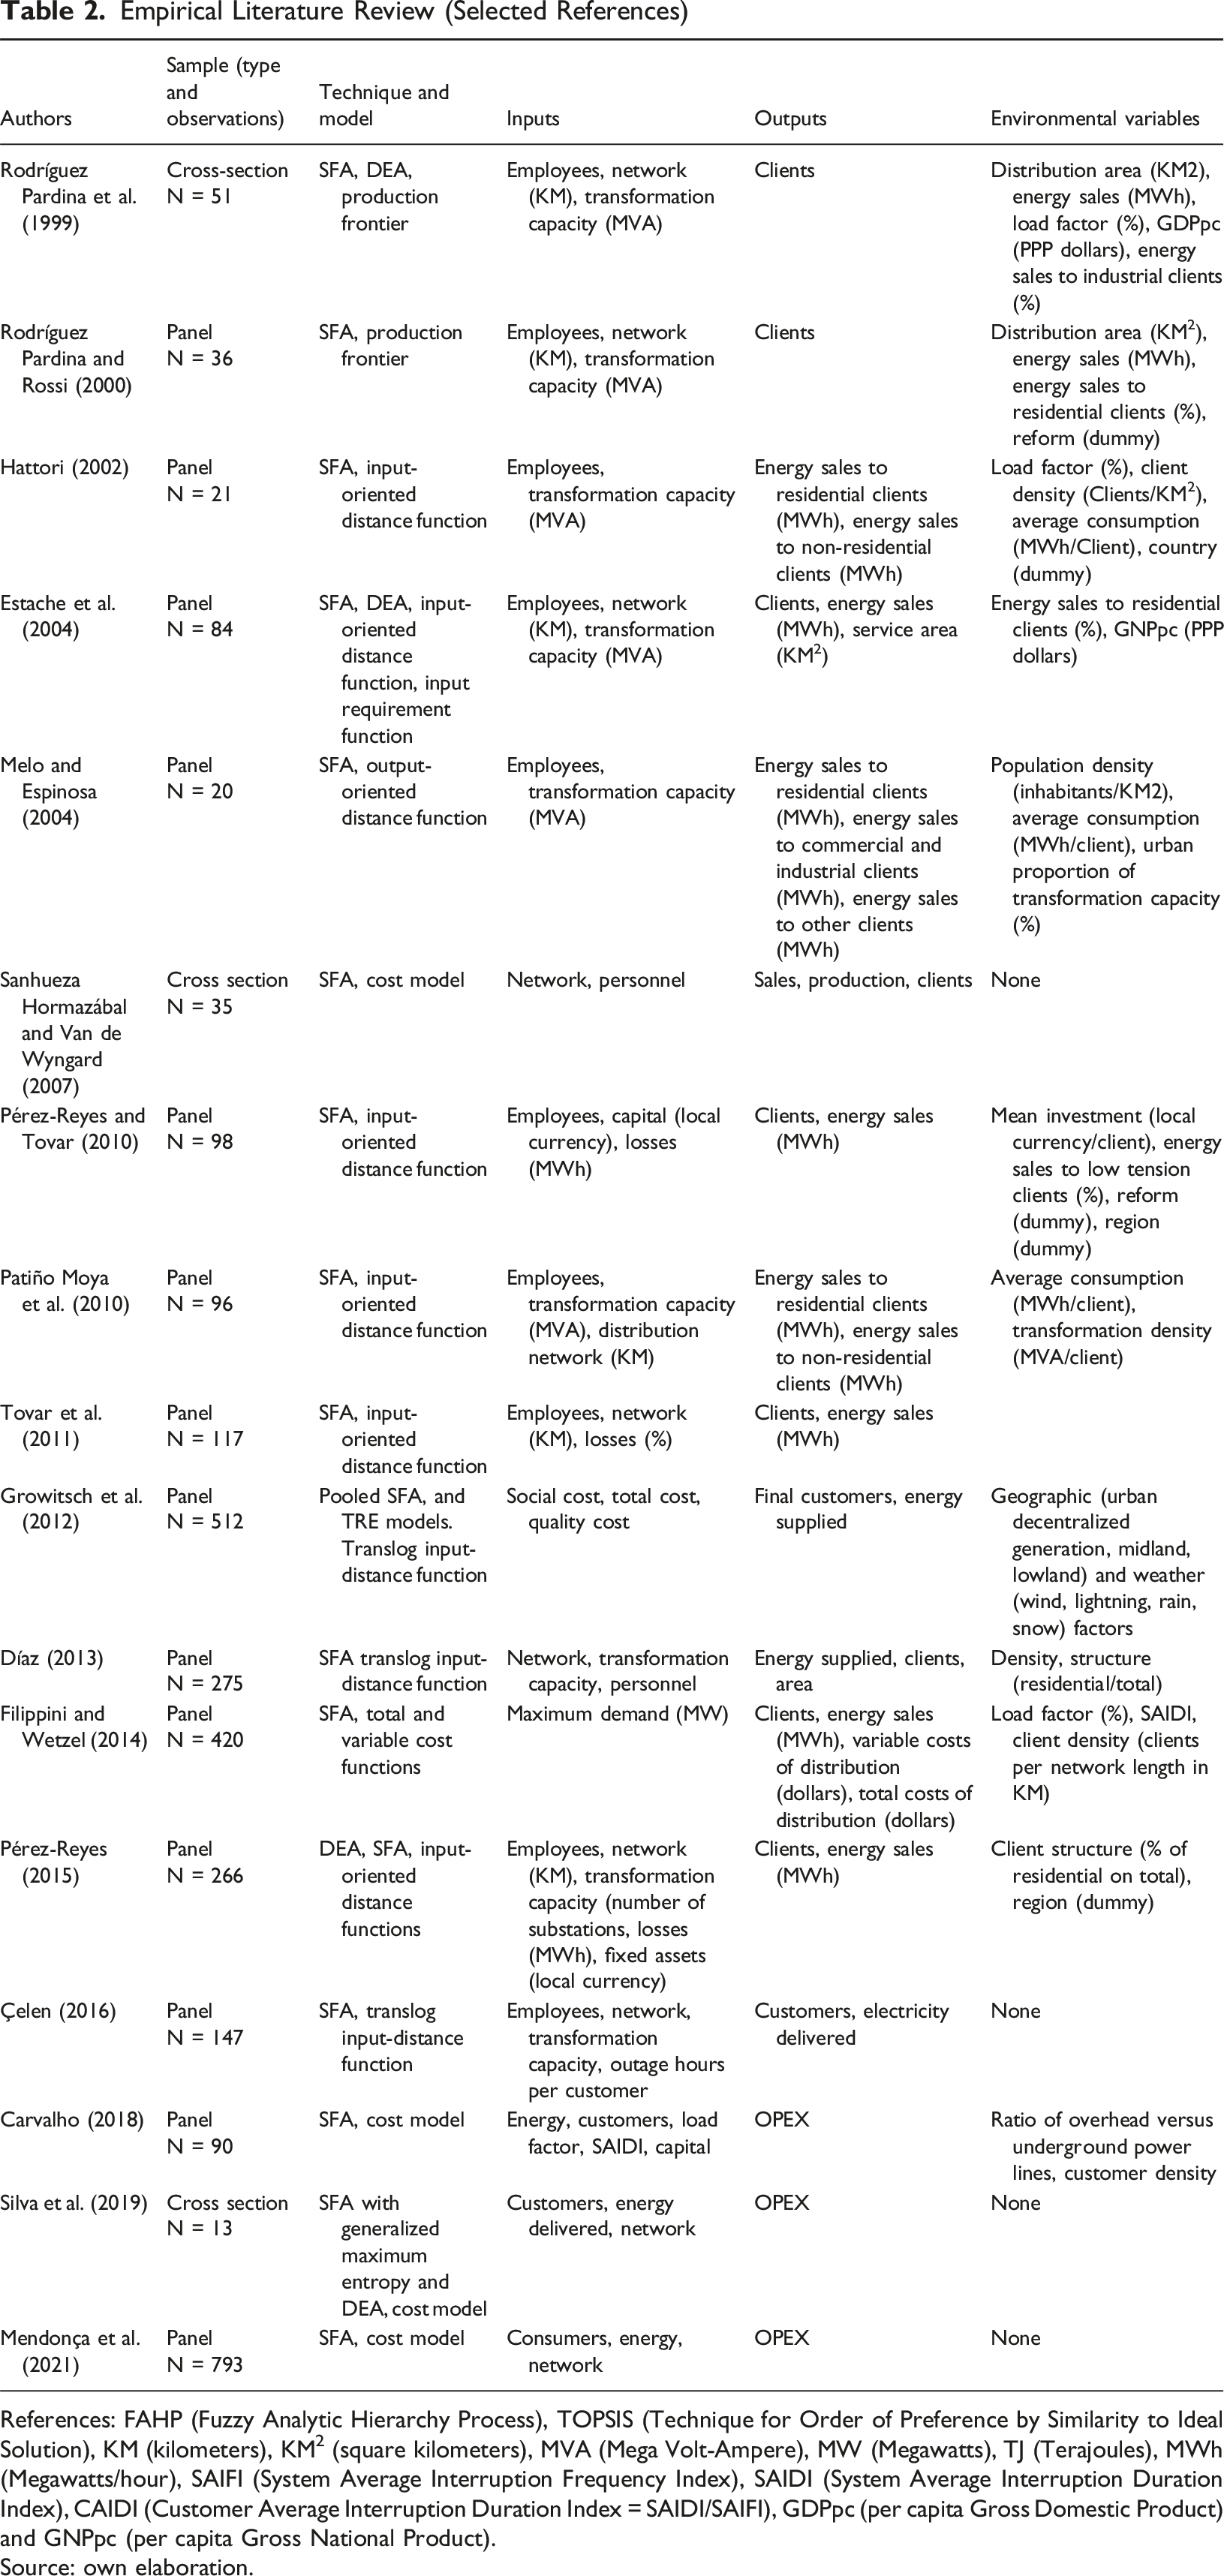
References: FAHP (Fuzzy Analytic Hierarchy Process), TOPSIS (Technique for Order of Preference by Similarity to Ideal Solution), KM (kilometers), KM2 (square kilometers), MVA (Mega Volt-Ampere), MW (Megawatts), TJ (Terajoules), MWh (Megawatts/hour), SAIFI (System Average Interruption Frequency Index), SAIDI (System Average Interruption Duration Index), CAIDI (Customer Average Interruption Duration Index = SAIDI/SAIFI), GDPpc (per capita Gross Domestic Product) and GNPpc (per capita Gross National Product).
Source: own elaboration.
There are many ways to systematize contributions – chronologically, thematically, regionally, etc. Chronological order is correlated with methodological and regional evolution. Thus, the earliest studies in the 1990s aimed to evaluate efficiency and propriety: The period marked the onset of English and Welsh privatizations, and when developing and transitioning worlds were introducing their privatization processes. Additionally, most studies were cross-sectional. Weyman-Jones (1991) studies the technical efficiency of England’s and Wales’s electricity distribution systems during the 1986-87 period and finds 5 out of 12 efficient firms with significant differences in the efficiency scores. Hjalmarsson and Veiderpass (1992) studied the efficiency of the Swedish electricity distribution sector in 1985. They evaluate the impact of scale, structure, and property type and find low and uniform average efficiency. Bagdadioglu et al. (1996), analyzing the Turkish electricity distribution companies for 1991, present high average efficiency levels and a positive effect of privatization on efficiency, although this is limited to only a few observations.
After the first wave of contributions, studies using panel databases began to develop and their regional reach extended given that vertical disintegration and/or privatization was proliferating worldwide. Kumbhakar and Hjalmarsson (1998) study the electricity distribution efficiency for Sweden between 1970 and 1990, showing higher efficiency among private than public companies and coinciding with Hjalmarsson and Veiderpass (1992) in that yardstick competition does not provide efficiency incentives for densely populated municipal distributors. Rodríguez Pardina et al. (1999) estimated productive efficiency for several South American countries during 1994, focusing on consistency among different estimation methods. Later, Rodríguez Pardina and Rossi (2000) studied technical efficiency for South American countries between 1994 and 1997, finding no efficiency gains and growing capital intensity in reforming countries.
A third wave adds some perspective because of the necessary length of the period to assess reforms. Hattori (2002) analyzes the evolution of Japanese and American technical efficiency between 1982 and 1997, finding an efficiency breach in favor of Japanese enterprises that is robust after controlling for environmental factors. Nevertheless, the efficiency level in both countries has decreased over the years, which the author attributes to Cost-Plus regulation. Estache et al. (2004) estimate efficiency for 1994-2001 for a sample of South American countries and find no changes in productive efficiency, while they do detect technical change. Melo and Espinosa (2004) estimate productive efficiency for a Colombian sample of distributors between 1999 and 2003, finding environmental variables that significantly explain efficiency differences. Nonetheless, the average level of efficiency did not vary over the period. Indeed, a favorable operation environment can enhance the efficiency of private firms. Australia began to reform its electricity sector in 1991. Abbott (2006) presents evidence of the 30-year performance (1969-99) of five states’ vertically integrated firms. He concludes that efficiency improved before the changes but deepened after the reforms. Sanhueza and Van de Wyngard (2007) estimate a cost function for Chile using a cross-sectional database and find important differences in cost efficiency between companies. Çelen (2016) analyzes the technical efficiencies of Turkish electricity distribution companies (21 in total) throughout 2002 and 2009. We used three different model specifications, all generated from a Stochastic Frontier Analysis (SFA) model for this aim. The coefficient of quality of electricity delivered is not statistically significant.
A fourth wave of studies with greater accumulated experience shows more conclusive results and differences in efficiency between countries: it seems that no rule works universally. In some countries, state-owned enterprises are efficient while they are not in others. The same holds for other features of the reforms. After a regulatory change in Brazil aimed at incentivizing regulation in electricity distribution, Ramos-Real et al. (2009) found that most of the firms showed a moderate increase in their efficiency for the period 1998-2005. The results of the remaining firms are harmful or not significantly different from zero. Pérez-Reyes and Tovar (2010) studied the evolution of short-term productivity and efficiency in Peru from 1996-2002, finding significant evidence of technical change and improvement in technical efficiency. On the other hand, Patiño Moya et al. (2010) do not find evidence of increased productivity or technical efficiency in Colombia from 2004 to 2007. Tovar et al. (2011) studied the Brazilian sector from 1998 to 2005 and found evidence of technical change and decreasing technical efficiency. Çelen and Yalçın (2012) consider a quality variable in their efficiency assessment of Turkey (2002-2009) and see high efficiency. However, this has stagnated during the period, although technological change was present. Working with the same database, Çelen (2013) studies multiple environmental variables and their influence on efficiency scores, finding positive and significant results of client density, private property, and energy losses. Growitsch et al. (2012) are worried about the effect of observable environmental factors beyond firms’ influence (geographic and weather factors) and unobserved factors that are not identifiable in Norwegian firms’ measured cost and quality performance. Filippini and Wetzel (2014) analyze the impact of New Zealand’s reform from 1996-2011 to examine the unbundling effect. They found improvements in short-run and long-run efficiency. Pérez-Reyes (2015) expands on Pérez-Reyes and Tovar (2010) and analyzes the long-term evolution of efficiency in Peru (1996-2014) and considers several environmental variables. He revealed significant improvements in technical efficiency immediately after the 1993 reform and that there were no regional efficiency differences.
The evolution in the methods, the available information, and the growing sophistication of the techniques favored a fifth wave of studies whose characteristics will be cross-methodological, meta-studies, and cross-country. Silva (2011) uses efficiency estimates obtained from both a parametric and a non-parametric benchmarking model to examine the application of the Reference Company approach (summarized in the next section) in periodic tariff reviews in some Brazilian distributors. Silva (2011) states that political pressures influence regulatory decisions, pointing to a possible inaccuracy in the cost parameters employed in the Reference Company engineering method. This shows that the regulator’s objectives might not have been welfare maximizing in some situations. The financial crisis of 2009, the negative experience of some international privatizations, and weak economic literature regarding the ownership/efficiency ratio. In this context, Díaz (2013) measures the technical efficiency of power distribution companies in Argentina using distance function techniques under the framework of stochastic frontier analysis to build a ranking of efficiency between private and public companies. Damonte et al. (2013) estimate the efficiency scores of Brazilian electricity distributors for the period 2004-2009. They use a three-stage methodology – firstly applying DEA, applying an SFA model to correct for environmental conditions and random variables, and thirdly, adjusting scores by applying a common operating environment to each company. Núñez et al. (2020) estimate a meta-frontier DEA model to benchmark remuneration and the quality of different clusters of distributors presenting heterogeneous technologies. They show that the Spanish electricity system is not fully efficient, even when the cluster frontiers (not the meta-frontier) are taken as a reference. Hong-Zhou et al. (2017) analyze the role of regulatory reforms on the cost-efficiency levels of the Japanese electricity distribution sector, finding relatively low-efficiency levels on average and decreased efficiency after the reforms. Carvalho (2018) proposes a spatial Bayesian random effects stochastic frontier model that allows for unobserved heterogeneity and spillovers between firms’ efficiencies with an exogenous spatial weight matrix for New Zealand. Silva et al. (2019) propose a stochastic frontier approach with maximum entropy estimation, which is designed to extract information from limited and noisy data with minimal statements on the data generation process. In general, the same electricity distribution companies are found to be in the highest and lowest efficient groups, reflecting weak sensitivity to the prior information considered in the estimation procedure. Xie et al. (2021) employed a balanced panel of 30 provincial electricity distributors in China for 1999–2016 to estimate an SFA distance function to assess the impact of the unbundling reform on the service efficiency implemented in 2003. They conclude that reforms have not improved efficiency. Mendonça et al. (2021) assessed a Bayesian inference application to estimate a stochastic cost frontier considering temporal efficiency dynamics. Considering this point is essential since studies conducted to assess power sector efficiency have neglected that part of efficiency increases that originate from scale gain due to market expansion, which occurs over time.
In the following section, we discuss methodologies used in the precedent studies.
Method, Model and Data
Two families of techniques are typically used to assess efficiency: parametric (econometric) methods and non-parametric (mathematical programming) ones. The most popular within the former is SFA, while the most popular within the latter is DEA.
Using DEA, an enveloping frontier is estimated from the sample; observations yielding on the frontier are deemed efficient, and those under the production envelope are considered inefficient. The measure of inefficiency is the distance between each observation and the frontier. However, deviation from the frontier is not necessarily under the full control of each productive unit; the DEA method is labeled as deterministic.
In contrast, a regression model is estimated for production or cost functions with SFA. The regression residuals are used to determine the relative inefficiency of each observation. In stochastic models, the error term is divided into statistical noise and inefficiency, while all the residues are considered inefficiency in deterministic econometric models.
DEA and SFA methods have relative advantages and disadvantages. DEA allows us to work with relatively small samples. It is flexible, not imposing any constraint on how the variables relate. Since the model is sensitive to outliers, it is easy to detect strange observations in the sample. On the other hand, the method is considered inefficient in identifying all the differences between each observation and the frontier, leaving no room for randomness. In its most current version, it does not allow for statistical tests to validate the hypotheses.
SFA requires samples of some volume and demands the specification of a precise functional form plus some assumptions on the error-term inefficiency-component distribution. While we can solve the former by assuming a flexible functional form, such as the trans-logarithmic, the latter can be tested once proposed. The method makes it possible to include “environmental” (contextual) variables and allows statistical tests of hypotheses.
Descriptive Statistics by Variable
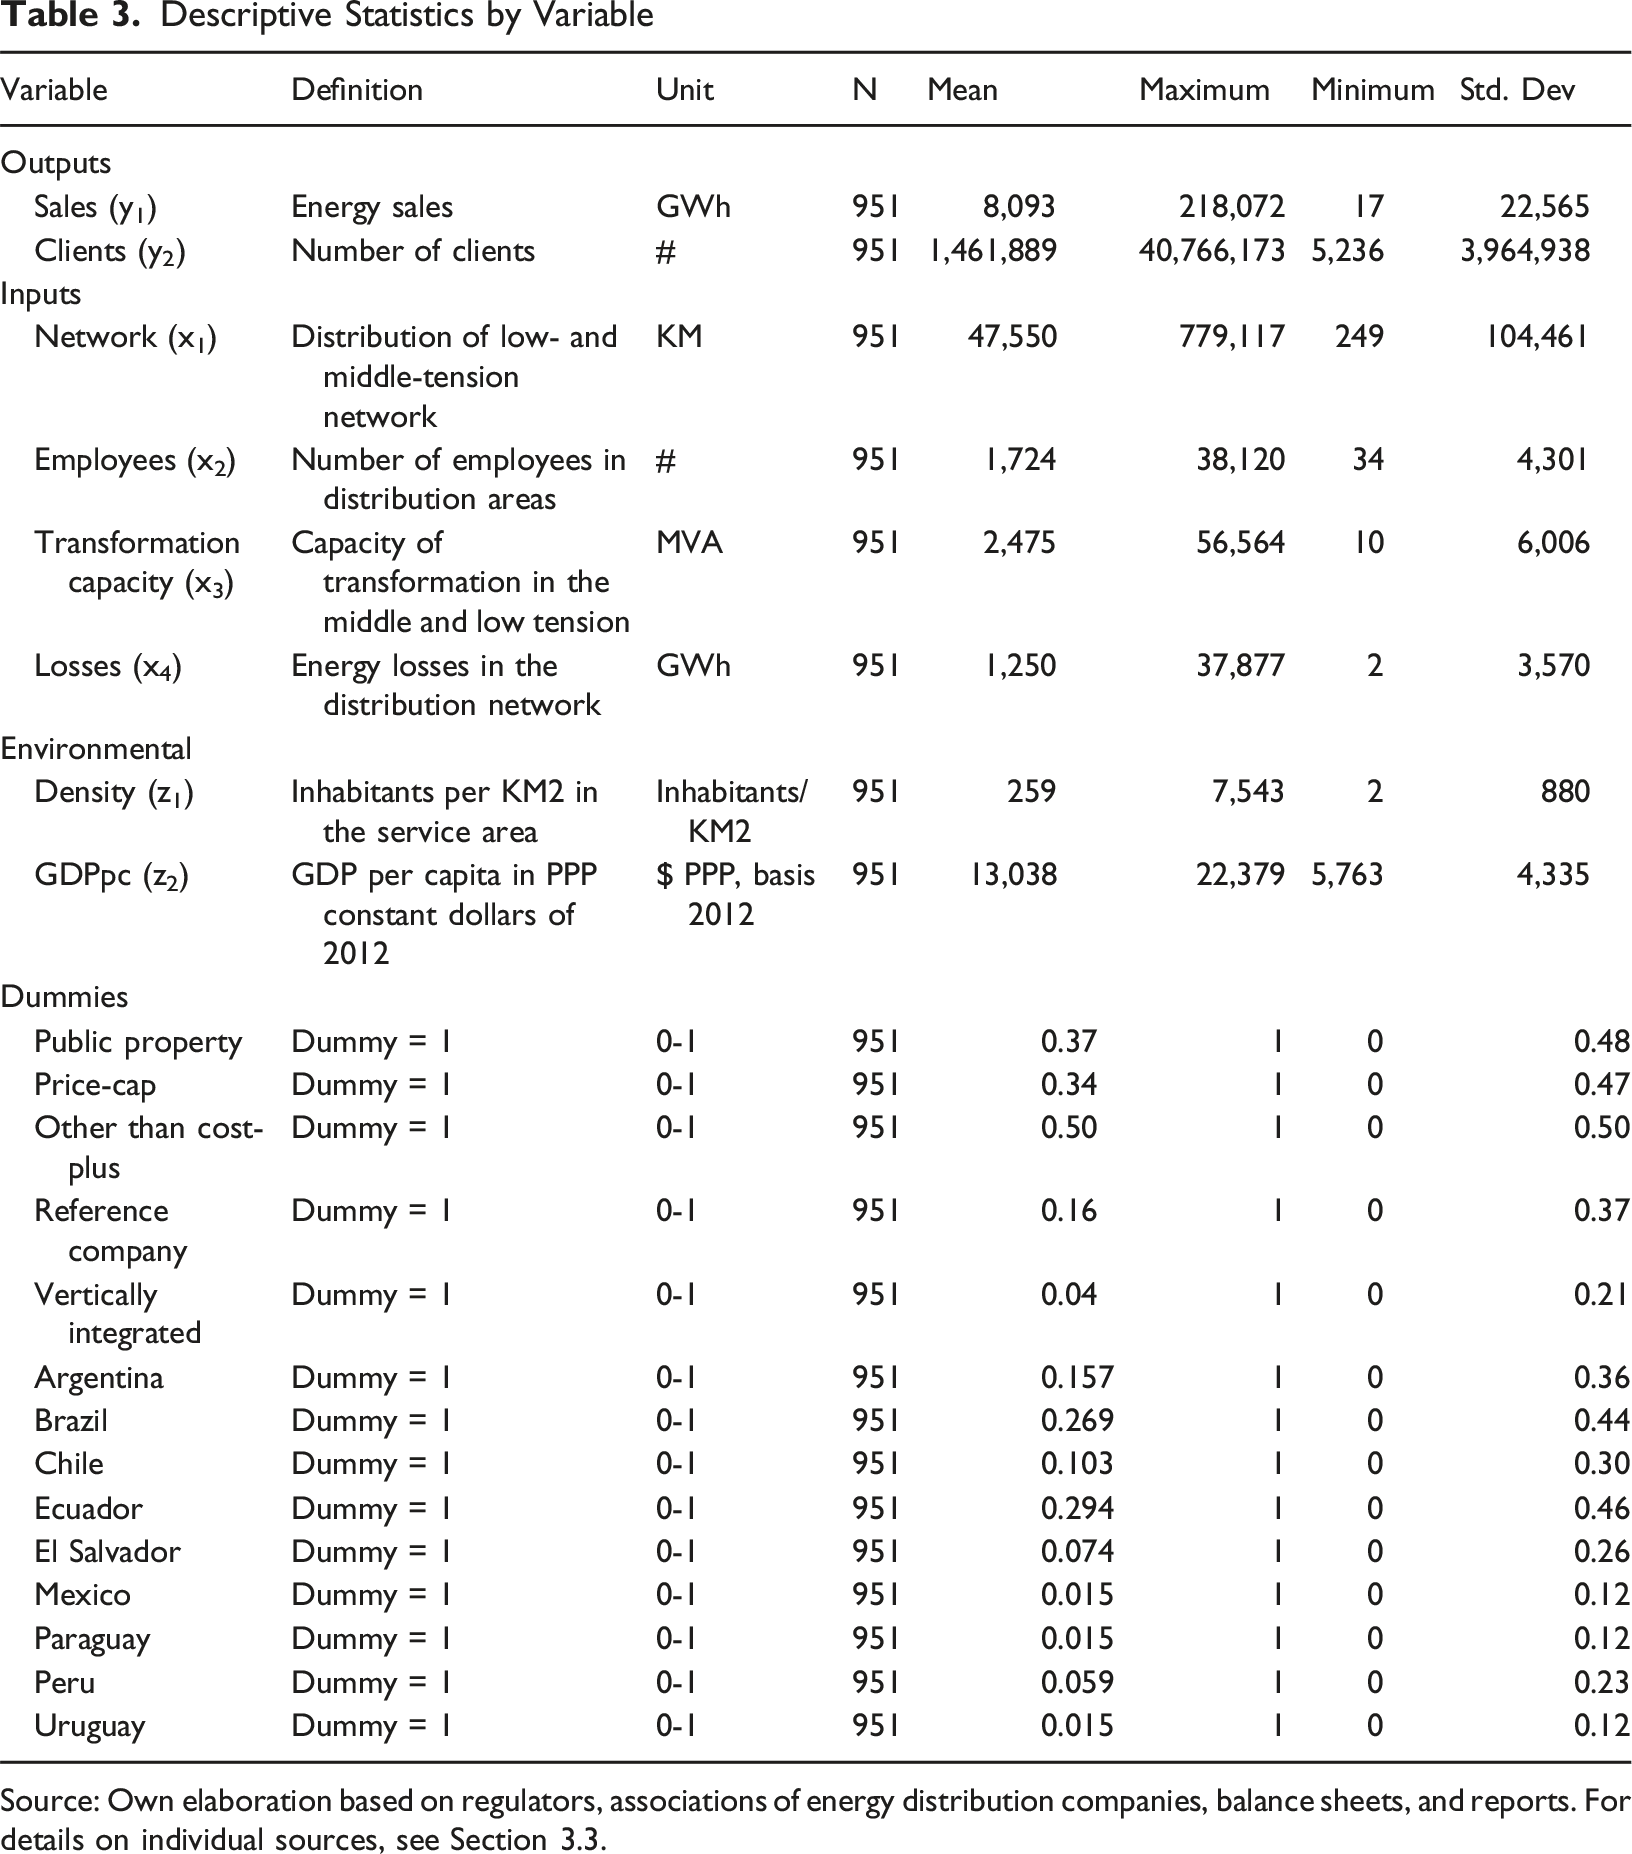
Source: Own elaboration based on regulators, associations of energy distribution companies, balance sheets, and reports. For details on individual sources, see Section 3.3.
However, production frontiers are fragile because they consider only one output, while in specific industries (electricity distribution is a good example) production involves more than one output. Cost functions partially solve the problem while incorporating another concern, isolating the technical from the economic efficiency. Thus, a good alternative is the distance function which addresses the multioutput concern. In our literature review, we find input-oriented and output-oriented versions. In the first case, you study the comparative efficiency of distributors that use more inputs than the units on the frontier (efficient ones) and deem inefficiency in the excessive use of inputs. In the second case, the more efficient firm is the one that produces more output with the same inputs than the other firms. Between the contributions summarized in Table 2, Hattori (2002), Estache et al. (2004), Pérez-Reyes and Tovar (2010), Patiño Moya et al. (2010), Tovar et al. (2011), Growitsch et al. (2012), Díaz (2013), Pérez-Reyes (2015), and Çelen (2016) opted by input-oriented models, while Melo and Espinosa (2004) use an output-oriented one. The reason input-oriented models are preferred is that in regulated sectors, reducing production (service) to maximize benefits is not allowed, because of coverage obligations. Instead, the firms have opened the option to save inputs in the productive process to improve their profits. In the latter case, the indirect constraint is the quality requirements, which limit input reduction or substitutions.
We chose SFA because we have several questions about environmental conditions. Our panel is large enough and we are interested in isolating statistical noise. Since the production frontier approach under SFA is an inappropriate method to assess efficiency when more than one output is present (the case of electricity distribution), we use distance functions.
Method
The basic structure of a production frontier is:

Since we estimate efficiency for a multi-output industry, we cannot directly use (1). One alternative is a distance function (between optimal and actual values). There are two possible estimations: output-oriented or input-oriented distance functions. The former assesses how the output vector can be expanded while holding the input vector constant, and the latter refers to the measure in which the input vector can be reduced by holding the output vector constant. This is preferable when firms do not control their production, which is the case in utilities with service obligations attached (Coelli et al., 2005).
For a panel, the input-oriented distance-function with M outputs and K inputs takes the form:





According to Lovell (1993), the homogeneity condition can be imposed by normalizing the distance-function (4), by dividing it into one of their inputs. Using input 

Which is the same as:

Changes in the output-input ratio across time can be attributed to catching up with the frontier (improvement in technical efficiency) or to frontier shifting due to technical change which allows for higher output-input values (technical change) (Coelli et al., 2005). To separate both effects, an econometric model should be estimated, allowing inefficiency to vary in time, for instance:

The technical efficiency of firm i at time t is obtained from the following conditional expectation:
Technical change can be incorporated into the model by including one deterministic trend term in the regressor vector or a set of time dummies (one for each year).
As the operation ambience can condition performance, we address its effect by considering several environmental variables. Following Coelli et al. (1999), we add the following term to the model because we assume contextual influence on the firms’ performance directly and, hence, on the production technology. Omitting these variables could lead to biases (Melo & Espinosa, 2004):
Model
The estimated functional form is a translogarithmic, including environmental variables. Formula (17) is a detailed version of formula (12). Adopting this flexible functional form reduces the risk of incorrect specification (Coelli & Perelman, 2001). All variables concerning their geometric mean have been normalized. Thus, the first-order coefficients can be interpreted as distance elasticities evaluated in the sample average.
Because the estimated distance function is input-oriented, output coefficients are expected to be negative, and input coefficients are expected to be positive. In the first case, the more outputs the firm produces, ceteris paribus, the shorter the distance to the efficiency frontier. In the second case, the more inputs the firm uses, ceteris paribus, the further the distance is between the firm and the frontier. Also, the interpretation of a positive sign for an environmental variable in this context depends on the character of the non-discretionary input proxy by the variable.
Given that the estimated model is specified as a time-decay Battese and Coelli (1992) model, it is relevant to distinguish between technical efficiency improvements (shifting towards the frontier, if coefficient η in formula (14) is positive) and technical change (frontier shifts, analyzing the time trend statistical significance).
The parameter
Data
Descriptive Statistics by Country
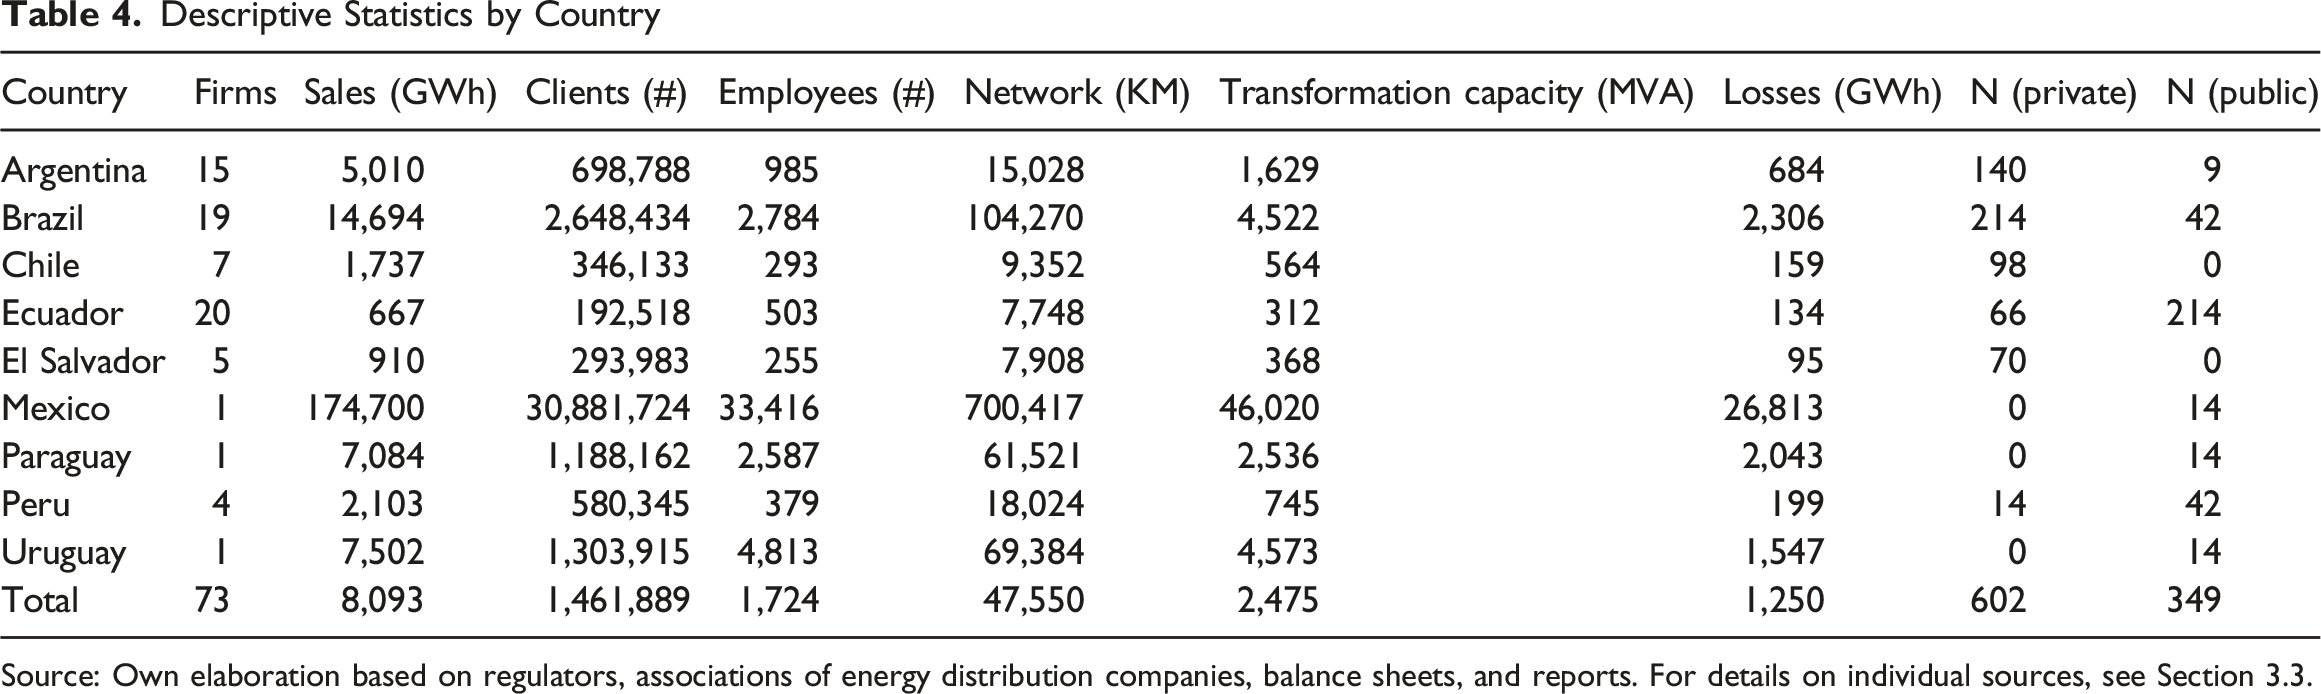
Source: Own elaboration based on regulators, associations of energy distribution companies, balance sheets, and reports. For details on individual sources, see Section 3.3.
The data were collected from publicly available information, including multiple sources. Countries and companies included in the final database were selected to maximize the geographical and firm reach, subject to the availability of public information, simultaneously complete and coherent, avoiding ambiguities and lost observations. This comprises the regulatory authorities of most countries, 2 associations of energy distributors for Argentina and Brazil, 3 and annual financial statements or sustainability reports published by the distribution companies or their capital market authority. 4
For Argentina, annual statistical reports from the website of “Asociación de Distribuidores de Energía Eléctrica de la República Argentina (ADEERA, the distros’ association)” comprise information for roughly 30 distros over 2003-2016, in some cases incomplete, requiring collecting data from individual financial statements (from individual presentations or “Comisión Nacional de Valores” (securities regulator). We could complete information for 15 firms. For Brazil, the primary source is the website for the “Agência Nacional de Energia Elétrica (ANEEL, National Electricity Agency).” It includes information to some 60 distros. ”Associação Brasileira de Distribuidores de Energia Elétrica” (distros’ association) was a secondary source. None of the former sources reported employees, and the last version of ANEEL did not include installed capacity; thus, we had to collect data from individual sources (companies’ financial statements) or from “Comissão De Valores Mobiliários” securities regulator. We only have complete and coherent information for 20 companies. In Chile, we did not find public sector databases; thus, we resorted to individual financial statements from “Comisión para el Mercado Financiero” (securities regulator). We only have complete information for seven companies. We used the statistic bulletins from the “Agencia de Regulación y Control de Electricidad (ARCONEL, the electricity regulator) for Ecuador. For El Salvador, the main source was the SIGET statistical bulletins from the “Superintendencia General de Electricidad y Telecomunicaciones (SIGET, the electricity regulator)” website. For Mexico, the primary sources are statistics from “Comisión Federal de Electricidad (CFE, federal electricity authority)” website. For Paraguay, the data originates in the electricity company reports, the “Administración Nacional de Electricidad (ANDE).” In Peru, we did not find compiled public sources, resorting to individual financial statements of the companies. We completed the former with reports from “Superintendencia del Mercado de Valores” (securities authority). Due to difficulties finding complete and coherent data, we only have complete information for four firms. In Uruguay, the main source is the national vertically integrated company “Administración Nacional de Usinas y Transmisiones Eléctricas (UTE).”
Due to the multiplicity of sources, an important effort was needed to standardize definitions of the variables. It was the case for the networks, where we had separated data of low, medium, and high tension for Argentina, Chile, and Peru; of low plus medium (for distribution), and high tension (for transportation) for Brazil; of low and medium tension for El Salvador; for low, medium, and high tension (defined as transmission and sub-transmission lines) for Ecuador; and for low, medium, and high tension (defined as transmission lines) for Mexico, Paraguay, and Uruguay. Concerning personnel, we employ the concept under the label “own employees”; outsourced employees are not well nor uniformly reported in our sources. We recognize this is a limitation since we are supposing the same structure of employment for different firms. Energy losses encompass technical and non-technical losses, such as outages, stolen energy, unpaid invoices, etc.
Discussion of Results
Estimated Model (N = 951, Groups = 73). Dependent Variable = −ln(1/x1)

y1 = Sales, y2 = Clients, inputs x1 = Distribution Network (low and medium tension lines), x2 = Employees, x3 = Transformation Capacity, x4 = Losses.
Robust standard errors are in parentheses. ***p < 0.01, **p < 0.05, *p < 0.1.
Source: Authors’ elaboration.
All the first-order coefficients are statistically significant and present the expected signs, which implies that the distance function is well-behaved. Because the summation of output coefficients is lower than 1, scale elasticity ε
Cross and squared effects are significant in most cases. Cross effects between employees/network (x2/x1), with transformation capacity/network (x3/x1), are significant and negative, indicating that labor and capital are substitutes. Cross effects between losses/network (x4/x1) and transformation capacity/network (x3/x1) denote complementarity (positive sign). The inputs’ square values are insignificant in transformation capacity/network (x2/x1) and losses/network (x2/x1).
The environmental variables density and GDPpc are not significantly different from zero. Regarding country dummies, they are omitted in the models with firm dummies because of collinearity.
The variable addressing public property is significant where losses are considered, while vertical integration is only significant when losses are considered. However, environmental variables are not included, and the Price-cap is ever significant. Those variables were included as controls in the input distance function, which means they are potentially affecting the production technology. Given that the dependent variable in (12) is -ln(x1), a positive parameter implies a technology less input demanding (for instance, of distribution network), and a negative parameter implies it is more input demanding. For public property firms, the positive sign denotes a technology that demands comparatively less distribution networks than private ones, and the same is true for firms regulated under price caps, concerning other regulatory regimes. For vertically integrated operators, the negative sign denotes the opposite. Because vertically integrated operators are all publicly owned, and the absolute value of the coefficient of the former is four times the absolute value of the coefficient of the latter, it can be expected that public and vertically integrated operators demand more distribution network inputs than other combinations of property and regulatory regimes.
The linear time trend is not statistically significant, suggesting no technological shifts occurred from the efficiency frontier. However, the squared time trend is significant and negative, reflecting an increasing tendency in technology change across the period, even modest because of its low absolute value. This can reflect that after the shock of the reforms, the sector had some impulse to improve in technical terms.
The value of gamma (0.926 in the main model, and reaching even higher values in other specifications) indicates that the variance of the inefficiency is 92.6% of the variance of the composite error term (being the unit minus gamma randomness). This statistic reflects the goodness of fit in the context of efficiency measurement. The value of eta, positive and significant, denotes that technical efficiency (shifting towards the frontier) increased at 2.11% per annum in the main model.
Our investigative questions on electricity distributors’ efficiency in 2003-2016 concern: (1) the average technical efficiency attained (being the unit an indication of full efficiency); (2) their main drivers; (3) the frontier shift (technical change); (4) differences by regulatory regime; (5) differences by firms’ characteristics (vertical integration, property).
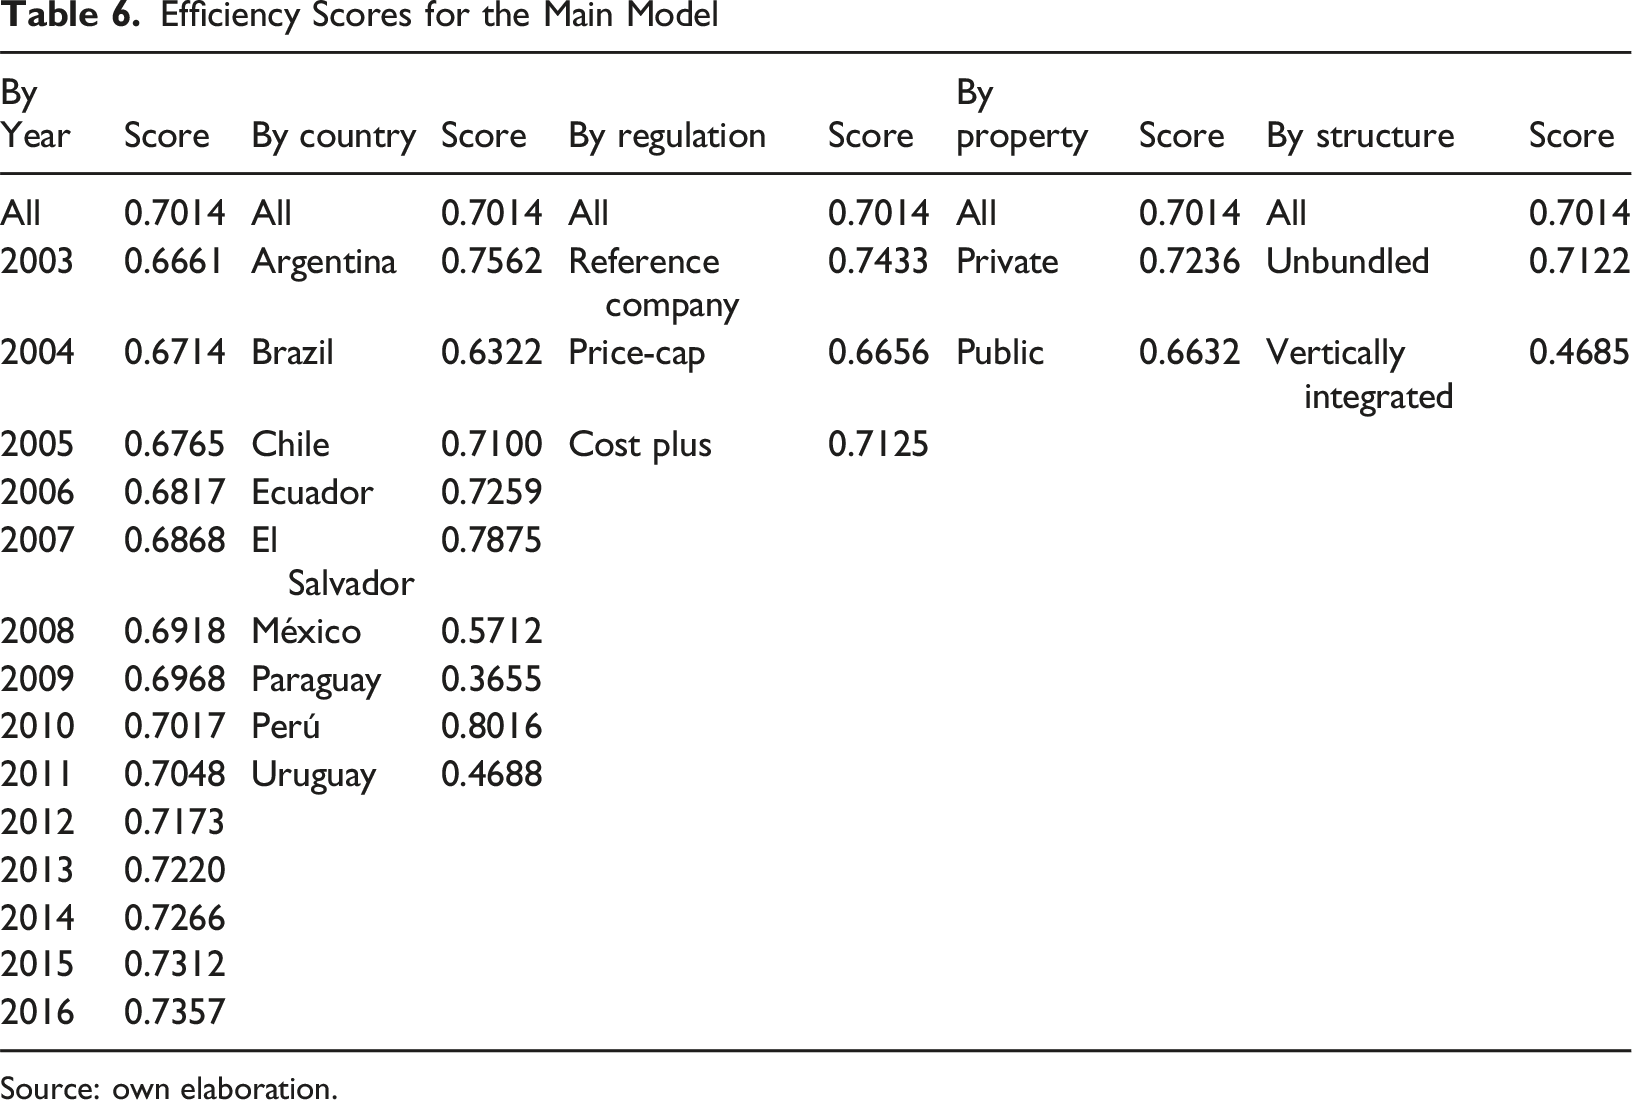
Table 6 presents the efficiency scores’ averages by the whole sample, year, country, regulatory regime, and property, and Figure 1 allows comparing by country the level of efficiency of their distributors according to (normalized) outputs and inputs. (1) The model shows an average efficiency of 70% for the whole sample. Table 6 presents a positive efficiency increase across the period. Peru (omitted) and El Salvador have the best efficiency scores, while Paraguay and Uruguay fall below the average. (2) The main drivers were transformation capacity (low and medium tension lines) between inputs and among the outputs. Serving the clients (commercial and administrative issues) demanded more inputs than sales of distribution services (productive issues). Losses, when included, show input savings and are a substitute for CAPEX in the short run. (3) The linear time trend is not significant, suggesting no technological shifts occurred from the efficiency frontier. However, the squared time trend is significant and negative, reflecting an increasing tendency in technology change across the period, even modest because of its low absolute value. (4) Reference firms are the most efficient (0.74 score on average), followed by firms regulated by Cost Plus (0.71 score on average), and Cost-Plus (0.66 on average). (5) On average, the efficiency of public firms (0.66) is lower than the corresponding value for private ones (0.72). The efficiency average score for vertically integrated monopolies is lower (0.46) than unbundled sectors in the sample (0.71). Efficiency Scores for the Main Model Source: own elaboration. Efficiency According to Each Normalized Output and Input

The study has limitations. One is the issue of quality, which has already been discussed. We lack the data in quantity and quality to address the issue. Secondly, this is not a predictive model nor yields straightforward policy recommendations. For instance, unbundling seems attractive; however, its possibilities could be limited nationally in countries such as Uruguay and Paraguay. Finally, institutions differ among countries, depending on their history, economic structure, and other idiosyncratic elements not captured in our database.
Conclusions and Policy Implications
We assess productive efficiency in the electricity distribution sector for nine Latin American countries (both reforming and non-reforming) more than two decades after the 1990s reforms were implemented. We employ a panel of 14 years of observations and answer questions about technical efficiency drivers using an SFA distance-function model that considers environmental variables and a flexible trans-logarithmic functional form. We explore the literature to determine the outputs, inputs, and environmental variables the preceding empirical work has considered.
We aim to answer: (1) Which average technical efficiency was attained by electricity distributors in the Latin American region during 2003-2016? (2) What are the main drivers? (3) Was there any measurable technical change in the sector over the period (frontier shift)? Was there any shift towards the frontier? (4) Under which regulatory regimes were the distributors more efficient? Moreover, (5) How did the efficiency differ among the firms’ characteristics (vertical integration, property)?
We find a 70-percent average technical efficiency for electricity distributors in the Latin American region from 2003 to 2016. The distance function’s signals for outputs and inputs are expected for capital and labor proxies. Thus, the distance function is well-behaved. Concerning other drivers, energy losses are high in magnitude and significant in statistical terms to explain inefficiency in Latin American energy distributors because admitting losses is implicitly a substitute for capital maintenance expenditure. Density proves to be insignificant in explaining the input distance function, as does GDPpc.
The linear time trend is not significant, suggesting no technological shifts occurred from the efficiency frontier. However, the squared time trend is significant and negative, reflecting an increasing tendency in technology change across the period, even modest because of its low absolute value.
The results reveal differences in efficiency scores by regulatory regime, with the best average results for Reference Firms concerning Price Cap and Cost-Plus, methods that are present (de jure or de facto) in most of the firms we analyzed.
Private companies show higher average efficiency levels than public ones. Vertically integrated monopolies, on average, behave poorly in efficiency comparative terms.
Policymakers can use the results to help respond to “where we are and where we are intended to be”, and as a catalyst for change (deepening on why? and how?). Our study helps project possible future paths and identify commonalities and differences. The type of assessment we developed is an instrument to evaluate and monitor the impact of national policies. Results show advantages in terms of efficiency for unbundled sectors and those regulated by incentive regulation versus vertically integrated monopolies, and those regulated as cost plus. Nevertheless, two caveats are important. First, within the sample, there is considerable dispersion of results which can be attributed to differences among countries and institutional specifics. Second, in smaller countries, such as Uruguay and Paraguay, the unbundling can be challenging to implement, given the decision to do it.
Footnotes

Funding
The author(s) received no financial support for the research, authorship, and/or publication of this article.
Declaration of conflicting interests
The author(s) declared no potential conflicts of interest with respect to the research, authorship, and/or publication of this article.