



Abstract
Data quality (DQ) is the degree to which a given dataset meets a user’s requirements. In the primary healthcare setting, poor quality data can lead to poor patient care, negatively affect the validity and reproducibility of research results and limit the value that such data may have for public health surveillance. To extract reliable and useful information from a large quantity of data and to make more effective and informed decisions, data should be as clean and free of errors as possible. Moreover, because DQ is defined within the context of different user requirements that often change, DQ should be considered to be an emergent construct. As such, we cannot expect that a sufficient level of DQ will last forever. Therefore, the quality of clinical data should be constantly assessed and reassessed in an iterative fashion to ensure that appropriate levels of quality are sustained in an acceptable and transparent manner. This document is based on our hands-on experiences dealing with DQ improvement for the Canadian Primary Care Sentinel Surveillance Network database. The DQ dimensions that are discussed here are accuracy and precision, completeness and comprehensiveness, consistency, timeliness, uniqueness, data cleaning and coherence.
Keywords
Introduction
For decision makers, the value of data depends profoundly on data properties such as completeness, correctness, consistency and timeliness (Heinrich et al., 2007). Together, these dimensions can define the overall concept of data quality (DQ) (Wang et al., 1995). To achieve reliable and useful information from the large quantity of data and to make more effective and informed decisions, data should be clean and, as much as is possible, free of error. Nevertheless, evidence exists that many enterprises do not pay sufficient attention to the existence of poor quality data and have not applied suitable techniques to help to ensure a supply of high quality data tailored for their particular applications (Li et al., 2010). Additionally, poor DQ has a financial impact, costing the US economy more than 600 billion dollars per year (Eckerson, The Data Warehousing Institute, 2002). Lastly, a consequence of the “garbage in, garbage out” principle, poor quality data result in distorted interpretations of available information leading to poor decisions and poor measurements (Mong, 2000). Consequently, one of the biggest challenges that data scientists are facing is making data usable for intended users by improving DQ.
The Canadian Primary Care Sentinel Surveillance Network (CPCSSN) is the first Canadian national multi-disease surveillance initiative based on the use of de-identified electronic medical records. A more detailed description is published elsewhere (Williamson et al., 2014), but in summary, the CPCSSN was funded by the Public Health Agency of Canada under a contribution agreement with the College of Family Physicians of Canada on behalf of 12 primary care research networks associated with Departments of Family Medicine across Canada. CPCSSN data are longitudinal electronic health records (EHRs) stored in a database that tracks current and new patients at different points in time. Records are updated by adding new observations to previous records every 3 months. One of the major achievements of CPCSSN is the harmonisation of the content of multiple different EHR databases into a single database schema, which is what enables Canadian EHR data to be analysed. Although differences in individual EHRs do impact unevenly on the DQ dimensions, better that than no dimensions at all. Each EHR database could be evaluated individually but that would be a much larger job.
CPCSSN defines DQ within the context of an intended data user’s needs. These data users can be graduate students, academic researchers, healthcare providers, health agencies, health system planners, decision makers and industry partners. Therefore, DQ for CPCSSN is a process of iteratively assessing the capacity and suitability of a given dataset to meet a user’s requirements. The various ways of assessing the quality of data operationally depend upon the dimensionality of the data available (number of observations, available independent and dependent variables) and the DQ requirements of the intended study (Weiskopf et al., 2017). Furthermore, since DQ is defined in the context of users and user requirements vary, it should be considered to be an emergent construct whose properties are not fixed, so data should be constantly assessed and reassessed to ensure that the quality of data is sustained in an acceptable and trustworthy level over time and for different applications.
Impact of poor DQ
Poor DQ affects every industry. However, for clinical decision support systems, incorrect decisions can mean the difference between life and death. The ramifications of inaccurate information for decision makers such as physicians can lead to suboptimal care. The ability of healthcare organisations to operate efficiently and to make the accurate decisions that lead to optimal outcomes requires these activities to be made upon accurate information. The quality of EHR data also limits the validity and reproducibility of research results. While there are many DQ assessment methods accessible in the informatics literature (Huser et al., 2016; Weiskopf et al., 2017; Zozus et al., 2014), very few published articles address how to deal with the numerous different issues of poor-quality data in a practical approach (del Pilar Angeles and García-Ugalde, 2009).
DQ issues and approaches
At CPCSSN, a DQ program was launched by establishing a working group that includes several data managers, a senior data analyst, a senior epidemiologist and at least one family physician, many of whom are researchers. The working group meets regularly to elaborate on and manage issues related to poor DQ and to determine the potential root causes with the greatest impact. Participants in the DQ group discuss possible steps that should be taken to solve the issues in a timely manner.
This article reports our hands-on experiences in dealing with DQ improvement for the CPCSSN database, which covers some of the most important issues in DQ management. The DQ dimensions discussed here are accuracy and precision, completeness and comprehensiveness, consistency, timeliness, uniqueness, data cleaning and coherence.
The CPCSSN database
Dimensions, DQ and lessons learnt
Accuracy/Precision
Accuracy refers to the correctness of the information and how close quantities are to the “true” value, while precision refers to how close quantities are to each other (JCGM, 2008; Taylor, 1999). For example, suppose we have records of height for a patient with a true value of 175.0 cm. Having three measurements of 185.0, 185.1 and 185.2 cm for the same patient illustrates good precision (repeatability) but poor accuracy. If the measurements are accurate but not precise, then height observations may become 175.1, 175.6 and 175.9 cm. If the measurements are accurate and precise, then height observations may become 175.0, 175.1 and 175.2 cm. Therefore, accuracy and precision are not the same; however, accuracy of healthcare data sometimes is measured by precision metrics such as positive predictive value, negative predictive value, sensitivity and specificity and so on. In a big dataset such as in CPCSSN’s, measuring accuracy of data for most predictors (independent variables) is very challenging and sometimes even impossible. For some dependent variables such as chronic diseases with binary outcomes, data extraction is carried out using different data elements (e.g. from billing, encounter and heath condition tables of patients and using different algorithms). Consequently, since data extraction becomes susceptible to errors, the accuracy of data can be estimated and validated from a confusion matrix for the binary classifier using the following formula:

where TP is true positive, FP is false positive, TN is true negative and FN is false negative.
For example, to determine the prevalence estimate for Herpes Zoster diagnosis in CPCSSN, recently we validated Zoster using case definition of the disease diagnosis and a chart auditor, who was blind to the chart selection process, which resulted in an accuracy of 87% (Queenan, et al., 2017). CPCSSN has also validated case definitions for eight common chronic conditions: diabetes, chronic obstructive pulmonary disease (COPD), hypertension, depression, osteoarthritis, dementia, epilepsy and Parkinsonism (Williamson et al., 2014). During the process of disease validation, independent chart abstractors check patient demographic variables such as sex and age, then we cross validate the observed values of chart abstraction and CPCSSN values to measure the accuracy of independent variables for a sample of data. The general theme of accuracy/precision in CPCSSN is finding outliers that do not meet specific individual requirements of each variable.
Completeness/Comprehensiveness
Completeness refers to the proportion of data available for a specific requirement, which is not missing and is reported as a percentage (Pipino et al., 2002). For example, if out of 100 patients, only 30 have BMI information, the completeness for body mass index (BMI) is equal to 30%. Comprehensiveness means that all required data items for a particular use must be included and available to users (AHIMA, 2012). Greater comprehensiveness means better DQ. For example, predictive models such as risk prediction models and machine learning algorithms depend heavily on the number of independent variables, including sociodemographic variables. The predictive ability of a model can be increased by employing datasets that contain comprehensive relevant information. In CPCSSN, patients’ records are spread across 30 different tables, which makes data analysis challenging for researchers with limited data manipulation skills. Here, a single dataset with a higher degree of comprehensiveness has been created by appending or merging several datasets including encounter records of patients, demographic variables, billing, health condition, disease, vaccination, referral, risk factors, medication, allergy and laboratory records. The resulting dataset contains 24 independent variables, including several demographic variables and all the records of patients. Comprehensiveness can also be referred to as inclusiveness or being able to represent the entire population.
Consistency
Data consistency is the measure of the absence of differences between the data items representing the same objects across applications and systems. Data consistency can refer to individual observations or units of measurements. For example, the unit for patient weight should be the same across different records (e.g. either kilogram or pound, but not both). Univariate analysis using UNIVARIATE procedure of SAS 9.3 (SAS Institute, Cary, North Carolina, USA) is used to evaluate data consistency, obtain descriptive statistics and summarise the main characteristics of CPCSSN data.
Timeliness
The quality of healthcare data not only depends on the accuracy of the information but also on the timeliness of information. Timeliness is the extent to which the age of data is suitable for the task at hand (Tayi and Ballou, 1998) or the availability of up-to-date data within the useful, operative or indicated time (AHIMA, 2012). It also refers to whether the values of attributes still correspond to the current state of their real-world counterparts or whether they are out of date (Heinrich et al., 2007). What might be correct at any one point in time could be subject to change a month later. Healthcare observations should be up-to-date and documented at or near the time of the event. At CPCSSN, the data life cycle is 3 months, which means the database is kept up-to-date by adding new observations to previous records on a regular basis, every 3 months. The 3-month frequency for EHR data extraction and processing was chosen by expert consensus and in consideration of the available resources to meet CPCSSN’s original use cases: chronic disease surveillance and research. This is timely enough for research, chronic disease surveillance and some practice/quality improvement uses. The practice/quality improvement use case was included several years after the original use cases were determined. For some types of quality improvement, greater frequency would be beneficial. For other potential uses, such as infectious disease monitoring, outbreak surveillance or pharmaco-surveillance, it may not be timely enough. These types of surveillance would similarly benefit from greater frequency. CPCSSN is working on updating its data more frequently to meet the needs of other use cases.
Uniqueness
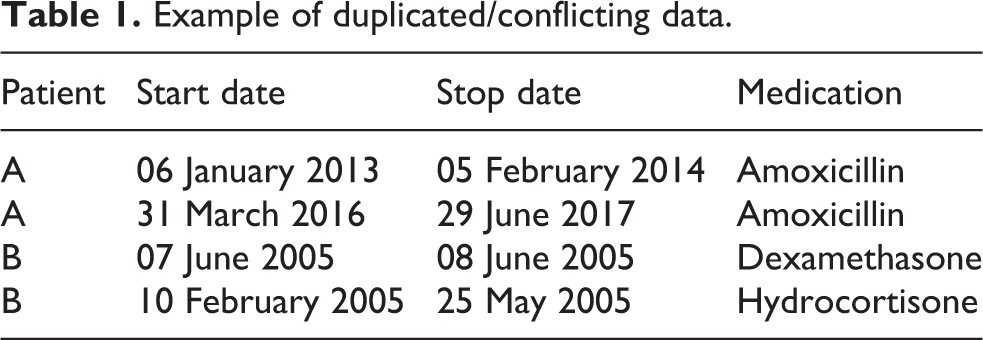
Uniqueness is the extent to which an entity from the real world is represented once (del Pilar Angeles and García-Ugalde, 2009). For example, if the list of healthcare records in a dataset covers 50 patients, but it contains 100 observations (100 rows), then some or all patients have more than one observation and also there is a possibility of having fully duplicated rows with exactly the same information. Depending on the situations and requirements of data analysis, partially duplicated data may either be valid and allowed to remain in the dataset, or invalid, which leads to inconsistencies, biased results and therefore should be removed prior to analysis of data. For instance, in Table 1, if start date/stop date of medication is disregarded, the second observation for Amoxicillin should be considered as a duplicated/conflicting record for patient A and this row removed from the dataset. Alternately, if start date/stop date are considered as important factors for analysis of data, then the extra record of Amoxicillin should not be considered as duplicated data and the second observation allowed to remain in the dataset. Fully duplicated rows are those observations where the values of their elements are exactly the same. Using Patient_ID, fully duplicated rows are detected from the database and removed. Partially duplicated rows are those observations where only some of their elements are duplicated. These partially duplicated rows are left in the CPCSSN database.
Example of duplicated/conflicting data.
Data cleaning
EHR data were created primarily for the benefit of practitioners and not researchers or analysts. Researchers/analysts trying to derive knowledge and benefit from the data is a more recent endeavour. This explains the often poorly structured data and why for example free text is permitted in fields where a dataset defined for analysis or research might not permit this. Such data are easily viewable or understandable and editable by practitioners; less so by machines. A lot of effort has been expended in trying to transform EHR data created for its primary usage into data for secondary usage. Data cleaning is the process of detecting, correcting or removing corrupt or inaccurate records from a database (Wu, 2013). Since EHR data comes from multiple different vendors and open source products, they can be messy, inconsistent, non-standard and need to be harmonised and reformatted properly before they can provide real-world insights about patients. In CPCSSN, data cleaning has a broader implication than just determining causes of errors and possible corrections. In addition to identifying the types of errors and unreliable information causing poor DQ and then correcting or removing such inconsistencies, we also detect and remove unwanted or unnecessary information, variables and columns. We have created two versions of the CPCSSN dataset: (i) a structured database, which includes more than 20 SQL tables containing all important variables from patients plus some extra information such as Site_ID, Provider_ID and so on. These tables are appropriate for users with strong analytical and data manipulation skills or for data managers who need extra records; and (ii) a SAS or a CSV file, which contains all necessary variables from patients in a clean and ready to use format. The latter version was designed for users with the minimum data manipulation skills.
Coherence
Coherence reflects the degree to which the data are logically connected and mutually consistent (OECD, 2017). Coherence over time reflects that the data are based on common perceptions, classifications and methodology over time and that any differences are explained and can be justified. Incoherence over time refers to disruptions in a series resulting from changes in perceptions, classifications and methodology. In the CPCSSN context, ensuring coherence over time is one of the major concerns. In every life cycle (3 months) of the CPCSSN database, records of patients are updated with new information which is collected at the most recent encounters and entered into several SQL tables, such as billing, encounter diagnosis, vaccination and so on. The consistency of the new version of the database is evaluated on a regular basis by several methods. First, simple comparisons are made between the new dataset and the previous version, for some data attributes such as the size, number of observations and number of variables for different tables. Also, estimations of disease prevalence are compared over years as an indication of possible fluctuation in data flow. The coherence is monitored over several years to make sure that the incidence and prevalence of the disease for each data life cycle is as expected statistically. The consistency of variable characteristics over time is also examined, for instance, Patient_IDs should be unique and consistence over time for the same patients and have the same attributes (either “character” or “numeric,” but not both) and have the same length, label and so on.
Miscellaneous
There are other data dimensions that are considered for improvement of CPCSSN DQ such as randomness (absence of patterns) of observations (data represents the entire population), compatibility of data with statistical software, the degree of ease of handling and analysing data, data usefulness and relevance.
Conclusions
This article has provided an overview of healthcare data issues and approaches to improve DQ. As previously mentioned, quality is a critical element of data and it should be considered as a property that does not last forever and should be constantly assessed to ensure that the quality of data is sustained at an adequate level. Therefore, it is very important to invest the time and resources on DQ. In fact, ensuring DQ should be prioritised at the same level of importance as sampling or collecting data.
Footnotes
Declaration of conflicting interests
The authors declared no potential conflicts of interest with respect to the research, authorship, and/or publication of this article.
Funding
The authors received no financial support for the research, authorship, and/or publication of this article.
