



Abstract
Notwithstanding its growing popularity and advantages over exploratory and confirmatory factor analysis, no studies have as yet employed psychometric network analysis with clinical subjects for attempting to resolve the dilemma about the dimensional structure of one of the most widely employed self-report measures of psychopathology: the Symptom Checklist-90-R [SCL-90-R]. This is the first study to do so. Clique Percolation, a network community detection algorithm that can accomodate overlapping nodes (symptoms), was applied to SCL-90-R self-ratings of a combined psychiatric patient and community sample (n = 2,069). Thirteen replicable and reliable primary communities (dimensions) that also differentiated the patient from the community sample in the predicted direction were yielded: Dysphoria, Interpersonal Sensitivity, Negative Self-Evaluation, Cognitive-Performance Deficits, Anxiety-Fear, Agoraphobia, Hostility, Social Anxiety, Somatic Anxiety, Cardiopulmonary Symptoms, Mistrust, Thought-Related Delusions, and Existential Distress. Visual inspection of the conditional associations between these 13 primary communities suggested the possibility of three higher-order dimensions: Panic with agoraphobia, Depression, and Interpersonal difficulties. The primary dimensions of Hostility and Thought-Related Delusions were the two least central dimensions in this visual alignment. Thirteen primary symptom dimensions are now available for further research on measurement invariance across relevant subject parameters (e.g., gender, age, clinical status) and for obtaining data on symptom status at initial patient interview and on patient reported outcome (to monitor treatment progress). Tentatively, in the Hierarchical Taxonomy of Psychopathology [HiTOP], Hostility could be located in the Antagonistic Disinhibited Spectrum and Thought-Related Delusions in the Thought Disorder Spectrum. The remaining 11 primary dimensions could all be allocated to the HiTOP Internalizing Spectrum.
Keywords
The SCL-90-R (Derogatis, 1977; Derogatis et al., 1976; Derogatis & Savitz, 2000) is among the most widely used multidimensional measures for assessing psychological distress in clinical practice and research (e.g., Preti et al., 2019). It is available in over two dozen languages, and it is being used extensively worldwide. It has been proposed to be scored and interpreted in terms of 9 a priori primary dimensions (syndromes), namely Somatization, Obsessive-compulsive, Interpersonal sensitivity, Depression, Anxiety, Hostility, Phobic anxiety (Agoraphobia), Paranoid ideation, and Psychoticism, and at least one “global severity index” termed general psychological distress.
SCL-90-R Dimensionality
Five decades after its introduction, the dimensional structure underlying the SCL-90-R is still vigorously being debated (e.g., Chen et al., 2020; Fan et al., 2024; Gomez et al., 2021, 2024a, 2024b; Ignatyev et al., 2016; Kostaras et al., 2020; Lignier et al., 2024; Olsen et al., 2004; Paap et al., 2011, 2012; Preti et al., 2019; Rytilä-Manninen et al., 2016; Sereda & Dembitskyi, 2016). While there is overall more evidence for multidimensionality than unidimensionality (e.g., Arrindell et al., 2004; Chen et al., 2020), studies that attempted to recover the 9 a priori factors with confirmatory factor analysis (CFA) have not found consistent support for such across different methods of analyses, across different sample types, or across nationalities, cultures, or languages.
Early U.S.-based studies, cited in Arrindell and Ettema (2003), that used exploratory factor analysis (EFA) often relied on subjective judgements when determining the number of factors using the eigenvalue greater than unity rule and Cattell's scree test, leading to wide variability in potential factor retention (λ's ranged from 1 to 28; and 1 to 12 factors were kept for interpretative purposes). Most studies also failed to assess factorial invariance or replicability through methods like bootstrapping or confirmatory approaches.
Kostaras et al. (2020) pointed out that the internal validity of all SCL-90-R findings yielded with CFA approaches based on structural equation modeling (SEM) may have suffered from the neglected potential effect of comorbidity, i.e., from bias resulting from meaningful cross-loadings. Simulation studies have indeed shown that even small cross-loadings should be explicitly taken into account, otherwise parameter estimates could be inflated and thus biased (Asparouhov et al., 2015). In addition, the goodness-of-fit of such models and the discriminant validity of the factors could also be undermined by the overly restrictive specification that items are only allowed to load on their main (targeted) factors, whereas cross-loadings on the other factors should be set to zero (Wei et al., 2022; Ximénez et al., 2022). Exploratory structural equation modeling (ESEM), which combines EFA and CFA (Asparouhov & Muthén, 2009), and Bayesian structural equation modeling (BSEM; Muthén & Asparouhov, 2012) were introduced to address the issue of cross-loadings flexibly. However, on the basis of simulated data to evaluate and compare conventional structural equation modeling (CFA), ESEM, and BSEM in estimating structural models with potentially unknown cross-loadings, Wei et al. (2022) concluded that the performances of these approaches were similar in the case of zero cross-loadings or when the target loadings were substantially large (e.g., a standardized value of 0.95). Nevertheless, their outcomes worsened and became unstable as cross-loadings increased and ESEM exhibited unstable performance in conditions with small target loadings. Accordingly, it was deemed unlikely that a new study based on a factor analytic approach would resolve the relevant dimensional dilemma.
In summary, three issues need to be addressed using a viable alternative statistical approach to address the shortcomings associated with the traditional factor analytic approach: (a) the choice of an accurate method for estimating the number of dimensions that underlie multivariate data; (b) a solution that allows for coherent dimensions; and (c) a method in which cross-loadings are explicitly taken into account.
Alternative Method of Analysis
A group of new techniques have been proposed that have their basis in a novel subfield of quantitative psychology called network psychometrics (Epskamp et al., 2018a, 2018b; for a review, see Briganti et al., 2024; Bringmann et al., 2022). Psychometric network models are used to estimate the relationships between multiple variables, where nodes (e.g., symptoms) are connected by edges (or correlations) that indicate the direction and strength of the associations between the variables (Epskamp & Fried, 2018). When defining dimensions, psychometric network models are generally exploratory in nature and do not rely on a priori assumptions, but instead develop an emergent structure based on the data; therefore, it is an ideal method to explore or re-evaluate the theoretical structure of a construct (e.g., Christensen et al., 2019). Network models are statistically consistent with factor models under certain conditions (Golino et al., 2020; Golino & Demetriou, 2017). Following the estimation of the network model, an algorithm can be applied to determine the presence of communities. Evidence suggests that the different techniques that have been advanced within the framework of network psychometrics have comparable or better accuracy in identifying the number of factors (dimensions) underlying multivariate data than traditional factor analytic methods (e.g., Cosemans et al., 2022; Garcia-Pardina et al., 2024; Golino et al., 2020; Golino & Demetriou, 2017; Golino & Epskamp, 2017; Markos & Tsigilis, 2024).
Another important advantage of network psychometrics is that the robustness of the model can be estimated using bootstrapping procedures, to provide information about whether the edges between nodes are accurate and whether differences in the number and strength of edges connected to a node are stable—statistical properties which directly influence whether the data are consistently organized in coherent dimensions or fluctuate between dimensional configurations (Christensen & Golino, 2021). Yet another advantage relates to the visualisation of network models (Bringmann & Eronen, 2018) by means of which the focus is shifted away from whole syndromes, factors or communities towards individual symptoms: network analysis allows one to easily visualise the unique connections between individual items/symptoms within and between communities and estimate their relative importance at both local (within community) and global (overall network) levels.
The present study used Clique Percolation (CP) which, compared to other community detection algorithms, has the added advantage of allowing nodes to be assigned to no, one, or multiple communities (e.g., Adamcsek et al., 2006; Blanken et al., 2018; Lange & Zickfeld, 2021). Thus, CP does not preclude nodes from being shared between multiple communities or from being assigned to no community if they are not sufficiently densely interconnected with other nodes.
Purpose of the Present Study
The present study was exploratory and data-driven in nature and had four purposes: (1) To determine a stable number of dimensional syndromes underlying the SCL-90-R using network psychometrics and CP algorithm on a combined sample of community subjects and psychiatric outpatients with varied diagnoses. To the best of our knowledge, this is the first study addressing network psychometrics on SCL-90-R-data in a sample that also comprises psychiatric outpatients, one of the target groups for which the instrument was originally intended. By combining patients with community subjects, the risks of restriction of range and extreme skewness are lessened. In addition, this approach would align with that of the Hierarchical Taxonomy of Psychopathology (HiTOP; Kotov et al., 2017) consortium that recommends sampling across the full spectrum, but oversampling from the higher end of the distribution, which the present sample allows, to study psychopathology. Moreover, the present outlook aligns with the transdiagnostic perspective which, superior to the categorical approach, has the potential to better represent the clinical and scientific reality of mental health problems (e.g., Dalgleish et al., 2020). (2) To determine the reliability of each symptom grouping using McDonald's omega (ω) and the mean inter-item correlation. (3) To understand the interrelationships between the SCL-90-R symptom groupings derived from network psychometrics. (4) As a preliminary test of the discriminatory power of each primary symptom grouping, the study also determined whether and to what extent the outpatients had meaningfully higher mean scale scores than the community subjects.
Method
Sample
The SCL-90-R data were drawn from three Dutch datasets: two psychiatric outpatients samples and one general community sample, all analyzed in prior research. All samples contained data from Dutch-speaking adults in the Netherlands. We used data from 574 individuals in outpatient sample 1 (Mosterman, 2020) and 821 from outpatient sample 2 (Janse et al., 2023) who, along with other measures, fully completed the Dutch SCL-90-R (Arrindell & Ettema, 2003) after their initial consultation at an outpatients mental health service, but prior to receiving any treatment. Participants in neither outpatient sample were selected based on any specific diagnosis, but individuals in the second outpatients sample were excluded if they had ‘severe psychiatric disorders’, which in Janse et al. (2023) was defined as those issues that required intensive care, such as psychotic symptoms, severe borderline personality disorder, severe developmental problems, or severe substance use problems. In spite of non-uniform professional practice contexts, patients were unselected, consecutive applicants for treatment.
The community sample (Jans-Beken et al., 2018) comprised 674 Dutch-speaking adults recruited via flyers, social media, email, and face-to-face contact, who fully completed the Dutch SCL-90-R, as part of an online survey.
The time-periods during which data were collected were as follows. For outpatient sample 1 (Mosterman, 2020): 2006–2018; for outpatient sample 2 (Janse et al., 2023): 2010–2015. The relevant time-period for the community sample (Jans-Beken et al., 2018) was not reported.
Overall, the combined sample consisted of 2,069 Dutch-speaking adults—including 1,395 psychiatric outpatients and 674 community subjects—all of whom had complete data on the SCL-90-R (see below).
The total sample comprised 1,345 (65.01%) females, and the mean age was 42.08 years (SD = 13.08, range=16–80). The psychiatric outpatients were, on average, 3.46 years younger than the community subjects (M = 40.95 years, SD = 12.49 versus M = 44.41 years, SD = 13.94, respectively), reflecting a small but statistically significant difference: t(1208) = –5.46, p < .001, d = 0.27. The proportion of men in the psychiatric samples was 6% lower (37.13% men, 62.87% women) than in the community sample (30.56% men, 69.44% women), although this difference did not reach the threshold for a small standardised effect size: χ2(1) = 8.33, p = .004, V = .06. A full breakdown of the primary DSM-IV (APA, 1994) diagnoses is available in Supplementary Table S1 (Arrindell et al., 2026). It should be pointed out that direct comparisons between the two outpatients samples in terms of diagnosis were not feasible due to different diagnostic practices across studies.
Instrument
For research purposes, all subjects completed the SCL-90-R anonymously. Each item was rated on five-points continua (0–4) ranging from ‘not at all’ to ‘extremely’. The “90” has been proposed to be scored and interpreted in terms of 9 primary a priori symptom dimensions: I Somatization, II Obsessive-Compulsive, III Interpersonal Sensitivity, IV Depression, V Anxiety, VI Hostility, VII Phobic Anxiety, VIII Paranoid Ideation, and IX Psychoticism. The standard time set reference given to make a response to each item is “7 days including today” (e.g., Derogatis, 1977).
The combined dataset is publicly available (Arrindell et al., 2025).
Prior to data analysis, missing data were handled by excluding any individuals without complete responses to all SCL-90-R items as follows: 70 individuals in outpatients sample 1 had missing data for all items (574/644 participants included); 22 individuals in outpatients sample 2 had 1–2 missing items (M = 1.14; 821/843 participants included); and 32 individuals in the community dataset had missing data for all SCL-90-R items (674/706 participants included).
Data Analysis
Aim 1: Network Psychometrics
Network estimation
Statistical analyses were conducted using R version 4.3.2. We used the bootnet package (Epskamp et al., 2018a) to estimate a network model with the 90 individual items from the SCL-90-R as nodes. Given the positive skew of certain items (e.g., low-base rate symptoms such as psychoticism), we opted to estimate a Gaussian graphical model (GGM) based on Spearman's rank-order correlations. GGMs are a type of network model in which nodes are connected by undirected edges (i.e., do not specify directional associations), representing partial correlation coefficients. These coefficients indicate the conditional or unique relationship between two nodes (i.e., two SCL-90-R items), after controlling for all other connections in the network (i.e., shared associations with all other 88 items). Prior to network estimation, we used the ‘goldbricker’ function from the networktools package (Jones, 2022) with default settings to assess potential inter-item redundancy or multicollinearity among the SCL-90-R items. This procedure identified no pairs of items exhibiting excessive similarity in their correlation patterns, indicating adequate distinctiveness across all items.
We employed the ‘ggmModSelect’ algorithm, a non-regularised method for estimating GGMs that does not shrink any parameter estimates to zero, as regularisation methods do. This algorithm selects the optimal model from 100 estimated models based on the extended Bayesian information criterion, a measure of model fit (Isvoranu & Epskamp, 2023). Non-regularised methods are well-suited for data with low dimensionality (i.e., when the sample size greatly exceeds the number of nodes), large samples of n ≥ 600, and dense networks with many edges, which are common in models of psychopathological symptoms (Isvoranu & Epskamp, 2023; Johal & Rhemtulla, 2023; Williams et al., 2019). To assess the accuracy and stability of the estimated network, we utilised bootstrapping procedures available in the bootnet package (Epskamp et al., 2018a). The accuracy of the estimated edge weights was specifically assessed using non-parametric bootstrapping with 2,500 resamples (and producing 95% CIs). The stability of the centrality estimates was specifically evaluated via case-dropping bootstrap analysis, conducted with 2,500 bootstrapped samples across 10 levels, dropping between 5% and 75% of participants (and examining correlations with the values estimated on the full sample), as suggested by Epskamp et al. (2018a). It should be pointed out that for our primary analyses, sample size was not determined a priori, and no a priori power analysis was conducted. Instead, we utilzed the recommended bootstrapping procedures to evaluate the robustness and interpretability of the estimated networks. These provide favourable information on the precision of the edge weigths and the stability of centrality estimates.
Global community structure
We assessed the global ‘centrality’ of each node in the network model, representing the relative statistical influence of each SCL-90-R item within the overall network. Among the various available centrality indices, we focused on the 1-step expected influence (1EI), which is particularly suited for psychological networks and accounts for negative associations between nodes. These negative associations can occur in GGMs when shared variance between otherwise positively related symptoms is removed. The 1EI metric is calculated as the non-absolute sum of edge weights or partial correlation coefficients (including negative signs) directly connected to a node.
Symptom community detection
Beyond evaluating the global centrality of symptoms, our primary goal in using network psychometrics was to explore the dimensional structure of the SCL-90-R (Aim 1). For this purpose, we employed the Clique Percolation (CP) algorithm, which identifies clusters or ‘communities’ of nodes densely connected with one another and more weakly associated with nodes assigned to other communities (Farkas et al., 2007). Unlike other community detection methods, CP is well-suited to psychopathology research because it allows for nodes to belong to multiple communities, reflecting the overlap of symptoms seen across different psychiatric disorders (Cramer et al., 2010). However, it is also possible for some nodes to remain unassigned to any community.
Using the CliquePercolation package in R (Lange, 2021), we applied this overlapping community detection technique to the network of SCL-90-R items. This process involved identifying optimal values for two parameters, k and I, which are primarily concerned with the number of nodes and strength of the edges between the nodes forming a community, respectively. For four fixed values of k (3, 4, 5, and 6), we systemtically searched in increments of .005 through ranges of I from .01 to .46, with the maximum value of .46 corresponding to the strongest edge weight in the network of SCL-90-R items. The optimal value of I over this range was determined based on the rule that, as I increases, we should extract the solution for which the ratio threshold crosses to values above 2 (the point just above the emergence of a giant community), preferably accompanied by a large χ2 value (i.e., the variance of the community sizes after excluding the largest community). We compared the results for the optimal I value at each value for k, choosing a solution that appeared clinically meaningful, conceptually coherent, and provided the richest community structure, aiming to avoid a giant, indistinct community that would obscure the details of smaller communities while simultaneously preventing too large a number of small separate communities. For further details on the CP methodology, refer to Lange (2021).
Local structure analysis
To analyse the local structure of the SCL-90-R network in the overall sample, we considered the edge weights of connections symptoms had within and between their communities, following the novel approach proposed by Blanken et al. (2018). This procedure involved re-calculating the 1EI for each symptom. However, instead of calculating centralities at the global level (i.e., taking into account all symptoms at once), we now assessed them at the local level. For each symptom assigned to a community, we calculated two indices: the ‘stabilising index’ and the ‘communicating index’. The stabilising index is the non-absolute sum of edge weights directly connecting a node to other nodes within the same community. Symptoms with high stabilising indices may be considered core symptoms of a problem area, as they have numerous and/or strong connections within their community. The communicating index, on the other hand, is the non-absolute sum of edge weights connecting a symptom to symptoms within different communities. Symptoms with high communicating indices have many and/or strong connections to other communities, and in some cases, may even be assigned by CP to belong to two or more communities, thereby potentially playing an important part in connecting symptoms between problem areas. Symptoms that rank highest on global centrality (see section on Global community structure) may differ from those with the highest local centrality.
Network visualisation
We visualised the network in two-dimensional space using the qgraph R package (Epskamp et al., 2012). Nodes were depicted as circles, and edges connecting the nodes were shown as lines. Positive edges were displayed in blue, while negative edges were displayed in red. The thickness and saturation of the edges were scaled to indicate the magnitude of the Pearson's correlation coefficients, with thicker and more saturated edges representing stronger conditional associations between nodes. To enhance interpretability, we applied a cut value of .20 and a minimum value of .05. This meant that edges with absolute weights below .05 were omitted, while those with weights between .05 and .20 were all displayed with the smallest width (i.e., the scaling did not apply below .20). The layout of the nodes in space was determined using the Fruchterman-Reingold algorithm, which arranges more interconnected nodes together and nearer to the centre of the network (Fruchterman & Reingold, 1991).
Aim 2: Reliability of Symptom Groupings
We applied a unidimensional confirmatory factor model (CFA) to each set of SCL-90-R items that formed a symptom community. We assessed the factor-based reliability of each community using McDonald's (1999) omega (ω) reliability coefficient, with ω ≥ .70 considered adequate (McNeish, 2018) and the lower-bound set at .50 (e.g., Gu et al. [2020] consider values lower than .50 to be ‘marginal’). Because larger communities will trend towards having larger ω values, we also calculated the mean inter-item correlation as an alternative measure of item homogeneity, adjusting for differences in community size. According to Briggs and Cheek (1986), mean inter-item correlations should not be too low, i.e., below .10 (heterogeneous), nor too high, well above .50 (redundant). The corresponding figures were calculated for outpatients and community subjects separately and for the pooled sample of subjects.
Aim 3: Interrelationships among Symptom Groupings
We created scores for the SCL-90-R symptom communities by summing the raw responses for items assigned to each community. We estimated a second GGM using the same methodology as before. However, instead of using all individual SCL-90-R items, we used the sum scores for each symptom community identified by CP. This allowed us to examine the conditional associations between different symptom communities or problem areas, providing insights into the potential higher-order structure of the SCL-90-R.
Aim 4: Discriminatory Power of the SCL-90-R Symptom Communities
Lastly, as a preliminary test of the discriminatory power of the identified SCL-90-R symptom communities, independent-samples t-tests were used to compare mean scores between psychiatric outpatients and community subjects. Cohen's effect size d (Cohen, 1992) was employed to quantify the magnitudes of statistically significant differences between group means. For purposes of interpretation, Cohen (1992) considers d = .20 ‘small’, d = .50 ‘medium’, and d = .80 ‘large’. Given the samples were not matched on gender or age, associations between symptom communities and covariates (gender, age) were first examined; group differences in symptom scores were then re-restimated using linear regression with sample type (outpatients vs. community subjects) as a predictor of symptom scores. Two models were compared: one unadjusted, and one additionally adjusted controlling for gender and age conjointly; differences in statistical significance and effect sizes (comparison of rs and semi-partial rs) were assessed.
This fourth aim involved a large number of tests, which increased the risk of obtaining positive results on the basis of chance alone. To counteract this risk, the Bonferroni inequality (Grove & Andreasen, 1982) was employed. This involved choosing an overall α and dividing this by the number of tests (k) to be conducted to result in an individual level of significance [or working α] (α i ) for each test. In the present study, α overall = 0.20, to take a big risk of type 1 error, so as to find relationships to investigate further in subsequent research. In case the data fell into small subsets (gender or age associations), each of which could be treated as a separate family of hypotheses (i.e., k = 13 communities), the Bonferroni inequality was applied separately to each family (αi = 0.20/13 = 0.015).
Sensitivity Analyses
Two sensitivity analyses were performed. Firstly, SCL-90-R network structure was re-estimated using a regularised approach (specifically, using the EBICglasso estimator) to examine whether we could recover a similar dimensional structure as that obtained with ggmModSelect. Secondly, all analyses for Aims 1–3 were repeated in a subsample restricted to the 1,395 psychiatric outpatients (i.e., excluding the community subjects). While methods are available to statistically compare network structures, these comparisons focus on the overall network density and any significant differences in edge weight rather than the presence of sub-structures or communities. Therefore, we qualitatively compared the SCL-90-R dimensional structure obtained through network psychometrics using the combined sample versus psychiatric outpatients only. We repeated the analyses for any unique symptom communities identified in the outpatient-only network.
Results
Aim 1: Dimensional Structure of the SCL-90-R Using Network Psychometrics
Bootstrapping procedures confirmed that the accuracy of the estimated edge weights and the stability of the global centrality estimates for the network model of SCL-90-R items were high (see Supplementary Appendix 1). In this model, 1,075 out of 4,005 possible edges (26.84%) were estimated as non-zero, meaning they were present in the network. Of these non-zero edges, the mean edge weight (i.e., conditional Spearman's correlation between symptom pairs) was .05 (SD = .05). The strongest positive association was between Item 64, “Awakening in early morning” and Item 66, “Sleep restless/disturbed” (ρ = .46), while the strongest negative association was between Item 19, “Poor appetite” and Item 60, “Overeating” (ρ = –.28). The remaining 2,930 possible edges were absent from the network, suggesting that some symptoms were statistically independent of each other (i.e., could be explained by shared relationships with other symptoms) or too weak to be included.
Symptoms varied in their estimated global centrality, or level of statistical influence within the overall network (see Figure 1). Symptoms with a 1EI value at least one SD above the mean, reflecting a greater number and strength of positive connections with other nodes, included: Item 71, “Everything an effort” (raw 1EI = 1.30), Item 30, “Blue” (raw 1EI = 1.27), Item 55, “Trouble concentrating” (raw 1EI = 1.27), Item 34, “Feelings easily hurt” (raw 1EI = 1.21), Item 66, “Sleep restless/disturbed” (raw 1EI = 1.19), Item 79, “Worthlessness” (raw 1EI = 1.18), Item 57, “Tense/keyed up” (raw 1EI = 1.18), Item 61, “Uneasy when people watching/talking” (raw 1EI = 1.17), Item 33, “Fearful” (raw 1EI = 1.17), Item 31, “Worrying too much” (raw 1EI = 1.16), Item 51, “Mind going blank” (raw 1EI = 1.15), Item 58, “Heavy in arms/legs” (raw 1EI = 1.14), and Item 18, “Cannot trust people” (raw 1EI = 1.13).

Global centrality estimates in the network of SCL-90-R items, based on the combined sample of psychiatric outpatients and community subjects (n = 2,069).
We then applied CP, an overlapping community detection approach, to this network of SCL-90-R items to analyse its dimensional structure. Examination of the ratio threshold and χ values suggested several possible optimal configurations of the k and I parameters (see section on Symptom community detection), including k = 3 and I = .100, k = 3 and I = .105, k = 3 and I = .110, k = 4 and I = .060, k = 4 and I = .065, k = 4 and I = .090, and k = 5 and I = .045. After reviewing the community structures generated by each configuration, we selected k = 3 and I = .110 as the final solution. These parameters produced meaningful, interpretable, and distinct communities, avoiding the formation of a large, indistinct giant community and excessive fragmentation into numerous small groups. Other configurations were deemed less optimal, often resulting in giant communities (e.g., containing 71 items), unclear and hard-to-interpret groupings (e.g., mixing depressive, obsessive-compulsive, interpersonal, and paranoia-related symptoms), or too many nodes shared across multiple communities, undermining their distinctiveness (e.g., 55 shared nodes). The chosen solution is shown in Figure 2.

Lower-order network structure of the SCL-90-R items using the combined sample of psychiatric outpatients and community subjects (n = 2,069). Each colour represents one of 13 symptom communities detected by CP, with white items being those not assigned to any community. Some items were assigned to two symptom communities, indicated by two colours. Cut = .20, minimum value = .05. Blue lines indicate conditional positive associations, while red lines indicate conditional negative associations.
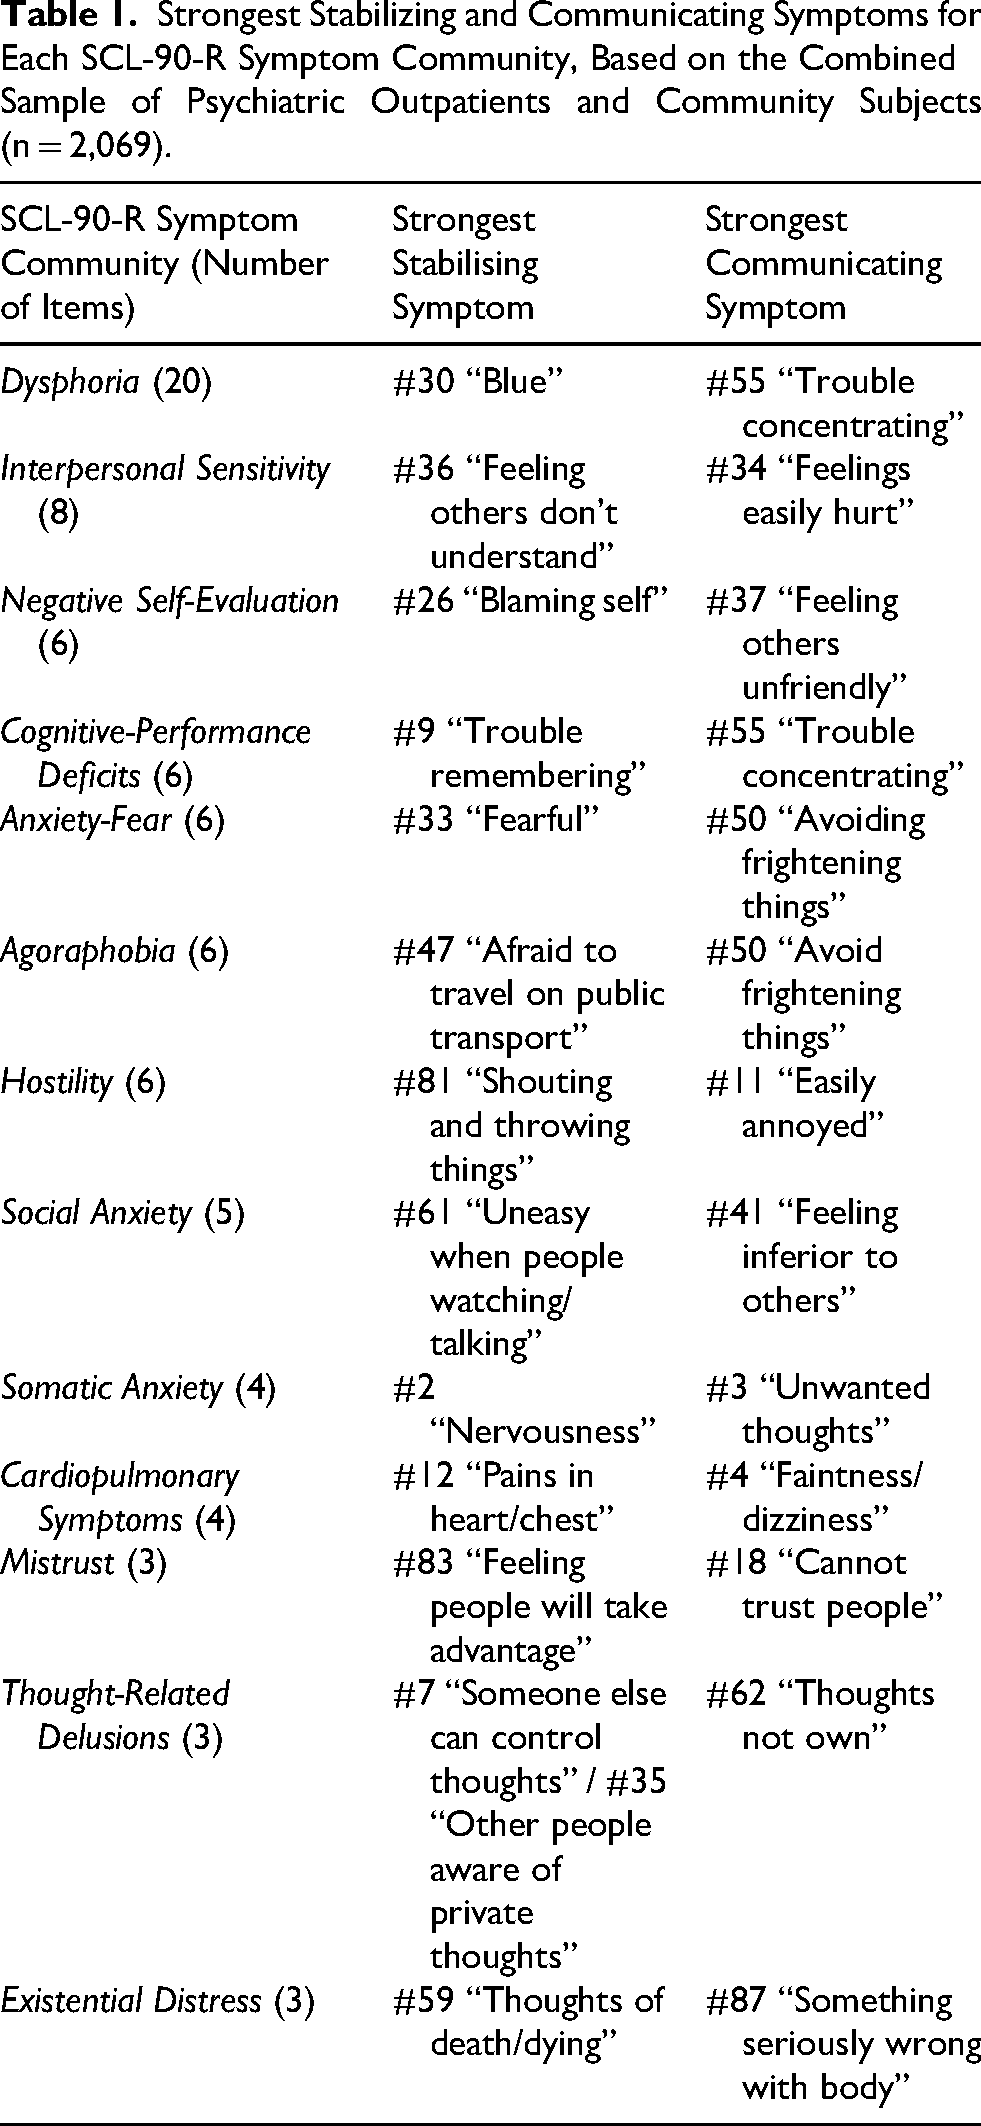
According to this solution, the dimensional structure of the SCL-90-R has 13 distinct but interrelated symptom communities, each comprising between 3 and 20 items. We labelled these communities Dysphoria, Interpersonal Sensitivity, Negative Self-Evaluation, Cognitive-Performance Deficits, Anxiety-Fear, Agoraphobia, Hostility, Social Anxiety, Somatic Anxiety, Cardiopulmonary Symptoms, Mistrust, Thought-Related Delusions, and Existential Distress. Nineteen items remained unassigned, not fitting clearly into any community. A full list of items assigned to each community, shared nodes, and isolated nodes can be found in Supplementary Table S2. Table 1 details the strongest stabilising and strongest communicating symptom for each community.
Strongest Stabilizing and Communicating Symptoms for Each SCL-90-R Symptom Community, Based on the Combined Sample of Psychiatric Outpatients and Community Subjects (n = 2,069).
For transparency, Supplementary Table S3 presents the results from alternative CP parameter configurations that were considered but not selected as the final network solution.
Aim 2: Reliability of SCL-90-R Symptom Communities
We assessed the reliability, or internal consistency, of the 13 SCL-90-R symptom communities identified through network psychometrics, for the total sample and for psychiatric outpatients and community subjects separately. The factor-based reliabilities of all symptom communities were adequate (i.e., ω ≥ .70), in both samples, except for Thought-Related Delusions, Mistrust and Existential Distress (ωs: .61–.69), also in both samples, albeit sufficient, as these were three of the communities with the fewest items (i.e., 3 items). The mean inter-item correlations also indicated that the symptom communities were neither too heterogeneous nor too homogeneous in their item composition (range = .33–.52). Table 2 gives a survey of the relevant figures for the pooled sample of subjects. Since corresponding figures were very similar across psychiatric outpatients and community subjects, these were summarized in Supplementary Table S4.
Omega Reliability Coefficient and Mean Inter-Item Correlation for Each SCL-90-R Symptom Community, Based on the Combined Sample of Psychiatric Outpatients and Community Subjects (n = 2,069).

Note: Omega coefficients were calculated from unidimensional confirmatory factor analysis models estimated with maximum likelihood; 95% confidence intervals around these reliability estimates were derived from 1,000 bootstraps. Inter-item correlations were calculated using Spearman's rank-order correlation to account for the skewed distribution of some items.
Aim 3: Interrelationships Between the SCL-90-R Symptom Communities
Supplementary Table S5 presents the zero-order Spearman correlations (below the diagonal) and partial Spearman correlations (above the diagonal) between the 13 primary communities. The zero-order correlations displayed a positive manifold, with all communities correlating positively (.23–.78). The partial correlations removed the general variance that would otherwise be extracted in a second-order factor analysis. Correlated factors imply the potential existence of higher-order factors.
To explore the potential higher-order structure of the SCL-90-R, we next estimated another GGM using the 13 symptom communities instead of all 90 individual items. Figure 3 presents the resulting higher-order network structure, and Figure 4 illustrates the global centrality of the symptom communities within this structure. Dysphoria, Interpersonal Sensitivity, and Anxiety-Fear emerged as the most central dimensions in the higher-order structure, while Thought-Related Delusions and Hostility were the least central. Visual inspection of this network suggested three clusters of symptom dimensions with strong conditional associations: (1) Agoraphobia, Anxiety-Fear, Existential Distress, Somatic Symptoms, and Cardiopulmonary Symptoms; (2) Dysphoria, Cognitive-Performance Deficits, and Somatic Symptoms; (3) Negative Self-Evaluation, Social Anxiety, Interpersonal Sensitivity, and Mistrust. These clusters were interpreted as Panic-Anxiety with Agoraphobia, Depression, and Interpersonal Difficulties, respectively.

Higher-order network structure of the 13 SCL-90-R symptom communities, based on the combined sample of psychiatric outpatients and community subjects (n = 2,069). Items in boxes indicate those symptoms assigned by CP to two communities, helping drive a stronger conditional association between those communities. Cut = .20, minimum value = .05. Blue lines indicate conditional positive associations, while red lines indicate conditional negative associations.

Centrality estimates in the higher-order network of the 13 SCL-90-R symptom communities, based on the combined sample of psychiatric outpatients and community subjects (n = 2,069).
Aim 4: Discriminatory Power of the SCL-90-R Symptom Communities
Table 3 gives the results of statistical comparisons between the community and outpatients samples on each of the network analysis-derived SCL-90-R symptom communities, with corresponding group means and standard deviations.
Survey of Comparisons between Outpatients and Community Subjects on Each Symptom Community; and Associations of SCL-90-R Symptom Communities with Sample Type, Age, and Gender (n = 2,069).

Note: Significant associations after Bonferroni adjustment (i.e., p < .015) are indicated in bold. Gender was coded as men = 0 and women = 1.
Associations based on the total sample of indiviuals between gender and age on the one hand and the 13 symptom groupings on the other hand are also reported in Table 3. Significant associations after Bonferroni adjustment (i.e., p < .015) can be summarized as follows. Women scored higher than men on Negative Self-Evaluation and Social Anxiety, while men scored higher than women on Cognitive-Performance Deficits and Existential Distress. In addition, younger adults had higher average scores than their older counterparts on 9 out of 13 symptom groupings, including Dysphoria, Interpersonal Sensitivity, Negative Self-Evaluation, Cognitive-Performance Deficits, Anxiety-Fear, Hostility, Social Anxiety, Somatic Anxiety, and Thought-Related Delusions.
Based on the findings in Table 3, it can be concluded that psychiatric outpatients had significantly higher symptom distress scores on all community groupings (ts > 8, ps < 0.001, Cohen's ds: 0.34–1.19). Twelve out of 13 ds reflected (practically) medium to very large magnitudes of effect in standard deviation units. Using multiple regression to adjust for gender and age showed that these demographic factors did not appreciably affect the direction and strength of the between-group differences. Thus, sample type (outpatients versus community subjects) remained a highly significant predictor of symptom scores (all p-values still <0.001), with an average 5.78% reduction in the strength of association after adjusting for gender and age (based on comparison of rs and semi-partial rs).
Sensitivity Analyses
Using regularised network estimation (EBICglasso), we could recover a dimensional structure that closely mirrored the original non-regularised solution (ggmModSelect), again supporting a 13-community configuration (with CP parameters k = 3 and I = .100) as a plausible representation of the SCL-90-R item network. Only a small number of items showed shifts in their primary or overlapping community assignments. Specifically, Item 9 (“Trouble remembering”) shifted from Cognitive-Performance Deficits to Dysphoria, while Items 26 (“Blaming self”) and 69 (“Self-conscious”) retained their original community memberships (Negative Self-Evaluation and Social Anxiety, respectively) but gained additional overlap with Dysphoria. Item 37 (“Feeling others unfriendly”) was no longer part of Negative Self-Evaluation, whereas Item 46 (“Difficulty making decisions”) remained in Cognitive-Performance Deficits but now also overlapped with Negative Self-Evaluation. Item 55 (“Trouble concentrating”) remained assigned to Dysphoria but was no longer linked to Cognitive-Performance Deficits; and Item 2 (“Nervousness”) stayed within Somatic Anxiety while also overlapping with Anxiety-Fear. Finally, Item 3 (“Unwanted thoughts”) remained assigned to Dysphoria but lost its overlap with Somatic Anxiety; and Item 43 (“Feeling watched/talked about”) stayed in Interpersonal Sensitivity but additionally overlapped with Mistrust. The other communities – including Interpersonal Sensitivity, Agoraphobia, Hostility, Social Anxiety, Cardiopulmonary Symptoms, Thought-Related Delusions, and Existential Distress – remained entirely unchanged, and the same 19 items continued to function as isolated nodes, suggesting that the underlying dimensional configuration was highly stable across regularised and non-regularised estimation approaches.
Furthermore, when analyzing data from only the 1,395 psychiatric outpatients, the dimensional structure was largely the same, similarly producing 13 communities but with a few differences in the content of these communities. See Supplementary Appendix S2 for the output and discussion of this sensitivity analysis.
Discussion
The SCL-90-R 9-dimensional a priori structure (Derogatis, 1977) has been shown to be far from stable across studies, samples, statistical methods, nationality and language. The large majority of the over a dozen alternative SCL-90-R dimensional structures published in the literature were based on factor analysis. Their structural validities, for having confidence in their application in clinical and applied practice, were questioned in the present study on the basis of uncertainties in relation to the extraction of a trustworthy number of underlying factors, lack of replicability, and sensitivity to potential bias due to meaningful cross-loadings. It was deemed unlikely that additional factor analytic investigations would produce an acceptable settlement of the SCL-90-R dimensionality issue. In spite of the fact that methods based on factor analysis have a long tradition in the field for identifying the correct number of factors in multivariate data, which is fundamental to psychological measurement, such approaches have recently been challenged by methods based on network psychometrics (Christensen et al., 2024).
Clique Percolation (CP), which is based on network psychometrics, addresses the relevant limitations. After having yielded a network of partial correlations using Gaussian Graphical Modeling, CP was applied for detecting clusters of strongly connected constructs, or communalities, in a network that would equate the number of latent dimensions (Golino & Epskamp, 2017). Bootstrapped procedures, as a viable alternative for carrying out an a priori power analysis in order to determine sample size on an a priori basis, showed that the edge weights/partial correlations and the node centralities were accurate; and that the node centralities were stable, thereby pointing to the robustness of the dimensional structure comprising 13 communities that mirrored 13, in terms of omega, sufficiently reliable latent factors often identified in factor analysis: Dysphoria, Interpersonal Sensitivity, Negative Self-Evaluation, Cognitive-Performance Deficits, Anxiety-Fear, Agoraphobia, Hostility, Social Anxiety, Somatic Anxiety, Cardiopulmonary Symptoms, Mistrust, Thought-Related Delusions, and Existential Distress. These communities were also demonstrated to differentiate psychiatric outpatients from community subjects in the predicted direction, even after holding constant the influences of gender and age.
A number of observations are further worth noting.
(1) CP identified sufficiently reliable short forms of two measures of severe psychopathology that were appended to the Hopkins Symptom Checklist (HSCL; Derogatis et al., 1974) in the process of constructing the SCL-90-R, namely Psychoticism and Paranoid Ideation. When SEM procedures were employed in two Greek student samples, Gomez et al. (2021, Tables 4 and 5) found that both dimensions vanished from the SCL-90-R, due to loss of salient loadings and inadequate internal consistencies [ω<.4]; and Gomez et al. (2024b) rejected a multifactorial model which included Psychoticism and Paranoid Ideation in favor of an alternative model which excluded such measures of severe psychopathology. Apparently, these dimensions are difficult to recover in their original forms with SEM procedures (Gomez et al., 2021, 2024a, 2024b). However, with CP, Thought-Related Delusions and Mistrust emerged as short forms of Psychoticism and Paranoid Ideation, respectively.
(2) In line with previous factor analytic studies (Lignier et al., 2024), a pure measure of Agoraphobic avoidance behaviour was found. This is in line with DSM-5-TR (APA, 2022) that presently diagnoses agoraphobia independently of panic disorder, as many individuals with agoraphobia do not experience panic disorder. Reflecting the fact that in some cases agoraphobic and panic symptoms co-occur, Agoraphobia, Anxiety-Fear, Existential Distress, Somatic Anxiety, and Cardiopulmonary Symptoms (which also captures the essential symptom of faintness/dizziness) formed a broader Panic-Anxiety with Agoraphobia community. This was based on visual inspection of the conditional associations between 13 primary communities. This cluster is clearly in line with Westphal's classical description [1872] of Agoraphobia (see Kuch & Swinson, 1992).
(3) Also based on visual inspection, a complex Interpersonal Difficulties cluster was inferred that reflected several elements described in the theoretical literature (Boyce & Parker, 1989; Marin & Miller, 2013) as constituting core features of interpersonal sensitivity, which broadly can be defined as ongoing concerns about negative social evaluation. The core features identified with CP included rejection sensitivity, shyness, social anxiety, feelings of personal inadequacy and inferiority, negative self-evaluation, self-consciousness and negative expectancies concerning communication and interacting with others. In addition, Mistrust, one of the maladaptive schemas which has been shown to correlate with both internalizing and externalizing symptoms (e.g., Rotenberg & Fonseca, 2024) was also found to be included in the relevant cluster. The three items contained by the Mistrust dimension were originally from the Derogatis a priori Paranoid Ideation dimension, as it is its core feature, also in subclinical populations.
(4) ‘Feeling blue’ emerged as the strongest stabilizing symptom in Dysphoria, which contributed to interpreting this community as such. This is in line with the observation from a meta-analysis of networks of major depressive disorders that demonstrated that ‘depressed mood’ occupied a critical role (Ma et al., 2022; Malgaroli et al., 2021). In addition to ‘feeling blue’ and ‘having no interest in things’, somatic symptoms are core components of the depressive syndrome (e.g., Simon et al., 1999), as are factors that influence cognitive challenges, such as difficulty concentrating, indecisiveness, impaired memory, and slower processing speed (e.g., Pan et al., 2019). Inferring from visual analysis, a complex Depression community captured these elements by incorporating Dysphoria with Cognitive-Performance Deficits and Somatic Anxiety. It should be pointed out that the primary Hostility community had its strongest conditional association with Dysphoria. This suggests that Hostile depression may have been an alternative naming for the complex Depression community.
(5) The complex communities described through visual inspection were based on a within-measure analysis. These complex communities made sense. Two have been identified in previous studies in higher-order interbattery analyses, i.e., scale-level factor analyses (EFA with Varimax rotation) involving SCL-90-R subscales and subscale measures from other instruments: Hostile depression and Panic with agoraphobia in clients treated for adjustment disorders (Arrindell et al., 2004); and Agoraphobia with panic in psychiatric inpatients (Arrindell et al., 1990, Study 8). In addition to SCL-90-R subscales, the Arrindell et al. (1990) study also included measures that assess depression, state and trait anxiety, phobic avoidance, and difficulty and distress in assertiveness. It should be pointed out that the first study to identify a strong connection between Panic-Anxiety and Agoraphobia using network analysis was described by Kendler et al. (2022). Kendler et al. applied network analysis on interview ratings of a large population-based sample of 7514 adult twins to lifetime panic disorder ratings that were added to a network of 21 lifetime phobic fears (which included phobic stimuli related to blood-injection, social-agoraphobia, situational aspects, and animal-disease). Kendler et al. (2022) observed that the three strongest connections with panic symptoms were specifically with agoraphobic fears: being in crowds, going out of the house alone, and being in open spaces.
(6) The essential difference between the primary dimensions and the (inferred) higher-order dimensions is that the primary dimensions are concerned with narrow areas of generalizability where the accuracy is great. The higher-order dimensions reduce accuracy for an increase in the breadth of generalization (Gorsuch, 1983, p. 240). Both can be administered to obtain data on symptomatic status at initial patient interview and used for patient reported outcome (to monitor treatment progress). For use in research and in clinical and applied practice, Briggs and Cheek (1986) recommend using a higher-order measure only in conjunction with its constituent parts or the primary dimensions solely, as the sole use of a higher-order measure could mask the performance of its constituent elements.
(7) Evidence of replicability of results is critical for creating a warrant that findings are noteworthy. Wendt et al. (2023), Fan et al. (2024), Gomez et al. (2024a), (2024b) have argued that SCL-90-R scales could be mapped onto the HiTOP to foster cummulative research and further the understanding of psychopathology structure. Based on the classical literature on frustration (see Minamoto et al., 2014) and direction of hostility [punitivity] (e.g., Caine et al., 1967) that describe extrapunitive reactions as those in which one directs one's aggression toward the external environment (as opposed to toward oneself), the two least central dimensions in the visual alignment were, in nature, clearly Extrapunitive or Externalizing dimensions. Their establishment suggests that SCL-90-R Hostility could be located in the HiTOP Antagonistic Disinhibited Spectrum and SCL-90-R Thought-Related Delusions in the HiTOP Thought Disorder Spectrum. While having emerged as primary clusters in CP, based on visual inspection of the conditional associations between 13 primary communities, Somatic Anxiety and Cardiopulmonary Symptoms overlapped with both complex Depression and complex Panic with agoraphobia at an alleged higher level. Thus, for the time being, it may be concluded that the remaining 11 (non-extrapunitive) primary measures could all be allocated to the HiTOP Internalizing Spectrum.
Conclusion and Future Directions
The findings of this investigation suggest that the SCL-90-R measures 13 replicable and reliable primary constructs, namely Dysphoria, Interpersonal Sensitivity, Negative Self-Evaluation, Cognitive-Performance Deficits, Anxiety-Fear, Agoraphobia, Hostility, Social Anxiety, Somatic Anxiety, Cardiopulmonary Symptoms, Mistrust, Thought-Related Delusions, and Existential Distress. Visual inspection of the conditional associations between these 13 primary communities suggested the possibility of three higher-order factors: Panic with agoraphobia, Depression, and Interpersonal difficulties. Robustness and interpretability of the estimated network were assessed with bootstrapping procedures, which provide information on the precision of edge weights and the stability of centrality estimates.
Two limitations need to be addressed. First, an independent sample is needed in a further study to confirm that the assumed three-dimensional higher-order composition is indeed supported by confirmatory analysis. Independent replication is also important because, while network analysis offers several advantages, like factor analysis, it is not a purely data-driven process. Instead, network analysis and the CP algorithm also depend on active methodological choices made by the researchers, such as selecting the k and I parameters, which can influence results. Another important motive for carrying out an independent (overall) confirmation of the present findings is that Fokkema and Greiff (2017) have shown through a simulation study that researchers should refrain from performing exploratory and confirmatory analyses on the same dataset as this yields high risk of overfitting. Overfitting produces unreliable results, that should be avoided. Second, even though a sensitivity analysis suggested that the present findings were not appreciably affected by pooling community subjects with psychiatric outpatients (see Supplementary Appendix S2), a further independent study is also needed to confirm that the presently described primary dimensions are measurement invariant across both subsamples. It cannot be assumed, unless measurement invariance has been empirically demonstrated, that a score on the SCL-90-R means the same thing in different groups (Derogatis & Cleary, 1977; Fischer & Rudnev, 2024). The main goal of such an analysis in different groups (Joshanloo, 2022) is to determine whether the items of a measure have the same factor structure, the same units of measurement (factor loadings), and the same item means (intercepts). Only if all of these parameters are similar across groups can we claim that the relevant scale measures the same construct across those groups. Replicability, sensitivity, and measurement invariance are three distinct processes of analyses. Moreover, it should be pointed out that measurement invariance qualities must be fulfilled before further studies can move on to establish criterion, concurrent or predictive validity (for relevant major issues, see Fischer & Rudnev [2024]).
Supplemental Material
sj-docx-1-pac-10.1177_18344909261436152 - Supplemental material for Dimensional Structure of the Symptom Checklist-90-R: A Network Analysis with a Combined Clinical and Community Sample
Supplemental material, sj-docx-1-pac-10.1177_18344909261436152 for Dimensional Structure of the Symptom Checklist-90-R: A Network Analysis with a Combined Clinical and Community Sample by Willem A Arrindell, Jai Carmichael and Begoña Espejo in Journal of Pacific Rim Psychology
Footnotes
Acknowledgements
We are indebted to Ineke Mosterman, Pauline Janse and Lilian Jans-Beken for making their raw data files available for the purposes of the present study. The support by Điệp Ngô-Xuân, Dean of the Faculty of Psychology of Vietnam National University in Ho Chi Minh City, Vietnam, too is gratefully acknowledged.

Ethical Approval and Informed Consent Statement
The findings presented in this article are based on a secondary analysis of pre-existing data derived from three previously published studies. In line with the Netherlands Code of Conduct for Research Integrity, all participants provided consent for the anonymous use of their data for research purposes.
Funding
The authors received no financial support for the research, authorship, and/or publication of this article.
Declaration of Conflicting Interests
The authors declared no potential conflicts of interest with respect to the research, authorship, and/or publication of this article.