
Abstract
The exceptionally dynamic nature of financial markets presents market analysts, investors, and researchers from a wide range of industries with a multitude of opportunities. Maximizing profits is the primary objective of investments in the financial markets. An individual engages in the buying and selling of securities on the financial marketplace known as the stock market. Because of this, the complex nature of the endeavor, which demands a thorough understanding of a multitude of interconnected elements, forecasting stock prices for publicly traded companies operating in the securities sector can be challenging. A multitude of determinants influence the stock market, encompassing political, economic, and societal aspects. Advancements in technology and artificial intelligence offer investors a more dependable alternative. This research provides a novel model that combines the CatBoost approach with the Marine Predators Algorithm strategy to tackle many difficulties efficiently. The hybrid model outperformed the other models in this research for both efficiency and performance. The investigation examined the predictive power of a proposed framework for predicting stock prices using Google stock data from January 1, 2015, to June 29, 2023. The Friedman Chi-square, P-value, and cross-validation were used to evaluate the proposed method. Additionally, the performance of the proposed model for the additional four markets, DAX, FTSE, HSI, and SSE, was evaluated and it achieved
Introduction
Shares of publicly listed companies are available for purchase and profitable sale on the stock market by both retail and institutional investors. Since the stock market reflects corporate performance and the business environment, It is a crucial sign of the general economic health of a nation.1,2 To assess stocks and spot lucrative possibilities, traders and investors employ a range of techniques. Numerous approaches have been constructed as well as assessed to understand the fundamental variables influencing stock valuation. The study of stock price behavior has fascinated the interest of investors. This subject was studied by Fama in 1965, and it is now a hot topic in finance and has greatly influenced in understanding of stock price behavior. 3 The dynamic and constantly shifting nature of the stock market creates problems for analysis. Due to the inherent attributes of the market, which include noise, chaos, dynamism, non-linearity, non-stationarity, and nonparametric properties. 4 Based on these attributes, analysts cannot correctly analyze and predict price fluctuation. From such attributes, it appears that conventional statistical techniques are inadequate to carry out an effective equity market assessment. The researchers have, therefore, developed various machine learning and artificial intelligence methodologies that can overcome these obstacles and increase the stock market forecast accuracy. In this regard, machine learning methodologies have been able to handle nonlinearities, chaos, noise, and other complexities of stock market data with far more efficiency compared to traditional time series methods, thereby resulting in higher levels of accuracy in forecasting. 5 It has thus, become a selection method for historical investigation in many industries nowadays.6,7
In ensemble learning, various machine learning models are combined to improve the efficiency by reducing errors and increasing the precision. 8 The idea is that this generally leads to better accuracy and reliability than any one model might give by recombining the outputs of many models using different feature sets and techniques. The “boosting” machine learning technique trains several models sequentially, with each subsequent model attempting to highlight and emphasize the shortcomings of its predecessor. Boosting works well for both classification and prediction tasks, in that this may increase the accuracy of weak models. Widely used ensemble learning methods are the extreme gradient boosting XGBoost and light gradient boosting machines LGBM due to their efficiency. Extreme gradient boosting adopts a depth-based tree partitioning scheme. In contrast, LGBM uses a leaf-based tree partitioning scheme, hence making it faster to compute.9,10 Another efficient machine-learning algorithm published in the year 2018 is called CatBoost. 11 The CatBoost algorithm is an efficient gradient-boosting technique that is aimed at working effectively in scenarios involving categorical features. One of the main advantages of CatBoost is its peculiar way of converting categories into numbers without the need for special preprocessing. Therefore, it may model data directly using category features and not have to resort to traditional techniques of label coding, hot coding, and other preprocessing typical in most other algorithms. CatBoost uses various complex and very effective strategies. It involves several methods, one of which is a gradient-based one-hot encoding scheme to change the categorical data into integers, and ordered boosting to optimize decision tree layout. 11
The popularity of applying machine learning methodologies within the stock market has grown recently because it can efficiently analyze large volumes of data and reveal patterns often invisible to the human eye. Keep in mind that the efficiency of these strategies would heavily depend on how their parameters were set up at the very beginning. Poor initializations lead to unreliable predictions and results. 12 Hence, before integrating the AI models into the process, one of the most important activities should be a deep evaluation of the selection of the initial variables. Accordingly, to overcome these limitations, several optimization algorithms can be applied: MPA- Marine Predators Algorithm, 13 ALO (ant lion optimization), 14 BBO (Biogeography-based optimization), 15 BRO (battle royale optimizer), 16 among others. BBO 15 is used to emulate how animals move to find favorable situations that will make their survival possible. The more ideal solutions within a given population of solutions correspond to the most wanted environments, the less ideal to the most unwanted habitats. 15
Decomposition in general is the breaking down of a complex problem into more manageable parts. It represents the methodology to solve complex, larger-scale problems by dividing them into simpler subproblems; each can be processed independently. The Complete Ensemble Empirical Mode Decomposition is a new adaptive signal processing approach that offers effective error reduction in signal reconstruction with an increase in the efficiency of the signal decomposition process for the same number of signals considered. 17
It proposes the implementation of a hybrid model through the introduction of CEEMD-MPA-CatBoost, which demonstrated a remarkable degree of accuracy in the prediction of stock prices. The following different models have been assessed in this work: CatBoost, CEEMD-CatBoost, CEEMD-BRO-CatBoost, CEEMD-ALO-CatBoost, and the CEEMD-BBO-CatBoost.
Relevant related works are introduced in Part 2. The material and methods are settled in Part 3 including model and optimizers. Data collection, decomposition, and assessment metrics are specified in Part 4. Part 5 presents the study's conclusions and analysis. In the subsequent part, the conclusions of the investigation are provided as well as juxtaposed with those stemming from alternative methodologies.
Related works
SVM and linear regression were used by B. Panwar et al. to forecast stock prices; they found that linear regression is superior to SVM for stock market analysis. 18 To forecast the closing prices of the Egyptian Exchange (EGX), E.H. Houssein et al. used a hybridized approach that combines the equilibrium optimizer (EO) with the support vector regression (SVR) method. 19 Long short-term memory with CatBoost was used by Mousavi et al. 20 to forecast the Tehran stock market. Financial hardship has been predicted using the CatBoost algorithm, and Zhao et al. 21 collected the dataset from the Google stock price from January 1, 2015, to June 29, 2023. Using information from the final-market order book and closing auction of 200 NASDAQ stocks, J. Huang created four forecasting models: LightGBM (LGB), XGBoost (XGB), CatBoost (CBT), and a weighted fusion model. 22 The goal of the study was to find out how well these four models did at making predictions about the same thing. Y Sun and L Tian utilized the future financial time series up-down trend as the target for forecasting. They used the stock history data attribute value as the subject of their research. They employed a deep machine learning method, specifically the combination model of LSTM and CatBoost optimized by the Bayesian algorithm, to predict the fluctuations in stock prices. 23 Six ensemble learning strategies were conducted and analyzed by X Wei et al., for predicting the direction of stock indices. These techniques include four boosting methods (CatBoost, LightGBM, XGBoost, and GBDT), one bagging method (RF), and one tree-structured machine learning method (DT). The Shanghai Composite Index was selected for experimental assessment. 24 R Xu et al. utilized trend types obtained from clustering price series at various time scales, together with the day-of-the-week impact, to create a specific combination of features. 25 The CatBoost algorithm is utilized for training and forecasting based on historical data from six Chinese stock indices. Using data from the Chinese A-share market during the previous eight years, J Ni et al. applied stock dividend theory to identify thirteen major determinants. To make predictions, they constructed three ensemble models: XGBoost, LightGBM, and CatBoost. 26 B Gülmez investigated the application of LSTM (Long Short-Term Memory) neural networks in forecasting stock market values, taking into account the substantial potential profits that the stock market presents despite its inherent risks. 27 The LSTM model, renowned for its efficacy in managing time series data, was utilized in conjunction with the ARO (Artificial Rabbits Optimization algorithm) to optimize hyperparameters and enhance prediction accuracy.
Methods and materials
Catboost
CatBoost is constructed using gradient-boosting algorithms and decision-tree frameworks.11,23 The boosting strategy amalgamates many suboptimal prediction models to construct a singular, superior model that surpasses the performance of a single decision tree model. Decision trees are used in the process of gradient boosting, where each tree is trained to learn from the errors made in the preceding iteration. This iterative approach helps to reduce errors, as seen in Figure 1. Adding additional models to the mixture iteratively continues until the selected loss function can no longer be minimized. CatBoost innovatively builds decision trees in contrast to traditional gradient-boosting models. It may generate useful “oblivious trees,” since all nodes at the same level test the same predictions under the same conditions. To choose the data that will be used to fit

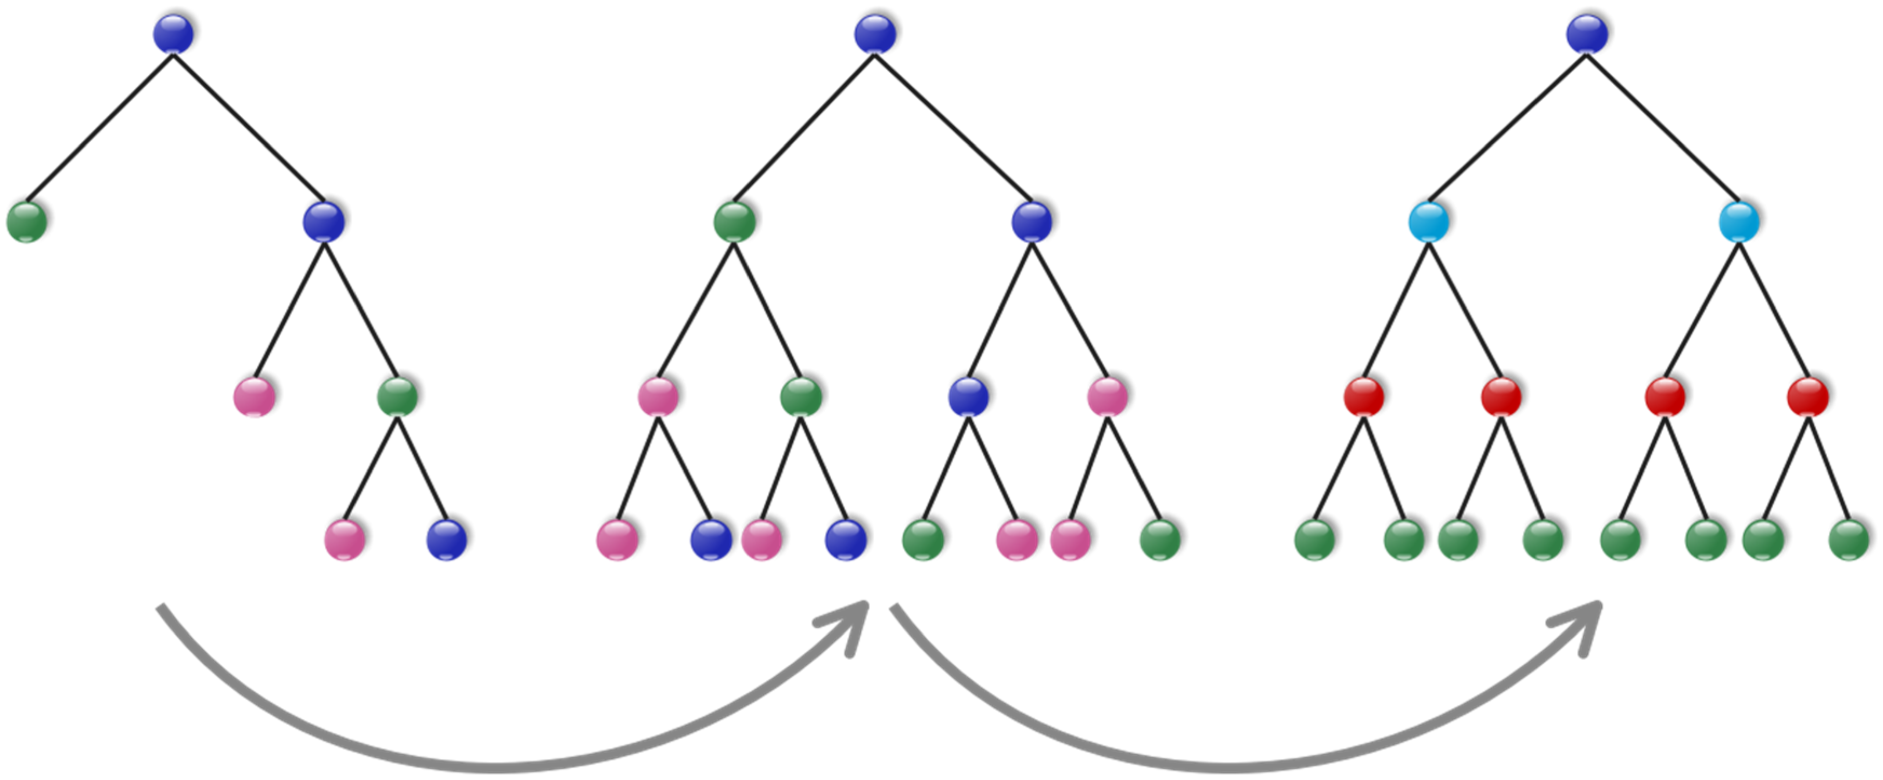
The structure of the CatBoost's trees.
The ALO algorithm is a method derived from biology that emulates the predatory behaviors that are intrinsic to ants and ant lions. At each stage, this population-dependent method generates a set of potential solutions. In the first segment, an initial ant population is established to address the given issue. The ALO algorithm significantly enhances solutions.
14
It is possible to simulate the movement of an ant using the subsequent equation,
28
under the assumption that its trajectory mirrors the general region in which it searches for sustenance.


The terms


Following other metaheuristics, MPA is a population-based approach where the first trial solution is evenly spread throughout the search space.
13
The illustration of MPA is mentioned in Figure 2.

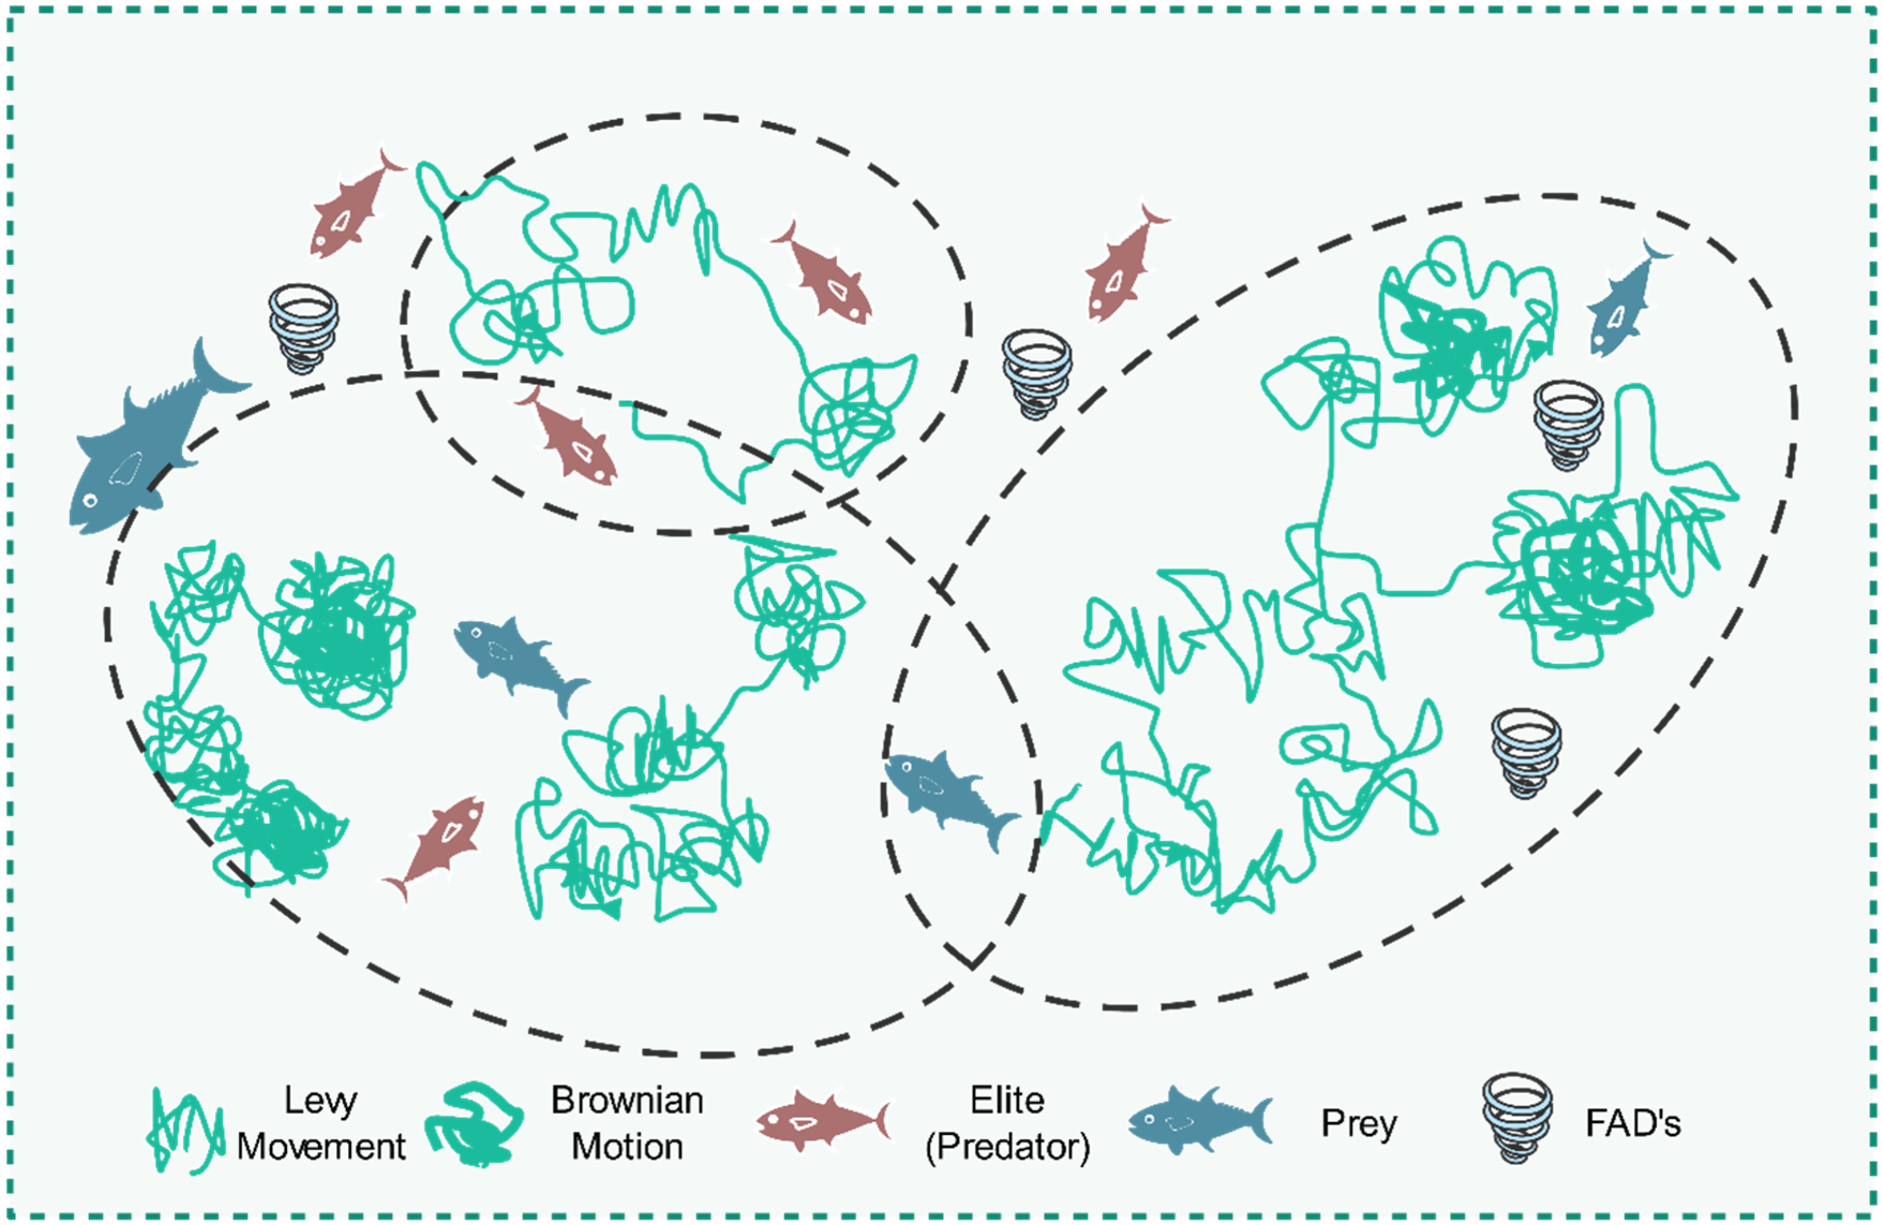
The illustration of MPA.
A uniform random vector with a range of 0 to 1 is called a rand, and the lower and upper bounds of the variables are represented by the symbols
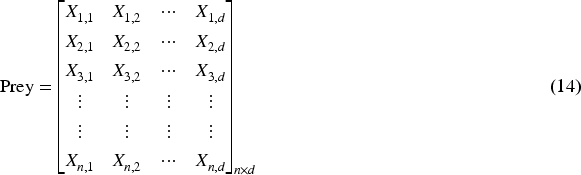
In line with the survival of the fittest theory, the most proficient foragers in the natural world are the top predators. Consequently, the most optimal solution is designated as the predator to assemble a matrix known as Elite. This matrix's arrays are responsible for seeking as well as locating the prey using the positional information.

Prey is an additional matrix of the same dimensions as the Elite that is utilized by predators to adjust their positions. To put it simply, initialization generates the initial prey, from which the predator selects the most suitable individual to form the elite. The Prey is portrayed in the following manner:
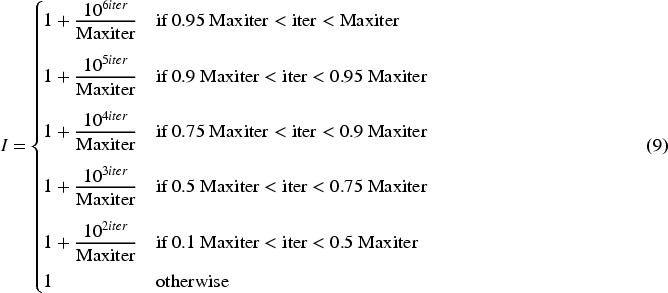
First phase: When the predator is moving quicker than the prey or when the velocity ratio is high. Early on in the optimization process, when exploration is crucial, this situation arises. In an elevated ratio of speeds
The second phase: occurs when the hunter and prey coexist traveling at the same rate, or in a unit velocity ratio. It appears as though they are both in pursuit of their quarry. This segment transpires in the phase of optimum change, wherein the exploration process endeavors to temporarily transform into exploitation. Both exploration and exploitation are significant during this phase. Thus, 50% of the total population is allocated for exploration activities, while the remaining half is devoted to exploitation. Prey is accountable for exploitation and the predator is responsible for exploration during this phase. If the prey is moving in Lévy concerning the unit velocity ratio


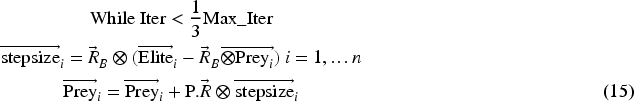
Phase 3: When the predator's speed exceeds that of the prey, or when the velocity ratio is small. This phenomenon takes place at the ultimate phase of the optimization process, which is commonly associated with a remarkable ability for exploitation. The most effective technique for predators when the velocity ratio is modest is Lévy. The presented form of this phase is:

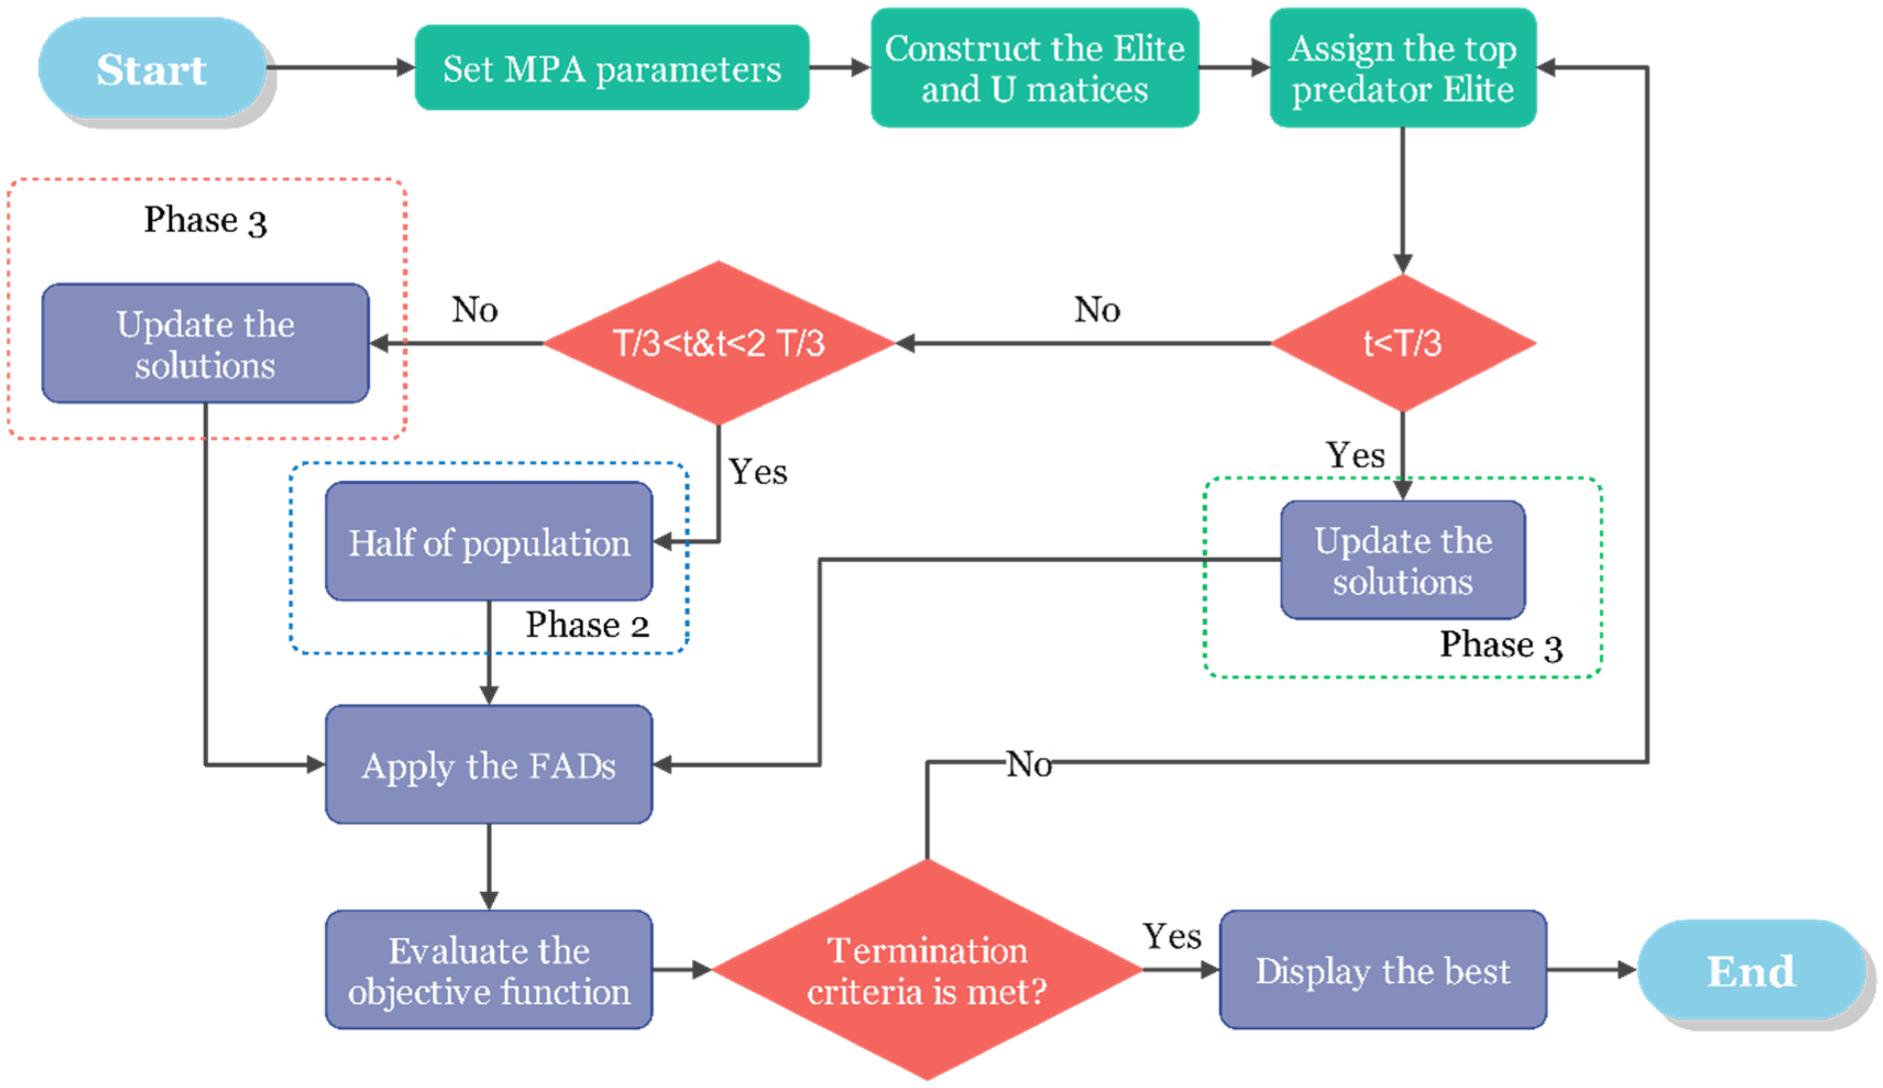
The framework of MPA.
The BRO refers to a meta-heuristic method that was suggested by Farshi.
16
The program drew inspiration from a well-recognized multiplayer online game whereby participants are required to destroy adversaries to locate a secure refuge for their survival. Venturing outside the designated safe zone inside the game exposes the player to potential harm or elimination.
16
The calculation of the injury rate for the player who sustained damage is determined by the use of the equation presented herein:


The equation given denotes the upper limit and lower bound in a d-dimensional problem space, denoted as


The use of BBO is a method that replicates the movement patterns of animals as they seek out environments that are conducive to their survival.
15
In this approach, the answer to an optimization issue is metaphorically likened to a home. The solutions that are considered most ideal correspond to the habitats that are most sought after, while the less ideal solutions correspond to the habitats that are least desired, within a given population of solutions, which is displayed in Figure 4. Through the process of exchanging their characteristics, the habitats that possess more desirable attributes attract those environments that are less favorable. Certain operators facilitate the process of sharing these qualities. Migration is a phenomenon whereby individuals relocate from one habitat to another, driven by the desire to improve their circumstances. This movement is influenced by the rates of immigration, which refers to the influx of individuals into a particular habitat, and emigration, which pertains to the departure of individuals from a given habitat. A superior solution yields a higher emigration rate compared to an inferior one since it signifies the introduction of species into a given environment. The inferior solution exhibits a higher rate of immigration compared to the superior solution since it quantifies the number of species leaving a given environment. The below equations are used to calculate the rates of immigration (


A schematic representation illustrating the process of species migration into a more advantageous ecological setting.
The emigration rate of the

The flowchart of BBO.
This investigation utilized Google's daily stock data. This dataset spans from January 1, 2015, to June 29, 2023, and includes essential financial metrics for each trading day. In the initial period (January 2015), Figure 6 illustrates the data collection process by depicting the first and last five days of the collected data. During the initial days of January 2015, the stock price was observed to fluctuate moderately between 25 $ and 26 $. On these days, the trading volume fluctuates between approximately 2.9 million and 6.7 million shares. This signifies a period of relative stability in the stock's trading pattern. Contrary to the recent period (June 2023), the stock's price levels have experienced a substantial increase in the last five days of June 2023, with an opening price of approximately 117 $ to 122 $. This suggests that the stock value has experienced significant growth over the years. The trading volume in June 2023 exhibits a more noticeable fluctuation, with numbers ranging from approximately 1.9 million to 3.0 million shares. Data points to be used in the analysis, based on the stock price trend over time, are highlighted below:
Open Price: The price of Google stock at the opening of trading for the day. It gives an insight into what market sentiment was in the beginning of the day. High Price: The highest price at which Google's stock traded at any point in the day. This metric is useful to determine peak performance and volatility that the stock has seen in the trading session. Low Price: This is the lowest price at which the stock of Google traded during the day. The value will be important to ascertain the lowest point of market sentiment and demand during the day. Close Price: The price at which the stock finally traded when the market closed. This is a very important reference point in trying to gauge the daily performance of the stock and finds extensive use in most financial analysis and investment techniques. Volume: It represents the amount of shares traded in a day. Trading volumes of stocks are essential to understand such notions as liquidity, investors’ activity, and general interest in this security in the market.
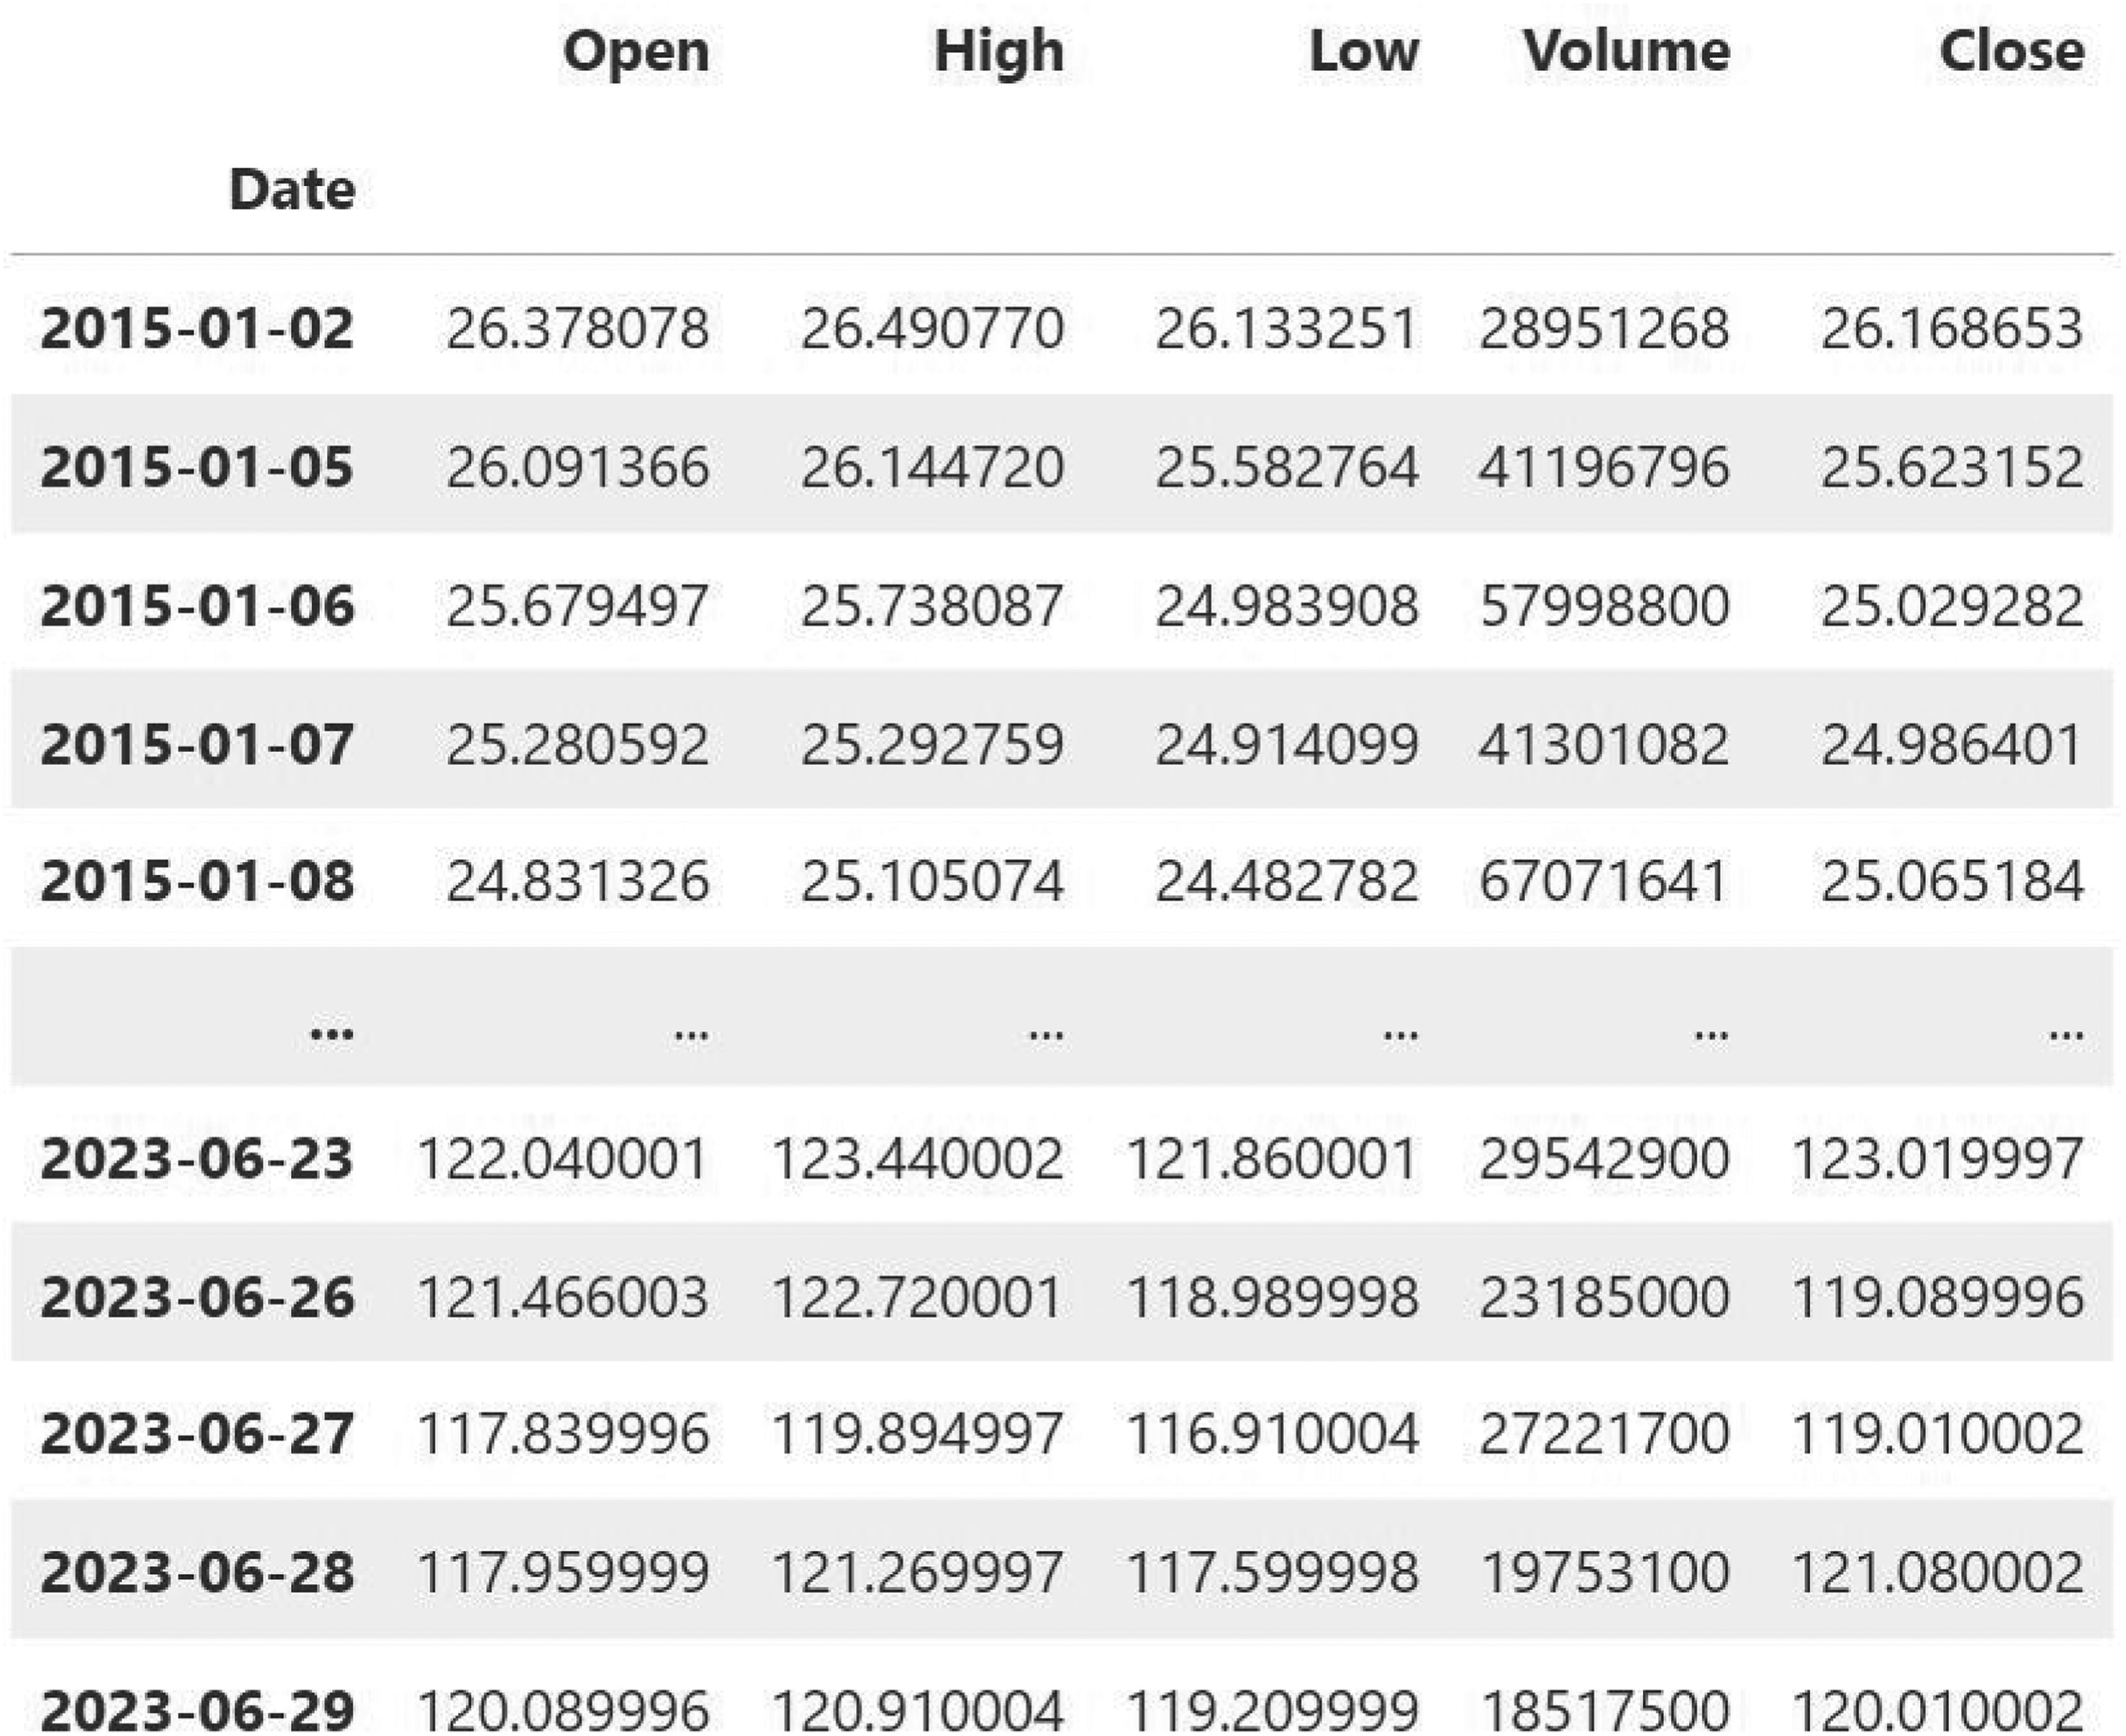
First and last five days of the collected data.
This gives a complete understanding of how the stock does at different times of the trading day by portraying important investor and market sentiments. Trading volume, along with open, high, low, and close prices, remains a key component of technical analysis. These highs and lows, put together with the relation between the open and close, are very telling about what was happening with market sentiment throughout the day, and what investors did throughout the day. By following this information's time course, one can evaluate long-term trends, identify patterns, and understand seasonal influences of stock prices.
This Figure 7 pair plot, studying the stock trading of Google, brings nuance into daily market behavior by showing how the closing price relates to the other trading metrics: Open, High, Low, and Volume. Each of these correlations adds invaluable insight at market close into the dynamics that affect the prices of stocks. From this point, it follows that the strongly positively correlated closing price with the opening price demonstrates a great dependence of the closing price on opening values. This pattern may suggest that initial market sentiment often prevails throughout the day and days with small differences between these two metrics are usually a reflection of the calm conditions in the market. As in the case of the Close price with high and low price relationships, they are indicative of the daily price range and market sentiment of the stock. In the case of a close clustering of data points near the diagonal in the Close against High plot, for instance, it indicates that days that were marked by strong bullish sentiments within the stock's market saw the stock close near its peak. By comparison, the Close against Low plot shows that the closing price of the day is close to the low of the day, which often signals bearish trends because of the proximity of the relationship to the diagonal. Conversely, the resiliency or recovery within a trading day is reflected by how far closing prices have come off the lows for the day, as in points well above the diagonal. A less clear relationship exists between the closing price and trading volume. This trend reflects that there is no steady effect on the stock's closing price from the volume of shares traded. The volume is an important key but, taken alone, will not necessarily create a change in the closing price. This is because higher volumes of trade do not always creating a higher or lower closing price. This could mean that for instance, volumes that are higher on days when prices surge higher may show intense buying pressure, while the same volume on days of flat or lower prices may suggest selling pressure or distribution.

The correlation and impacts of the features.
For this work, the period from January 1st, 2015, to June 29th, 2023, is selected as representative for the trends in the market between stable and turbulent phases. The historical data available during this period was sufficient to train and test models with satisfactory performance. However, the results may be influenced by particular limitations that are inherent to the selected period.
Utilizing a relatively short dataset may diminish the model's ability to accurately represent long-term market cycles or broader economic trends, which frequently exceed a decade. As a result, the model becomes more susceptible to short-term fluctuations, and its capacity to produce accurate long-term predictions is diminished. Conversely, the model's relevance to prevailing market conditions will be diminished by the abundance of outdated information that will be present in longer-term data. The impact of recent critical events, such as technological shifts or global economic changes, may also be diminished.
Given that some of these are concerns and to facilitate generalization, a 10-fold cross-validation technique was implemented. To mitigate the risk of overfitting, this implies that the performance of this model would be assessed using at least a few subsets of data. The model's predictions must remain reliable over time.
Following the data collection, the collected features underwent thorough data processing stages as follows:
Data Cleaning: Cleaning the data is one of the first steps in preparing a dataset for analysis. This step aims at locating and handling invalid or missing values in such a way that the quality and integrity of the dataset are ensured. Data Normalization: It is a crucial activity that has to do with the preparation of data for machine learning algorithms. It involves scaling of the data so that each feature provides an equal contribution in the analysis, hence an efficient performance and convergence of learning algorithms. The Min-Max Scaling used in this study could transform data into a fixed range, generally in the range of [0, 1]. This can be done using the following equation:
Data splitting: Preprocessed data was then divided into two different classes for the better performance of the models. This model has used a splitting strategy where 20 percent of the data was kept for testing and validation, while the remaining 80 percent was used for training purposes. The main goal of this segment was to create a tradeoff between the need to have a lot of data to build into training, while on the other hand, providing a considerable, anonymous dataset that could be availed to extensive testing and validation.

Chiefly, the CEEMD decomposition represents a new adaptive signal processing algorithm contributing to the radical decrease of signal reconstruction error and significantly increasing the efficacy of signal decomposition simultaneously.
17
The steps for the decomposition in CEEMD follow:
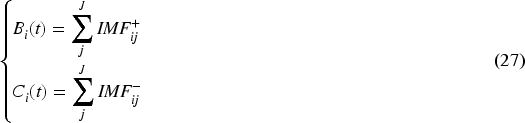
To generate the new signals EMD decomposition is conducted on P times are devoted to repeating Steps (1) and (2).
The multicomponent quantities are subjected to integrated averaging.
Signal S(t) that has been reconstructed is:
The decompositions of Features are covered in Figure 8.


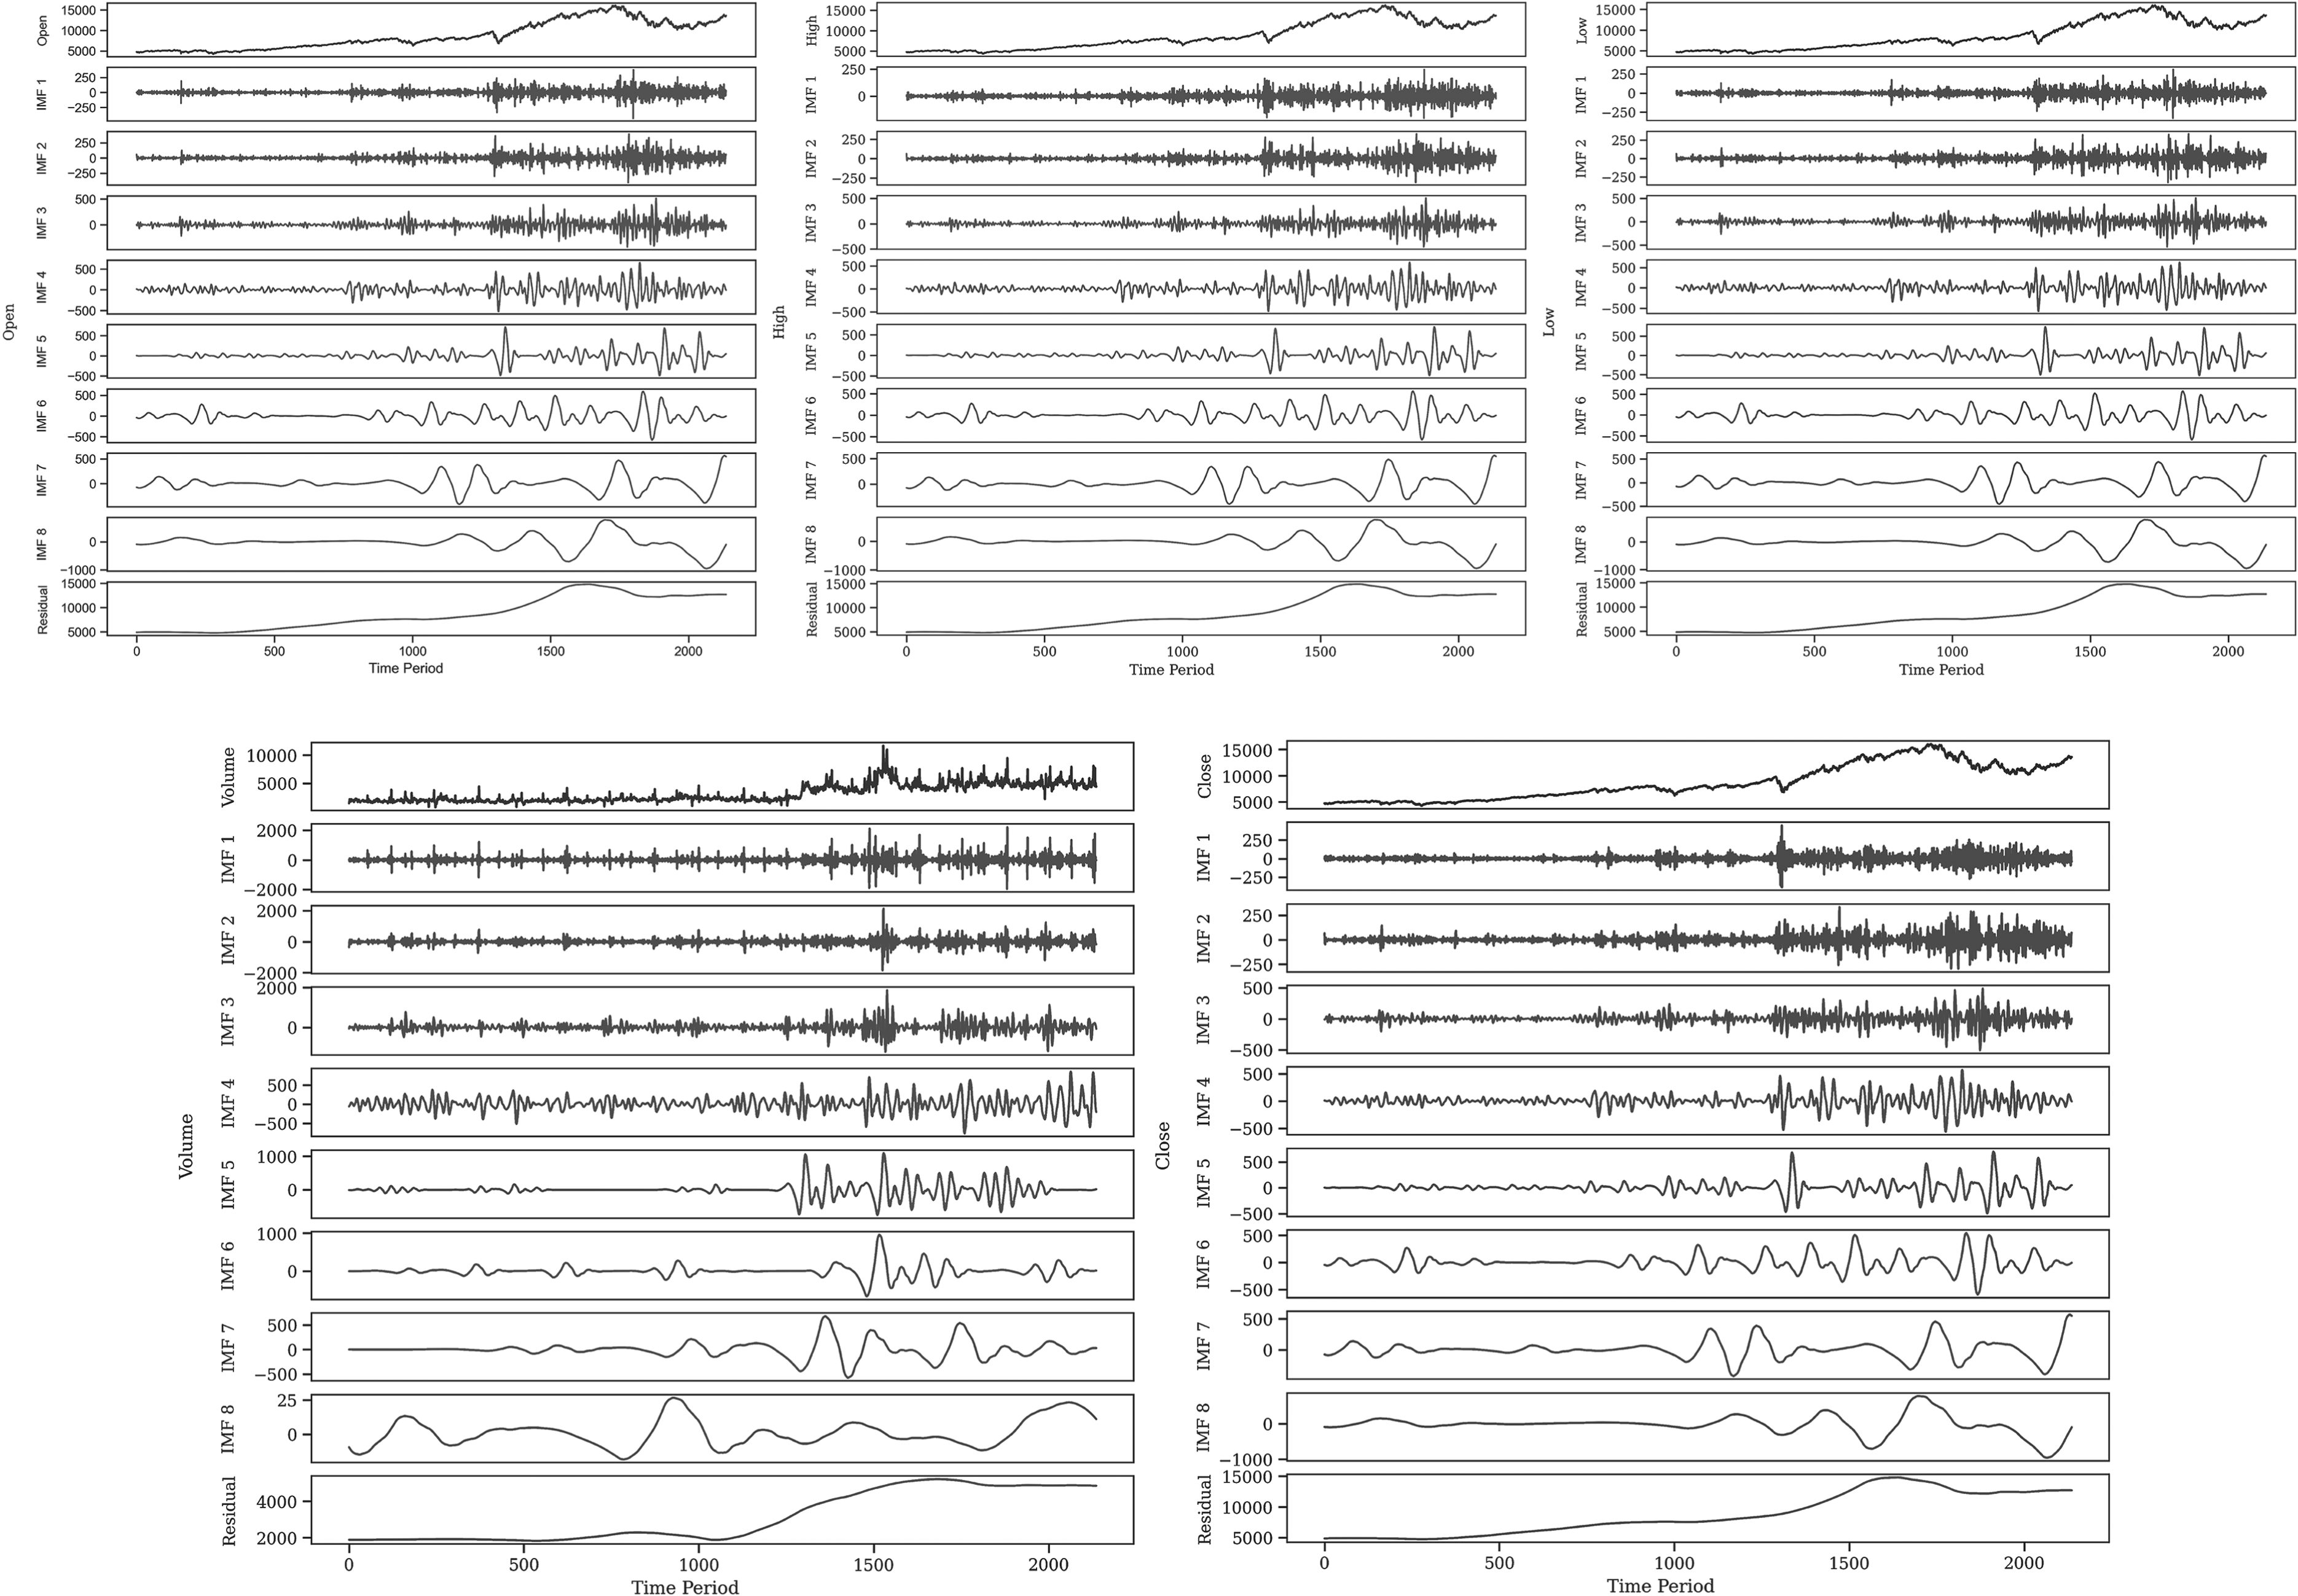
The decompositions of variables by CEEMD.
The proposed framework employs a structured approach to the analysis and prediction of stock prices, utilizing a combination of advanced data decomposition, optimization techniques, and machine learning, to predict the stock market, as illustrated in Figure 9. The CEEMD is implemented during the initial phase to meticulously decompose the stock market features—open, high, low, and close prices, as well as trading volume—into some IMFs following data collection and preparation. This approach is particularly well-suited for managing the non-stationary and non-linear characteristics of financial time series data. The MPA is implemented to optimize the hyperparameters of the predictive model after decomposition. MPA, which is motivated by the dynamic hunting strategies of marine predators, is exceptional at navigating intricate problem spaces to determine the most effective parameters for model training. In this context, MPA modifies the hyperparameters of the CatBoost model, including the number of trees, learning rate, and tree depth, to optimize the model for the decomposed stock market data's characteristics. Its final stage uses the optimized CatBoost model to forecast the future price of Google stock prices. Consequently, CatBoost uses decomposed and optimized features for the prediction of the company's future stock price. This is further refined by the MPA optimization in light of the subtle patterns and trends uncovered from the decomposition carried out in the CEEMD. This framework is all-encompassing and would guarantee that maximum potential is extracted from the given stock market data, which can act as a strong tool to provide valid and reliable forecasts concerning the stock market.
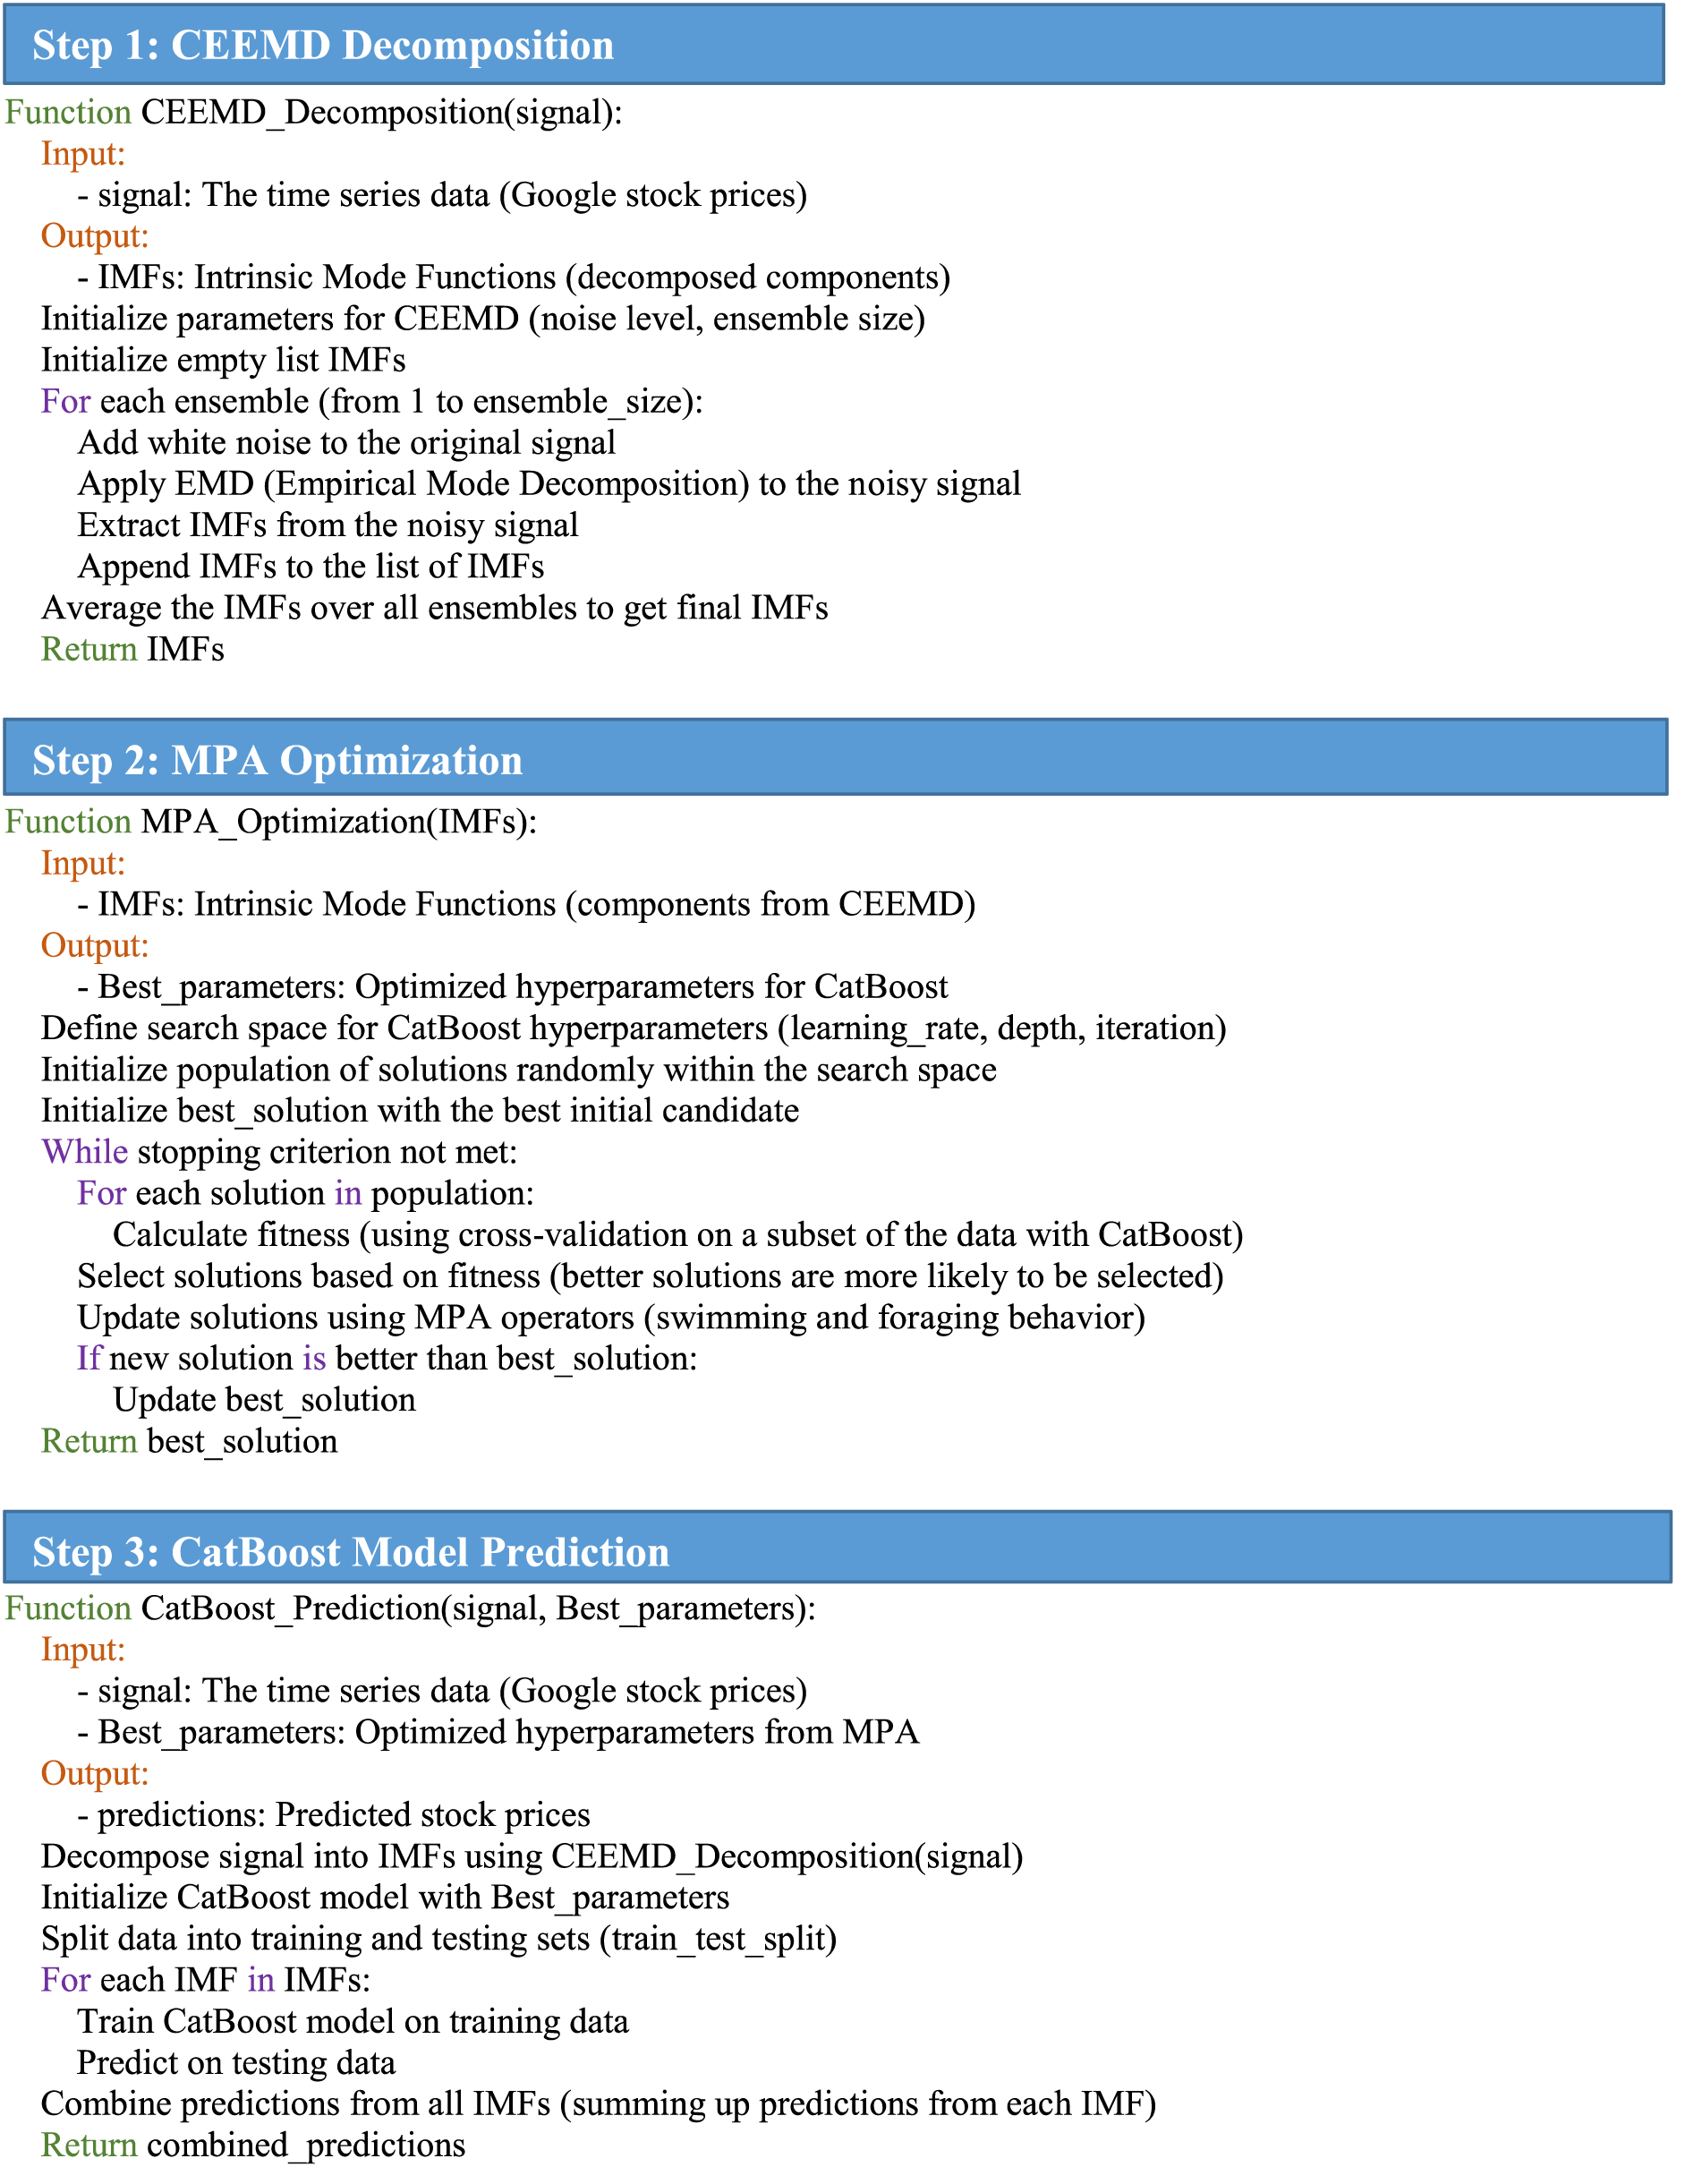
Overall algorithm of the proposed framework.
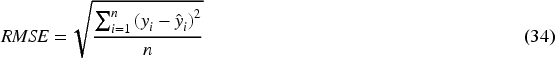
Several performance measures were applied to assess the accuracy of future predictions. The formulation of these criteria was done with utmost care to ensure that any evaluation of reliability and accuracy in the forecast is holistic. During the assessment of the result, other indications were considered. Assessment criterion methodologies that have been used in the investigation include MAPE, representing the mean absolute percentage error; MSE, representing the mean square error; RMSE, representing the root mean square error; and MAE, representing the mean absolute error. These provide substantial support when it comes to assessing the precision within forecasting models.


Statistical values
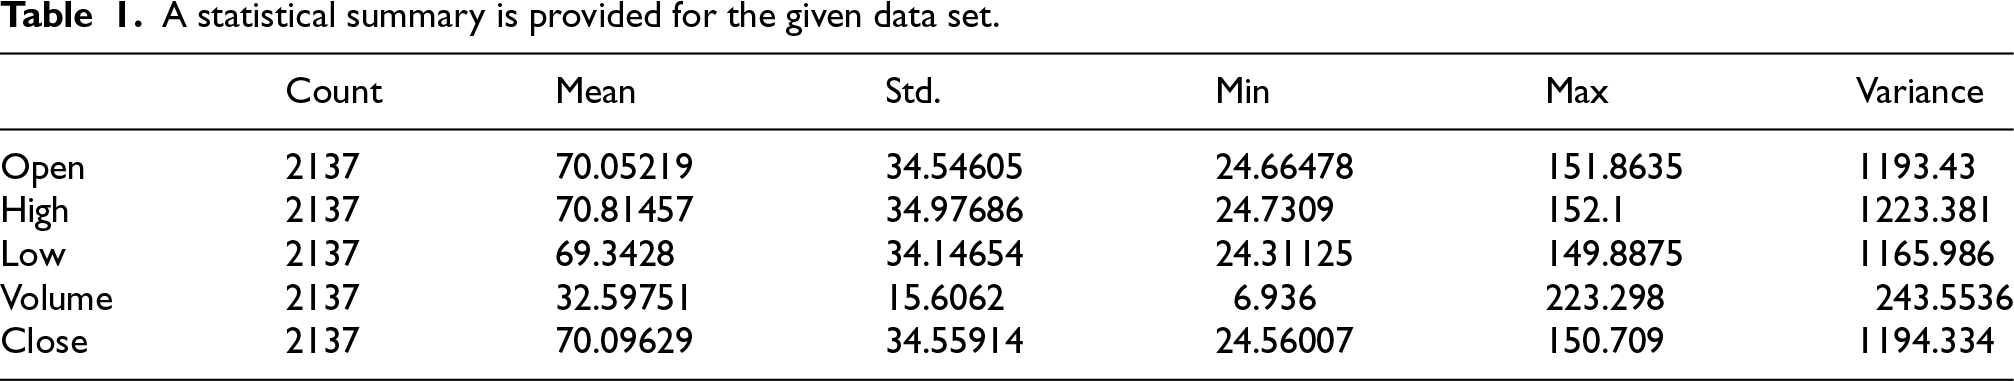
Table 1 summarizes all the statistical information for this stage of the study on the dataset in detail. Volume and price statistics are given with OHLC data: Open, High, Low, and Close. To analyze the data completely as well, statistical metrics such as variance, mean, count, minimum, maximum, and Standard deviation are used. These metrics allow for in-depth consideration of the features available in the dataset, thus providing an appropriate assessment and analysis of the data available.
A statistical summary is provided for the given data set.
A statistical summary is provided for the given data set.
The main objective of this study is to find out and assess an ensemble of algorithms that can result in the best forecast for stock prices. The key to this study is that forecast models, which are actually done based on a deep knowledge of the different factors driving the stock market fluctuations, must be developed. In this regard, the objective of this paper is to enable analysts and investors to make accurate investment decisions with the help of useful data. Table 2 and Figures 10 and 11 give a detailed view of the performances by the individual models for comprehensive judgment on the efficacy of each model. This review will enhance investment decision-making through the advantages and disadvantages developed for each model in determining the best algorithm for stock price forecasting.
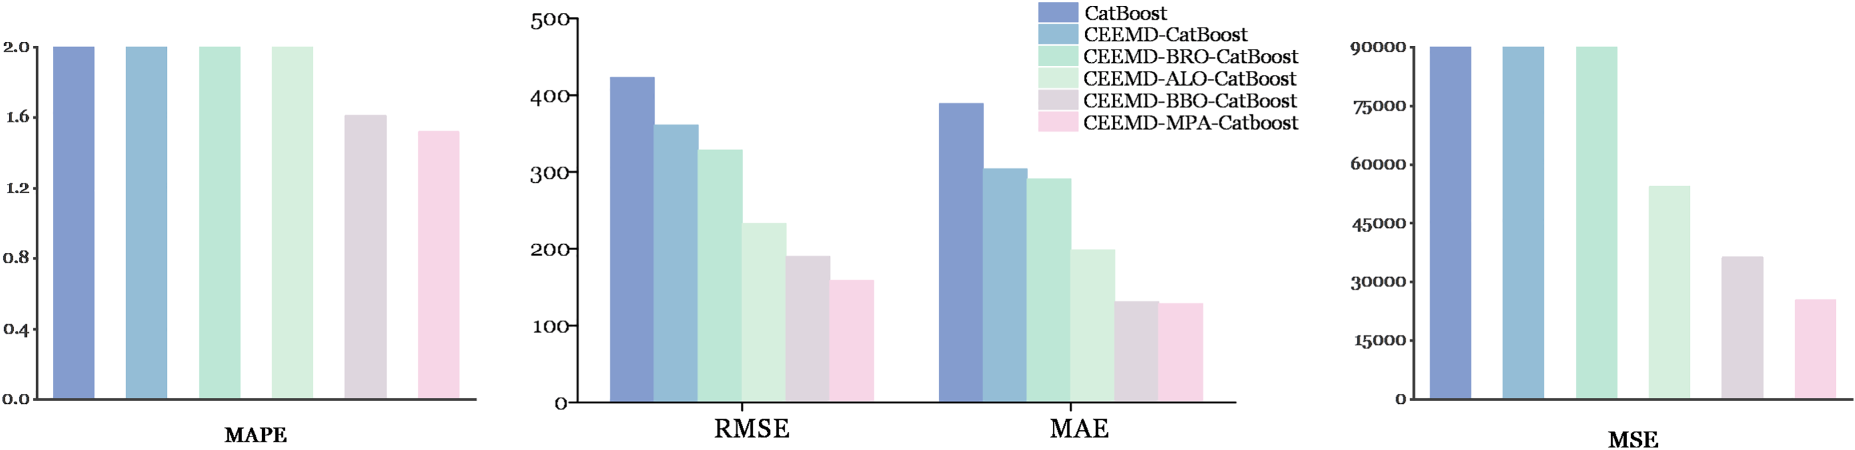
The outcomes of the employed models training for MAE, RMSE, MSE, and MAPE.
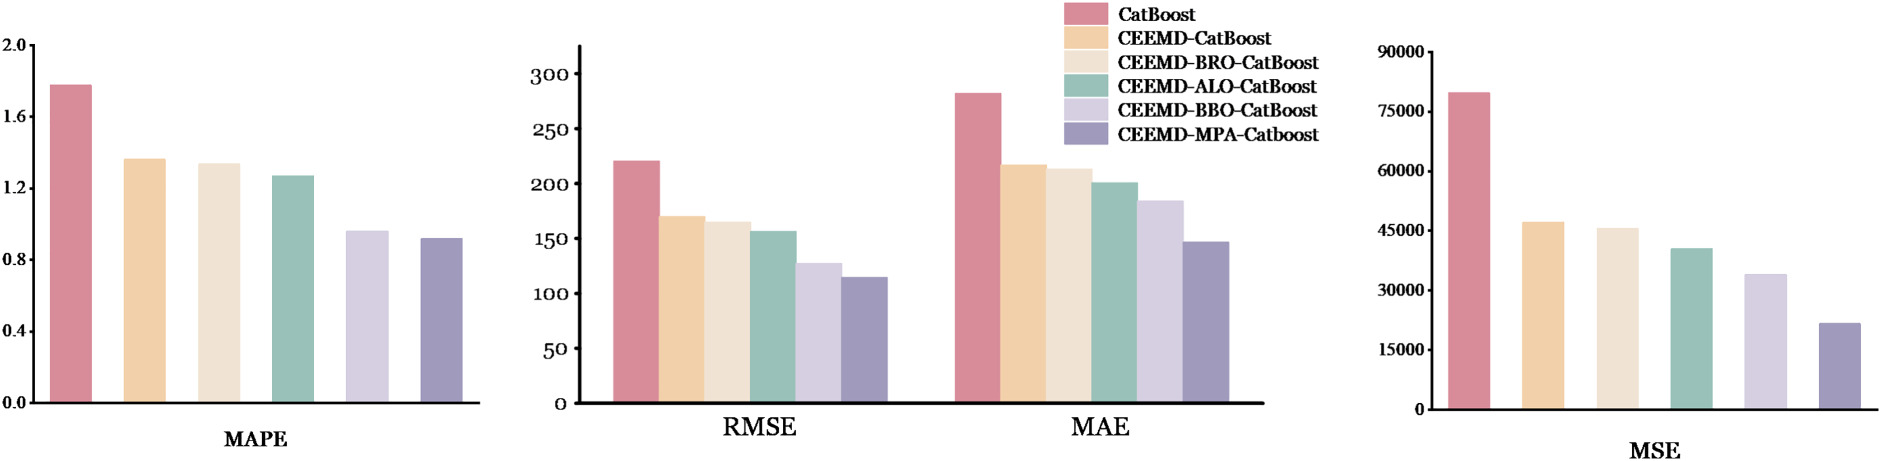
The outcomes of the employed models testing for MAE, RMSE, MSE, and MAPE.
The anticipated outcomes of evaluating methodologies.
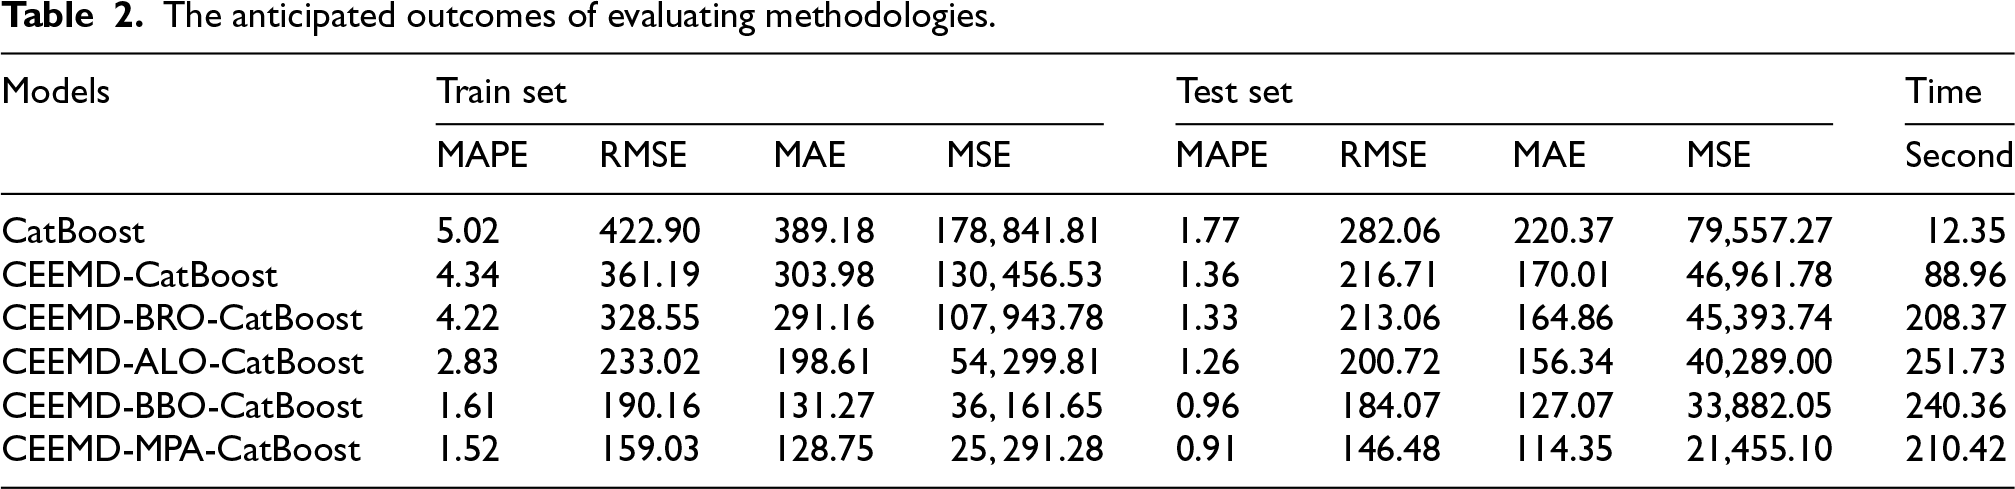
It is widely acknowledged that the above-described metrics offer a thorough assessment of the overall accuracy, dependability, as well as efficacy of the findings. With decomposition and the use of an optimizer, the CatBoost efficiency of the model has been appraised utilizing the RMSE, MAE, MAPE, as well as MSE criteria. By doing this approach, it will be feasible to enhance comprehension of the model's effectiveness and produce perspectives according to the recently obtained data. After examining the test and training sets, it was seen that the MAPE values were 5.02 and 1.77. Decomposing a problem often identifies functions or recurring patterns that apply to many different parts. The process of reusing modules or components speeds up development, improves stability, and lowers the likelihood of errors. It is clear from the data in this section that using CEEMD decomposition during the testing phase lowers the MSE value to 46961.78, respectively. Putting optimizers into the CatBoost model enhances its efficacy substantially. Optimizers prevent performance degradation by facilitating the effective adjustment of model parameters. Many optimizers implement unique strategies to achieve a convergent set of parameters, including learning at an adaptive rate, slope lineage, momentum, and others. During training, this level of efficacy speeds up the convergence process. As indicated in Table 2, the examples provided illustrate how using the BRO optimizer and CEEMD decomposition simultaneously results in a more accurate result and lowers calculation error. As shown in Table 2, CEEMD-ALO-CatBoost outperformed CEEMD-BRO-CatBoost in terms of efficacy by lowering the MAPE score. With an MAE score of, 127.07 CEEMD-BBO-CatBoost demonstrated a higher level of effectiveness compared to CEEMD-ALO-CatBoost. Empirical evidence from regression analysis has demonstrated the high dependability and precision of the CEEMD-MPA-CatBoost model. MSE scores for the model on the testing dataset were, respectively, 21455.10. The model's robust predictive capability and ability to explain nearly all data variability are manifested in these outcomes. Greater accuracy is denoted by smaller numbers that represent the discrepancy between the actual and predicted values. The CEEMD-MPA-CatBoost model has been validated against the accuracy requirements of both the training and testing datasets. In the context of stock market prediction, the computational time of predictive models is essential due to the fast-paced nature of financial markets. The CEEMD-MPA-CatBoost model is the most accurate predictive model, with a computational time of 210.42 s. It means that it serves as the best choice if one needs high precision for strategic decisions. By comparison, a simple CatBoost requires only 12.35 s and is faster but not so precise. Other models, such as CEEMD-CatBoost, which is a bit slower and requires 88.96 s, along with other advanced variants like CEEMD-BRO-CatBoost requiring 208.37 s and CEEMD-ALO-CatBoost requiring 251.73 s, are different from the time and accuracy trade-offs.
Many studies prove that the CEEMD-MPA-CatBoost model provides a trustworthy support for accurate stock valuation. Figure 12 compares the efficiency of the model in Google stock. Further, by applying the CatBoost approach, the accuracy of the model increases where it not only reduces the swings of stock price but also increases the accuracy of forecasting the future trend. Compared to other models, one unique feature of the CEEMD-MPA-CatBoost model is its ability to absorb information from past datasets. Finally, the CEEMD-MPA-CatBoost model boasts excellent attributes in terms of reliability, accuracy, and extraction of meaningful insights from historical datasets, hence its considerable utility in the domain of stock price prediction. With the flexibility of handling the change of market patterns, widely used algorithms include the CatBoost algorithm and MPA optimizer. Hence, they are still favored by those who aim to achieve lucrative stock market transactions.
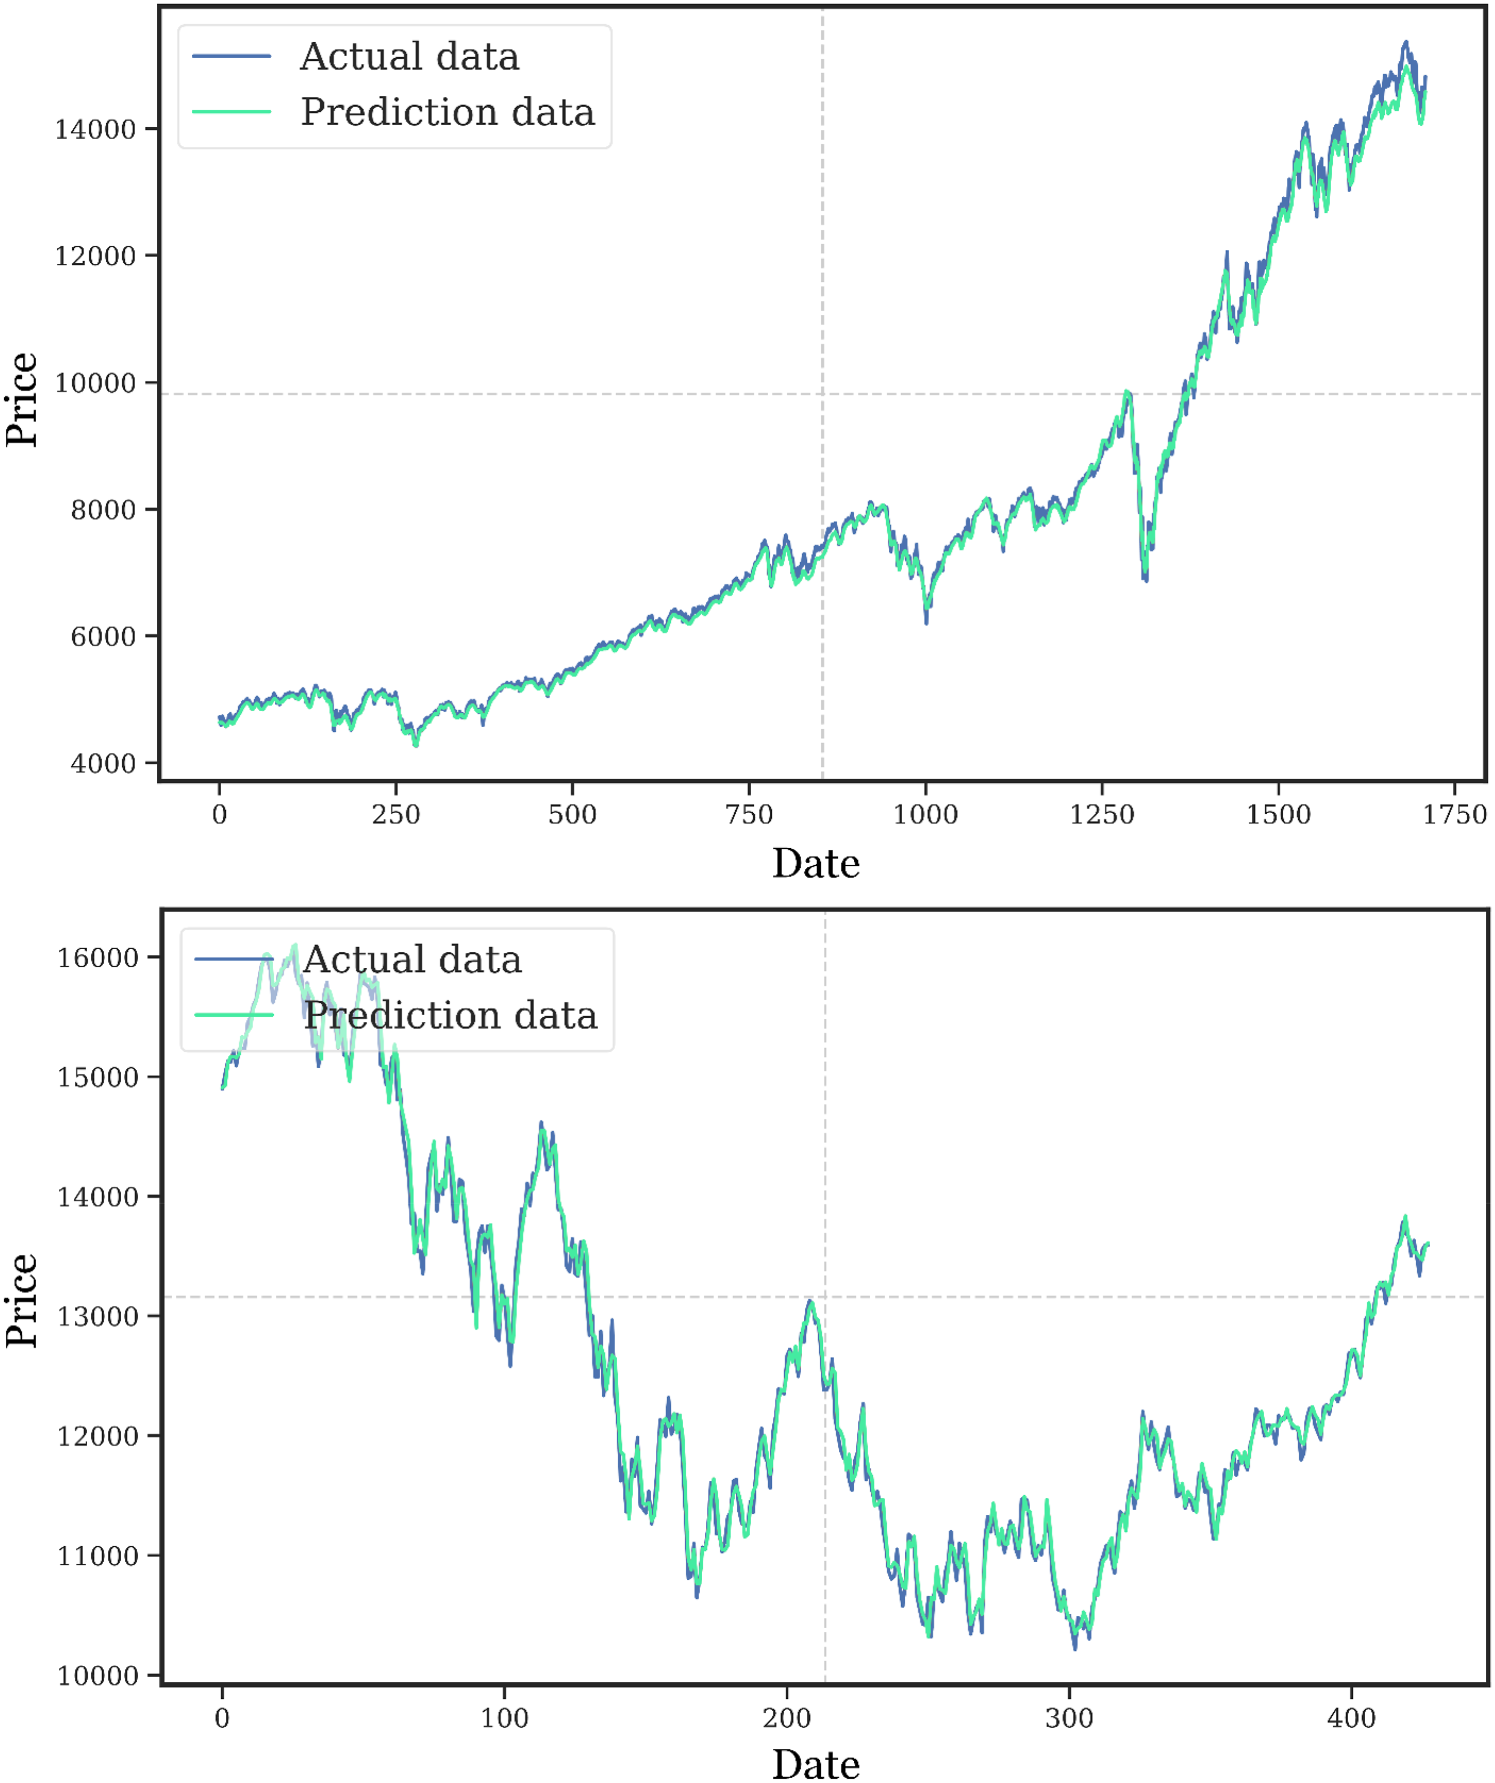
Evaluation of the performance of the suggested model during training and testing using actual data.
Summary results of a statistical test concerning algorithms are given in Table 3, using the Friedman Chi-square and p-value tests. The Friedman test is used; it is a non-parametric statistical test ranking various predictive models in general and, more particularly in this case, their stock market forecasting capabilities. The Friedman Chi-square measures the similarity or otherwise between these ranks. 29 Computed together with the Friedman Chi-square, the p-value estimates the likelihood that the differences observed between the performances of the model were a chance effect. Where the p-value is lower, a larger statistical significance difference is likely noticed. 30 The Friedman Chi-square statistic and p-value for the CEEMD-MPA-CatBoost model are significantly different, at 68.576 and 1.28E-15, respectively. The highly significant performance difference in comparison to other models is indicated by the extremely low p-value, which underscores the efficacy of the CatBoost algorithm in conjunction with CEEMD and MPA techniques. This particular model exhibits the most significant deviation from the performances of other models, suggesting that it has the most robust predictive capabilities in this series of analyses.
Statistical analysis of predictive models.

Statistical analysis of predictive models.
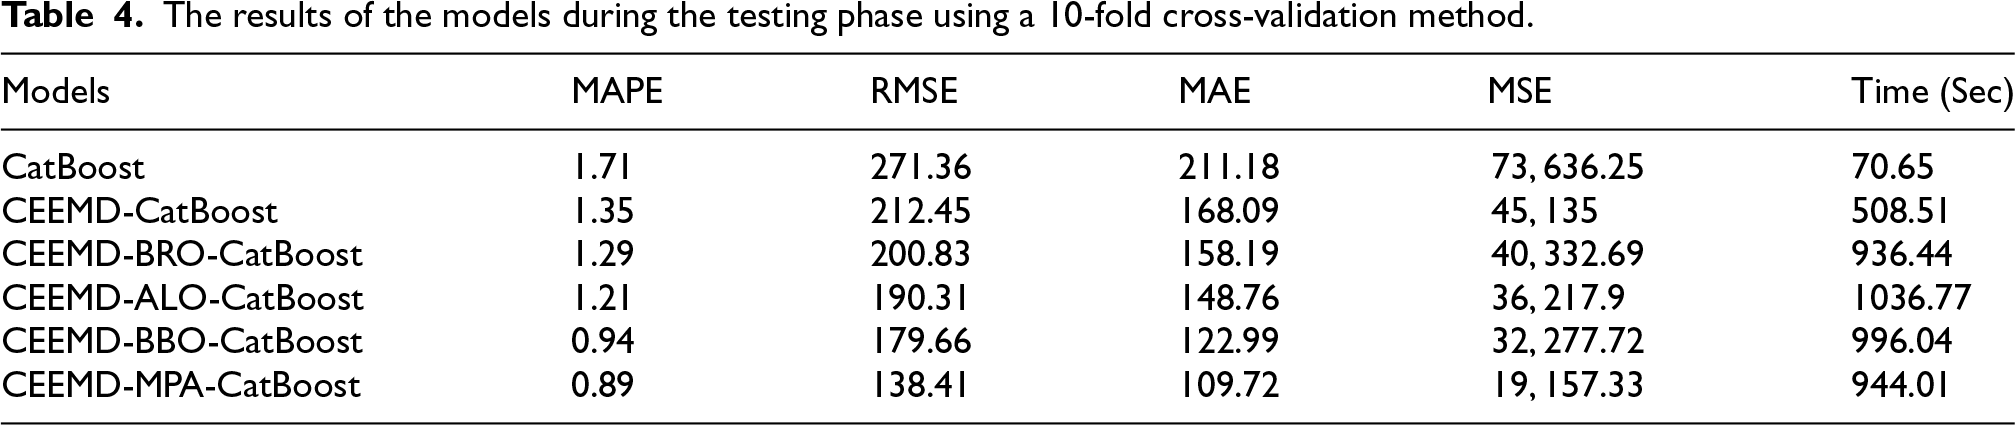
The results of the predictive models have been slightly enhanced as a result of the implementation of 10-fold cross-validation, according to Table 4. This validation method improves the reliability and robustness of the models by reducing the reliance on a single training-test split for the performance metrics, thereby enabling a more thorough evaluation of model accuracy. The CEEMD-MPA-CatBoost model continues to be the most effective, as it has achieved the lowest MAPE (0.89), RMSE (138.41), MAE (109.72), and MSE (19157.33). It signifies that this model has the best ability in stock market trend forecasting. Other models also reflect an improved performance when 10-fold cross-validation is applied. For example, the CEEMD-CatBoost model outperforms the baseline CatBoost model with a MAPE of 1.71 and an RMSE of 271.36, while having a MAPE of 1.35 and an RMSE of 212.45. Specifically, the values of MAPE, RMSE, MAE, and MSE are found to be better in CEEMD-BRO-CatBoost, CEEMD-ALO-CatBoost, and CEEMD-BBO-CatBoost models. Generally, the application of 10-fold cross-validation in the study at hand ensured that a more complete and reliable evaluation of the models’ performance was performed and presented a more accurate calculation of their actual predictive performances in real-life stock market applications.
The results of the models during the testing phase using a 10-fold cross-validation method.
Besides the main analysis here using the data for Google stock, the general applicability and robustness of the proposed model of CEEMD-MPA-CatBoost have been tested on other global stock market indices. Other markets in which analysis has been conducted include the following: DAX-Germany, FTSE-United Kingdom, HSI-Hong Kong, and SSE-China, as depicted in Table 5.
Performance of the proposed model for additional markets.
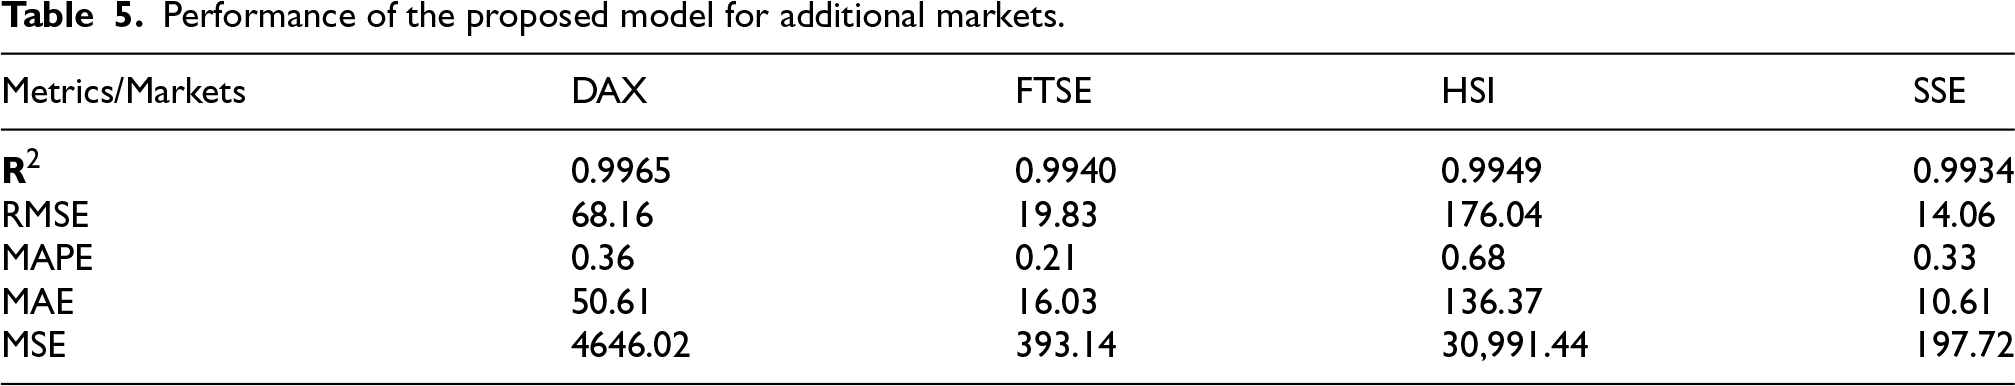
These results confirm high predictive accuracy across different markets. In all instances, R² is higher than 0.99, hence the predicted and actual stock prices perfectly align. Taking the German market as an example, its prediction through DAX was well demonstrated at an R2 value of 0.9965. Also, the robustness of the model in more volatile markets, such as in the case of HSI, is reflected in higher values of RMSE and MAE, probably because of the greater oscillation inside the market. Anyway, this model was still able to maintain a high value of R², reaching up to 0.9949.
It is interesting to note that the model's best performance was evidenced in the SSE and FTSE markets by having the minimum RMSE at 14.06 and 19.83, respectively, and a value of less than 0.33 for MAPE. This, in essence, postulates that the model can offer very correct approximations not only for fairly stable but also for the less volatile market conditions. The latter underlines that the proposed model can be fitted for various financial environments highly volatile up to more stable ones as in the case of HSI, FTSE, and SSE.
These discrepancies between RMSE and MAE between different markets are proof that the quality of the model is influenced by the conditions of the market, its volatility, and its structure. The robustness of this model is good enough to enable generalization for highly volatile markets like HSI and other financial markets while preserving high predictability.
One of the main challenges in stock price forecasting is that the models are sensitive to specific market conditions, either highly volatile or relatively stable. Several methodological approaches have been used in the current study to determine how robust and generalizable the proposed model, namely CEEMD-MPA-CatBoost, is in different market conditions. First, 10-fold cross-validation was used to test the performance of the model. It works by first dividing the data into 10 subsets, of which one at any given time may be used as the test set and the remainder for training. Repeat this process ten times to evaluate the various components of the underlying data. In that regard, cross-validation would ensure that the predictive accuracy of the model was not overdependent on any one segment of data, which could be biased due to particular market conditions at that time in history, whether volatile or stable. The model can thus be said to become more robust because it is cross-validated for performance across sets of data subsets, as this diminishes any potential influence of transient events that occur on the market.
Besides the cross-validation, the scope of analysis was also extended by testing the model on four other global stock indices. Each of these markets has different characteristics that depend on its structure, liquidity, and volatility. The robust performance of the proposed model in various markets suggests that it is not over-fitted to the unique characteristics of Google stock and applies to other financial markets. More importantly, it could retain predictive capability when the environment was more volatile, like in HSI, and then adapt to whatever market conditions came up thereafter. With the application of CEEMD, the model's adaptability to dynamic market conditions has been further improved. CEEMD is a signal decomposition technique that decomposes complex time-series data into intrinsic mode functions, each of which characterizes a distinct oscillatory mode. Such a decomposition of the stock price data from CEEMD will facilitate the isolation of both short-term fluctuations and long-term trends in highly volatile and nonlinear markets. This will improve the forecasting capability of the model for both stable and volatile conditions by handling the multi-scale nature of the stock price movements in a better manner. With the implementation of CEEMD, the proposed model can deal with the complexity of the financial market to provide more reliable predictions over various market states and horizons.
The proposed CEEMD-MPA-CatBoost model in this study is designed to ensure high accuracy and efficiency of stock market forecasting across different datasets and periods. It was carefully trained on historical Google stock data from January 1, 2015, to June 29, 2023, to best capture the natural trends, patterns, and dynamics of the stock market. Its adaptability during the real-time was examined with out-of-sample data from the Google stock for the period from July 3, 2023, to October 31, 2024. The prediction in real time on unseen data shows how robust this suggested framework is, whereby high accuracy and reliability can be attained. Figure 13 depicts the real-time predictions of the model closely matching the actual stock prices during the designated testing period. To capture long-term market patterns and trends, the training used historical data. The model maintained its high performance and accuracy by using this training to make predictions on the new interval in real time. The figure shows the performance of the model in adjusting to the price movements during volatile and stable periods, confirming its efficiency in predicting the stock price trend. The alignment of actual and predicted prices in the suggested model should be able to effectively generalize to unknown, future datasets from historical data. This feature ensures that the CEEMD-MPA-CatBoost model will remain a very useful tool for stock market prediction in financial environments where things happen very fast and where accuracy and real-time adaptability are crucial.
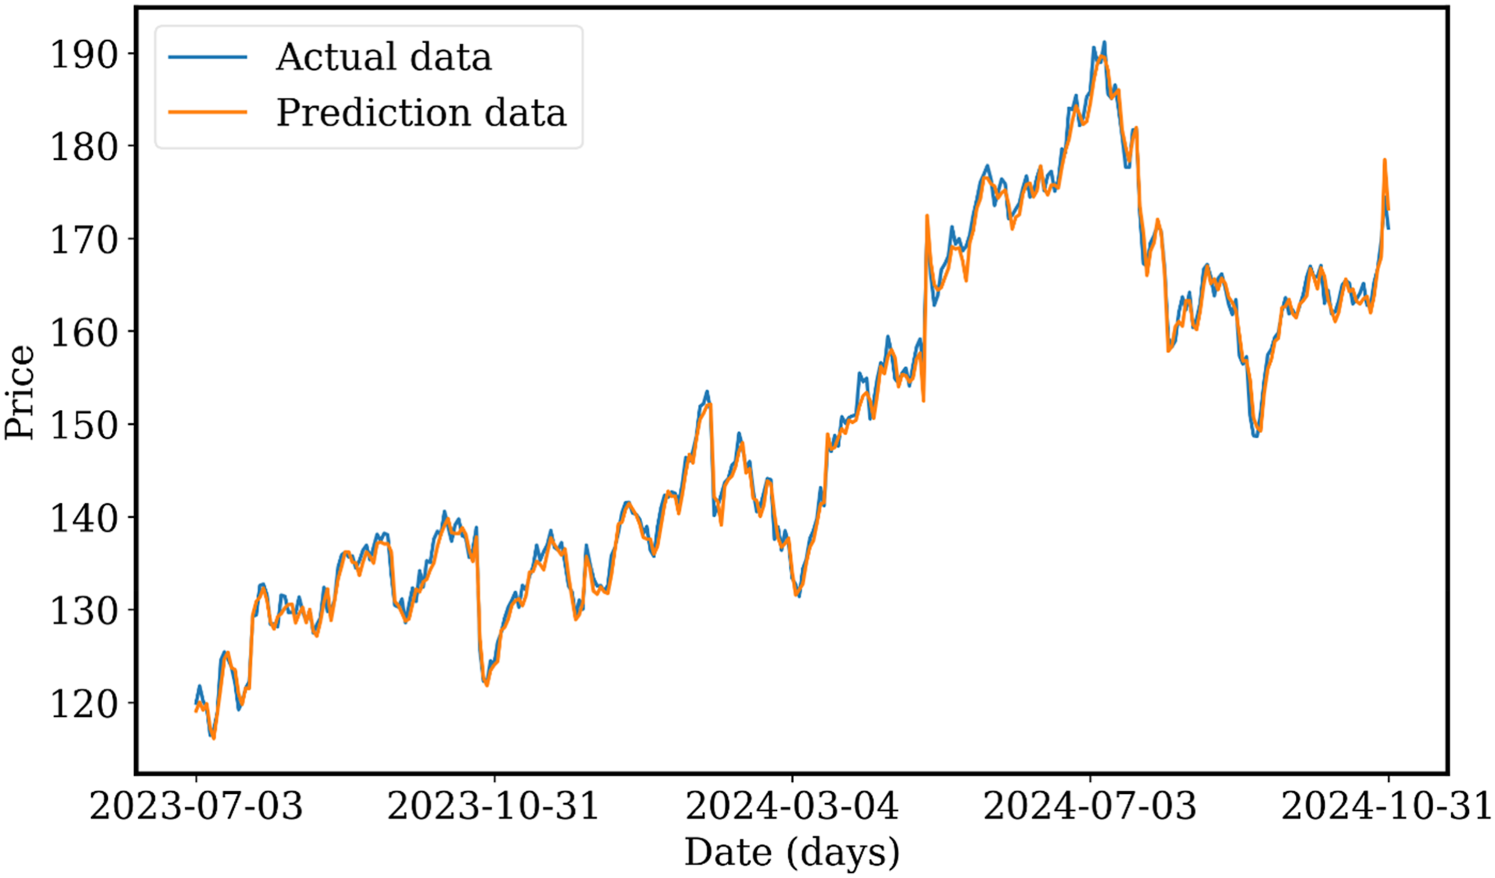
Prediction curve for the testing phase's out-of-sample data generated by the suggested model.
Stock price forecasting is a complex and multifaceted undertaking that requires a profound understanding. A multitude of factors influence the stock market, encompassing the economic, political, and societal spheres. Difficulties may arise in the development of dependable and effective prediction models due to the myriad of complex variables that impact stock price forecasting. To generate precise estimates, one must possess a thorough understanding of the uncertain as well as non-linear attributes of the market.
The study's findings encompass the following points:
This research is intended to provide a thorough examination of market trends. A set of characteristics comprising open, high, and low prices and volume are selected most efficiently to accomplish this. The objective is to leverage the functionalities of the SVR model to enhance the dependability and precision of predictions, ultimately, this will result in a more thorough comprehension of the financial market behavior of Google stock. As part of a comprehensive stock price forecasting approach, CEEMD is used when combined with the BRO, ALO, BBO, and MPA algorithms to thoroughly analyze and predict market behavior. This methodology enhances the accuracy of stock price forecasts by utilizing optimization and signal processing decomposition techniques. Insight into stock prices: Some models were evaluated in terms of their performance in prediction. Thus, CatBoost, CEEMD-CatBoost, CEEMD-BRO-CatBoost, CEEMD-ALO-CatBoost, CEEMD-BBO-CatBoost, and CEEMD-MPA-CatBoost models were evaluated, each emphasizing a better fit for the CEEMD-MPA-CatBoost model as the most efficient method among those taken. The study explains not only the comparative effectiveness of these models but also the improved predictive power reached in the case of CEEMD-MPA coupled with the CatBoost model for stock price forecast. It allows the generation of the model through an evolvement of different evaluation metrics, like RMSE, MSE, MAPE, and MAE. Such a criterion can, on the other hand, be considered by investors while identifying the ability of the model's underlying patterns; thereby allowing it to minimize errors and come up with reliable projection. The efficiency of the proposed approach has been gauged using two statistical tests in conjunction with cross-validation, namely, Friedman Chi-square and P-value. In this regard, two statistical tests were conducted to validate whether the proposed method was efficient enough. The model was also tested for its performance in various other markets. Among others, it was checked for DAX, FTSE, HSI, and SSE, all of which it was able to achieve The proposed model, CEEMD-MPA-CatBoost, proved highly efficient in real-time stock price forecasting with great accuracy and robustness for out-of-sample data through dynamic market conditions.
Footnotes
Funding
The authors disclosed receipt of the following financial support for the research, authorship, and/or publication of this article: This work was supported by Provincial Undergraduate University Basic Research Business Fee Project in 2023. Project Number is 2023-KYYWF-E003.
Declaration of conflicting interests
The author declared no potential conflicts of interest with respect to the research, authorship, and/or publication of this article.