
Abstract
This study introduces Neutrosophic Fuzzy GERT (NF-GERT) as a robust approach for scheduling complex construction projects, addressing limitations in conventional methodologies (PERT, CPM, PDM). NF-GERT leverages Graphical Evaluation and Review Technique (GERT) for stochastic project network analysis and Neutrosophic Fuzzy Sets (NFS) to handle uncertainty in activity durations. Specifically, a single-valued trapezoidal NFS captures Truth (T), Indeterminacy (I), and Falsity (F) subsets, providing a nuanced representation of ambiguity. The integrated multimethodology, NF-GERT, proves effective in managing uncertainties, demonstrated through a fourteen-storey residential case study, and validated with comparisons across forty-five real-time projects of varying complexities. The results highlight the effectiveness of the NF-GERT methodology in managing uncertainty and indeterminacy, further supported by statistical analysis using ANOVA. Acknowledging subjectivity, the study emphasizes clear guidelines, iterative refinement, and Monte Carlo analysis for consensus and reliability. NF-GERT emerges as a promising approach for realistic and reliable scheduling of construction projects amidst uncertainties and complexities.
Keywords
Introduction
Construction projects have evolved significantly over the past two decades, becoming intricate endeavours marked by numerous challenges. Complexity arises from several factors such as the increase in intricate activities, the involvement of diverse stakeholders, and the influence of various variables. 1 The modern construction landscape is characterized by projects of increasing size and scope, encompassing a broader range of tasks that require coordination among numerous stakeholders and diverse expertise. 2 In the current scenario, scheduling is a complex process due to the necessity to accomplish multiple tasks within the stipulated time. 3 The primary challenge in construction scheduling is the perception of the schedule for the subsequent activities under uncertainty (or incomplete information).4,5 The complexity of the scheduling process can be attributed to three primary factors: the uniqueness of projects, even though they share similar purpose; the individuality of each project in terms of cost, time, and quality; and the presence of ambiguity, referring to unclear data and inaccurate estimates.6,7 An imprecise construction schedule can eventually lead to time overrun and a cascade of events: including cost overrun, decrease in quality, and potential contractual disputes8–10. Therefore, the scheduling of building projects becomes a heuristic process reliant on the skills and expertise of experts in the sector.
Conventional project scheduling techniques, such as Program Evaluation and Review Technique (PERT), Critical Path Method (CPM), Precedence Diagramming Method (PDM), Linear Scheduling Method (LSM), have historically been adopted for scheduling construction projects. A construction project entails a variety of activities, some of which will reoccur. When employing the traditional methods, each activity is depicted separately, and recurring activities are considered separate occurrences.11,12 However, these conventional methods, while widely used, often fall short in capturing the dynamic and variable nature of modern construction projects. They are effective in addressing deterministic and probabilistic scheduling problems but struggle to account for the stochastic nature of project schedules. 13 CPM, for example, establishes a critical path based on a deterministic methodology, 14 while, PERT offers a probabilistic dimension through three-point estimations. 15
To address the complexities of construction projects, stochastic methods emerge as a progressive alternative. 16 Stochastic models, with their probabilistic nature, adeptly accommodates uncertainties, providing a nuanced understanding of task durations and dependencies. This adaptability is crucial for effectively addressing the inherent unpredictability of construction projects, offering a more realistic and flexible scheduling framework. Stochastic methods ascertain the duration of the tasks and their realizations 17 and conventional scheduling techniques are ineffective and incompetent in handling the stochastic nature of projects. 18 The stochastic attribute in the occurrence of activities, recurrence or looping of events, and variety of outcomes (project completion time) that may result from the successful completion of a project are some aspects of complex projects that conventional methods fail to consider.19,20
Scheduling a construction project is more complex than applying conventional project scheduling approaches since it has numerous activities and associated complexities. Therefore, there arises a need for a more robust scheduling technique that can handle the contingent and stochastic nature of the parameters associated with the construction schedule. An innovative hybrid scheduling methodology is necessary to overcome the shortcomings of traditional techniques, transcending their limitations and integrate elements to enhance adaptability to the complexities of modern construction projects.
The Graphical Evaluation and Review Technique (GERT) emerges as a robust stochastic scheduling model, particularly suited for construction projects characterized by intricate sequences, dependencies, and uncertainties.21,22 Originating in the 1960s, GERT represents a unique project management approach designed for the meticulous modelling and analysis of complex projects.23,24 Unlike traditional critical path methods, GERT incorporates probabilistic elements into the scheduling process. 25 Several studies have demonstrated the effectiveness of GERT, surpassing other traditional approaches in scheduling stochastic process26–32. However, the undeniable presence of ambiguity in construction projects, arising from factors such as incomplete information, design alterations, and uncertainties across various project facts, poses a challenge.33,34 While GERT excels in capturing probabilistic elements, its stand-alone application may not sufficiently encompass the intricacies of imprecise information. Therefore, there is a compelling need to augment GERT with fuzzy logic, a mathematical framework adept at handling ambiguity. Fuzzy logic provides a structured approach to represent imprecise data, linguistic variables, and qualitative uncertainties, offering a more comprehensive and adaptive framework for construction scheduling.35,36 The integration of fuzzy logic into GERT not only enhances the model's ability to navigate the uncertainties associated with construction projects but also ensures a more realistic representation of the intricate details affected by ambiguity, contributing to more informed decision-making and project success. 37
Research gap
Scheduling a construction project is a complex task that requires careful consideration of a various of challenges, including project complexity, uncertainty and variability, resource constraints, safety considerations, and coordination. 38 The demand for a robust scheduling technique of managing these contingencies and developing a multi-objective schedule for complex projects has intensified GERT is an approach to project management for modelling and analysing complex projects.
Despite having proven effectiveness in various sectors, the application of the GERT to construction schedules is still limited. The construction sector heavily relies on conventional techniques like CPM, and PERT, contributing to the inadequacy of research exploring the advantages and constraints of GERT in construction scheduling.39,40 The existing research gap offers an opportunity to further understand GERT's implementation and contribute to improvements in construction project management. This research aims to explore the application of GERT in construction scheduling and assess its effectiveness compared to traditional methods. Additionally, integrating fuzzy sets, known for handling imprecise and uncertain information, into GERT provides an extra layer of sophistication41–44.
However, indeterminacy in construction projects arises from the inherent presence of uncertainty and variability. Uncertainty from the unpredictable nature of events, incomplete information, and unforeseen conditions impacting project outcomes. 45 Variability, introduces fluctuations and deviations from expected patterns, such as changes in labour productivity, material quality variations, or shifts in project requirements. 46 This combination creates a dynamic and unpredictable environment leading to indeterminacy. To comprehensively address the multifaceted spectrum of uncertainty embedded in construction projects, a more inclusive representation is needed. Neutrosophy, which embraces the coexistence of truth, falsehood, and indeterminacy, offers a framework accommodates the intricate and often ambiguous nature of uncertainties in construction projects47–50. This exploration opens possibilities for refining construction scheduling methodologies and improving their effectiveness in handling the nuanced uncertainties. Koca et al. (2021) demonstrated the use of single-value triangular neutrosophic numbers in analysing the shortest path in real-time construction projects, suggesting its potential application to GERT as well. 51 While a symmetric representation using triangular fuzzy sets might be apt for balanced variations in project duration, the reality of construction project uncertainties often introduces asymmetry.52,53 In situations where uncertainties are unevenly distributed, employing a trapezoidal fuzzy set offers a versatile representation to capturing intricate and potentially asymmetric variations. 54
Expert opinions play a crucial role construction scheduling, particularly in assessing activity duration and associated probabilities. Incorporating expert opinions for neutrosophic concepts requires addressing subjectivity and minimizing biases on their responses. Achieving a balanced representation of diverse perspectives while minimizing individual biases. Establishing a consistent understanding among experts and providing clear guidelines for assessments is challenging but essential. Achieving consensus often demands iterative refinement through ongoing discussions and feedback loops to harmonize differing viewpoints. To enhance data reliability, a meticulous curation involves identifying upper and lower parameter limits. Subsequently, the data undergoes simulation through Monte Carlo analysis, an exploring uncertainties and variability, for a comprehensive perspective on potential outcomes.
This research introduces a novel integrated multimethodology termed Neutrosophic Fuzzy GERT (NF-GERT) as an innovative approach to scheduling construction projects. In this comprehensive methodology, the neutrosophic set is precisely characterized as a single-valued trapezoidal neutrosophic number (SVTNN). 55 As construction projects become increasingly complex and subject to diverse uncertainties, this study aims to demonstrate the implementation of NF-GERT with SVTNNs to schedule construction projects of varied scales (small, medium, and large projects). To evaluate the accuracy of NF-GERT to CPM, GERT, and F-GERT, a one-way ANOVA is performed with SPSS (Statistical Package for Social Sciences). This analysis examined the disparities between estimated and actual as-built durations, giving insight into the efficiency of each scheduling approach. To precisely identify where the differences exist, a post-hoc test is conducted after ANOVA. Subsequently, a post-hoc analysis using Tukey's Honest Significant Difference (HSD) test sought out certain techniques with statistically significant variations. The findings demonstrate NF-GERT's capability to improve scheduling practices, resulting in more accurate project planning and enhanced management efficiency. Figure 1 illustrates the conceptual framework for the proposed research.
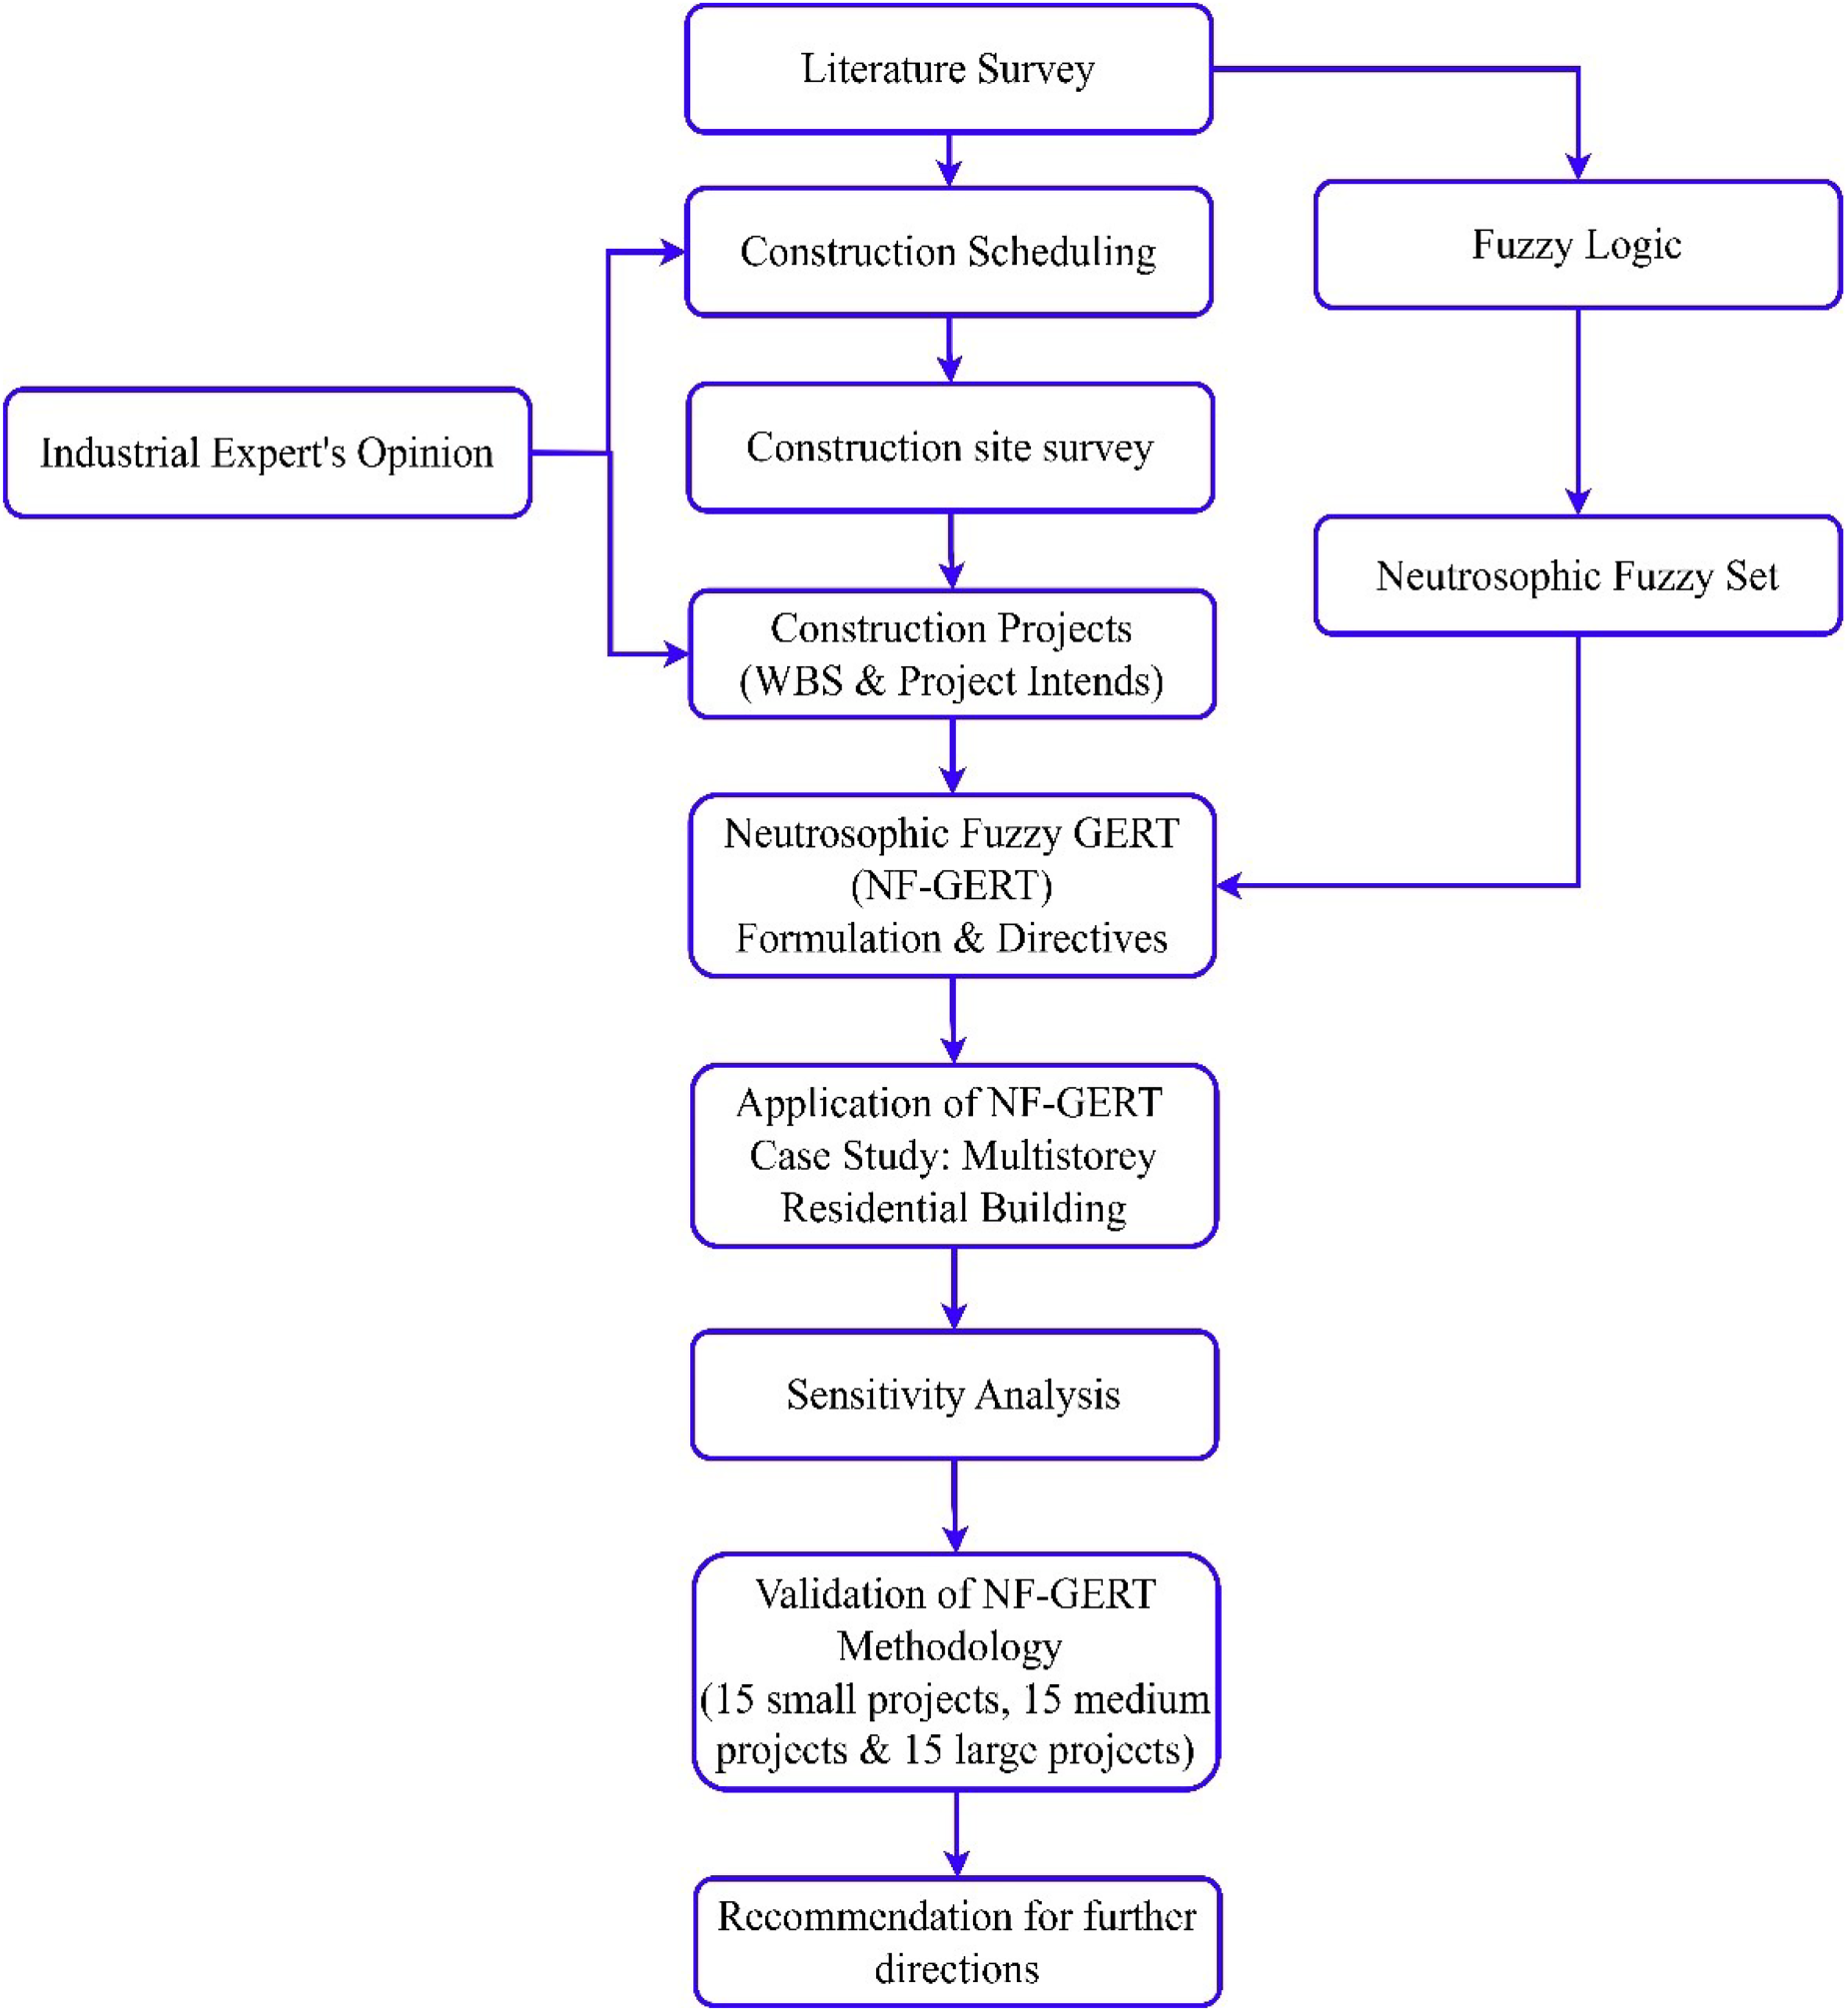
Conceptual framework for the proposed research.
The novel contribution of NF-GERT is its ability to further improve the effectiveness of uncertainty management in construction scheduling. While F-GERT already handles fuzzy uncertainty well, NF-GERT enhances this by incorporating neutrosophic logic, which accounts for imprecision, indeterminacy, and inconsistency in data. This added flexibility enables NF-GERT to better address complex, real-world situations where information can be incomplete or conflicting. As a result, NF-GERT offers more accurate modeling, better decision-making, and stronger risk management, making it a powerful tool for managing uncertainty in large and dynamic projects.
Graphical evaluation and review technique
Pritsker, 56 Happ, 57 and Whitehouse 58 introduced the concept of the Graphical Evaluation and Review Technique (GERT) in the 1960s to analyse network models with stochastic and logical properties. GERT is a powerful technique to analyse complex projects with uncertain and transcending variable activities.29,59 GERT integrates the concepts of network analysis, probability, signal flow diagrams, and simulation techniques to determine the solutions for stochastic problems60–62. GERT is specifically designed for analysing stochastic networks with transmittances based on two parameters, i.e., the probability of node realization and the time associated with branch realization. 63 Whenever the realization of a node involves only a few incoming activities, the GERT network is more suitable. 64 GERT is recommended for complicated scenarios due to its adaptability, capability to deal with ambiguity, visualization, and optimization functionalities.65,66 These features make it an effective tool for handling projects requiring a high degree of adaptability and reactivity to changing circumstances.67,68 Unlike conventional scheduling techniques GERT is recommended for modelling approaches that more accurately reflect the topologies of actual systems.20,64,69,70
Each task or activity and its associated data flow in a project are represented by a ‘branch’ or ‘arc’ connecting the nodes. An arc or a branch can lead to any subsequent node in the network. A network is said to have a loop if any segment of it leads to a preceding node in the network. GERT is more effective than other conventional methods due to the incorporation of the loops. The concepts of feedback and repetitive activities are represented by a loop. A self-loop is regarded as a loop that terminates at the same node each time it is traversed. Furthermore, a loop can be incident only on an EXCLUSIVE-OR node. The characteristic features of a branch in a GERT network
71
are encapsulated as follows:
Each branch has a probability of being selected. Each branch has a time associated with it that is required to perform the activity. The time is defined by a parameter set and distribution type. Each branch is represented by the activity numbers or codes. A node in a stochastic network includes three logical connections on the input side and two kinds of connections on the output side.
Comprehensive specifics on the node structure of the GERT and technicalities of the utilization of the node were presented by Whitehouse. 72 The node can be comprehended in two parts the ‘receiver’, which imposes the terms of realization of the branch leading to the node, and the ‘emitter’, denoting the conditions of the realization of branches emanating from the node. 63 Input nodes in a stochastic network include an ‘EXCLUSIVE-OR’, ‘INCLUSIVE-OR’, and ‘AND’ node or vertices and transmittances. 73 These input nodes are illustrated in Figure. 2. The node is realized if any branch leading to the node is realized, but only one node is realized at a time, then the node is an EXCLUSIVE-OR type node. In addition, a loop may only occur on an EXCLUSIVE-OR node since all other arcs are regarded as being idle and only EXCLUSIVE-OR nodes can realize one arc at a time. In an INCLUSIVE-OR node, the node is realized when any of the branches, leading to the node, is realized. The time of realization for an INCLUSIVE-OR node is the smallest of all completion times of the branches leading to the realized node. Conversely, when the node is realized only if all the branches, leading to the node, are realized and the highest completion time is taken as the time of realization, then the node is an AND node.

Representation of input nodes (a) EXCLUSIVE-OR (b) INCLUSIVE-OR (c) AND.
The nodes on the output side may be deterministic or probabilistic. 74 In a deterministic output node, all activities starting from the node are taken if the node is realized and the probability occurrence (‘Pn’) are equal (A1 = A2 = 1) . In a probabilistic output node, only one activity is taken at a time, if the node is realized. The sum of probability ‘Pn’ that the node ‘An’ is taken is equal to 1 (A1 + A2+…+An = 1). The deterministic and probabilistic output nodes are illustrated in Figure. 3.

Representation of output nodes with and receiver terminal (a) deterministic (b) probabilistic.
The node number is denoted as ‘n’, ‘i’ denotes the number of activities to be completed for the first realization and the number of activities to be completed for subsequent realization is denoted as ‘j’, P1, P2, …, Pn denote the probabilities associated with the activities A1, A2, …, An respectively. Any sequence of activity can be graphically delineated by a GERT network by altering the values of ‘i’ and ‘j’. If the node is not included in a loop and if the node is realized only after the completion of all activity incidents on the node, then the positions of ‘i’ and ‘j’ may be left blank.
75
Concisely, the nodes in a GERT network exemplify the following characteristics:
The number required the realization of activities incident on the node for the first realization of the node. The number required the realization of activities incident on the node for the subsequent realization of the node. The statistical quantity of the activities emanating from the node, and the method of scheduling, i.e., deterministic, or probabilistic method.
In recent years, GERT analysis has been recognized in project management,19,76 Research and Development (R&D)77–80 procedures, and other fields.67,74,81–84 Even though the implementation of GERT for construction scheduling is advantageous compared to other scheduling methods, it has not been acclaimed in the construction industry. The GERT network provides a comprehensive framework for modelling and analysis of projects with randomness or probability involved in the outcome of an event or process. 85 The essential component of construction scheduling is the inherent uncertainty and ambiguity in the parameters determined by human perception, evaluation, and decision-making. Incorporating a competent theory of uncertainty into the GERT model is pivotal to enhancing project planning and scheduling precision.
In recent years, the conventional GERT model has undergone modifications to model and analyse complex problems. GERT has been integrated with various theories to be adapt to diverse situations that require a stochastic technique of problem-solving. Fuzzy set theory-based GERT is one such variant of the GERT model that accounts for several types of uncertainty in project management.
Fuzzy Graphical Evaluation and Review Technique (F-GERT) is an extension of the GERT method that incorporating fuzzy set theory. F-GERT is a probabilistic network model used to represent and analyse uncertain and complex systems. It allows for more flexibility and expressiveness in modelling and analysing systems with uncertain and imprecise data. In F-GERT, replace crisp values for probabilities, durations, or other variables representing the associated uncertainty and imprecision. Fuzzy sets are mathematical tools used to represent and manipulate uncertainty or vagueness in data. F-GERT excels at representing incomplete or vague information compared to traditional GERT or other modelling approaches, offering a significant benefit of incorporating fuzzy logic in GERT. The use of F-GERT to modelling complex construction scheduling problems is relevant because it is a robust and efficient modelling tool that can handle complicated systems, providing accurate and detailed representations of ambiguous or imprecise data. Its adaptability and flexibility make it a beneficial tool for a variety of uses, facilitating decision-making and optimizing outcomes for intricate projects and systems. Fuzzy logic simplifies the use of intuitive linguistic variables, making F-GERT easier to understand and use. F-GERT more user-friendly than any other approaches to model uncertainty, especially in situations with incomplete, uncertain, or imprecise data. 17
This research aims to apply fuzzy set theory-based GERT to the scheduling of construction projects, a complicated process including many interdependent operations, limited resources, and a high degree of uncertainty.
Fuzzy set theory
Fuzzy Set Theory (FST) was introduced by Zadeh 86 for modelling and analysis of real-time problems that constitute incomplete information, inexactness or impressions, and inherent uncertainties. Eventually, Fuzzy Sets (FS) and Fuzzy Logic (FL) have been employed to analyse the uncertainty in a range of real-time scenarios. A degree of membership existed among the elements of the considered FS. 87 However, there are a few parameters that cannot be addressed by FS, consequently, the concept of Interval-valued Fuzzy Sets (IVF) was developed. 88 Furthermore, an advancement in the theory of FS was the development of Intuitionistic Fuzzy Sets (IFS) and Interval-valued Intuitionistic Fuzzy Sets (IVIFS). 89 IFS is the extensiveness of a FS with a membership function and a non-membership function. 90 Subsequently, Smarandache 91 recognized a third element as an addition to IFS, i.e., the Indeterminate (I) or unknown part between the membership and non-membership, or Truth (T) and Falsity (F). Smarandache 92 popularized this, three membership functioned IFS as Neutrosophic Fuzzy Sets (NFS).
Each element in a neutrosophic fuzzy set is defined by a neutrosophic value, comprising truth, indeterminacy, and falsehood. The truth component indicates the element's truth, the falsity component reflects its degree of untruth, and the indeterminacy component shows the extent of uncertainty or ambiguity in the statement. The significance of neutrosophic fuzzy sets lies in their ability to handle both uncertainty and indeterminacy, a feat not achievable with conventional fuzzy sets. By incorporating the indeterminacy parameter, NFS can more precisely represent uncertain and ambiguous data contributing to better decision-making and more accurate models. This research successfully applies NFS to schedule construction projects, showcasing its versatility in handling uncertainty and indeterminacy in this context.
Neutrosophic fuzzy set
In the postliminary stage, Smarandache
93
conceptualized Neutrosophic Set Theory (NST), Neutrosophic Sets (NS), and Single-valued Neutrosophic Fuzzy Sets (SVNFS), fundamentally derived from Neutrosophy, an innovative discipline of Philosophy. The NS technique is a powerful tool to analyse problems that constitute incomplete information, inexactness or impressions, and inherent uncertainties requiring human creative intelligence and judgment.
94
NS are delineated by truth membership function (T), indeterminacy membership function (I), and falsity membership function (F).
95
Wang et al.
96
proposed the concept of a Single-valued Neutrosophic Set (SVNS), an advancement in the conception of a NS. The SVNS is an effective tool for making quantitative judgments in uncertain and indeterminate situations.
97
The SVNS is represented by the degree of T
For instance, when estimating the time required for concrete curing, a project planner might initially assume a fixed duration, such as 8 days. However, this traditional approach does not account for uncertainties that may arise during the process. A more flexible approach, such as a fuzzy set, allows for a range of possible durations, like 7 to 10 days, to better reflect variations in real-world conditions. Neutrosophic sets take this a step further by considering not only the expected range but also the level of confidence and uncertainty associated with the estimate. Suppose the planner is fairly confident that the curing will be completed within 7 to 10 days under normal conditions, this confidence can be represented by a truth value (T) of 0.8. However, factors such as sudden rainfall or unexpected delays in material supply introduce uncertainty, which can be captured as an indeterminacy value (I) of 0.5. In extreme cases, if cold weather or improper curing methods significantly extend the duration beyond the expected range, the likelihood of this happening can be represented by a falsity value (F) of 0.3. This approach helps project planners incorporate both known variations and unknown uncertainties into scheduling decisions.
Neutrosophic fuzzy numbers and membership function
Neutrosophic Fuzzy Numbers (NFN) are similar to Fuzzy Numbers (FN), which are convex fuzzy subsets of the real line,
Let ‘ X ’ be the universe of discourse, with a generalized element in ‘ X ’denoted by ‘ x. A SVNS ‘ A ’ in ‘X’ is characterized by a truth membership function

Let a SVTNN
The truth membership function
The indeterminacy membership function
Let


The score function
The score function

The accuracy function A

The inherent uncertainty of construction projects prevalently leads to budget overruns due to unforeseen circumstances. The premeditated activity duration may fluctuate under certain conditions and may be unambiguously presented due to the inaccuracy of the estimating instrument. A tool is required that can consider the randomness and fuzziness associated with activity duration time. Consequently, the neutrosophic set theory is suggested, which allows the inclusion of uncertainty in the estimation of the aforementioned parameters of a network along with classical probability theory.104,105 This research proposes implementing a hybrid multi-methodology termed Neutrosophic Fuzzy based Graphical Evaluation and Review Technique (NF-GERT), an extension of the GERT network model as a potent tool for construction scheduling. This technique combines GERT and Single-valued Neutrosophic Fuzzy Set Theory (SVNFST).
Steps for Applying the NF-GERT Methodology in Construction Scheduling
The NF-GERT methodology for construction scheduling is implemented through the following steps:
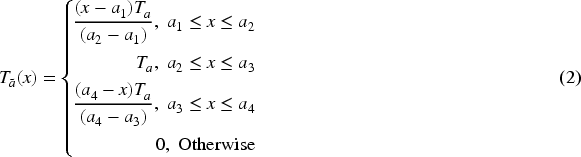
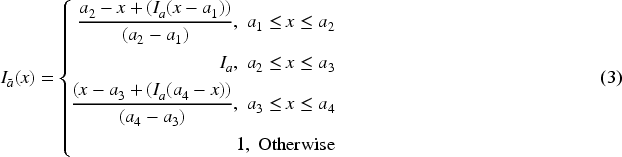
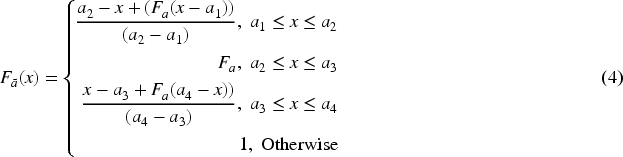
Step 1: Developing the Work Breakdown Structure (WBS) – The first step in applying the NF-GERT methodology is to develop a comprehensive WBS for the construction project. The WBS identifies all the crucial tasks needed to complete the project and breaks it up into smaller, more manageable parts. Each task is precisely defined to ensure that no key tasks are overlooked. Furthermore, the logical sequence and interdependencies between these activities are established to create a structured workflow. Step 2: Constructing the GERT Network – The identified activities and their dependencies are transformed into a GERT network, which incorporates probabilistic branching and looping to model real-world uncertainties. This network incorporates branching and looping, allowing for the representation of probabilistic and recurrent activities, which are essential in modeling real-world construction scenarios. Step 3: Defining Uncertainty with Neutrosophic Numbers – Activity durations, which inherently involve uncertainty, inconsistency, and incomplete information, are then represented using SVTNNs. This method enhances flexibility compared to traditional probabilistic approaches. Step 4: Computing Membership Functions – The truth, indeterminacy, and falsity membership functions for each neutrosophic number are determined using Eqs. 2–4. These functions quantify the degree of certainty, uncertainty, and falsity in activity duration estimates. Step 5: Estimating Project Duration – The crisp value of project duration is computed using Eq. 10, integrating neutrosophic parameters into a single representative duration. Step 6: Determining Expected Completion Time – The expected completion time of the project is calculated by transforming the original NF-GERT network into an equivalent deterministic network, where uncertainties in activity durations are incorporated through neutrosophic calculations. The crisp project duration is determined by summing the expected durations of individual activities while incorporating the effects of probabilistic branching and looping.
The suggested technique could be effectively presented in a multi-storey structure since high-rise building design requires numerous inspections and checkpoints for safety. It is imperative to incorporate control points in multi-storey buildings for aspects like quality and durability, standards, design, and layout. Non-compliance with these regulations always results in a plethora of issues, including financial shortfalls, quality drops, and even litigation. At each stage of implementation, the structural design and layout are inspected. Control points include checking the type and quantity of reinforcement bars for the roof slab, column, and beam, particularly at maximum load transfer points and beam-column joints; levelling the brickwork provided for walls to be the same height; inspecting shoe concreting; examining the mix ratio in the RMC; performing slump tests at the RMC and on the job site; and levelling roof concreting, which are likely to be non-conforming in certain instances. These discrepancies must be addressed to achieve the desired execution.
Conventional models do not account for the probability of occurrence associated with the activities in the building projects, making the implementation of NF-GERT appropriate. To handle issues with indeterminate ambiguous data, each activity's durations are represented as single-valued trapezoidal neutrosophic fuzzy sets denoted by truth membership degree, indeterminacy membership degree, and falsehood membership degree. This research provides a comprehensive description of the conceptual model of the suggested approach to creating a construction schedule for a multi-storey residential building. To emphasize the functionality of looping and the probability of various activities occurring, a multi-storey construction project is selected.
Case study: multi-storey (fourteen) residential building
The comprehensive contextual relevance of the proposed technique is demonstrated by employing the NF-GERT method to compute the project completion time for a fourteen-storey residential building in Chennai. Figure 4 shows a photograph of the fourteen-storey residential building in Chennai, India, considered for the study during the construction phase. The project framework is usually depicted on two levels: a WBS breaks the project into manageable tasks, and a network diagram demonstrates the technical and execution dependencies between the project's activities. 106

Photograph of the construction of the fourteen-storey residential building in chennai, India.
Primarily, to construct the fourteen-storey structure with the appropriate characteristics, a Work Breakdown Structure (WBS) is established by creating an exhaustive list of the activities and interdependencies between the listed activities. The comprehensive WBS for the construction of the fourteen-storey building considered is listed in Table 1 in the electronic supplement, depicting the specifics of the input data needed to compute the expected project duration employing NF-GERT (TNFN and Crisp Value) along with the probability of occurrence (pn) of activities.
Attributes of nodes depicted in the GERT network
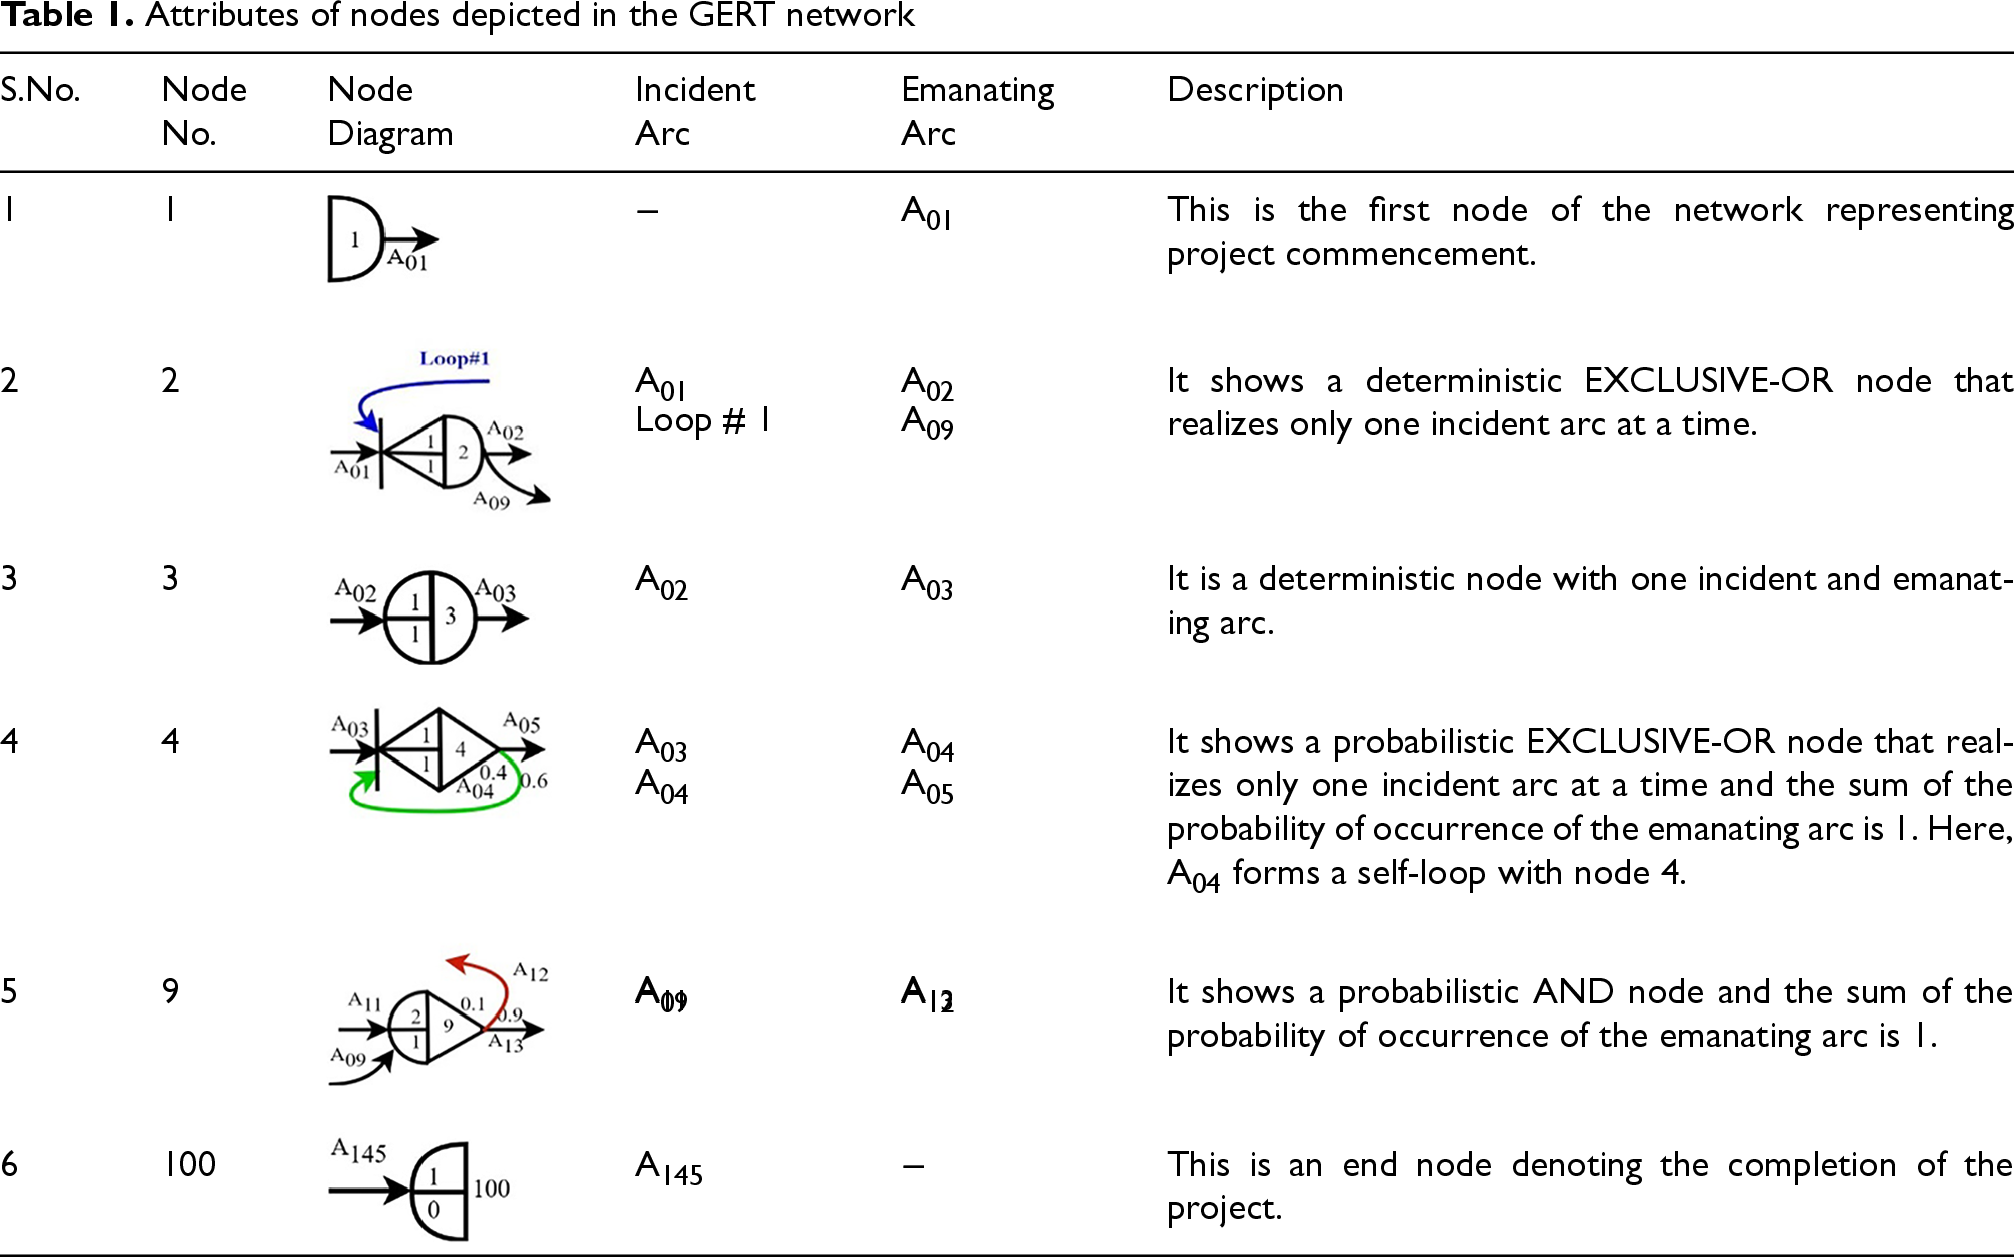
Attributes of nodes depicted in the GERT network
The procedure outlining the definition of neutrosophic numbers for activities in the Work Breakdown Structure (WBS) presented in Table 1. Carefully selected experts with proficiency in construction project management are chosen, and a comprehensive background of the project's context is presented. To facilitate a collective understanding, a detailed explanation of neutrosophic fuzzy logic is provided. In this study, data were gathered from a carefully selected panel of experts within the construction sector using the Delphi technique. As described by Linstone and Turoff (1975), this method is a structured approach that collects expert opinions anonymously, helping to minimize biases such as the “bandwagon” or “halo effect”.
107
A modified multi-stage Policy Delphi technique, based on the principles of non-maleficence and consensus, was utilized. Experts participated in several rounds of feedback, which allowed for the refinement of their responses and the gradual development of a consensus. This iterative process ensures that the final conclusions reflect a well-rounded expert consensus, reducing individual biases and strengthening the reliability of the findings. Experts use a numerical scale to quantify their responses to the degrees of truth (
The Monte Carlo simulation is implemented in VBA (Visual Basic for Applications) to model probabilistic data assignments derived from survey responses. This approach involves generating 10,000 iterations for the variables A, B, C, D, T, I, and F, where each variable is assigned based on probability distributions obtained from survey data. The electronic supplement provides the VBA code framework that was utilized for data generation. The key aspects of the VBA implementation include:
Worksheet Initialization: Clearing existing data and setting up column headers. Probabilistic Value Assignment: Utilizing the “Rnd” function to allocate values according to predefined probability thresholds. Data Storage and Average Computation: Accumulating generated values across iterations and calculating the overall averages. Result Output: Displaying computed averages and informing the user upon completion.
For instance, consider the activity of site clearance and site levelling using mechanical means (A01), which involves multiple uncertainties. This activity can be represented using a SVTNN as 〈(5, 6.5, 8.5, 10); 0.9, 0.6, 0.4〉. These values are averages obtained from the simulation, based on 10,000 iterations, ensure objectivity by utilizing data-driven probability distributions from survey responses, avoiding subjectivity in parameter selection. The trapezoidal range (5, 6.5, 8.5, 10) indicates the possible duration of the activity, where 5 days represents the minimum duration under optimal conditions, 6.5 to 8.5 days indicate the most likely duration range (lower and upper) based on normal working conditions, and 10 days is the maximum duration in case of unforeseen delays such as equipment failure or unfavourable weather. The neutrosophic components provide additional insights into the uncertainty of the estimation. The truth value (T = 0.9) suggests a high confidence level in the estimated duration based on historical data and expert judgment. The indeterminacy value (I = 0.6) accounts for uncertainties arising from unpredictable factors like soil conditions or operator efficiency. The falsity value (F = 0.4) represents the possibility that the estimated duration might be incorrect due to unexpected external disruptions. By incorporating this representation into NF-GERT, project scheduling can better accommodate uncertainties, leading to more reliable and adaptive planning. Figure 5 illustrates the geometric representation of SVTNFS for activity A01 . The probability of an activity occurring in the WBS is established through the weighted average method, which addresses varying probabilities provided by different experts for a specific task. Consequently, this approach consolidates and represents the opinions of experts with higher credibility.
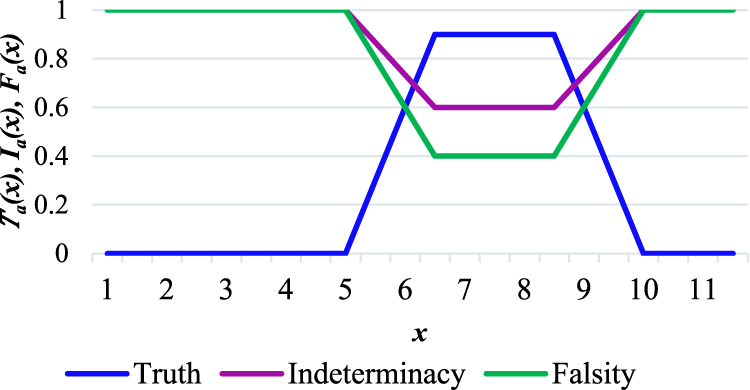
Geometric representation of SVTNFS for A01.
The WBS subsequently converted into the GERT network diagram for further analysis. Nodes are assigned numbers and outlined, with the illustration offering details about the node's inclusion in the loop and the number of activities required for the node to be actualised in the initial and subsequent occurrences. The GERT network of the fourteen-storey residential building is shown in Figure. 6. Table 1 provides the information about the various nodes depicted in the GERT network for the aforementioned building.
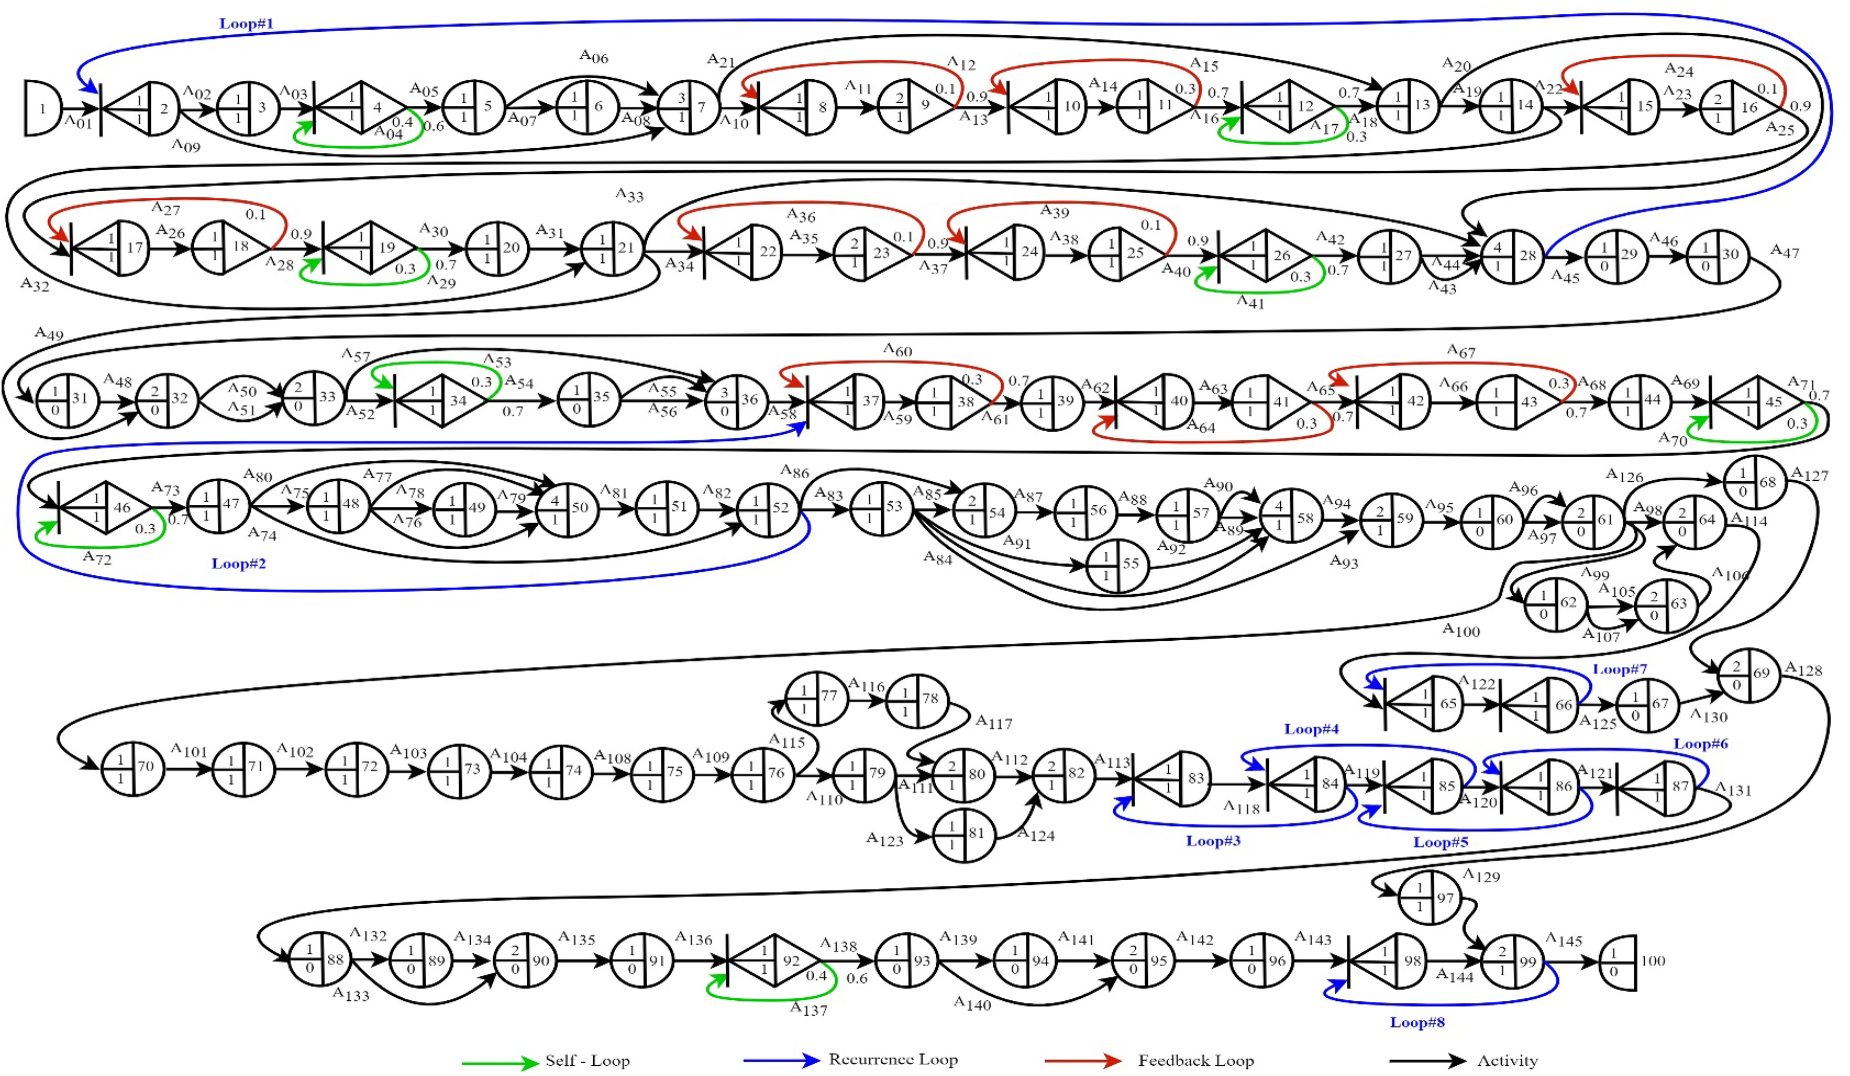
GERT network diagram of the multi-storey residential building.
The GERT network diagram (Figure 4) comprises loops categorized into three types: the self-loop, the recurrence loop, and the feedback loop. A self-loop occurs when one activity act as a prerequisite for the next, directed based on a certain circumstance to the same node. Activities
In the case of a recurring sequence of activities, a recurrence loop depicts the set of repeated tasks. The GERT network contains eight loops representing the recurrence of tasks and nine feedback loops. The construction site is initially divided into two pours, i.e., the construction site is divided into two sections for easy handling of the construction activities based on the resources available. After the operations in pour #1 are completed, the same sequence is repeated in pour #2. Loop #1 represents this cycle for raft foundation construction, involving activities like site clearance, excavation, dewatering (if necessary), dressing of loose soil, transportation of earthwork, laying waterproofing membrane, laying PCC, steps in the construction of raft slab, main beam, and secondary beam up to the floor slab for both the pours. This cycle (loop #1) repeats for pour #2. The fourteen-storey residential building is constructed using Mivan technology (a fast-paced technique of construction that gives a construction project improved strength and durability by employing aluminium formworks). Loop #2 depicts construction activity for RCC walls and roof slabs for stilt floors and other apartment levels. On the actualization of node 52, all arcs emanating from the node (loop #2),
The feedback loop is a controlled loop used to perform an activity iteratively, with the evaluation precondition being evaluated initially. The activities
The step-by-step computation process for applying the NF-GERT methodology in project duration estimation is delineated below.
Initially, each activity duration is represented as a SVTNN. The membership function for each activity is derived using Eqs. 2–4, which define the degree of truth, indeterminacy, and falsity, establishing the lower, upper, and middle bounds of the trapezoidal neutrosophic number to capture uncertainty in the time estimated by experts. The crisp value 
Illustrating computation: section from node 1 to node 13
To illustrate the calculation of the project completion time, a part of the network (Figure 6) is examined, specifically the activity flow from node 1 to node 13 as shown in Figure 7. This section consists of nodes connected in series, parallel, and loops.
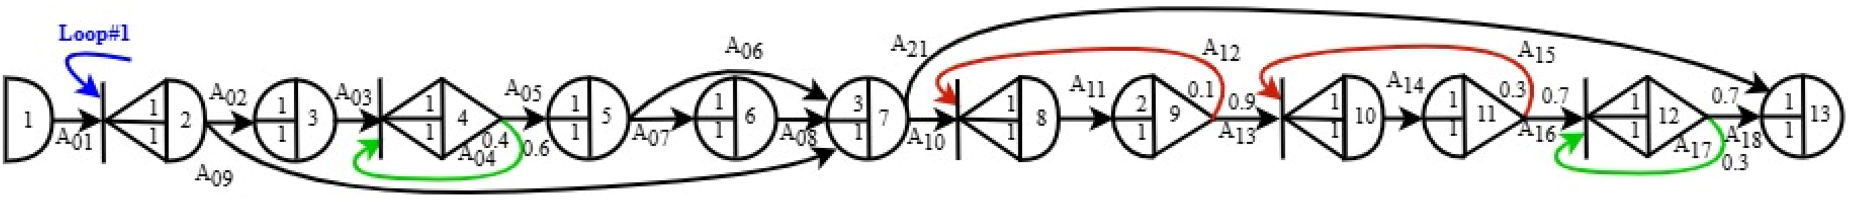
Section of the GERT network from node 1 to node 13.
Node 1 → 2: Node 1 is the source node. The realization time of 
Node 2 → 7: The network is further divided into small fragments since activities are connected in parallel from node 2 to node 7. This section (Node 2 → 7) also includes nodes 3, 4, and 5, which are connected in series, along with parallel connections between nodes 5 and 7. Node 4 is a probabilistic EXCLUSIVE-OR node with a self-loop, and thus it must be solved accordingly. Node 2 is a deterministic EXCLUSIVE-OR with two incident arcs, namely A02 and Loop #1. The deterministic EXCLUSIVE-OR node allows the realisation of only one activity incident on the node (A02 and Loop #1) while the other remains idle. Initially, only activity A02 is realized, while Loop#1 is realized only after node 28 is achieved. Node 3 is a deterministic node with incident A02 and emanating A03. Node 4 is a probabilistic EXCLUSIVE-OR node, where A04 and A05 emerge forming a self-loop. If the site demands any draining procedure, then de-watering activity (A04) is performed before the soil dressing activity (A04) for laying the foundation. If de-watering is not performed, activity A04 is omitted and A05 is accomplished. The probability of transition from node 4 to 5 without transiting the loop, i.e., omitting activity A04 is p05. The probability of transition from node 4 to 5 transiting the loop is 
Node 7 → 13: Similarly, the activity flow from nodes 7 to 13 represents a fragment of the network with arcs connected in parallel. The deterministic EXCLUSIVE-OR node 8 has two incident actions, but, only one activity is accomplished at a time, holding the other activity idle. The succeeding activity has a feedback loop that ends at node 8. The workflow is as follows: after the shuttering activity (A10) the placement of shutters is checked (A11) the inaccuracies are adjusted (A12) and the adjustments are rechecked (A11). When the adjustments are perfected, the next succeeding activity, i.e., reinforcements are fixed (A13). The duration of realization from node 9 to node 10 is 
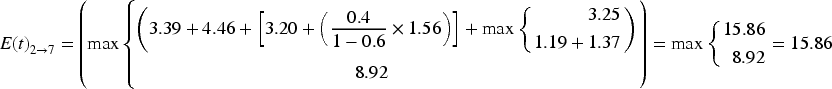
Similarly, the network is divided into smaller portions to solve loops and parallel arcs. Eqs. 2–4 are used to calculate the membership function of activity duration. The time estimate's crisp value is calculated using Eq. 10. The equivalent equation used to compute the project completion time
The project completion time
Ramani and Kannan (2014) compared completion times for an industrial construction project using three methodologies: CPM, PERT, and GERT. Their findings indicated that the GERT-formulated schedule exhibited superior efficiency, closely aligning with the actual project duration and showing minimal error compared to CPM and PERT schedules. 64
In a parallel investigation by Pregina and Kannan (2022), the researchers extended their comparative analysis to a single-storey residential building project, examining completion times generated by the CPM, PERT, and GERT methodologies. The results reaffirmed the effectiveness of GERT, as the project completion time calculated using this methodology demonstrated superior accuracy compared to CPM and PERT. 20 This supported and reinforced the earlier findings of Ramani and Kannan (2014), 64 highlighting the consistent advantages of GERT in improving scheduling precision across diverse construction contexts.
Recognizing the scarcity of research on GERT in construction, Mubarak (2019) 39 emphasized the pioneering significance of Ramani and Kannan's 64 work. The combined findings of Ramani and Kannan 64 and Pregina and Kannan 20 provide a strong foundation, demonstrating GERT's efficacy in optimizing project schedules and outperforming traditional methodologies like CPM and PERT in various construction contexts. Additionally, Pregina and Kannan 44 highlight the effectiveness of Fuzzy-GERT in construction scheduling, improving duration predictions by addressing uncertainties.
This research expands current understanding by integrating the neutrosophic concept into Fuzzy GERT. This incorporation enhances the modeling of uncertainty in project scheduling, allowing for a more comprehensive representation of imprecise and indeterminate information. The construction activities often face indeterminacy due to fluctuating site conditions, resource availability, and other external factors. 111 While Fuzzy-GERT addresses uncertainty by applying fuzzy logic to handle imprecise time estimates, it does not fully capture the complexities of indeterminacy, particularly when the information becomes inconsistent or incomplete. In contrast, the integration of neutrosophic sets into GERT, forming NF-GERT, offers a more robust approach by accounting for not only the degree of truth but also the degree of indeterminacy and falsity. The neutrosophic approach provides a flexible framework to handle uncertainties, improving the accuracy of predictions and decision-making in dynamic construction projects. This extension contributes to more robust and adaptable methodologies compared to traditional approaches.
Sensitivity analysis
The stochastic network approach is an increasingly influential and eminent tool for analysis and elucidation of the solution to complex problems. The results are validated by comparing the accuracy of outcomes with the scheduling methods in practice, i.e., Monte Carlo simulated GERT, CPM, and PERT. The Monte Carlo simulation model is a decision support system based on the multiple-point statistical simulation technique used to analyse complex stochastic problems with uncertainties. Predominantly used in risk management projects, Monte Carlo simulation addresses uncertainties associated with project duration and cost.60,112 The simulation technique can generate as many as 10,000 samples or more, maintaining the original complexity and uncertainty in the form of their probability distributions113–115. Applying Monte Carlo simulations to GERT advocates for the estimation of project schedules based on a large sample rather than a single statistical calculation.
To conduct an effective simulation, this study generated 10,000 different data set. The simulated data are incorporated into the equivalent equation to determine the simulated outcomes. Descriptive statistics for the simulated outcomes of the GERT network for the fourteen-storey building are shown in Table 2.
Descriptive statistics of the GERT network.

Descriptive statistics of the GERT network.
The network is analysed using the conventional methodologies (CPM and PERT) for the fourteen-storey building. The total project completion time for the fourteen-storey building according to CPM and PERT is estimated as 1207 days and 1274 days, respectively. Additionally, the expected duration calculated using the GERT (Monte-Carlo Simulated) network technique for the fourteen-storey building is 1384.53 days (≈1385 days). Figure 8 depicts the total project completion time computed using CPM, PERT, GERT, and NF-GERT methodologies.
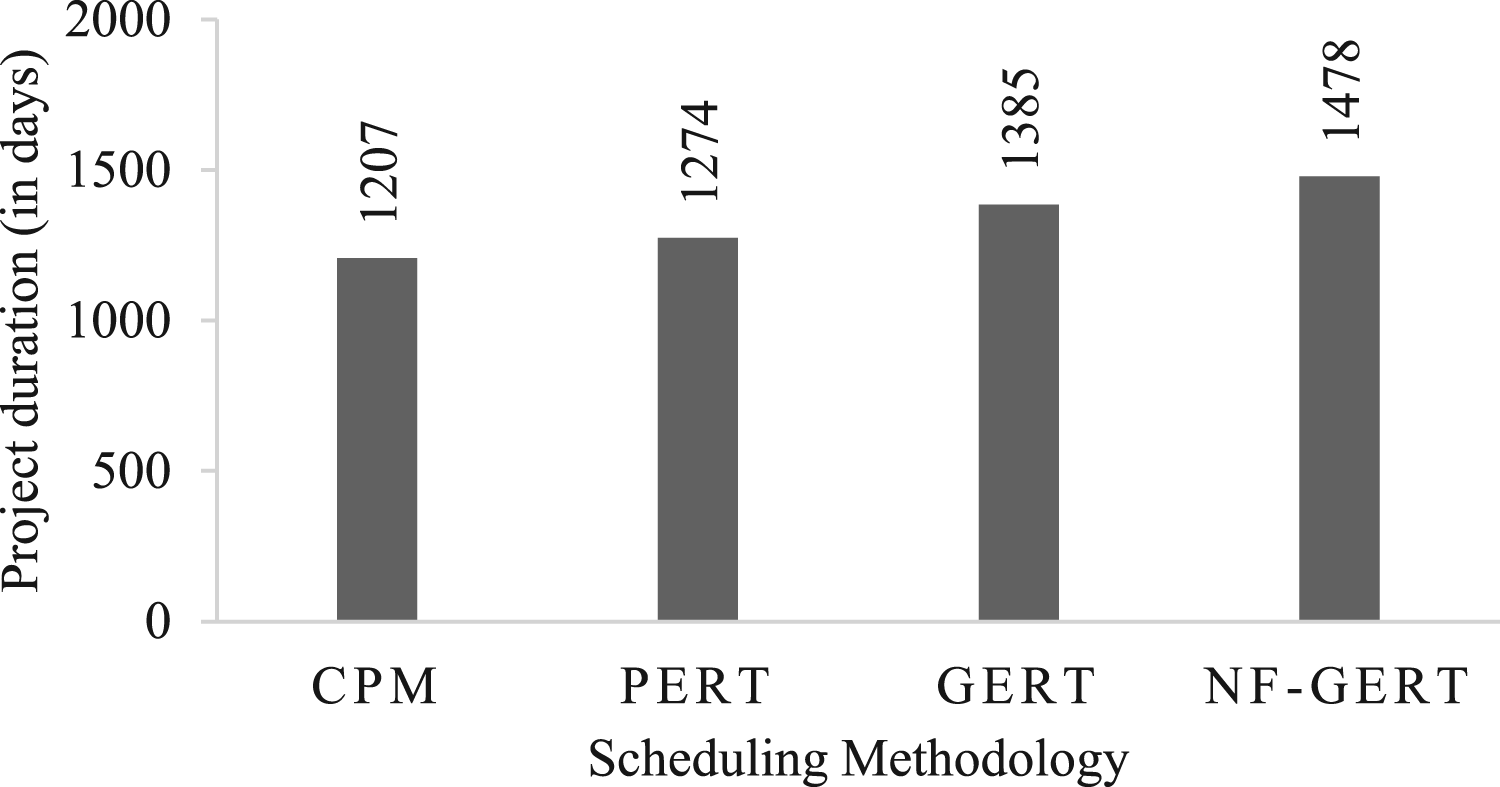
Total project completion time computed using CPM, PERT, GERT, and nf-GERT methodologies.
The comparison between the conventional methods (CPM and PERT), standard Monte-Carlo simulated GERT, and the proposed technique NF-GERT is depicted in a Kiviat diagram to visually demonstrate the effectiveness of the approaches as shown in Figure. 9.
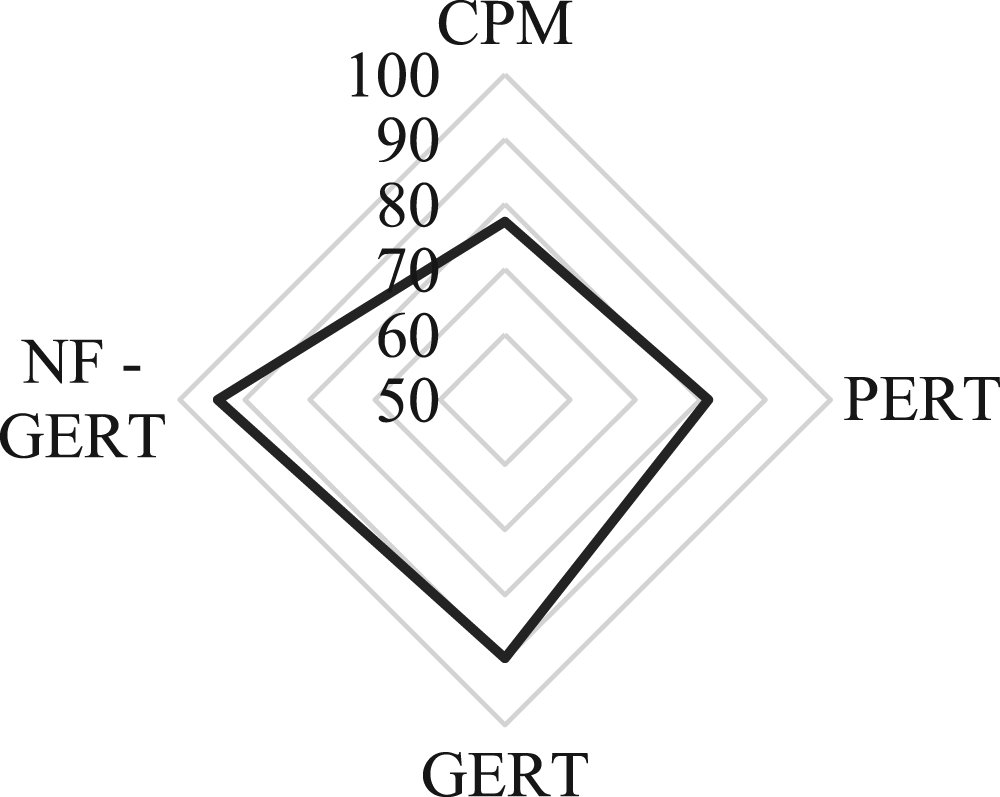
Kiviat diagram for performance measure of CPM, PERT, GERT, and nf-GERT methodologies.
The Kiviat diagram (or Spider chart) shows that the proposed Neutrosophic fuzzy-based GERT (NF-GERT) technique is approximately 94% accurate compared to the real-time data. The calculated duration of 1478 days was closest to the actual project duration of 1568 days for the fourteen-storey structures, in comparison with the other existing conventional scheduling methodologies. The percentage of error for CPM is approximately 23% and for PERT is approximately 19%. The notable difference in error percentages between NF-GERT and traditional scheduling methodologies highlights the remarkable superiority of NF-GERT in delivering more reliable and precise project completion time estimates. The Kiviat diagram indicates that NF-GERT not only outperforms in precision but also offers a more reliable and effective way to handle uncertainties in practical projects.
An examination of the fluctuation in activity probabilities is conducted to understand the consequences of alterations in these probabilities. The baseline probability values for each activity are established based on initial assessments. Then, the range of values for the probabilities to be utilized in the sensitivity analysis is determined. Table 3 presents the range of values for the probability of occurrence (V1, V2, V3, V4 and V5) of activities for the sensitivity analysis.
Modifications incorporated into the probability of occurrence of activities for the sensitivity analysis.
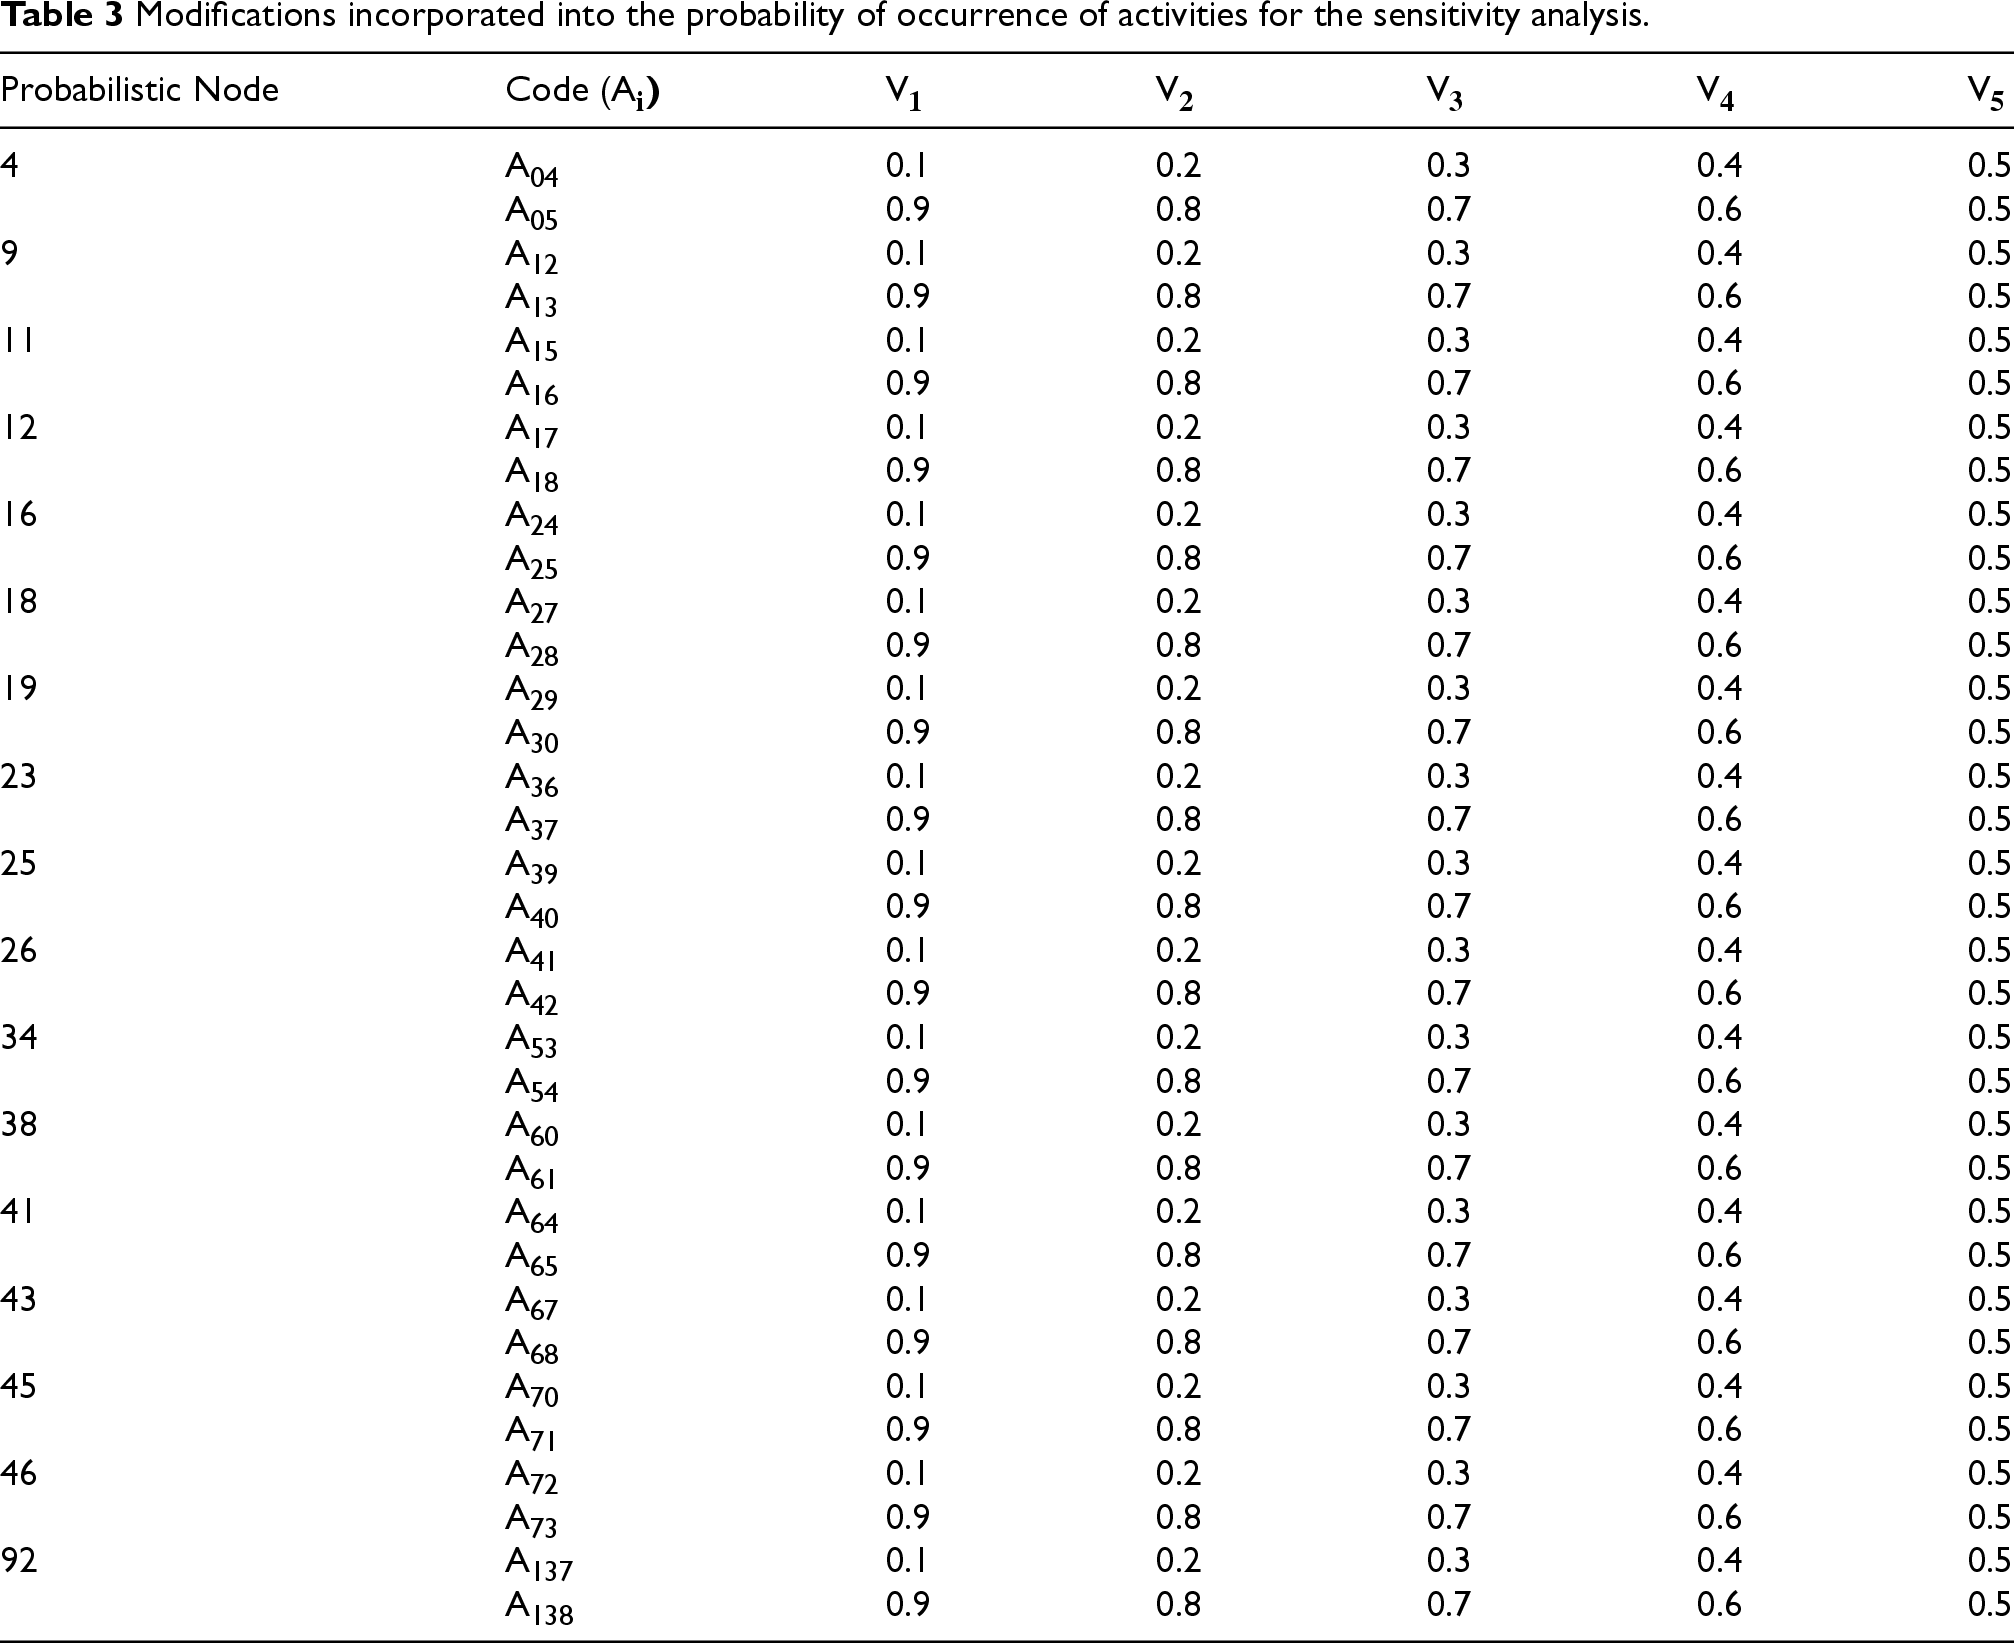
Subsequently, Monte Carlo simulation is employed to generate 10,000 iterations of project scenarios by sampling from the specified probability distributions. In each iteration, probabilities are adjusted within the defined range. The completion time of the construction project for each Monte Carlo simulation iteration is calculated using equation 15. This process yields a distribution of project completion times that accounts for the variability in activity probabilities.
The descriptive statistics derived from a Monte Carlo simulation, performed over 10,000 iterations, are presented in Table 4, providing an in-depth view of the distribution of completion times under various probability scenarios.
Descriptive statistics of completion times under various probability.
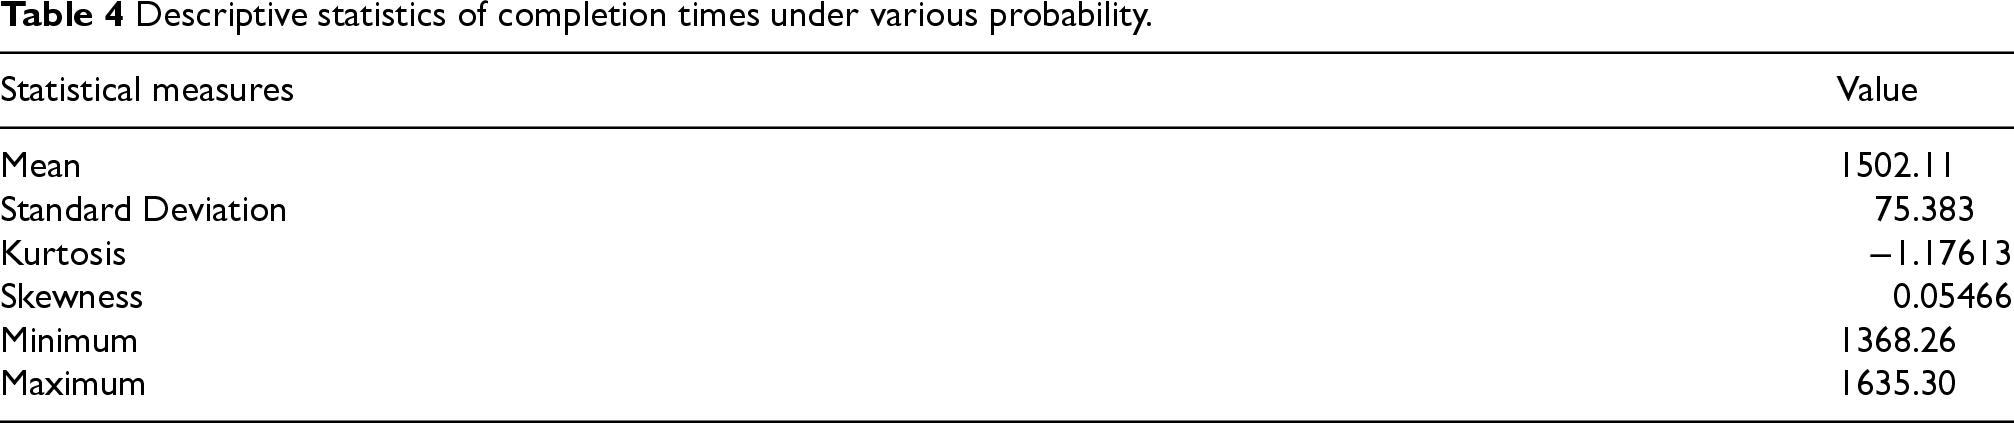
The histogram resulting from the Monte Carlo simulation offers a detailed perspective on the distribution of project completion times, providing key statistical measures for thorough interpretation. The mean completion time of 1502.11 days represents the statistical average, indicating a central tendency around which completion times cluster. However, the standard deviation of 75.383 days denotes a considerable degree of variability or dispersion in completion times, emphasising the inherent uncertainties associated with the project.
The negative kurtosis value of −1.1761311 indicates that the shape of the distribution of project completion times is less peaked or more spread out than a typical or “normal” distribution. Instead of having a high, narrow peak like a bell curve, the distribution is somewhat flatter. This flatter shape suggests that there is a higher chance of experiencing extreme values or outcomes that are significantly different from the average or mean completion time. The slight rightward skewness of 0.05465985 adds to this understanding. Skewness measures the asymmetry of the distribution. A slightly right-skewed distribution means that there is a longer tail on the right side of the distribution, suggesting that there is a possibility of having completion times that are later than the average or mean. So, both the negative kurtosis and rightward skewness indicate that the project completion times may vary, and there is a potential for encountering delays that exceed the anticipated symmetrical distribution.
Further analysis of the minimum and maximum completion times provides a clearer understanding of the potential project outcomes. The minimum completion time of 1368.26 days represents the shortest observed duration, while the maximum of 1635.30 days signifies the longest. This extensive range highlights the various scenarios explored in the Monte Carlo simulation, covering both optimistic and pessimistic timelines.
The 24-day difference observed between the simulated completion time (1502 days) and the calculated completion time (1478 days) suggests a slight variance in the projected project completion duration when accounting for changes in probability. This modest difference indicates a continual concordance between the outcomes derived from the Monte Carlo simulation for sensitivity analysis and the NF-GERT methodology, highlighting the adaptability and reliability of the proposed approach. However, when comparing these predictions to the actual observed as-built duration of 1568 days, it becomes apparent that the real-time scenario presented additional complexities or unforeseen factors that extended the project duration beyond the predicted average. The observed duration, falling within the range of the simulated and calculated durations, provides a degree of validation for the adaptability and robustness of the proposed novel multimethodology.
The researcher intends to demonstrate the application and reliability of NF-GERT by applying the presented technique to compute project duration for forty-five other cast-in-situ residential projects located across India. The total project time obtained using the suggested technique is compared to the total project duration obtained using the CPM methodology, considering CPM as a common approach used for scheduling construction projects. Additionally, the computed expected project completion time using NF-GERT is compared with the project duration calculated employing F-GERT to illustrate the effectiveness of the proposed method.
The construction of high-rise structures involves a significant number of repetitive activities as an essential component. The GERT network comprises loops, which depict activity recurrence. The cast-in-situ residential projects considered for validation are grouped based on the number of stories in the structure. The number of stories was employed as a criterion for grouping to demonstrate the loop feature of NF-GERT. Based on the number of stories, the projects were divided into three categories: namely, small, medium, and large. Small projects have no more than six stories, medium projects have seven to fifteen stories, and large projects have more than fifteen stories. Table 2 in the electronic supplement presents the list of projects considered for validation, along with the details of the projects such as construction area (in sq. m), number of stories, and actual project duration (construction time, in days).
The work breakdown structure (WBS) for the construction of residential buildings considered for validation is laid out, along with the relationships between the different activities. The WBS serves to construct a network diagram, which is a flowchart depicting the workflow. The project duration and the critical path for the considered projects are computed using the CPM technique. Initially, the forward pass method is used to compute early start and early finish times, while the backward pass approach is used to compute late start (LS) and late finish (LF) times. Subsequently, the activity float or slack for scheduling flexibility can then be computed using the early and late start and end dates. The critical path from the Activity-on-Arrow (A-o-A) diagram from the project manager of each construction project is determined. The WBS prepared for the CPM approach is used to construct the GERT network for all the projects being examined for validation.
To compute the project completion time (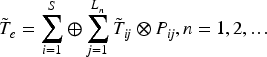
The trapezoidal membership function for the network's completion time is then transformed into a crisp value 
Then, based on the steps for applying NF-GERT explained in section 3, the project duration is computed using the proposed NF-GERT technique. When compared to the CPM, which is 80% proximate for small projects, 76% for medium projects and 72% for large projects, the proposed Neutrosophic Fuzzy based GERT (NF-GERT) technique is more accurate to the actual project duration (or completion time) with 98% significance for small projects, 95% for medium projects, and 92% for large projects, as shown in Figure. 10. To assess whether the observed improvement in accuracy using NF-GERT, compared to other methods is significant, a systematic approach through statistical hypothesis testing is essential.
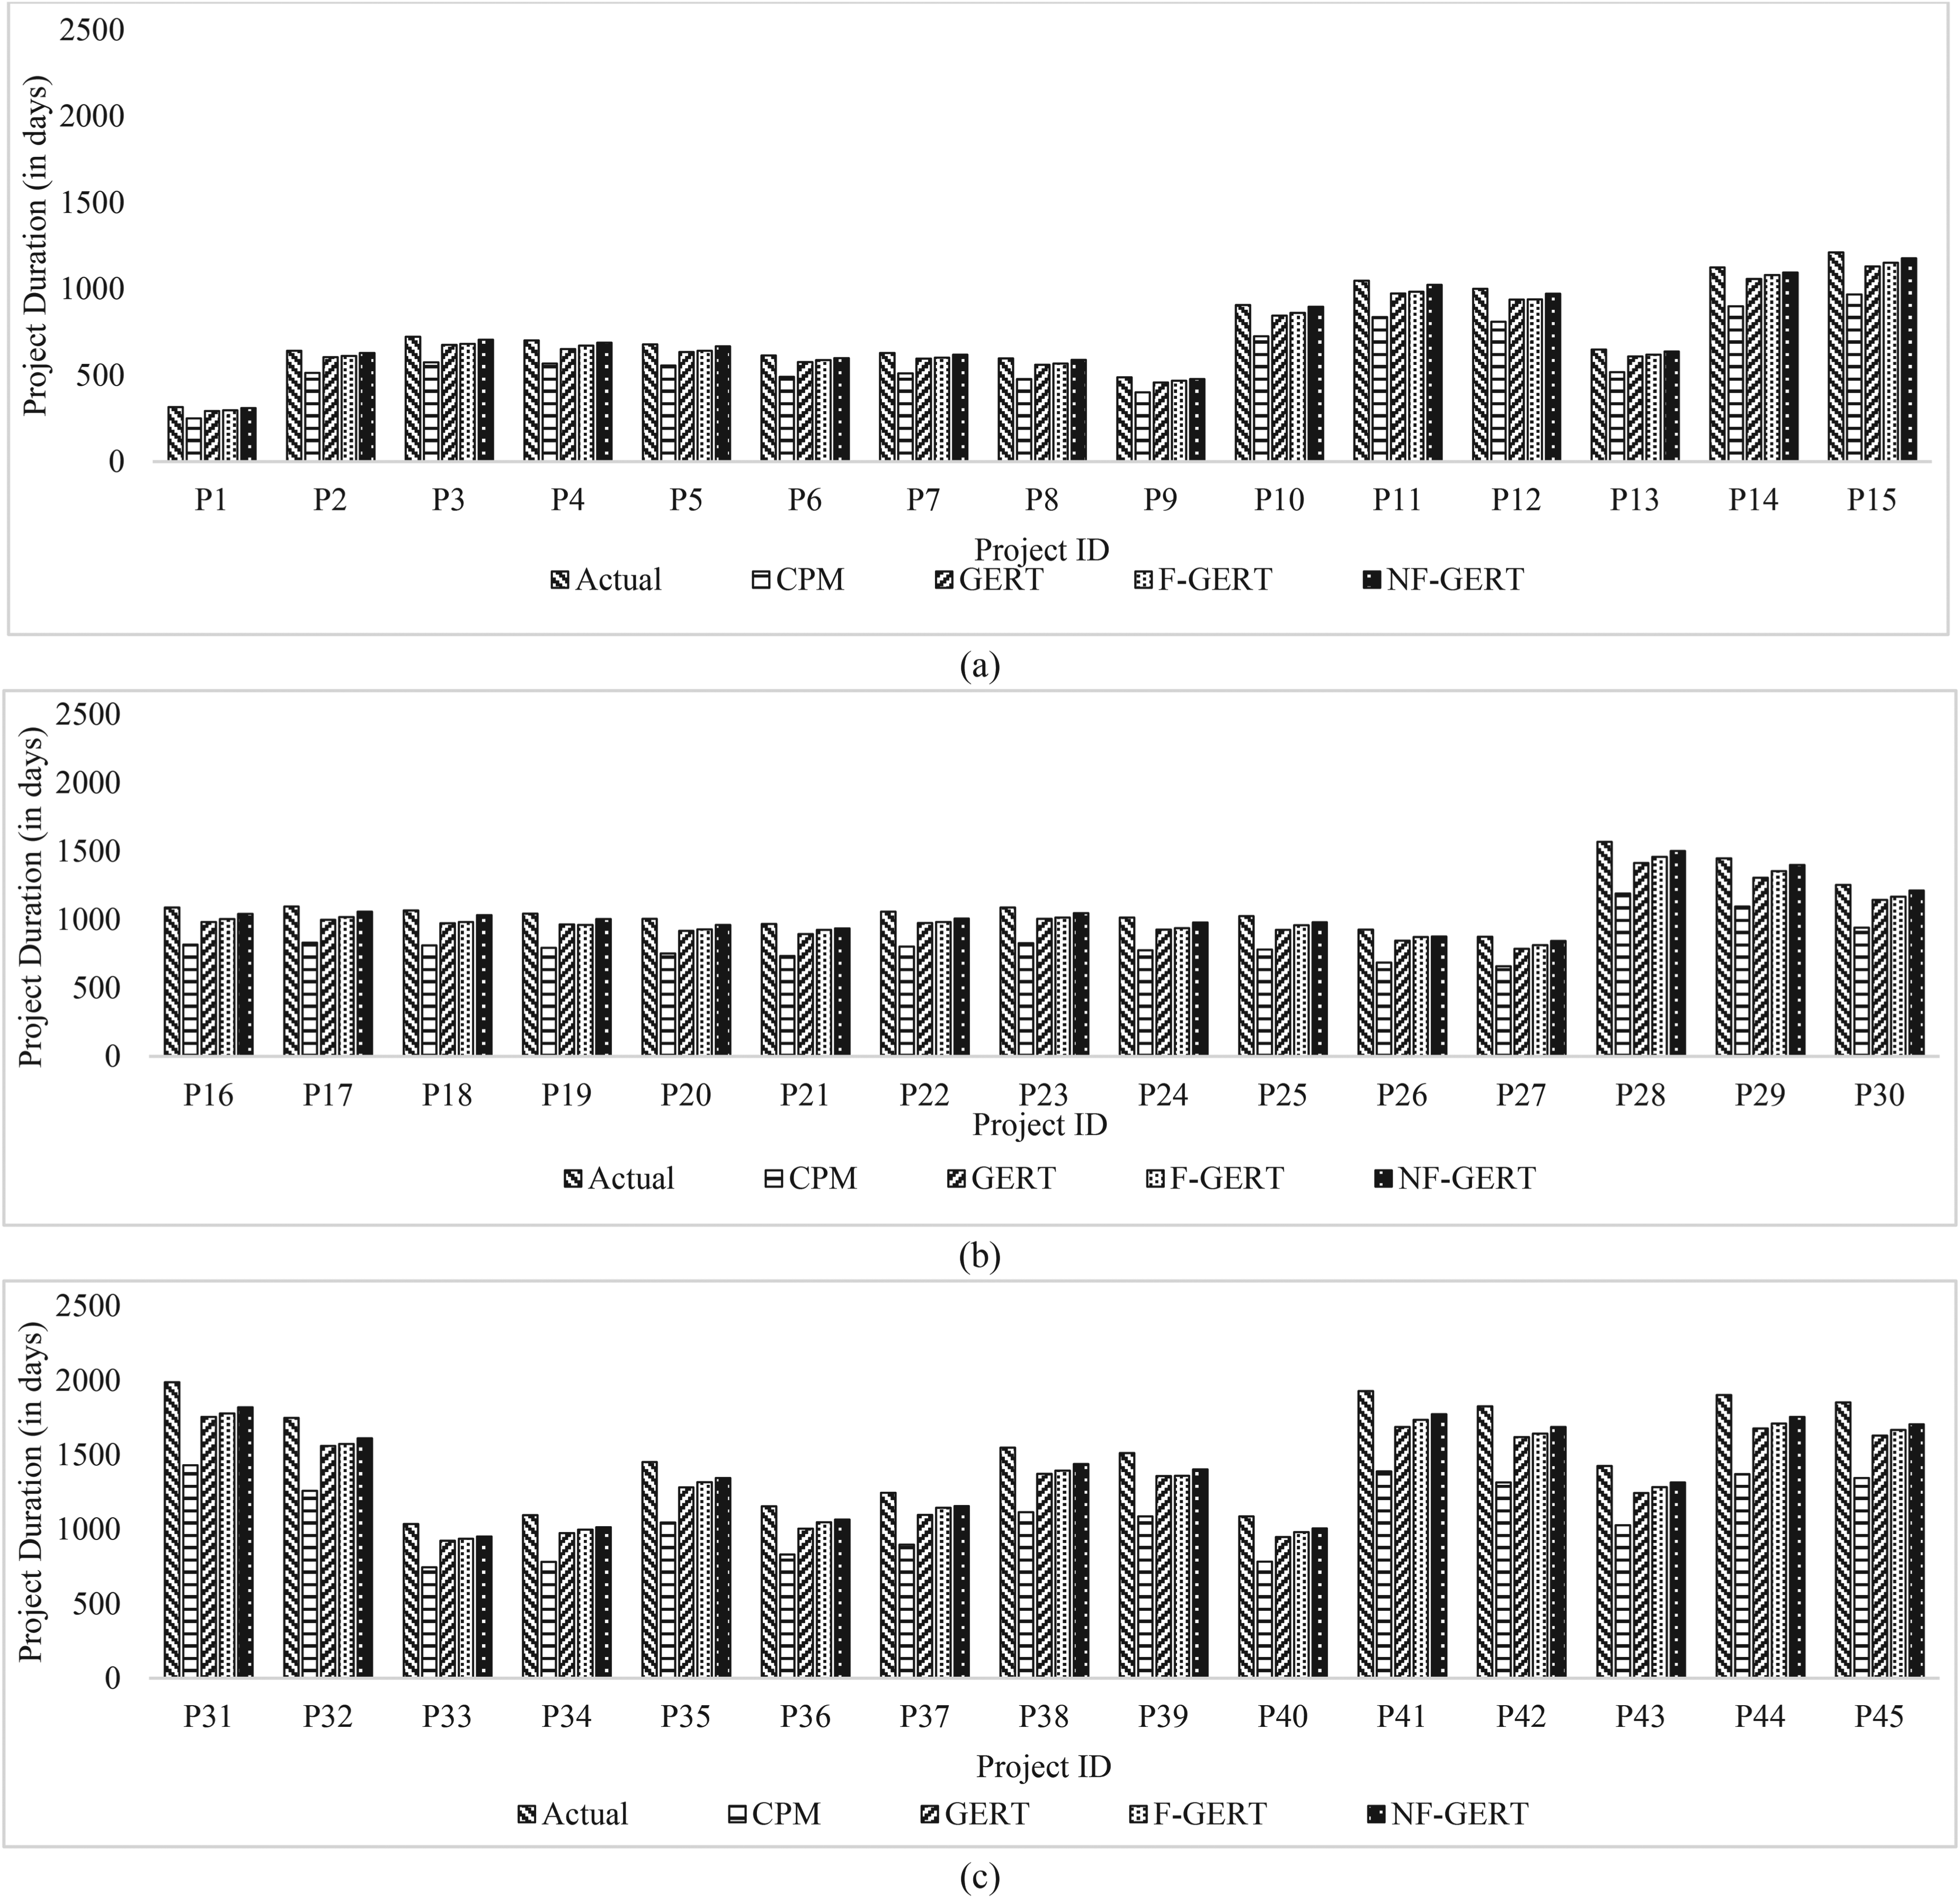
Project duration (completion time) of (a) small (b) medium (c) large residential projects.
To statistically assess the accuracy of NF-GERT in comparison to other scheduling methods, a one-way ANOVA is conducted using the SPSS software package. This analysis evaluates the accuracy scores across the same set of projects by comparing the durations estimated by various scheduling methods (CPM, GERT, F-GERT, and NF-GERT) with the actual as-built durations. The ANOVA examines the mean differences between project categories (small, medium, and large), considering the variability between the methods. At a 95% confidence level, the ANOVA determines whether these mean differences are statistically significant, indicating whether NF-GERT provides a significant improvement in accuracy over the other methods.
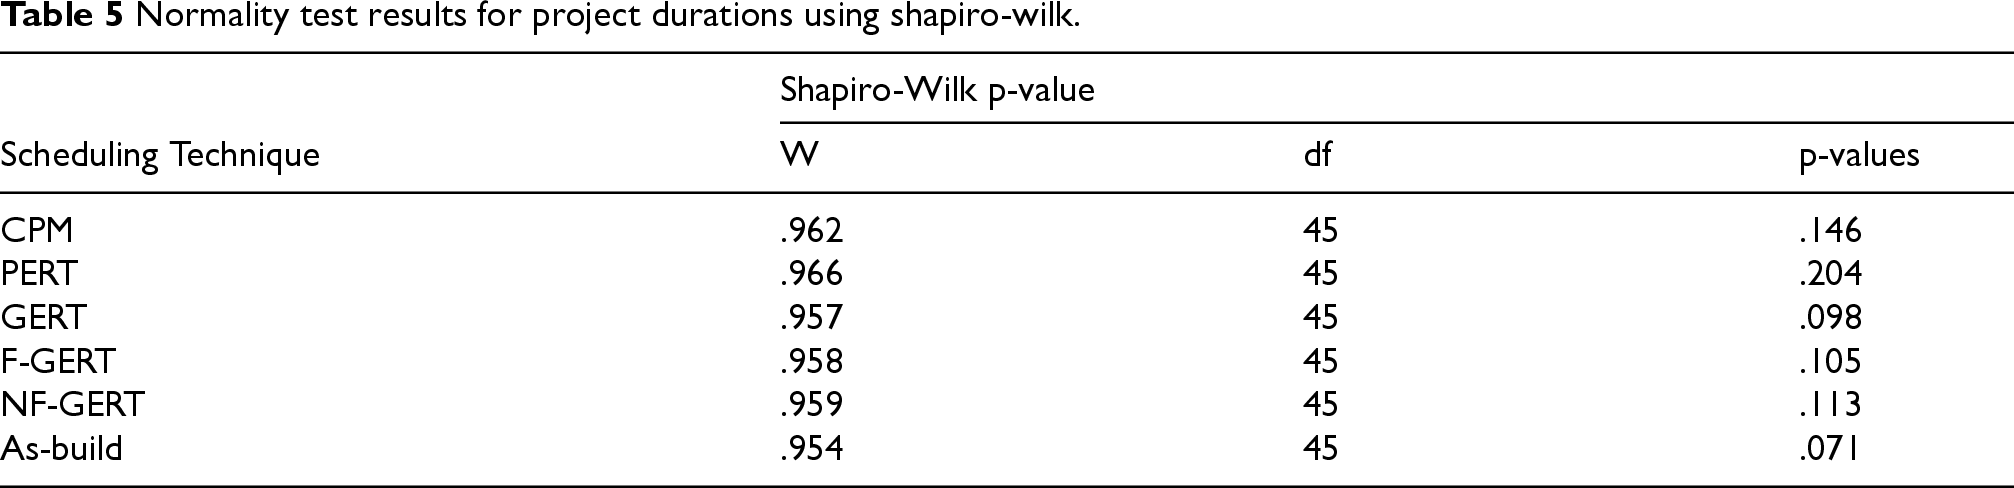
The durations of the forty-five real-time construction projects used for to test the variance are carefully reviewed to ensure they meet the required assumptions for the analysis. ANOVA relies on three basic assumptions: independence of observations, normality of data, and homogeneity of variances. 38 The durations of the 45 projects considered in the analysis are independent, ensuring that the observations within each group do not influence each other. To assess the normality of the data, the Shapiro-Wilk test which is appropriate for small sample sizes,120,121 is conducted using the SPSS software package, providing a statistical evaluation of the normality assumption. The Shapiro-Wilk test results in Table 5 indicate that the data for all methods tested follows a normal distribution. The Shapiro-Wilk statistics (W) ranged from 0.954 to 0.966, with 45 degrees of freedom (df), indicating a close fit to normality. The corresponding p-values ranged from 0.071 to 0.204, all above the significance level of 0.05, indicating no significant deviation from normality. Therefore, it can be concluded that the data is normally distributed.
Normality test results for project durations using shapiro-wilk.
Normality test results for project durations using shapiro-wilk.
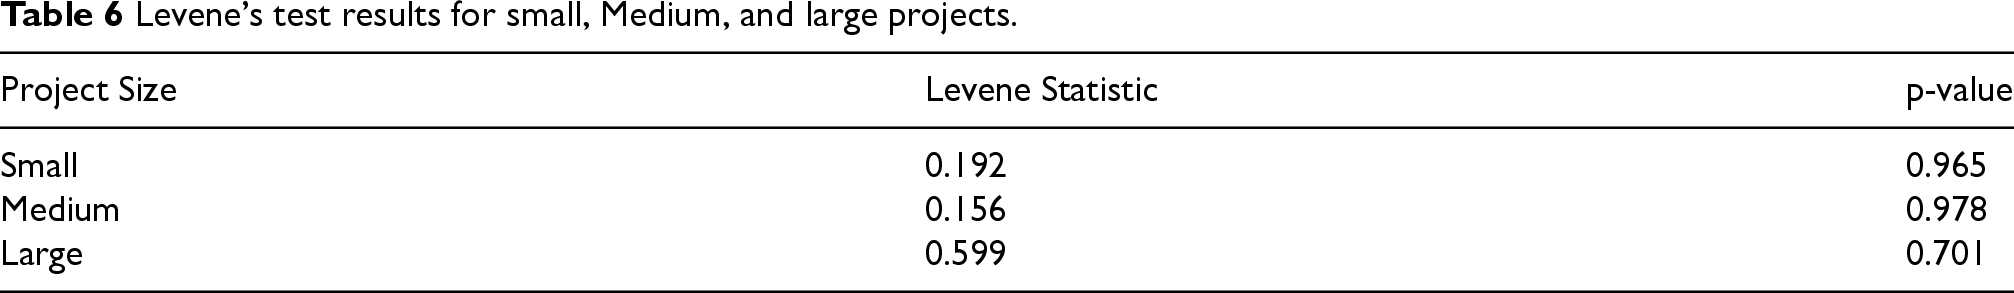
Additionally, homogeneity of variances is tested through Levene's test, also performed in SPSS, to confirm that the variances across the groups are approximately equal. The Levene's test results presented in Table 6, with p-values greater than 0.05, infer that the variances across small, medium, and large project groups are homogeneous, suggesting no significant variation in variances among the groups. The Levene statistic close to 0 further indicates that the variances between the groups are very similar, meaning homogeneity of variances is satisfied. These tests ensure that the fundamental assumptions of ANOVA are met for valid statistical analysis.
Levene's test results for small, Medium, and large projects.
An ANOVA test is conducted to identify the overall variance among the different scheduling methods, followed by a Tukey's Honest Significant Difference (HSD) post hoc test to pinpoint the specific methods contributing to the significant differences. The ANOVA results for small, medium, and large projects presented in Table 7 reveal different patterns of significance.
ANOVA results for small, Medium, and large projects.
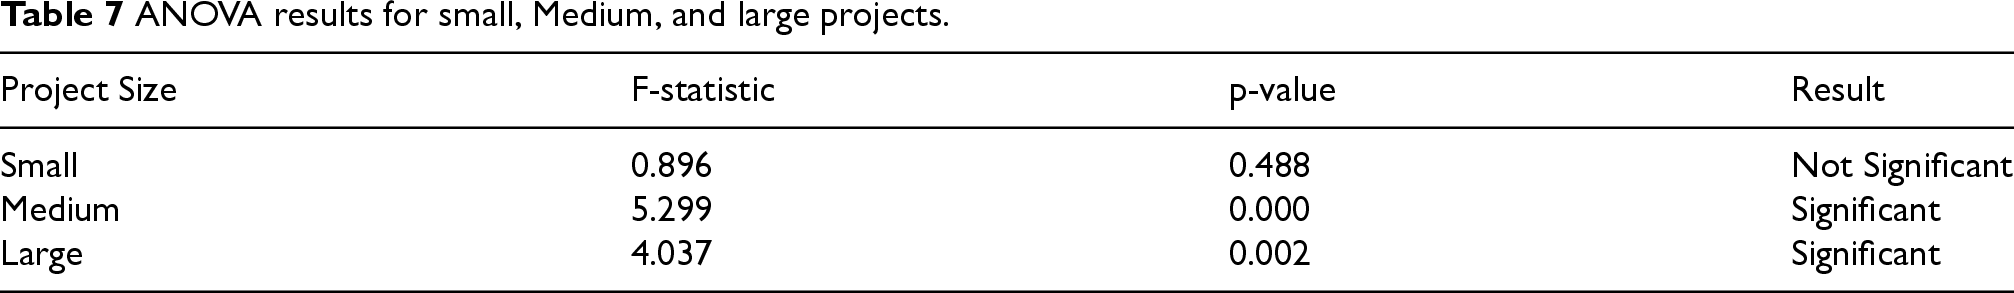
For small projects, the p-value of 0.488 indicates no significant difference in the durations across the various scheduling methods, suggesting similar performance. However, for medium projects, the p-value of 0.000 points to a statistically significant difference between the methods, with a moderate to strong effect as indicated by the F-value of 5.299. Similarly, for large projects, the p-value of 0.002 shows a significant difference, with an F-value of 4.037, suggesting that the choice of scheduling method has a considerable impact on duration estimates for both medium and large projects. Thus, while scheduling methods may not significantly affect small projects, they do play a crucial role in determining project durations for medium and large-scale projects. Therefore, to identify which specific pairs of methods differ, a post-hoc Tukey (HSD) test is conducted. Additionally, Tukey HSD is also performed for small projects to evaluate any potential variance among the methods, despite the lack of overall significance. Table 8 shows Post-Hoc Tukey HSD test results for durations across scheduling methods in small, medium, and large projects.
Post-Hoc tukey HSD test results for durations.
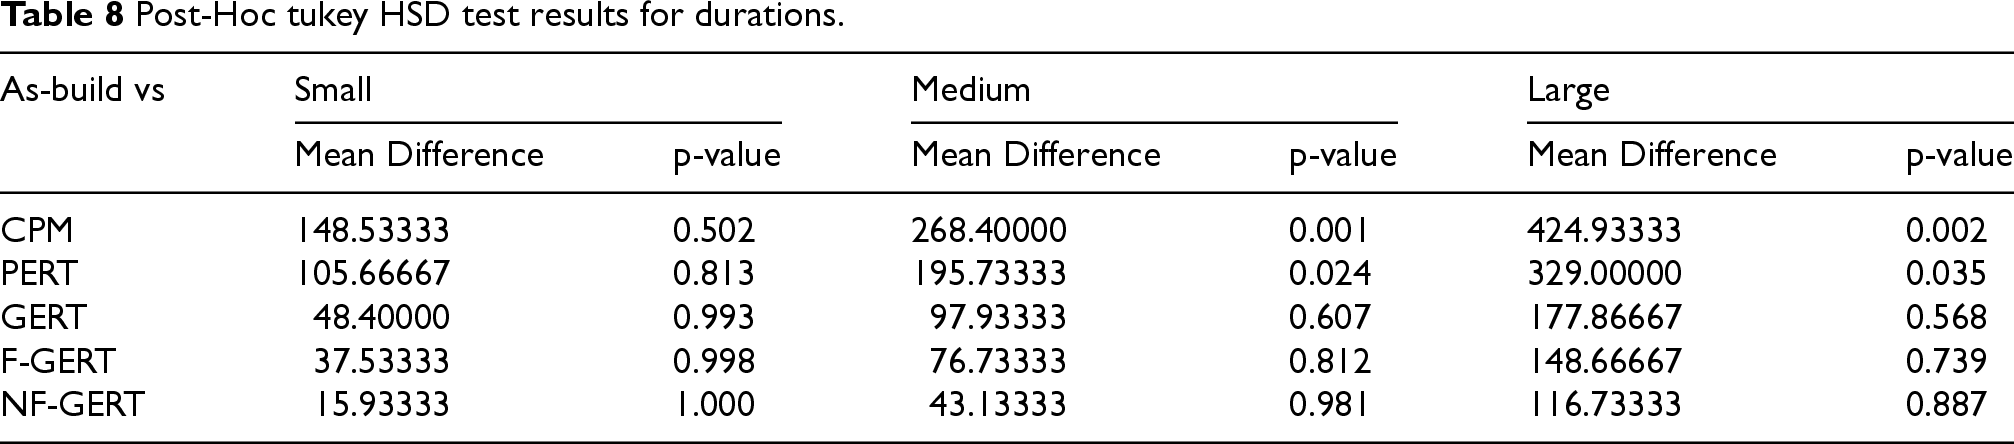
From Table 8, it is observed that for small projects, GERT, F-GERT, and NF-GERT exhibit relatively smaller mean differences when compared to the As-Build schedule, in contrast to the traditional methods. Among these, NF-GERT demonstrates the smallest mean difference of 15.93 days, suggesting that it closely approximates the actual project duration, though the result is statistically insignificant (p-value = 1.000). GERT and F-GERT also show minimal deviations, with mean differences of 48.4 days and 37.53 days, respectively, and p-values nearly equal to 1. Despite the lack of statistical significance, the mean differences for the traditional methods, CPM (148.53 days) and PERT (105.67 days), are notably larger compared to GERT, F-GERT, and NF-GERT. This indicates that GERT, F-GERT, and NF-GERT may all be suitable for small projects, with NF-GERT being the most proximate to the As-Build schedule.
For medium projects, Table 8 shows that F-GERT and NF-GERT have smaller mean differences when compared to the As-Build schedule, making them more suitable for medium-scale projects. NF-GERT exhibits the smallest mean difference of 43.13 days, which suggests it closely approximates the actual project duration, although the result is statistically insignificant (p-value = 0.981). F-GERT also shows a relatively small mean difference of 76.73 days, with a p-value of 0.812, further supporting its potential as a reliable method for medium projects. On the other hand, GERT, with a mean difference of 97.93 days and a p-value of 0.607, may not adequately account for uncertainty, which limits its effectiveness for medium-scale projects. In contrast, the traditional methods, such as CPM (268.4 days) and PERT (195.73 days), have larger mean differences and demonstrate statistically significant results (p-value < 0.05). Therefore, while traditional methods show larger deviations, F-GERT and NF-GERT provide more precise approximations of the As-Build schedule, making them more appropriate for medium-scale projects.
For large projects, Table 8 indicates that NF-GERT provides the most accurate approximation to the As-Build schedule, with a mean difference of 116.73 days and a p-value of 0.887. This suggests that NF-GERT closely approximates the actual project duration and is the most robust method for large projects. In contrast, traditional methods like CPM (424.93 days) and PERT (329.00 days) show much larger mean differences, indicating that they are less effective in predicting the duration for large-scale projects. F-GERT, with a mean difference of 148.67 days and a p-value of 0.739, also provides a reasonable approximation but is still less accurate than NF-GERT. GERT, with a mean difference of 177.87 days (p-value = 0.568), is the least effective among the methods, suggesting that it does not capture the necessary uncertainty and variability in large projects as effectively as NF-GERT. Therefore, NF-GERT emerges as the most suitable and reliable method for large projects, demonstrating its robustness in approximating the As-Build schedule.
The construction industry faces significant uncertainty in activity scheduling, impacting project schedules, expenses, and quality. Due to the inherent complexity and heterogeneity of the construction sector, ambiguity is inevitable in construction projects. However, effective risk management tools can mitigate uncertainty and facilitate project completion. This study focuses on scheduling large-scale construction projects, often subject to significant uncertainty and complexity using NF-GERT.
Traditional method links the start of an activity to the completion of preceding tasks or activities. Identifying precedence components and evaluating activity durations are crucial for experts in the construction process. The estimated durations are inherently ambiguous, and PERT's three-time estimates do not account for uncertainty. GERT network analysis, paired with simulation methods, addresses real-time issues. However, the Monte Carlo simulated GERT based on probability theory may lead to overfitting and slight inaccuracies in overall project completion time. NF-GERT considers truthfulness, falsity, and indeterminacy levels, aligning with ambiguity and examining intrinsic truth and relationships. The use of neutrosophic set trapezoidal numbers in construction projects is justified by the asymmetric nature of activities. In construction projects, changes in completion time are often non-uniform and not symmetrical, making trapezoidal functions more suitable than triangular numbers. Trapezoidal neutrosophic numbers provide a flexible representation of uncertainty, aligning with the practical reality of construction projects and offering an accurate framework for managing uncertainties in completion time estimates.
Adopting specific probability parameters, especially based on expert judgment, refines the probabilistic model. The weighted average method enriches the proposed model's complexity. However, the precision of chosen probability parameters is pivotal for result reliability. Sensitivity analysis, adjusting probability parameters systematically, elucidates the effect of variations on project completion time. This process ensures a deeper understanding of the NF-GERT model's performance and efficacy across a spectrum of probability values.
It is evident from the sensitivity analysis that the suggested methodology is more effective not just compared to other conventional scheduling approaches but also to Monte-Carlo-simulated GERT. The marginal difference observed between the simulated and calculated durations signifies the effectiveness of the NF-GERT methodology in producing closely aligned estimates, accounting for the fluctuations in probabilities. Despite the efficacy, the real-time as-built duration exceeds both predictions highlights the inherent complex and unpredictable nature of construction projects. This discrepancy emphasizes the challenges in precisely forecasting outcomes due to the dynamic factors influencing construction timelines.
Furthermore, the study also attempted to analyse the flexibility and adaptability of the proposed method by applying it to schedule forty-five other multi-storey building projects. The construction of a multi-storey structure is a complex and arduous process involving several interdependent elements, such as design and planning, material selection, construction schedule, building systems, and regulatory compliance. Any of these elements can significantly contribute to the uncertainty of the construction project, which may impact the project's cost, quality, and schedule. Compared to small projects, medium and large construction projects involve higher levels of complexity. This may entail more sophisticated construction procedures, stringent requirements, and multifaceted design work. Due to this intricacy, scheduling the various tasks, and ensuring their timely completion could be more challenging. The results demonstrate that adopting NF-GERT-based scheduling techniques yields realistic project durations, highlighting the significance of NF-GERT in project scheduling in comparison to the conventional fuzzy logic. The findings indicated that the expected project completion time for small, medium, and big construction projects varied significantly, with 98% for small projects, 95% for medium projects, and 92% for large construction projects, respectively.
The ANOVA and post-hoc Tukey HSD test results offer significant insights into the effectiveness of various scheduling methods across small, medium, and large projects, particularly emphasizing the role of project size and complexity in selecting the most appropriate method. The key finding from these results is that the choice of scheduling method is influenced by the scale of the project, with larger projects requiring more sophisticated techniques to account for uncertainties and complexities. For small projects, the results suggest that GERT is the most suitable method, as it exhibited the smallest mean differences when compared to the As-Build schedule. Despite the lack of statistical significance (p-value = 0.488), GERT, along with F-GERT and NF-GERT, provided relatively small deviations compared to the traditional methods, such as CPM and PERT. These findings imply that smaller projects, which tend to be less complex and involve fewer uncertainties, can be effectively managed using simpler scheduling methods. The performance of GERT and its variants in small projects highlights their ability to approximate project durations accurately, making them ideal for scenarios where uncertainty is minimal. In medium-sized projects, where complexity and uncertainty increase, the results indicate that F-GERT and NF-GERT are more suitable than traditional methods. The post-hoc test revealed statistically significant differences (p-value = 0.000 for F-GERT and p-value = 0.024 for NF-GERT), suggesting that these methods are better equipped to handle the increased variability and unpredictability typical of medium-sized projects. Both F-GERT and NF-GERT show smaller mean differences when compared to As-Build schedules, with F-GERT and NF-GERT offering more accurate predictions of project durations.
The improved performance of these methods over traditional ones underscores the importance of adopting more flexible and robust techniques that can account for the uncertainties inherent in medium-sized projects. For large projects, which are characterized by high complexity and substantial uncertainty, NF-GERT emerges as the most effective scheduling method. The results show that NF-GERT provides the closest approximation to the As-Build schedule, with the smallest mean difference of 116.73 days. The statistical significance (p-value = 0.002) and the smaller mean difference highlight NF-GERT's ability to handle large-scale project complexities, offering more accurate duration estimates than traditional methods like CPM and PERT, which showed much larger mean differences. The superior performance of NF-GERT for large projects suggests that, as the level of complexity and uncertainty increases, more advanced techniques like NF-GERT are essential for providing reliable project schedules.
Conclusion
This research highlights the implication of the novel hybrid stochastic network model, NF-GERT for scheduling construction projects. A comprehensive framework of NF-GERT and its application in the scheduling is demonstrated for a multi-storey (fourteen-storey) residential building. The estimated project duration is further compared to the project completion time obtained using the traditional methods (CPM and PERT). The project completion time estimated using NF-GERT methodology is observed to be close to the actual completion time of the fourteen-storey residential building. To exemplify the relevance of the approach, a sensitivity analysis is performed to get quantifiable data indicating that the proposed methodology is beneficial in the formulation of a construction project schedule.
Furthermore, NF-GERT is used to calculate the project completion time for forty-five other multi-storey building projects. This demonstrates the suitability of the proposed to generate realistic scheduled that lead to more practical implementation. The proposed Neutrosophic Fuzzy based GERT (NF-GERT) technique consistently produces project duration estimates that are more accurate to the actual project duration (or completion time) than other methods, with accuracy levels of 98% for small projects, 95% for medium projects and 92% for large projects.
The findings from the ANOVA and post-hoc tests underscore the importance of selecting the appropriate scheduling method based on project size and complexity. For small projects, GERT is sufficient, providing accurate duration estimates with minimal deviation. As project size increases, the need for more robust methods like F-GERT and NF-GERT becomes evident. F-GERT and NF-GERT are particularly suited for medium projects, where uncertainties begin to have a significant impact, while NF-GERT stands out as the most reliable method for large projects, effectively accounting for the greater complexity and uncertainty inherent in such projects. This demonstrates that, as project size grows, so does the importance of using more sophisticated methods capable of managing uncertainty and ensuring more accurate scheduling.
In addition, NF-GERT also performs better than the existing project scheduling methodologies such as CPM, PERT, and even traditional GERT. NF-GERT methodology can also be implemented in industrial scheduling as well. The proposed Neutrosophic Fuzzy based GERT approach is a holistic method for analysing complicated networks that permits a more precise evaluation of the scheduling parameters. Neutrosophy, as incorporated in NF-GERT, offers a more comprehensive representation of uncertainty than fuzzy logic, capturing not only the degree of membership but also the degree of non-membership and the degree of indeterminacy of a given element. This proves particularly beneficial in situations with complex and multifaceted uncertainty. Being a relatively new approach, neutrosophy has the potential to provide insights not possible within the more established framework of fuzzy logic, making it particularly useful in emerging research fields or where appropriate procedures may be limited.
Further research
This study demonstrates the effectiveness of the NF-GERT methodology in accurately estimating project completion time by incorporating uncertainty factors such as fuzziness and randomness. However, the computational process requires additional tools due to the complexity of handling uncertain input parameters. Future research could focus on developing an integrated computational framework to streamline the application of NF-GERT in real-world construction projects.
Moreover, while this study employs single-valued neutrosophic sets, exploring alternative representations, such as interval-valued neutrosophic sets, could enhance the flexibility and accuracy of uncertainty modeling. A comparative analysis of these approaches in construction scheduling could provide valuable insights into their performance variations and decision-making implications. Investigating the applicability of interval-valued neutrosophic sets may further improve project scheduling methodologies by offering a more comprehensive representation of uncertainty.
Footnotes
Acknowledgements
The authors would like to sincerely thank the technical experts and their organizations, academicians, construction personnel, contractors, construction workers, and discussants, directly and indirectly for their extended support and cooperation in providing valuable information regarding this research work.
Authors contributions/CREdiT
Funding
The author(s) received no financial support for the research, authorship, and/or publication of this article.
Conflicting interests
The author(s) declared no potential conflicts of interest with respect to the research, authorship, and/or publication of this article.
Supplemental material
Supplemental material for this article is available online.