
Abstract
The main goal of Credit Information Bureau India Limited (CIBIL) in the auto loan procedure is to give lenders vital information regarding borrowers’ creditworthiness. CIBIL scores help assess loan risk. This study uses advanced ML techniques, Gaussian Process Classification (GPC) and Gradient Boosting Classification (GBC), to predict scores, improving accuracy and reliability in evaluating creditworthiness for vehicle loan approvals. To enhance the accuracy of these predictive models, the Electric Eel Foraging Optimization (EEFO) and the Political Optimizer Algorithm (POA) are incorporated as optimization methods. By integrating these ML models with sophisticated optimization algorithms, a highly accurate prediction of CIBIL scores is aimed to be achieved. This can improve the efficiency and reliability of the auto loan approval process. GBEE excelled with top accuracy in both training (0.965) and testing (0.903) phases. GBPO closely followed, showing robust predictive power. GBC was reliable, particularly in high and mid-probability conditions, despite trailing GBEE and GBPO.
Introduction
These days, Credit scoring is becoming a more and more popular topic of discussion. Credit scores are used by lenders, including banks and credit card companies, to establish credit limits, interest rates, and who is eligible for a loan. 1 A credit score is a numerical representation of an individual's creditworthiness, or more specifically, a diagnosis of their financial fitness and discipline, based on a level study of their credit files. 2 Credit report data, usually obtained from credit agencies, is the main source of a credit score. A person's credit score, or CIBIL credit score, is a 3-digit figure that summarizes their credit history and credit rating. 3 The highest score is 900, and the range is 300 to 900. 4 A credit score of −1 would be given to people with no prior credit history. 5 Credit scores are considered zero if the credit history is less than 6 months old. 6 Generally, it takes from 18 to 36 months to increase one's CIBIL credit score.
Therefore, one cannot underestimate the importance of the CIBIL score in processing an application for a vehicle loan. 7 As stated by the lenders, CIBIL scores have been considered one of the most important factors for the approval or disapproval of an applicant for a car loan. 8 In the process of car loans, CIBIL scores are quite important. It is a numerical representation of an individual's creditworthiness based on his/her financial activities and past credit performance. 9 This score is one of the most important factors for lenders when considering loan applications. A high CIBIL score, usually above 750, indicates that one is in a very good credit health position, thereby increasing one's chances to get his/her loan proposal approved with the best terms and conditions, such as the best interest rates and highest loan amounts. 10 Conversely, a poor CIBIL score may lead to the approval or rejection of any loan under strict terms and conditions, such as higher interest rates and more stringent policies for repayment. 11
Auto loans provide financing for consumers to purchase automobiles and pay them back over a pre-determined time, usually through monthly installments. 12 These loans may be taken out as either secured or unsecured, the former being more common due to the lower interest rates associated with them and because there is far less risk associated for the lender in a secured loan, which puts up the car used as collateral. 13
One does consider how very reluctant one would be to lend a large sum of money to a buddy, even when the friend's past history of repayment has been stellar. The selection process becomes difficult in the absence of a licensed and approved organization capable of offering a trustworthy credit assessment. This is where banks and other financial organizations benefit from CIBIL. CIBIL scores provide a quick overview of a person's credit history and health, aiding lenders in determining the borrower's propensity and capacity for timely debt repayment. 14
A few crucial steps need to be taken to keep the CIBIL score high and increase the chances of securing an auto loan. Firstly, bills should be constantly paid on time. Late payments are viewed unfavorably by lenders, but prompt bill payment demonstrates financial responsibility and discipline, raising the credit score. Balances should be kept low to control credit consumption carefully. Excessive credit balances can lower the credit score and indicate financial pressure. Maintaining credit card balances far below their limits and using no more than thirty percent of available credit is ideal. 15
While those with lower credit scores might be offered loans with stricter terms or higher interest rates, those with higher credit scores might be eligible for cheaper interest rates and better loan terms. 16 Joint, guaranteed, and co-signed accounts need to be regularly checked. The creditworthiness in this sort of account would mean that both parties are equally responsible in case of late payments, and carelessness from one may affect the creditworthiness of another. So, periodic review of these accounts ensures no delay is made in paying, and ultimately, it saves the credit score. If the above guidelines are followed, then a high CIBIL can be sustained, and in turn, it will make one a decent applicant for any auto loan or other credit opportunities. 17
Study aims
In this given study, the investigators focused on the automobile loan prediction capability of the CIBIL score. Advanced ML techniques, such as GPC and GBC models, were employed for this. Further, more advanced optimization algorithms like EEFO and POA were applied to this investigation in order to improve the accuracy of the results. Further, these algorithms were combined to form hybrid models whereby synergistically, those inherent challenges and limitations were addressed effectively. The hybrid models showed better predictive power by leveraging the strengths of the predictive models and optimization algorithms in minimized errors with maximized reliability of predictions for loan approval. This is an umbrella approach whereby the relationship between CIBIL score and automobile loan approval is improved, along with the potentiality of advanced computational techniques in the financial decision-making process.
Literature review
The first empirical research on the existence of credit reporting operations in about 40 countries worldwide was given by. 18 In addition, they have conducted the effects on the whole economy considering factors like credit availability, credit volume, credit pricing, and credit portfolio quality. In “A Portfolio View of Consumer Credit,” Musto and Souleles 19 analyzed the “covariance risk” of individual consumers, i.e., the correlation of their default risk with overall consumer default rates, using a unique panel dataset of credit bureau records. They found significant heterogeneity in covariance risk among consumers, with high covariance risk linked to low credit scores and a significant positive correlation between credit scores and credit obtained, with a smaller negative effect from covariance risk. In their 2003 study, Galindo A. and Miller M.J. 20 meticulously examined global private and public information-sharing arrangements, complemented by empirical analysis using a freshly collected dataset. Their research revealed significant insights. They observed a positive correlation between the breadth of credit markets and the intensity of information sharing. Additionally, both public and private information sharing were found to alleviate defaults, with stronger evidence favoring the former. Interestingly, the presence of private credit registers decreased the likelihood of establishing public credit registers. They noted that government intervention in information sharing tends to be more prevalent in nations lacking private arrangements and having weak creditor rights protection. This study represents an important initial stride in comprehending the impact of information sharing on credit markets, underscoring the necessity for further investigation, particularly concerning its ramifications in developing countries and its influence on the conduct of banks and borrowers. According to Galindo A. and Miller M.J. 20 microeconomic data, nations with highly developed credit registers face fewer financial constraints than those with less developed credit bureaus. It has been discovered that effective credit registries greatly lessen financial limitations by lowering the susceptibility of businesses’ investment decisions to cash flow availability.
According to Sareef Jameel Malbery and Altab Althar Taha, the development of e-commerce and communication technology has led to a rise in the usage of credit cards as a payment method. Transaction fraud, however, has also increased. Light gradient boosting machine optimization and hyper-parameter optimization based on Bayesian theory were used to alter the parameters of the enhanced light gradient boosting machine (LightGBM). This approach used two publicly accessible real-world dataset sets, one of which included fraudulent transactions and the other of which did not. The accuracy of their proposed system was higher than that of other approaches. The proposed method yields a 56.95% F1-score, 92.88% area under the output response characteristics curve (AUC), 97.34% precision, and 98.40% accuracy. 21 According to a study by Baker, Mohammed Rashad, Zuhair Norii Mahmood, and Ehab Hashim Shaker, credit card fraud causes sizeable financial losses. Many researchers have been trying to come up with innovative ways to stop this loss, but most of them are time-consuming, costly, and labor-intensive. The authors have concluded that the unequal classification of the dataset is the main reason of the incorrect findings based on a number of experimental studies. These lopsided classifications are the result of an unbalanced dataset, which caused economic harm and inaccurate model predictions. They found that LR, SVM, ANN, and the C5.0 decision tree method are the best algorithms in terms of sensitivity, AUCPR, and accuracy. The balanced dataset was used to train these models 22 . Ni, Lina, et al. suggested a novel multi-stage process. First, the cardholder's transactions are collected, then they are combined based on behavioral patterns, the dataset is classified, the model is further trained, and finally the model is tested. A feedback mechanism is used to alert the system of abnormal behavior as it happens. 23 Due to the reasonably appropriate ratio of fraudulent to genuine transactions, Peter, A., K. Manoj, and P. Kumar presented an ensemble learning approach for credit card fraud detection. They discovered that Random Forest and neural networks work better together to detect fraud instances more accurately. Large credit card transactions from the real world were also used in their studies. Ensemble learning combines Random Forest with neural networks. 24
Dataset details
The dataset includes some variables that are important for forecasting CIBIL scores for those who are seeking auto loans. Important factors consist of:
The relationships between a dataset's input and output variables are shown visually via a correlation plot in Figure 1. The correlation coefficient, which displays the strength and direction of the association, is displayed in each plot cell. For instance, the requested amount and the ex-showroom price have a strong positive association, indicating that the amount asked for an auto loan tends to increase proportionately to the ex-showroom price of a car. Furthermore, a strong positive link between the desired amount and the present valuation is shown by the correlation plot. This implies that the requested loan amount tends to increase in tandem with an asset's existing valuation. Table 1 presents statistic properties of the input variable the utilized dataset.
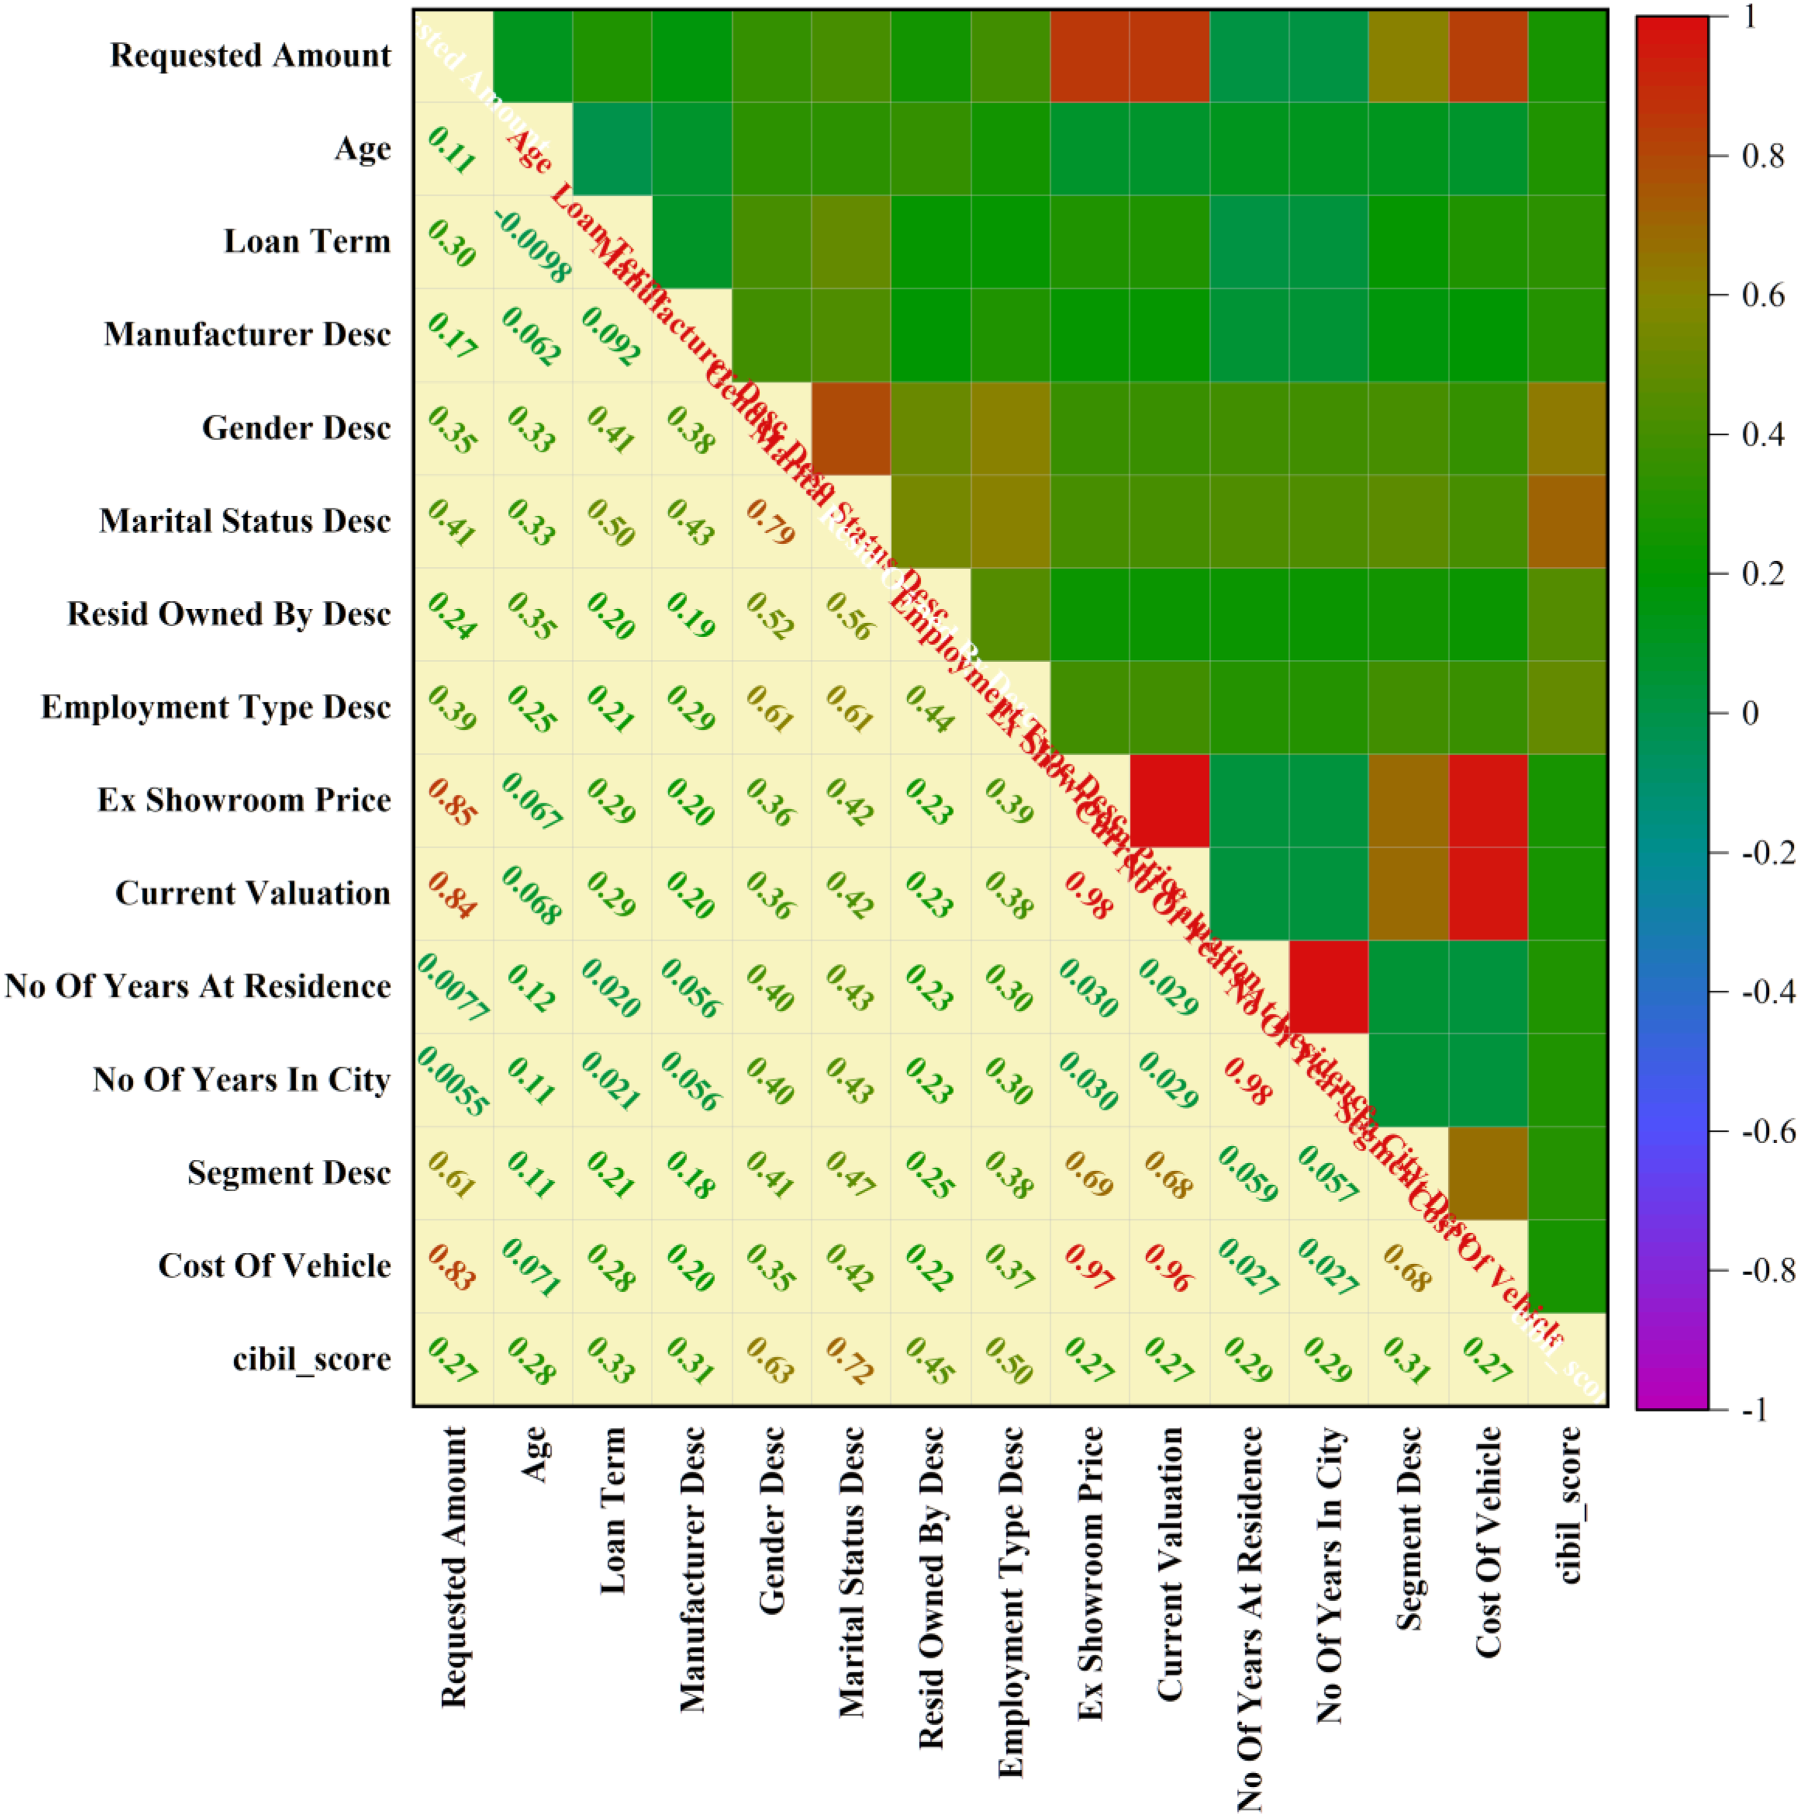
The correlation plot of the inputs and output variables.
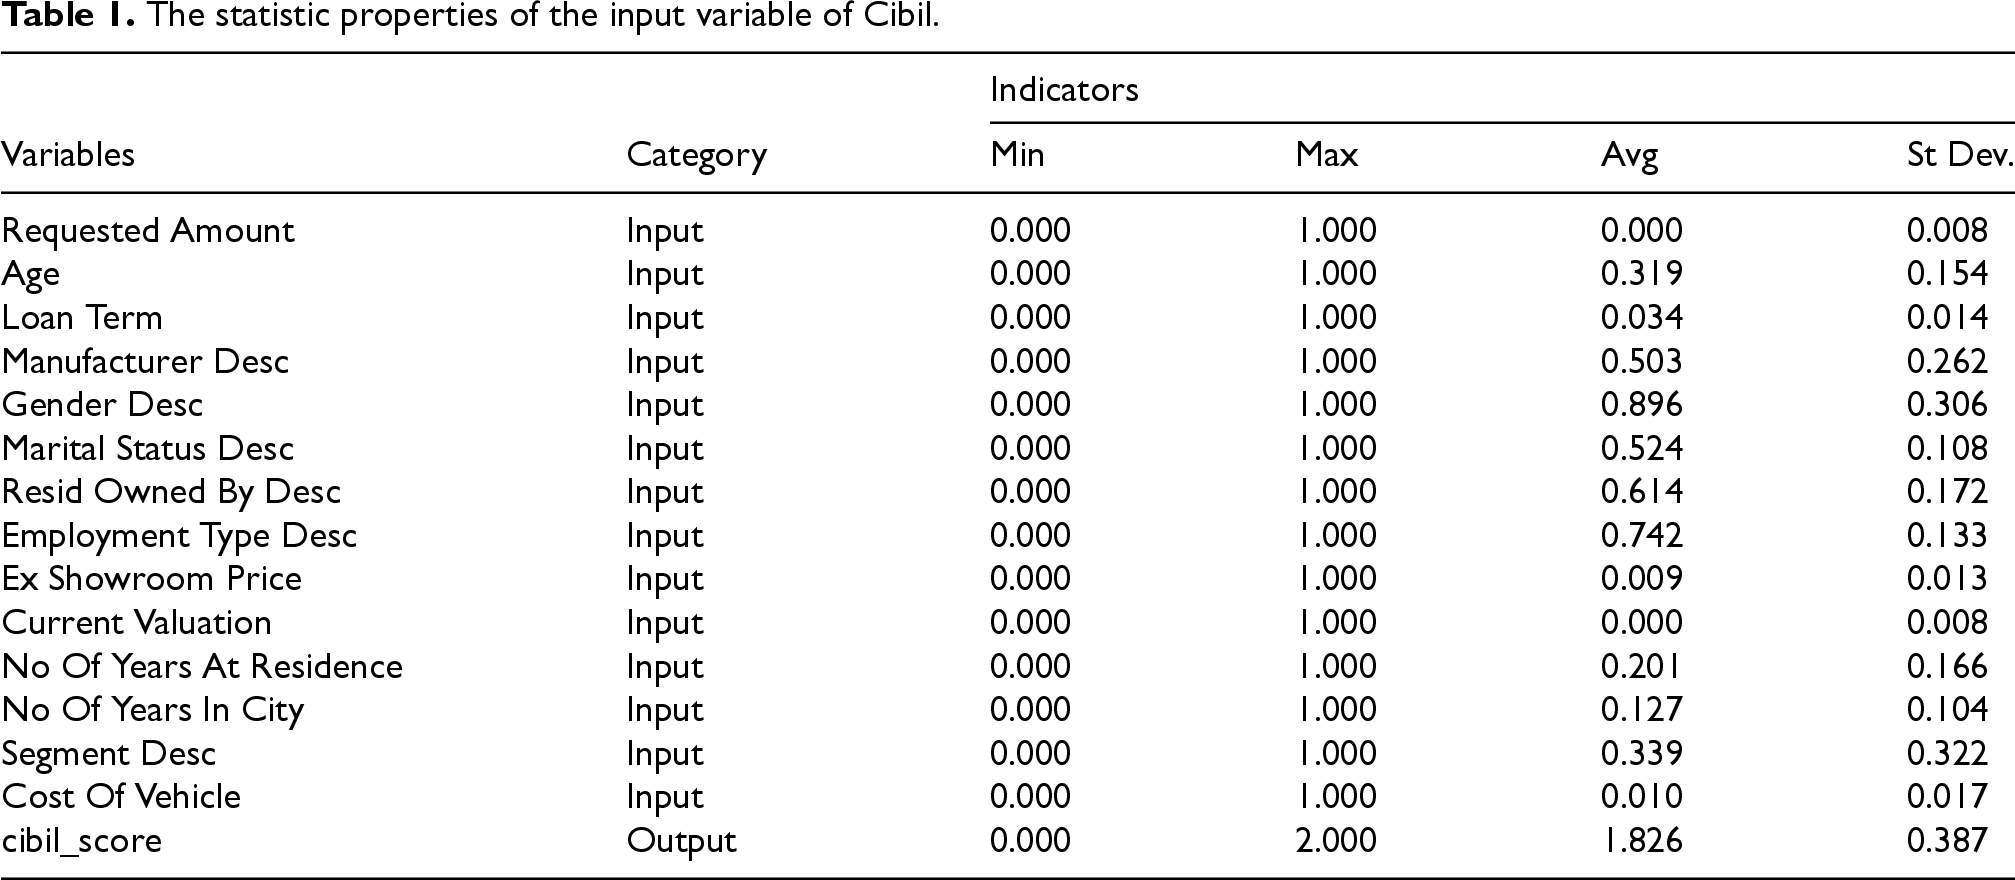
The statistic properties of the input variable of Cibil.
All available features in the dataset were used directly for model development without applying feature selection or dimensionality reduction techniques such as Principal Component Analysis (PCA), recursive feature elimination, or mutual information-based selection. The decision to retain the complete feature set was based on three considerations:
Gaussian process classification (GPC)
Ancestors of normal distribution procedures offer well-defined non-parametric function patterns. To carry out classification using this former, the process is compressed using a sigmoidal reverse-connection technique, and the data is subjected to a Bernoulli probability based on the function magnitudes that have been transformed.
25
As

The primary goal is to estimate the posterior probability distribution, or
On-demand, dynamic specifications for the base-learner and loss function models are possible. With a bespoke base-learner 
Choose the new function that is closest to 
To summarize, the Friedman (2001) entire gradient boosting technique can be defined. The exact structure of the resulting algorithm and its supporting formulas will be greatly influenced by the design decisions made for
In contrast to GOA, EEFO is an algorithm that draws inspiration from nature.28,29 Specifically, EEFO is recommended based on the electric eel's foraging behavior during 2 stages: interaction, resting, hunting, and migration. The update process for fresh EEFO solutions is derived from the mathematical formulation of the final 2 phases, and it is provided as follows:
The stage of interaction
The eel's progress in the search space at this point is determined by its direction, the neighborhood eel, and the comparison between its current position and the random eel in the search space. The eel's movement in this stage can be expressed as follows:
At this point, each eel in the population is represented as moving in the following way:

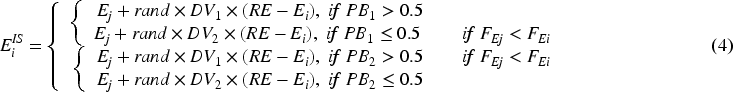
In Eq. (4),
During this phase, the eel's movement will be determined by the difference in position between it and the prey, which may be found in the equation below:

The new location of the eel during its migration stage is denoted by
The eel in the hunting stage can be expressed as follows:

The political election process in human civilization serves as the inspiration for the POA, a unique intelligent optimization system. 30 Every party member in POA can be thought of as a potential solution, and their voting patterns can be considered as an assessment tool. Furthermore, the Party members’ votes are correlated with the candidate's solution's fitness value. In contrast to conventional algorithms that rely just on political elections, POA takes into account every stage of the electoral process, encompassing the 5 stages of party formation and constituency distribution, election campaigning, party switching, inter-party elections, and parliamentary matters. POA uses a multi-stage iterative method to find the best answer; Figure 2 illustrates the primary algorithm flow of POA. The 5 primary phases will be introduced in the following of POA. 31
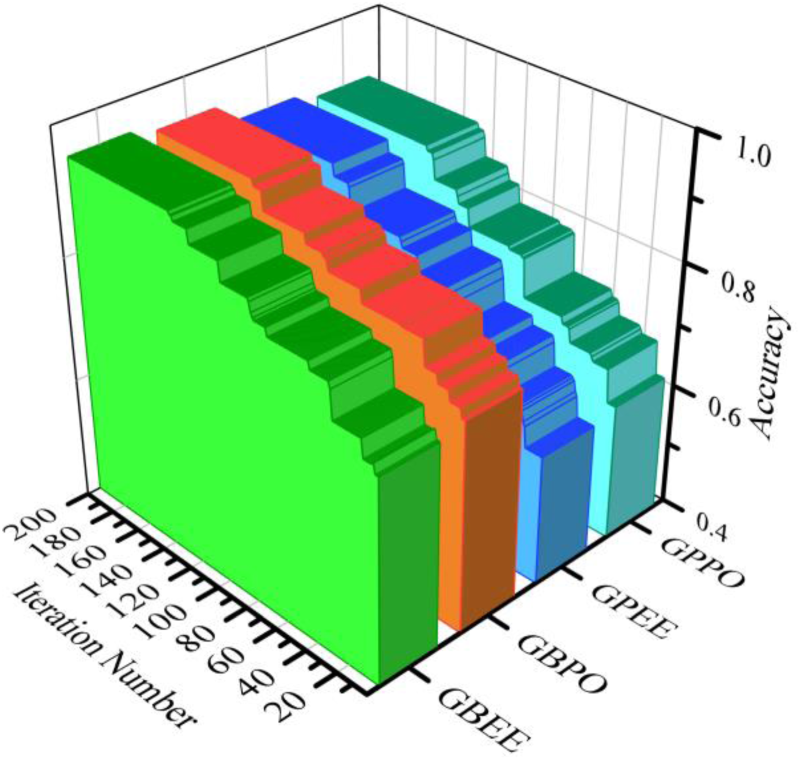
The convergence curve of the 3 presented hybrid models.
Party formation and constituency allocation. The entire population of 

Since every party member is a candidate for office, all of the people can be thought of as n constituencies, which can be represented by Eq. (10). It must be emphasized that although the logical division is different, the constituents are party members as well. Each constituency's membership is distributed as indicated by Eq. (11).


Moreover, as demonstrated by Eq. (12), the set of all party leaders is represented by 

Run for office: The location update of the search agent is handled by this stage, which is the central portion of the algorithm. Party members adjust their positions in the algorithm based on the winner 

Election. At this stage, the viability of each candidate solution is assessed, and Eqs. (17) and (18) are used to update the party leaders and constituency victors.


Affairs of Parliament. The goal of the party-switching phase is to shift the party's viewpoint, and the goal of the parliamentary affairs phase is to shift the viewpoint of the constituency. The constituency winners engage in mutual interactions to enhance their physical well-being. The following formula is used by each constituency winner to update its standing with any other randomly chosen constituency. Please take note that the movement will only be implemented if
The purpose of this section is to provide readers who might not be familiar with complex mathematical formalism with clear explanations and high-level summaries of the main techniques used in this investigation. This enhances the thorough mathematical explanations given in the sections that follow.
By creating smooth curves through the data, GPC can be viewed as a method of predicting the likelihood of a particular outcome. It operates under the supposition that each point in the input space corresponds to a random variable with a joint Gaussian distribution. GPC indicates the likelihood that a sample belongs to a particular class rather than providing explicit labels (such as “class A” or “class B”). The raw predictions are transformed into probabilities using a “squashing” function, such as the sigmoid or probit function. Because of this, it is particularly helpful when working with noisy or uncertain data.
GBC is an ensemble technique that combines numerous weak classifiers (usually decision trees) to create a strong one. Imagine it as a relay team in which each model attempts to correct the errors of the one before it. The algorithm incorporates a new model that concentrates on the residual errors at each stage. The combined output improves in accuracy over time. It accomplishes this by updating in the direction that minimizes this error the quickest (i.e., the gradient) and minimizing a loss function, which is essentially a gauge of how inaccurate the model's predictions are.
EEFO mimics how electric eels forage in water, drawing inspiration from their foraging habits. When resources are limited, they alternate between hunting prey, resting to reorient, interacting with their surroundings, and migrating. To steer a collection of solutions toward the best outcome, these behaviors are mathematically modeled. When it comes to avoiding local optima and preserving solution diversity, EEFO excels.
To direct optimization, the POA consults election tactics and political systems. Every “candidate solution” acts like a party member taking part in different political stages like parliamentary debate, party switching, and campaigning. The population of candidates eventually converges on the best political strategy, or the best answer, after a number of iterations. The algorithm is able to strike a unique, structured balance between exploration and exploitation thanks to this metaphor.
Performance evaluators
Predictive accuracy as a whole is measured by accuracy (Ac), which is calculated as the ratio of correctly anticipated events to total instances. Precision (Pr) measures how well positive projections match up with all positive occurrences. The percentage of true positive instances that were correctly identified is called recall (Re). When working with imbalanced datasets, the F1-score (F1) is particularly helpful as it provides a balanced assessment of a model's performance by combining accuracy and recall into a single statistic. Eqs. (19) to (22) show the formulation of these metrics:


The number of occurrences that fall into the positive class and are accurately predicted to do so by the model is denoted by
This section covers the presentation and analysis of the findings of the study.
The convergence curve basically shows the process of optimization that a model undergoes through successive iterations. It reflects how the performance metric evolves in a model as iterations increase, thereby specifying how close it has come to convergence toward an optimal solution. In Figure 2 below, there is a trend where better performance is depicted by models with added iterations. Specifically, the remarkable improvement is reflected by GBEE, increasing its Ac value from about 0.7 at 40 iterations to almost 0.9 at 200 iterations, reflecting its ability for self-improvement in time. This trend is also reflected by GBBO, with similar behavior in optimization. Particularly, GBBO and GBEE have highly similar convergence profiles. Moreover, GPPO and GPEE show parallel behaviors, which further drives home the point of consistency in optimization dynamics across these models. In summary, the convergence curves explain how iterative refinements contributed to an improvement in the performance of the models, bringing out the iteration nature of the underlying optimization processes in achieving optimal solutions.
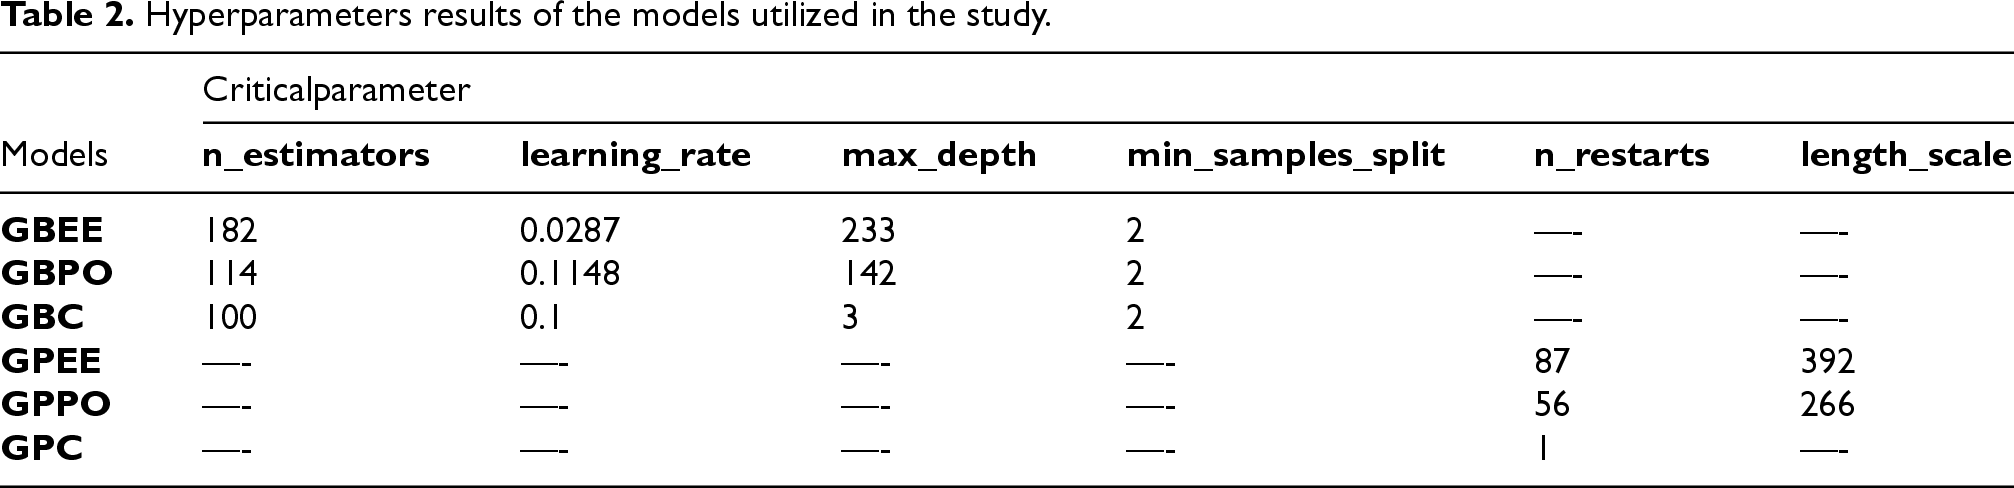
The training configurations and hyperparameters for the machine learning models used in this study are summarized in Table 2, where hyperparameters were optimized using the Electric Eel Foraging Optimization (EEFO) and Political Optimizer Algorithm (POA) to achieve high predictive performance while maintaining model generalization. In the table, “–” indicates that the parameter is not applicable for the respective model. GBEE refers to Gradient Boosting with EEFO optimization, GBPO refers to Gradient Boosting with POA optimization, GBC refers to standard Gradient Boosting Classification, and GPEE, GPPO, and GPC represent Gaussian Process Classification variants with EEFO or POA optimizations. For hyperparameter selection, EEFO and POA were applied to each model to efficiently explore the hyperparameter space, candidate hyperparameter sets were evaluated based on cross-validated accuracy and F1-score on the training set, and the configuration yielding the highest balance of accuracy and generalization was selected for the final model.
Hyperparameters results of the models utilized in the study.
Hyperparameters results of the models utilized in the study.
Table 3 presents the performance of models by training and testing using 4 metrics. Throughout the entire training process, GBEE offered the best performance, at the highest level of Ac of 0.965, while GPBO was at 0.952. GBC provided a mid-level performance with an Ac of 0.940, while GPEE and GPPO recorded 0.925 and 0.908, respectively. GPC was relatively lower at an Ac of 0.893. The rest were also outperformed by GBEE during the training phase. During testing, the same was leading with an Ac value of 0.903 against GPBO, which had stood at 0.894. On the GBC and GPC, GBC performed with an Ac value of 0.884, while the GPC trailed behind with an Ac value of 0.825. Meanwhile, similarly, GPEE outperformed GPPO with Ac values of 0.852 and 0.849, respectively. Again, GBEE topped in the test phase.
GBC and GPC base models achieved results through the performance evaluators.
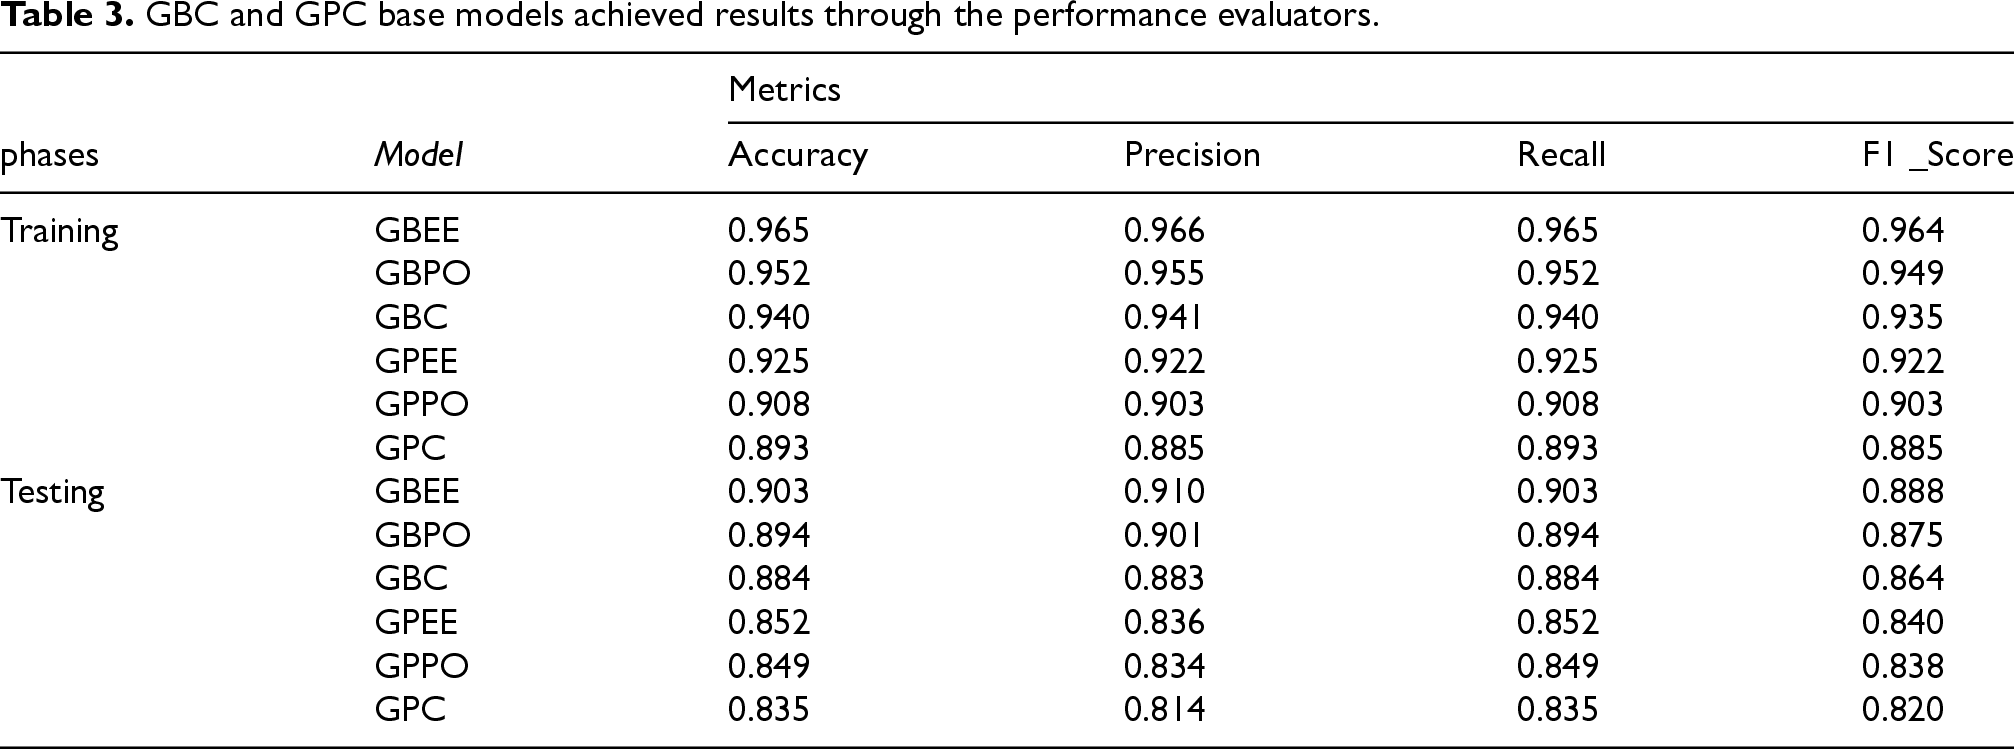
During the training phase, GBEE demonstrated superior performance compared to GBPO, with respective Pr, Re, and F1 values of 0.966, 0.965, and 0.964 for GBEE, and 0.955, 0.952, and 0.949 for GBPO. In the comparison between GBC and GPC, GBC exhibited better performance, boasting precision, recall, and F1 scores of 0.941, 0.940, and 0.935, respectively, while GPC yielded scores of 0.885, 0.893, and 0.885. Similarly, when contrasting GPEE and GPPO, GPEE outperformed GPPO with precision and recall values of 0.922 and 0.925, respectively, alongside F1 values of 0.922, while GPPO yielded scores of 0.903, 0.908, and 0.902 for precision, recall, and F1 values, respectively. In the overall assessment during the training phase, GBEE emerges as the top-performing model across all 4 metrics, while GPC consistently exhibits the lowest performance among the models evaluated.
Table 4 presents the performance of the models under 3 conditions: high probability, low probability, and mid probability. Under the high probability condition, GBEE achieved a Pr value of 0.941, while GBPO had a Pr value of 0.929. Between GBC and GPC, GBC had better performance with a Pr value of 0.920 compared to GPC's 0.899. Furthermore, GPEE surpassed GPPO, exhibiting precision values of 0.922 and 0.913, respectively. GBEE emerged as the top-performing model across all conditions. Under the low probability condition, GPEE achieved a precision value of 0.976, closely followed by GBC with a precision value of 0.971. Notably, GBPO, GPEE, GPC, and GPPO all attained perfect precision values of 1.000, signifying their exceptional performance under this condition. Transitioning to the mid-probability condition, GBEE continued to excel with a precision value of 0.992, while GBPO trailed closely behind at 0.987. Conversely, GPC demonstrated the weakest performance in this condition, registering a precision value of 0.693.
Models’ performance in the 4 different conditions.
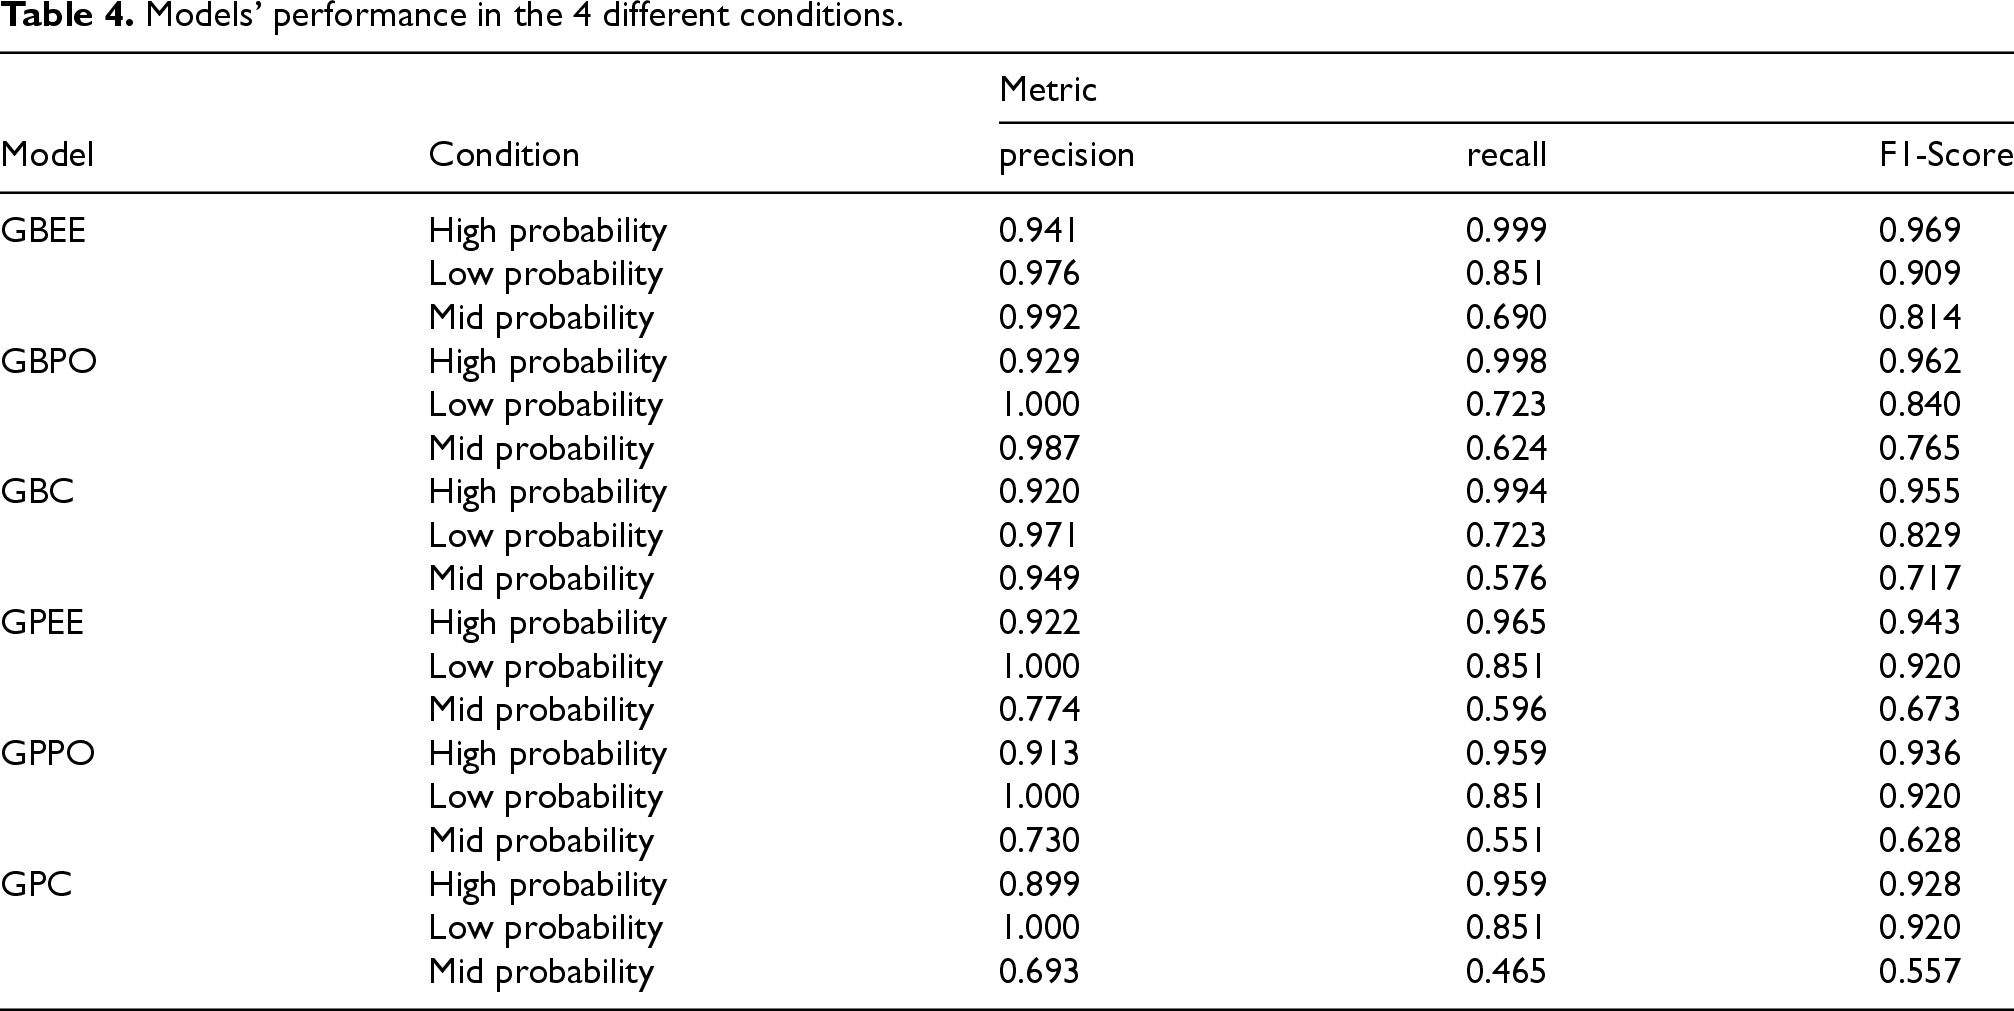
Under high probability conditions, GBEE exhibited superior performance with a Re value of 0.999, compared to GBBO's recall value of 0.998. When comparing GBC and GPC under the same conditions, GBC achieved a Re value of 0.994, while GPC had a Re value of 0.959. Between GPEE and GPPO, GPEE demonstrated better performance with a recall value of 0.965, compared to GPPO's 0.959. Overall, GBEE was the best-performing model under high-probability conditions. In the mid-probability condition, GBEE, GBPO, GBC, GPEE, GPPO, and GPC had recall values of 0.690, 0.624, 0.576, 0.596, 0.551, and 0.465, respectively. This indicates that GBEE was the best-performing model, while GPC had the weakest performance. Under low probability conditions, both GBPO and GBC achieved recall values of 0.723. Meanwhile, GBEE, GPEE, GPPO, and GPC all attained recall values of 0.851. Overall, GBEE is the best-performing model across all 3 conditions.
As depicted in Figure 3, under the high probability condition, GBEE correctly predicted 12501 out of 12517 measured participles. GBPO predicted 12496, and GBC correctly predicted 12438, indicating that GBEE has the best performance. Under the mid-probability condition, GBEE correctly predicted 1742 out of 2524 measured participles. GBPO predicted 1575, and GBC predicted 1453. Under the low probability condition, GBEE correctly predicted 40 out of 47 measured participles, while both GBPO and GBC each predicted 34 correctly. This demonstrates GBEE's superior performance across all 3 conditions. Regarding GPEE, under the high probability condition, it correctly predicted 12004 out of 12517 participles. GPPO also predicted 12004, and GPC predicted 11999. Under the mid-probability condition, GPEE correctly predicted 1503 out of 2524 participles, GPPO predicted 1390, and GPC predicted 1174. Overall, GBEE consistently emerges as the best-performing model across all conditions.
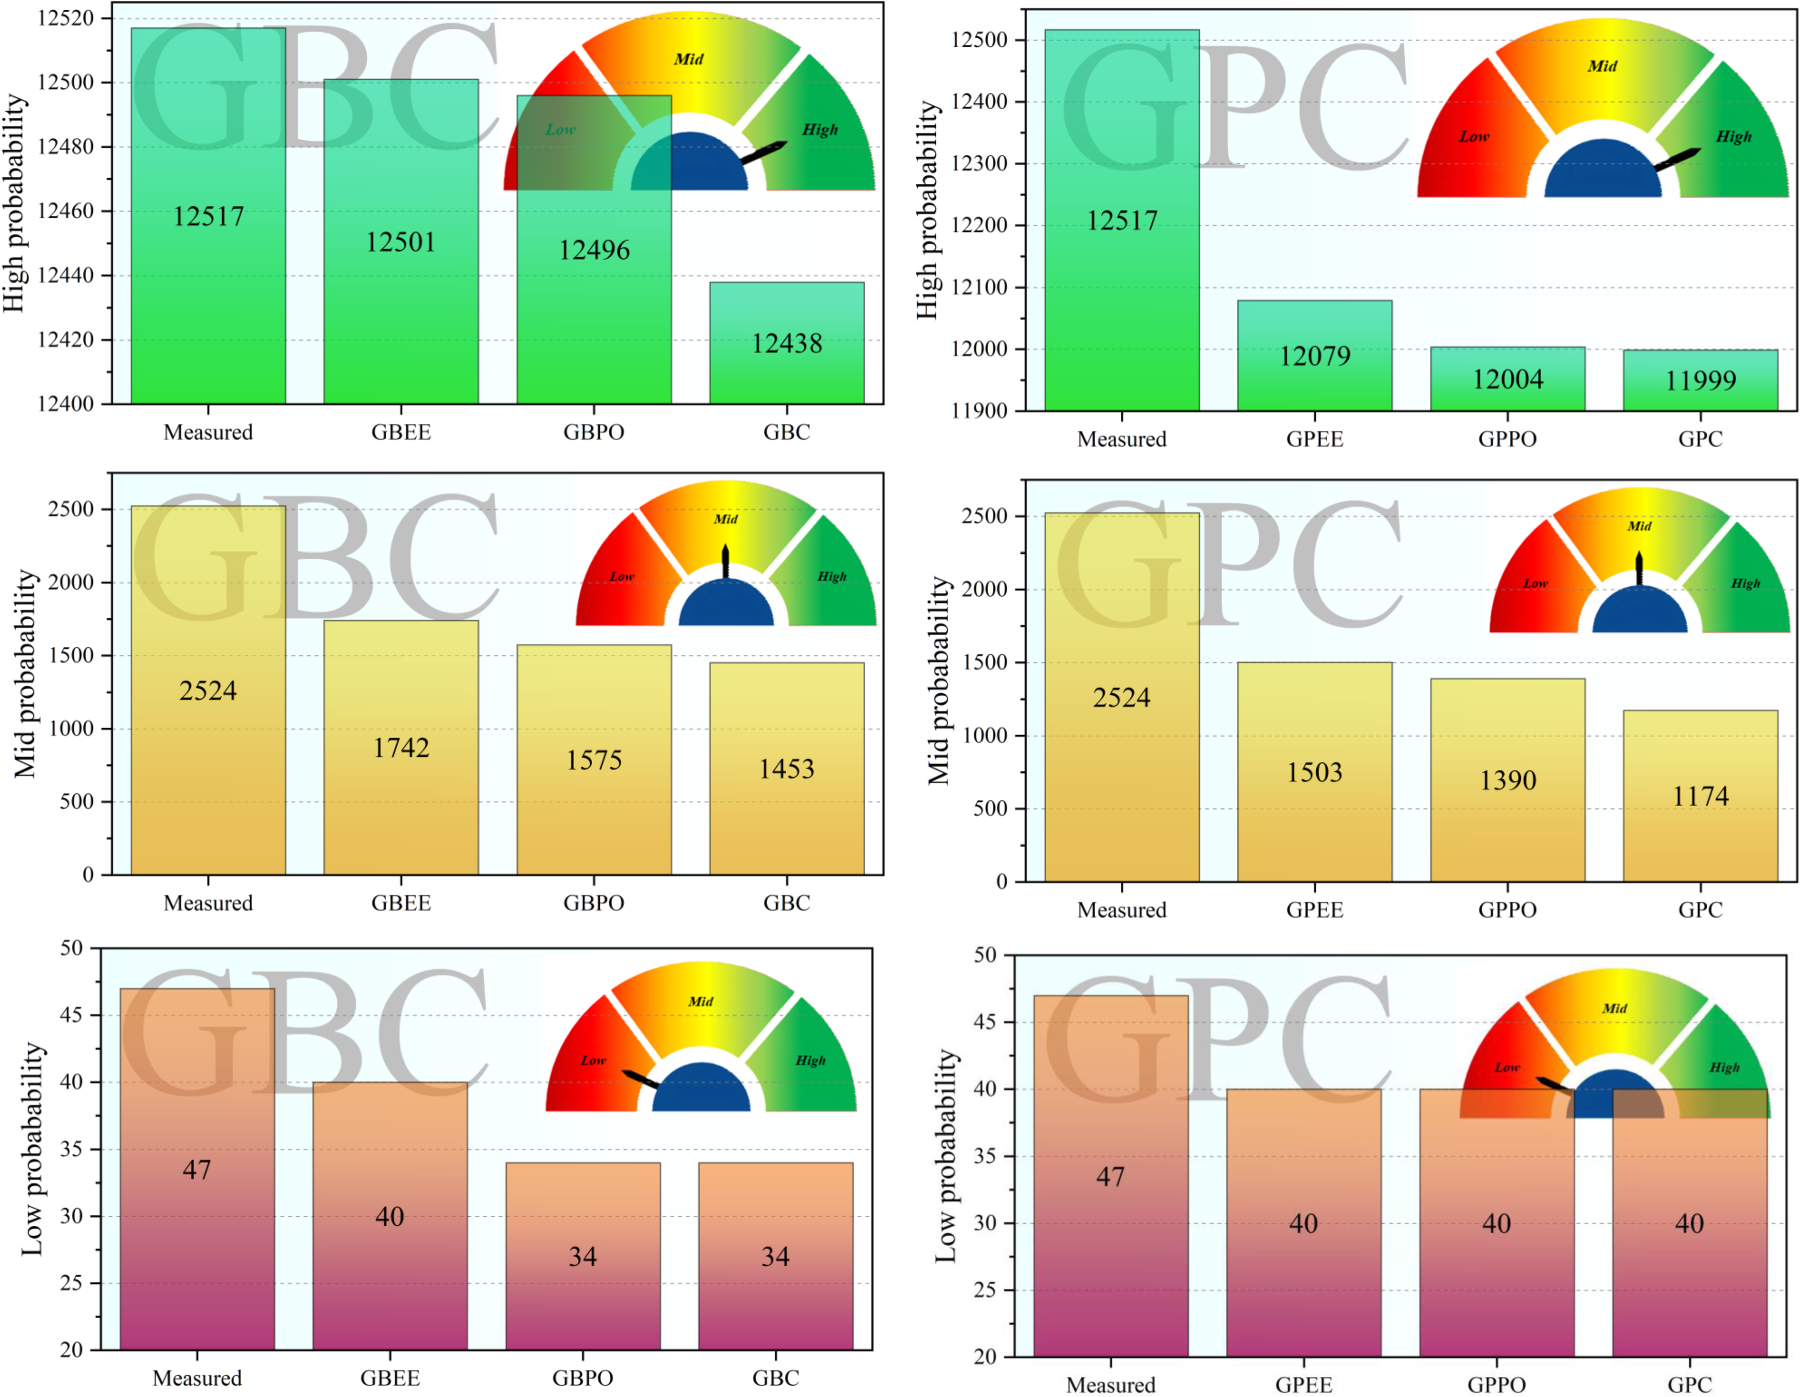
Column plot for the difference percentage of the models.
As shown in Figure 4, GBPO correctly predicted 12496 participles under the high probability condition while misclassifying 21 participles under the mid probability condition. In comparison, GBEE correctly predicted 12501 participles under the high probability condition, with only 1 misclassification under the low probability condition and 15 misclassifications under the mid probability condition. Furthermore, under the low probability condition, GBPO correctly predicted 34 participles but misclassified 13 under the high probability condition. Conversely, GBEE correctly predicted 40 participles under the low probability condition and misclassified 7 under the high probability condition. Between GPPO and GPEE, GPPO correctly predicted 12004 participles under the high probability condition, with 513 misclassifications under the mid probability condition. On the other hand, GPEE correctly predicted 12079 participles under the high probability condition, with 438 misclassifications under the mid probability condition. Overall, these results highlight the superior performance of GBEE, especially under high probability conditions, as it consistently demonstrates higher accuracy and fewer misclassifications compared to the other models.
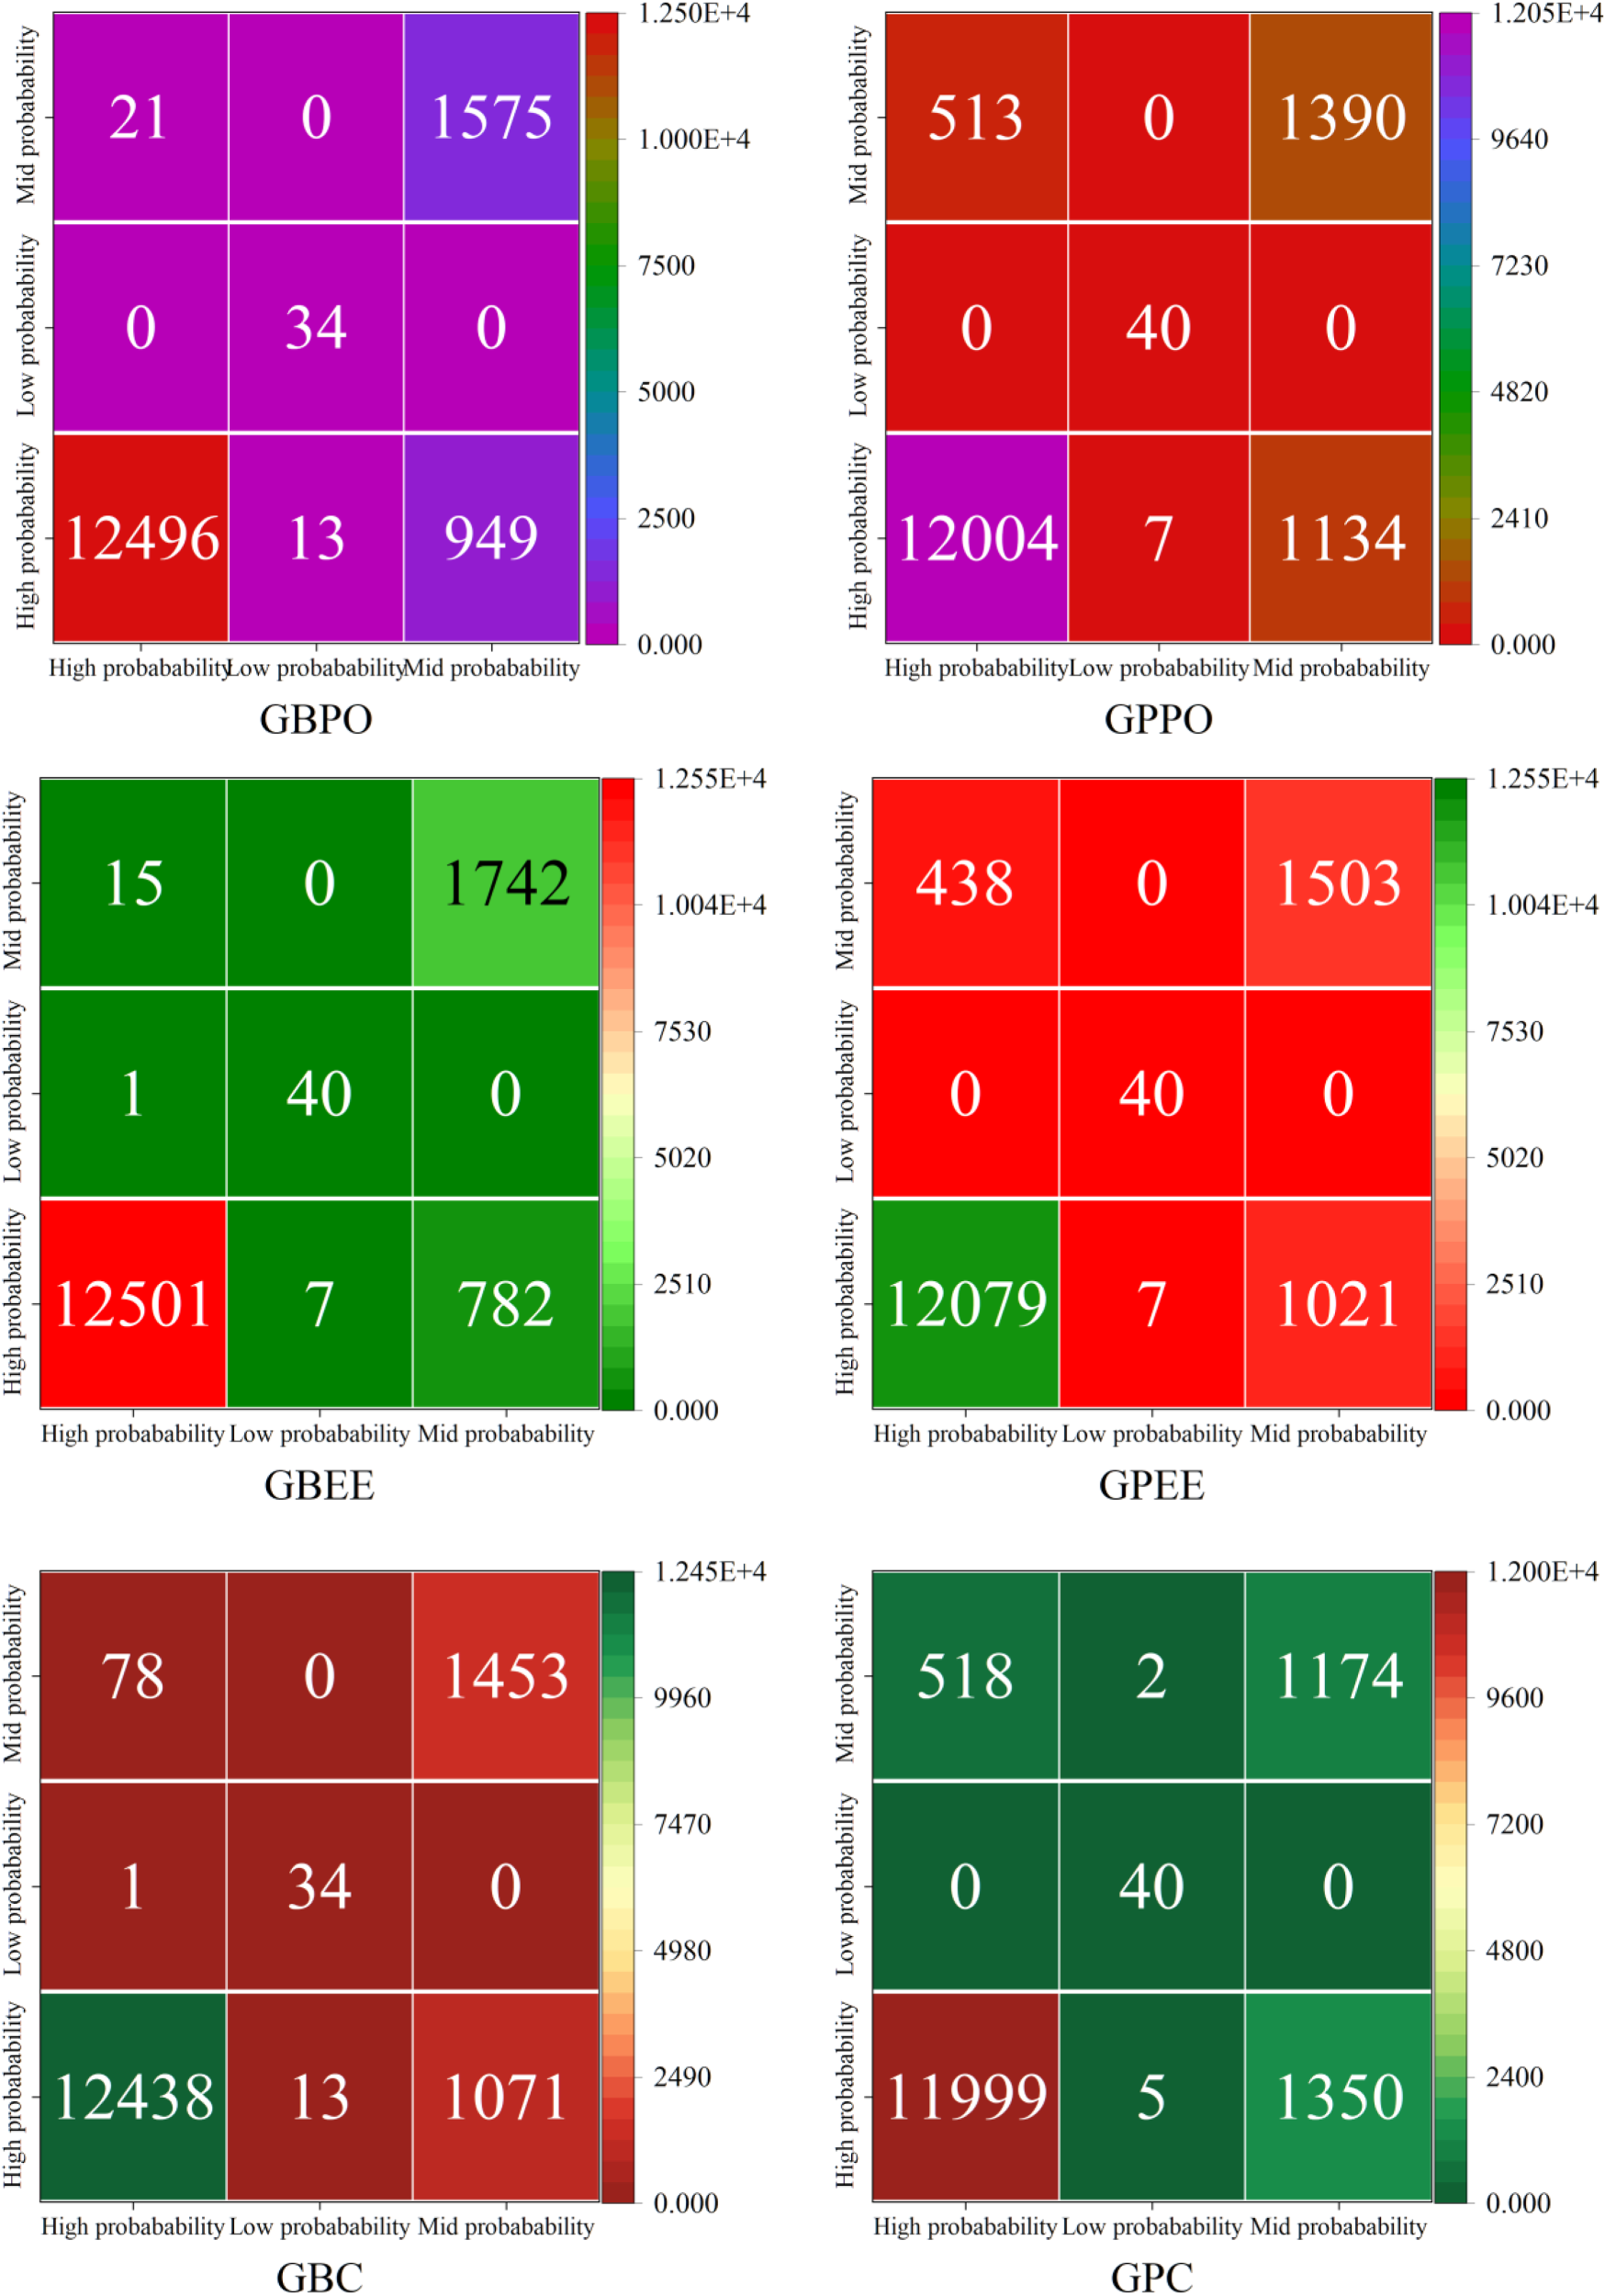
Confusion matrix for the accuracy of each model.
Plotting the true positive rate (TPR) against the false positive rate (FPR) at various thresholds, the ROC curves illustrate the effectiveness of the best hybrid models. A curve that approaches the top-left corner indicates superior model performance and accuracy, as it signifies a high TPR and a low FPR. Figure 5 shows that under high probability conditions, the ROC curve is closest to the top-left corner, indicating that the model reaches a TPR of 1 early, thus demonstrating the best performance. Models under the mid-probability condition demonstrate a promising start with an initial TPR of approximately 0.3 at an FPR of 0.0, outperforming other models at the early stage. However, at an FPR of 0.4, models under the high probability condition surpass others, reaching a TPR of 1.0 earlier, indicating superior performance. Subsequently, the mid-probability models also achieve a TPR of 1.0. In contrast, models under low probability conditions exhibit weaker performance, as they remain below the macro average line and reach a TPR of 1.0 at a later stage.
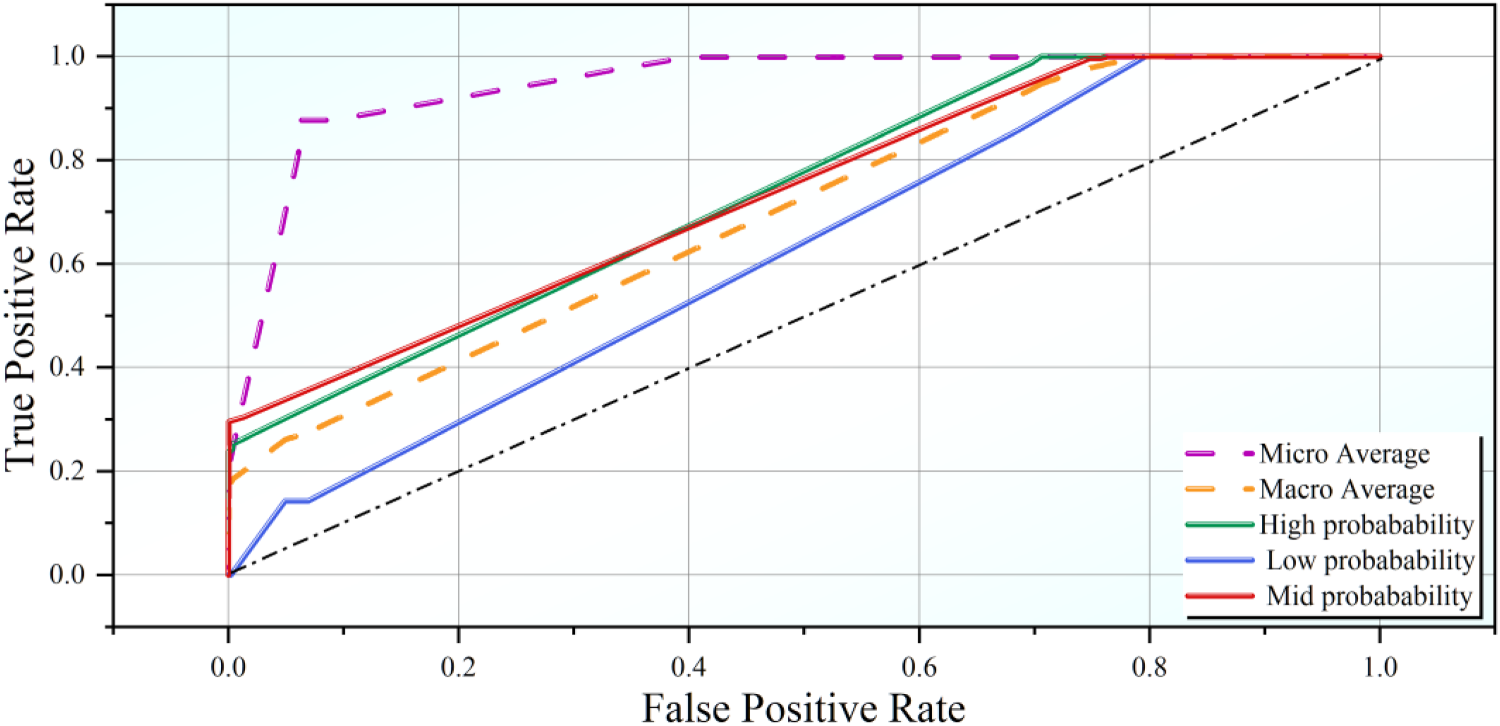
The ROC curves for the performance of the most efficient hybrid models.
The SHAP (Shapley Additive exPlanations) sensitivity in Figure 6 analysis offers a thorough explanation of how each feature affects the top-performing model's predictions. Based on the given SHAP analysis, the “cost of the vehicle”, “the borrower's age”, and the “ex-showroom price” have a significant impact on CIBIL scores and automobile loan assessments. Additionally, they have more effect on high and mid-probability conditions compared to low-probability conditions. Conversely, “marital status” and “current valuation” have less impact on CIBIL scores and automobile loan assessments. The “number of years in the city” and “the number of years at the current residence” have similar effects. The “Segment Desc” variable has a greater effect, especially under mid and high-probability conditions.
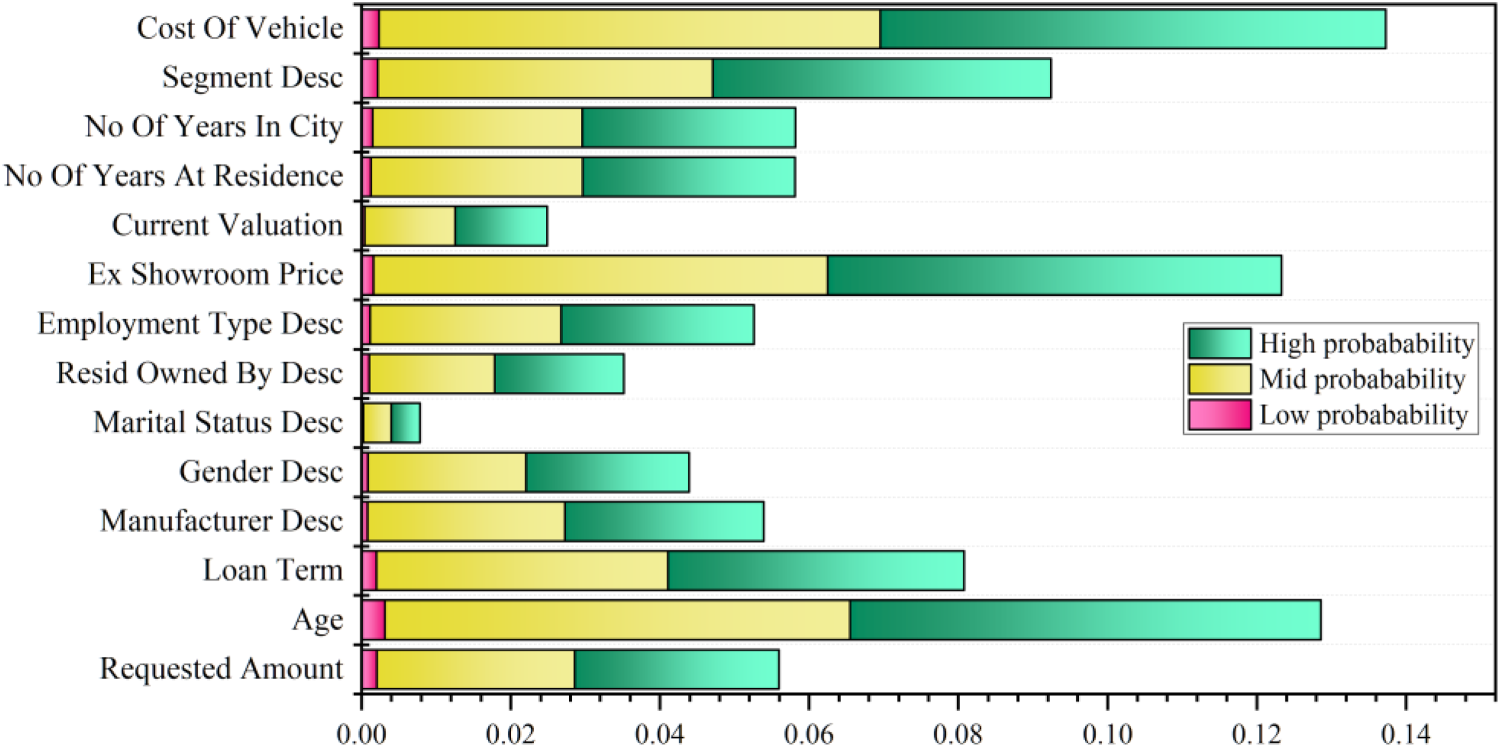
The SHAP sensitivity analysis of the best-performed model.
Beyond algorithmic performance, a number of other factors are necessary for the successful application of machine learning models in financial environments. Suggested models, which have been refined using sophisticated metaheuristics, show excellent predictive accuracy in determining the likelihood of financial distress and bankruptcy. However, putting these models into practice necessitates taking into account a number of important factors: Integration with Current Systems: When evaluating credit risk, financial institutions frequently turn to legacy systems. To improve existing workflows without completely redesigning infrastructure, our models can be incorporated into decision support systems as modules or through API-based architectures. Data Availability and Quality: Real-world application requires consistent access to high-quality, up-to-date financial data. Financial institutions must ensure robust data pipelines and implement preprocessing routines (e.g., handling missing values, standardizing formats) similar to those used in our study. Models Interpretability: The requirement for explainable models is emphasized by regulatory frameworks like Basel III and GDPR. Explainability tools like SHAP (SHapley Additive exPlanations) can help shed light on model predictions, despite the complexity of some of the suggested models (such as XGBoost and ensemble methods). Regulatory and Ethical Compliance: The deployment of the model must guarantee ethical data use and conform to financial regulations. Features used in predictions should not lead to discriminatory outcomes or privacy breaches. Scalability and Real-Time Prediction: This study's optimized models are computationally effective and scalable for real-time financial decision-making, such as dynamic credit scoring, automated loan approvals, and early warning systems for financial distress. Cost-Benefit Analysis: Prior to implementation, organizations can conduct a cost-benefit analysis that contrasts our suggested system with conventional models in terms of predictive accuracy, false positive/negative rates, and possible savings or losses in terms of money.
The hybridization of machine learning classifiers with nature-inspired optimizers in this study is grounded in complementary strengths of the methods. Gaussian Process Classification (GPC) inherently provides probabilistic predictions and models uncertainty in the input space. When combined with Electric Eel Foraging Optimization (EEFO) or the Political Optimizer Algorithm (POA), the optimizer efficiently tunes hyperparameters such as length scale and number of restarts, enhancing GPC's ability to generalize across unseen data. Gradient Boosting Classification (GBC), on the other hand, is a strong ensemble method that builds additive models in a forward stage-wise fashion. Its performance is sensitive to hyperparameters like the number of estimators, learning rate, and maximum tree depth. By integrating GBC with EEFO and POA, the search for optimal hyperparameters is guided to regions that maximize predictive accuracy while preventing overfitting, leading to the superior performance observed in GBEE and GBPO.
The observed differences in predictive performance between the hybrid models can thus be theoretically attributed to the interaction between the model's inherent capabilities and the optimizer's search strategy. For instance, GPC benefits more from precise tuning of length scale and restart parameters, which directly influence the model's probabilistic predictions, while GBC's improvements arise primarily from optimized ensemble parameters that control model complexity and learning rate. This rationale explains why GBEE achieved the highest training and testing accuracy, closely followed by GBPO, while standard GBC, although reliable, trailed slightly due to the absence of optimizer-guided hyperparameter refinement. By presenting this theoretical framework, the study highlights the practical and methodological reasoning behind the choice of each classifier-optimizer pair.
The primary objective of CIBIL in the auto loan process was to furnish lenders with crucial insights into borrowers’ creditworthiness. By assessing applicants’ credit histories and financial behaviors, lenders gauged the risk associated with lending to them. CIBIL significantly contributed to this assessment by providing credit reports and ratings. A high CIBIL score indicates good credit health and timely loan repayments. In this study, advanced machine learning techniques like GPC and GBC, enhanced with optimization algorithms such as EEFO and POA, were used to predict CIBIL scores. The integration of these optimization algorithms with machine learning techniques significantly improved prediction accuracy, simplifying and reinforcing the reliability of the auto loan approval process. Based on this analysis, the GBEE hybrid model performed the best, achieving strong performance metrics during both the training and testing phases. It had an Ac of 0.965 and Re of 0.966, while its Pr and F1 were 0.910 and 0.888 during training. In contrast, during the testing process, it had an Ac of 0.903 and Re of 0.910 with a Pr of 0.888 and F1 of 0.888. Under mid-probability conditions, GBEE correctly predicted 1742 participles out of 2,524, while in the low-probability condition, GBEE correctly predicted 40 of the 47 participles. In addition, under the high-probability scenario, the number of measured participles in which GBEE was able to make correct predictions was 12,501 out of 12,517 participles.
By contrast, the weakest model was GPC, as stated by the lower performance metrics. In the training of GPC, Ac was 0.893, and Re also equated to 0.893, Pr - 0.885, and F1 score - 0.885. For testing, Ac was equated to 0.835, and Re also equated to 0.835; Pr was 0.814, F1 - 0.820. Further, the predictive capability of GPC highlighted its performance under different probability conditions where its output has correctly predicted 40 out of 47 measured participles in low probability conditions, 1174 out of 2524 in mid-probability conditions, and 11,999 out of 12,517 measured participles in high probability conditions.
Equally important is to realize the limitations that exist with ML, as it has been a pretty helpful tool. In view of the complexity of human behavior and financial factors, limits need to be placed on the predictions of ML regarding CIBIL ratings and auto loans. Due to their heavy reliance on previous data, these models may also fail to capture the subtlety of a person's credibility and financial situation. Moreover, estimates of repayment capability forecasted by such models can always be subject to unlooked-for events or even to a change in the economy. Fairness in loan decisions and data privacy are 2 more ethical factors that are taken into account. Therefore, although ML provides insightful information, the intricacy of financial behavior and socioeconomic variables ultimately limits the prediction power of ML.
Footnotes
Funding
The authors received no financial support for the research, authorship, and/or publication of this article.
Declaration of conflicting interests
The authors declared no potential conflicts of interest with respect to the research, authorship, and/or publication of this article.