
Abstract
This paper explores the strategies employed to develop a system leveraging deep learning and natural language processing techniques for automating aspects of record coding in statistical data products. The work focuses on the Mexican Statistical Institute (INEGI), where the proposed AI model aims to reduce the volume of records requiring manual coding. The experiments conducted demonstrate the potential for these methodological innovations to partially replace traditional manual coding processes. Specifically, a novel phase has been introduced into INEGI’s data encoding workflows, utilizing an AI model to select a subset of records for which the model has a high degree of confidence in assigning the correct codes. This approach seeks to minimize the need for manual intervention. To evaluate the effectiveness of this proposal, a production line was implemented that mirrored the existing process but included the AI-based phase. The results show that the use of deep learning algorithms can achieve a significant 50% reduction in manual coding tasks without compromising the quality of the output.
Introduction
Statistical offices frequently produce products involving the coding of records, which entails assigning a numerical code (or category) from a predefined catalog to each record. This assignment is typically based on support fields, which may include textual, numerical, or other types of data.
Industry classification and standardization systems are crucial for quantitative research across various fields; similarly, characterizing the nature of work performed by individuals in their jobs is a central focus in survey-related research. Both types of information are essential for providing comprehensive and accessible materials for economic and industrial analyses, evaluations, and mappings.
Much of our understanding of economic dynamics stems from the development of aggregated industry information. 1
To enhance analysis and comparability, it is common to classify jobs into predefined categories. Traditionally, this task has been performed manually. However, due to the associated costs, many survey organizations have explored the potential of employing computational tools for the automatic classification of workers’ occupations. 2
One approach to partially automating this process involves implementing rule schemes that generate codes. Specifically, if a text contains terms or phrases associated with an occupation according to a predefined catalog, the corresponding code is assigned to the text. While automatic methods can reduce costs, full automation has yet to be achieved. In partial coding, simple responses are automatically assigned codes, whereas more complex or ambiguous responses are manually coded.
A confidence metric provided by the automatic system can help differentiate between automatically and manually coded responses.3,4
Given the high frequency, volume, and resource requirements associated with these tasks, statistical offices, including the Mexican Institute of Statistics (INEGI), continually develop and refine both automated and manual coding processes. The primary goal of the work presented in this paper is to address the costs associated with the coding process.
Recently, driven by technological and methodological advancements, such as Artificial Intelligence (AI) algorithms, statistical offices have introduced processes that incorporate these innovations, thereby enhancing automation. The significance of these advancements extends beyond mere cost savings; they also ensure the maintenance of coding quality. Consequently, INEGI continues its research efforts and develops comprehensive operational proposals adaptable to current production needs.
Deep Learning (DL) techniques provide a viable solution for tackling natural language tasks where traditional rule-based approaches often falter. In this paper, we aim to apply DL technologies at both the word and sentence levels to improve automated coding processes. Our contributions include:
The design and deployment of advanced Natural Language Processing (NLP) algorithms Enhanced utilization of the certainty metric Expert evaluation
Through these advancements, we aim to achieve superior coding quality compared to previous methods.
The paper is divided into eight sections:
In Section 2, we outline the coding catalogs utilized for the classification of industries and occupations.
Section 3 is intended for related work, showcasing the strategies employed by other projects and statistical offices.
In Section 4, we explain the current coding process at the Mexican Statistical Institute, which we aim to improve through the proposals discussed in this article.
In Section 5, we introduce the new coding framework, which incorporates the additional stage involving the DL algorithm and presents its comprehensive outcomes.
In Section 6, we present two strategies concerning the application of the certainty metric as a mechanism to filter and select records for coding by the DL algorithm.
In Section 7, we conduct evaluations both for the new codification process utilizing DL models, as well as for the threshold methodologies.
Lastly, in Section 8 we endeavor to estimate the savings implications that these new methodologies will have for the institute.
Codification frameworks
The production of goods involves several steps, including identification, description, and certification. These steps are typically standardized through catalogues such as the North American Industry Classification System (NAICS) and programs like the International Organization for Standardization (ISO).
NAICS is a North American industrial classification system introduced in 1997. It is based on industry production processes.1,5 In Mexico, SINCO is a National Occupational Classification System developed and maintained jointly by INEGI, the Ministry of Labor and Social Security (STPS), the Ministry of Public Education (SEP), the National Council for Standardization and Certification of Labor Competencies (CONOCER), the Mexican Social Security Institute (IMSS), and the Ministry of Economy (SE). This initiative aims to standardize occupations. 6
The development of such catalogues facilitates providing a concise and timely overview of the connections between industrial activities and the requisite skills needed by the economy. This information is valuable for informing businesses, government agencies, educational institutions, and students about the levels, trends, and shifts in human resource demands.
In the United States, NAICS codes serve as a public policy and fiscal tool, exemplified by provisions under the CARES Act that supported healthcare professionals. 5 Classifying companies according to official codes has significant applications, including aiding sales and marketing efforts in identifying potential markets; assisting insurance companies in targeting new customers; enabling corporations to distinguish between companies within their targeted industries; and benefiting investors by understanding company distributions across various sectors. 7 Occupation coding also plays crucial roles in labor statistics, allowing individuals to compare their earnings with those of similarly positioned workers and facilitating job searches by matching job codes.8,9
Moreover, occupational classification is integral to sociological research, particularly in measuring inequality, stratification, and social mobility. Given that occupation is a significant risk factor for numerous diseases, occupational classification is vital for epidemiological analyses and studies in industrial hygiene and biomedical sciences. 3 Additionally, industrial classification is indispensable in economic analysis, helping to describe structural changes brought about by technological advancements, automation, globalization, and modifications in migration policies. 2
Industrial classification is often conducted hierarchically, layer by layer, until all codes are complete. This process is executed by trained personnel, which presents several drawbacks, notably inconsistencies due to varying levels of expertise among annotators and the time required to produce reports, even with detailed data like census survey responses. 10
Occupation coding remains one of the most challenging tasks in survey process production. Historically, this task was performed in specialized areas following interviews. Since 1972, algorithms for automated coding have been proposed and refined. However, despite these advancements, machines have not yet replaced human coding entirely; instead, they serve as auxiliary tools.8,11 The task can be framed as a text classification problem, albeit with unique challenges, such as the brevity and potential misspellings in occupational responses. 8
Related work
The collection of occupational information from the population is a widespread practice globally. Responses, typically collected as free text, are usually manually coded into categories according to official classifications. Automating this step could significantly reduce costs and expedite the collection and publication of statistical data. 8
Automatic codification
Replacing manual text-to-category conversion with an automated mechanism involves a time-consuming and resource-intensive process. Many statistical offices are thus exploring more efficient methods for automatic assignment of codes. For instance, in the United States, companies can self-report their industry codes, but these reports often do not align with their actual tasks. Papers such as Oehlert et al. 5 aim to identify and correct misassigned codes, while also assigning codes to entities that have not reported any information. Studies like Chaisricharoen et al. 1 propose ontology-based systems for detecting and reducing redundancies across various industrial standardization systems.
The ACTR system, developed by Istat in Canada in the 1990s, employs Automated Text Extraction Codes (ATECO) for classification purposes. The process begins with standardization steps known as “parsing,” which involve removing trivial words, grouping synonyms, and eliminating suffixes. Following standardization, a comparison is made against reference dictionaries to assign codes. If a perfect match is found, the process is complete; otherwise, an algorithm searches for partial matches. 12
In 2012, Thompson et al. 13 introduced a classification system for NAICS codes. Their process starts with generating dictionaries associated with each code, which are created using the most relevant words and n-grams for each industrial activity and occupation. These dictionaries can point to multiple codes, leading to the use of a logistic regression model to determine the most probable correct code. The sum of the code percentages associated with each feature in the search dictionary serves as a baseline, with the code achieving the highest sum being assigned as the correct one. The ACS requires an error rate of no more than 5% to meet its quality standards, and the baseline system achieves 55% labeling accuracy for industry and 30% for occupation.
This classification system shares similarities with the current INEGI classification system, both utilizing dictionary-like data structures associated with each code using relevant vocabulary. However, INEGI employs more rigorous and detailed rules to effectively associate dictionaries with unique labels. Our institute is exploring the inclusion of additional machine learning tools as a next step, as evidenced in Section 5.
Machine learning codification
Rules-based systems and vocabulary-related features are the most common principles and baselines for activity and occupation codification; however, there is a trend towards adapting and exploiting available technologies to enhance efficiency and reduce the human labor involved in the task.
Takahashi et al. 14 explored automatic coding of industry and occupation in Japan using a Support Vector Machine (SVM) system. This system assigns records to three codes based on the highest confidence levels, facilitating a subsequent manual verification. Based on the confidence scores of the two most probable codes, the system assigns one of three confidence levels (high, medium, low) to the most probable record. The features used include “words,” defined as parts of speech that can be analyzed morphologically, and rule-based classifications are incorporated when available. Their findings indicate that achieving an accuracy of 85% results in a coverage of 67%, whereas an accuracy of 91% leads to a coverage of 50%.
In contrast, Gweon et al. 3 investigated automatic coding improvements through the biannual ALLBUS survey in Germany. They employed three distinct techniques: combining two statistical models based on aggregation levels, integrating a duplicate-based model with a statistical model, and utilizing a model based on nearest neighbors. The aggregation level combination involves training separate classifiers for 3-digit and 4-digit codes. The duplicates method entails searching for exact matches between texts after preprocessing steps such as converting text to lowercase and removing functional words. The modified nearest neighbors modify the nearest neighbor approach by assigning weights to multiple nearest neighbors rather than relying solely on the nearest neighbor.
Using the duplicates method, approximately 50% of responses were achieved. This figure rose to 60% with pre-processing, maintaining confidence and quality. When employing an SVM model, the accuracy was 59%, the duplicates method yielded 53%, and both the hybrid and modified nearest neighbor methods produced 65%. Notably, the modified nearest neighbor method demonstrated superior production rates. For an accuracy of 80%, the modified nearest neighbor method achieved a production rate of 81%, compared to 76% for the hybrid method. At 90% accuracy, both methods reported a production rate close to 65%.
Ikudo et al. 2 focused on the occupational classification of research outputs, utilizing university databases to develop a two-level hierarchical classification system. This system categorizes individuals into five classes based on their relationship with the university, each class further subdivided into subclasses. The classification process begins with data standardization and vector conversion, employing word normalization, deabbreviation (e.g., “asstnt” = “assistant”), and one-hot vectorization. Various classification algorithms, including Multinomial Naive Bayes, Bernoulli Naive Bayes, Random Forests, and Extra Trees, are utilized for comparison. Among these, Random Forests emerged as the optimal algorithm for the application.
Oehlert et al. 5 utilized Random Forest models due to the sparsity and extreme values in the classification data and features. For evaluation, they applied a naive baseline assumption that all reported codes are correct and substituted the most common valid code in sectors without information. The Random Forest model in the non-informative set achieved an accuracy of 65.7%, surpassing the baseline accuracy of 16.8%.
In summary, advancements in machine learning have significantly impacted the field of activity and occupation codification, offering more efficient and accurate methods compared to traditional rules-based approaches.
Deep learning codification
Although deep learning constitutes a subset of machine learning, it offers several advantageous features that enhance overall performance. One notable feature is the ability to represent text densely within a vector space. In the preceding section, systems utilized vocabulary-based features; however, this section will now examine systems employing more contemporary approaches.
One of the early applications of deep learning for NAICS classification was reported by Wood et al., 7 who analyzed data sourced from the EverString database, comprising 18 million companies. Among the prominent features in the dataset, descriptions emerged as particularly significant for ranking purposes. Additionally, company websites provided supplementary information, including descriptive paragraphs and links to third-party descriptions and Wikipedia articles. These texts underwent a representation phase through a weighted combination of term frequency-inverse document frequency (tf-idf) on key terms and n-gram sequences ranging from 1 to 4. The classification model employed a deep learning architecture consisting of a fully connected four-layer perceptron with a hyperbolic tangent (tanh) activation function and a final layer with a softmax activation for classification. This system achieved an overall accuracy of 47.9%.
Turrell et al. 9 focused on constructing statistical measures for labor market demand, leveraging data from job advertisements posted online by firms and recruitment agencies on the Reed.co.uk platform. The dataset comprised millions of job postings. Since the data lacked official classifications, the authors developed an algorithm to categorize these descriptions into standardized occupational codes. Their approach involved several steps: cleaning and normalizing titles and descriptions (converting to singular forms, removing digits, punctuation, and function words, and expanding acronyms); verifying exact matches with code descriptions; vectorizing using tf-idf; and identifying the closest matching code based on cosine similarity.
Dwicahyo and Yuniarto 10 developed a classification system for the KBLI coding system, utilized in Indonesia. The system for industrial activity classification relies on a GRU(Gated Recurrent Units are deep learning architectures that attempt to build automatic gates that let through relevant information selectively for a step in a data sequence) architecture and FastText word embeddings. The authors constructed their models using three data sources: Indonesian Wikipedia, KBLI guidelines, and census responses from 2016 related to KBLI. The results indicate that the classification system achieves up to 4 out of 5 hierarchical levels. Rather than providing the complete code, the system presents annotators with the classification options considered by the system along with descriptions of these categories.
Contrasting with machine learning technology, deep learning strategies have not yet become as prevalent in activity and occupation codification applications. However, deep learning has demonstrated remarkable effectiveness in natural language processing tasks and aligns with the current trend for such problems. Consequently, INEGI is currently developing a deep learning system. Fortunately, this development coincided with the ongoing work on a machine learning system, allowing for the use of the latter as a benchmark for comparison and evaluation.
Mexican occupation and industry codification
Algorithms that utilize catalogues, dictionary-like descriptions, or rules can benefit from incorporating statistical learning algorithms that leverage data from previous surveys. Mexico is no exception.
The current coding process employed by INEGI to label household survey records involves several phases that can be categorized into two stages:
Deterministic rules (e.g., “if The remaining records are manually coded by personnel who have been trained for this purpose.
In 2020, 79.9% of records for the Occupation variable were coded deterministically, while 83.7% of records for the Economic Activity variable were coded in the same way.
These proportions help maintain the quality standards set by the institution, which aim for a consistency rate above 90% based on random reviews conducted by experts.
Throughout each stage, a quality verification process is implemented, involving an expert validation of a random and proportional sample of records.
When a batch of records to be encoded arrives, the deterministic rules are applied first. The remaining records in that batch are then sent for manual coding.
Subsequently, a subset of records from that batch is randomly and proportionally selected for inspection by an expert to assess the quality of each coding strategy and provide a general estimate. For the manual strategy, if the percentage of agreement between codes assigned by the hired encoder and those assigned by the expert exceeds a certain threshold (currently 90% for Occupation and Economic Activity variables), the batch is released. Otherwise, the entire batch is re-coded manually, often by the same individual.
This process aims to measure and ensure the quality of the coding processes. Figure 1 illustrates the described workflow.
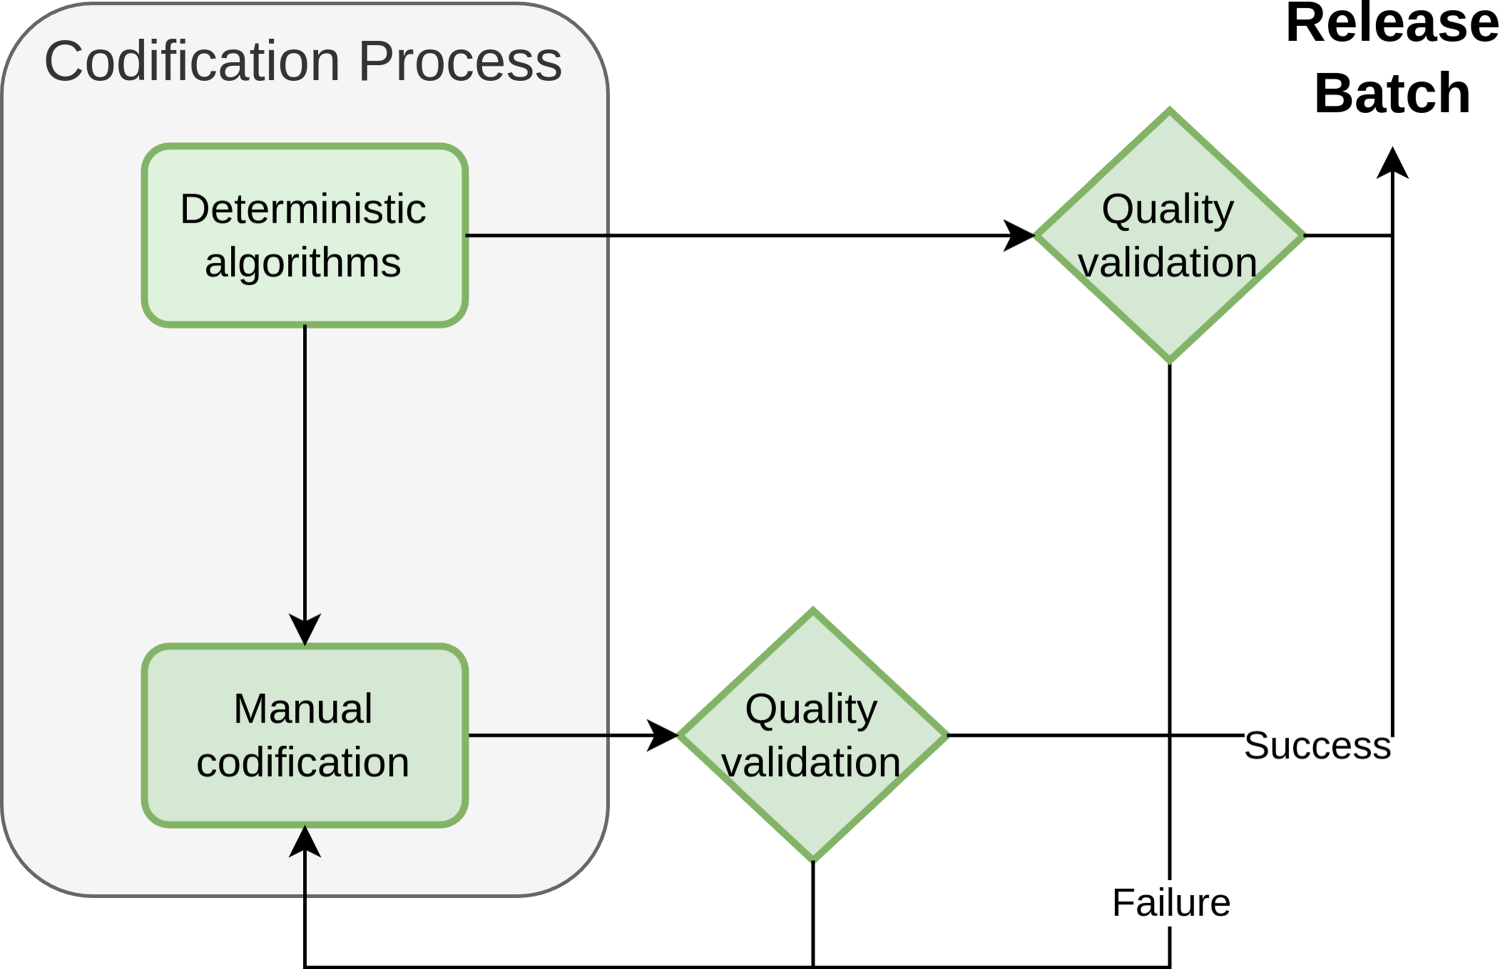
The current industry and occupation codification process in Mexico involves two primary stages: Deterministic and Manual. Each stage is subjected to quality verification prior to its release.
In this section, we present the incorporation of a new intermediate stage based on the automated assignment of categories through a deep learning algorithm that reduces the number of records requiring manual coding. The objective is not to replace existing deterministic algorithms but to address those records that decision rules fail to categorize accurately. Thus, we transition from the process depicted in Figure 1 to the one illustrated in Figure 2.

Updated industry and occupation process in Mexico. An intermediate step is added to the system to enhance the quantity of elements automatically coded, with a confidence threshold required to ensure quality. Records below this threshold proceed to the original workflow.
Traditionally, constructing a statistical model involves first converting textual data into a numerical format, a basic approach being the Bag of Words (BOW) method, where the frequency or absence of words is used. For classification purposes, methods such as Support Vector Machines (SVM) are employed. 3 While more data improves performance, gains are modest. Agreement typically reaches around 80%, which might not suffice for high-quality coding. 8
It is crucial to consider the presence of numerous misspelled words during feature extraction, which introduce noise into the entire process. Research by Thompson et al. 13 identified this as an area of opportunity. Additionally, Ikudo et al. 2 found a significant limitation in their study, stemming from the vocabulary or nomenclature used to describe certain positions or tasks. Depending on the sector or organization, the same terminology can refer to different concepts or vice versa.
Deep learning techniques offer a viable solution to these challenges. In this paper, we aim to apply these technologies at both the word and sentence levels in analyzing text entries. As shown in Figure 3, the general process involves generating dense representations (indicated as the hidden layer) and a final classification.

General diagram of the Deep Learning model. A specialized FastText model is trained using all Institute’s data, as well as Spanish Wikipedia. This model generates a vector representation for each term, which is subsequently fed into a Bidirectional GRU to produce a vector representation of the full description. Finally, a softmax classifier is employed to determine both the class and the confidence scores. (Base graphics from https://www.asimovinstitute.org/neural-network-zoo/)
At the word level, we propose the use of word embeddings via the FastText technique to create dense vector representations. This step significantly reduces the vocabulary from a one-hot encoding (where each term corresponds to a unique feature) to dense 300-dimensional vectors, capturing co-occurrence relationships within these dimensions. FastText’s desirable feature is its ability to incorporate subword information, allowing it to handle misspellings or variations in the data.
Each sentence in the database undergoes a similar encoding process, the training set comprises approximately 5,000,000 sentences; all of them are transformed into a fixed-length vector sequence, irrespective of its length or word count. This sequence is fed into a Bidirectional Gated Recurrent Unit (Bi-GRU) module, which processes the sequence in both forward and backward directions to generate a more robust representation. The Bi-GRU outputs are then combined with categorical auxiliary variables derived from the metadata of the records. These elements are subsequently recombined in a fully connected neural network to produce the final representation of the text entry, denoted as the hidden layer in the overall diagram.
The final classification step combines the GRU, recombination, and classifier modules, training them simultaneously. Unlike word-level similarity, sentence-level representation aims to distinguish between distinct categories within the classification scheme. Therefore, the recombination layer connects directly to a Softmax classifier, ensuring that the final output accurately reflects the category assignments.
The complete model commences with a FastText Embedding architectur featuring 300-dimensional vector spaces. Subsequently, a bidirectional GRU layer with hidden dimensions of 512 is employed. The final training layer comprises a linear layer. For occupancy classification, this layer outputs 468 classes, whereas for activity classification, 173 classes suffice. The softmax activation function is utilized within this layer, which is optimized for cross-entropy loss during training. A learning rate of 0.01 was adopted, along with a batch size of 32 and a dropout rate of 50%, all aimed at mitigating overfitting. Training proceeded over 80 epochs.
In Section 7.1, we present a detailed evaluation of the model discussed in the preceding section. Based on these results, we propose replacing the manual coding process with the DL algorithm, yet the percentage of agreement between the two remains high but insufficient for INEGI’s current quality standards. One interpretation of the findings in Section 7.1 suggests that, for the Economic Activity variable (SCIAN catalog), the algorithm would have matched approximately 69% of the manually labeled records. In other words, a complete switch to the DL algorithm would result in about 30% discrepancies compared to the work performed by INEGI personnel.
Our proposal is not to implement a full replacement but rather a partial one, where a subset of records can be selected for which the DL algorithm is most confident in the category it assigns. This confidence can be gauged by the value obtained from the maximum of the SoftMax normalization in the final layer of the model for each record.
When partial coding is employed, a probability value is required to differentiate between easy and difficult classifications. All records with a value above a specified threshold are coded automatically, while the rest are coded manually. This threshold is determined based on the desired balance between production rate and accuracy. These two factors are complementary opposites; increasing expectations for one typically comes at the expense of the other.3,4
The methodological proposals outlined below vary in their approach to leveraging the outputs of the DL algorithm for each record: the assigned category and its corresponding certainty metric. The latter represents the algorithm’s confidence level for each category it assigns based on the input data; while imperfect, this metric exhibits a high correlation with the probability of manual and algorithmic categorizations matching. Consequently, we anticipate a higher likelihood of accurate matches for records with high certainty values.
We propose two methodologies:
Select records where the certainty metric is equal to or greater than a predefined threshold, irrespective of the category assigned by the algorithm. Tailor the selection criteria based on the category (code) assigned by the algorithm. This approach leverages the intuition that certain categories may be easier for the algorithm to classify due to their prevalence in the dataset, thus facilitating more accurate matches.
For each category, an individual threshold is established. When the DL model assigns a category, it evaluates whether the certainty metric exceeds the category-specific threshold. If so, the record is coded; otherwise, it remains uncoded.
These methodologies aim to enhance the accuracy of automated coding while maintaining a reasonable production rate.
This design considers the identification of a threshold for each possible category within the SCIAN or SINCO catalogue.
Let
The percentage of the events that align with the human tagging can be expressed as
We propose identifying the threshold
To determine
We utilize a validation split of the training data to compute these thresholds. Initially, the DL model is employed to generate both the certainty scores and the corresponding category
General threshold
This design involves selecting a single value within the range of values generated by the DL algorithm as a measure of certainty, such that only records with a certainty greater than or equal to this value are encoded using the algorithm, irrespective of their assigned label.
We select an a-priori value
As a result, there will be a coincidence percentage
Results
Model results
Creating training datasets often involves costly manual coding, a task typically avoided. Therefore, coded data from previous studies is utilized instead. This approach assumes that the training data and future predictions follow the same distribution, an assumption that cannot be perfectly maintained when using previous studies for training 8 ; however, the associated savings make it the preferred method. To ensure as realistic preliminary evaluations as possible, these are conducted on different temporal releases than the training data. However, an important consideration when employing such evaluation datasets is their inherent noise, complicating the identification of a ground truth.
In this section, we present the evaluation of the model, using the agreement rate as the system’s accuracy metric. Here, we treat the manual labels as the correct categories for the records.
In Section 3, we discussed various existing state-of-the-art solutions and their application of NLP strategies within the context of national statistics codification. Additionally, we provided the reported results to offer a comprehensive overview of the task. However, the nature of the task precludes the use of these datasets as a benchmark for a significant comparison. The systems employed by other statistical offices differ significantly in terms of language, data collection methods, coding strategies, domains, and task distributions, among other factors, making direct comparisons challenging.
To address this, we evaluated both the DL model and compared its performance to a baseline model using TF-IDF for vectorization and SVM for classification. The evaluation was conducted on a subset of records that were initially manually labeled (as depicted in Figure 1), specifically those that could not be processed by the deterministic module. The results are presented in Tables 1 and 2.
Comparison for the occupation (SINCO) classification results. We present accuracy, precision, recall, and F1-score to compare the deep learning alternative to more classical NLP strategies like TF-IDF with SVM model. Alongside, we compare the results of systems using metadata versus those using only text.
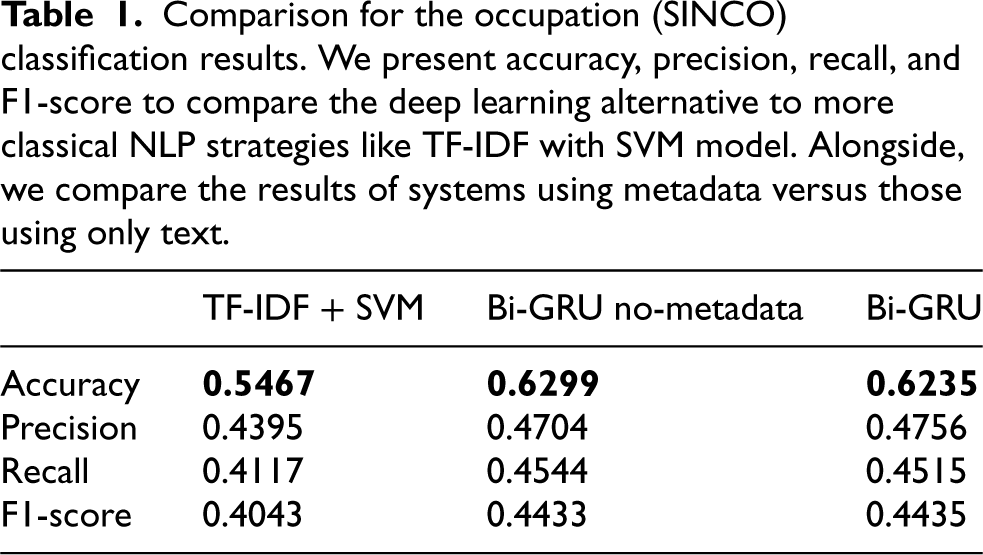
Comparison for the occupation (SINCO) classification results. We present accuracy, precision, recall, and F1-score to compare the deep learning alternative to more classical NLP strategies like TF-IDF with SVM model. Alongside, we compare the results of systems using metadata versus those using only text.
Comparison for the economic activity (SCIAN) classification results. We present accuracy, precision, recall, and F1-score to compare the deep learning alternative to more classical NLP strategies like TF-IDF with SVM model. Additionally, we compare the results systems using metadata versus those using only text.

These evaluations demonstrate that the deep learning system exhibits superior generalization capabilities in scenarios where deterministic rules fail to cover all cases. Specifically, it leverages the contextual and embedding relationships of words to expand its coverage beyond what deterministic rules can achieve. The improvements achieved through the deep learning approach range from 3 to 8 percentage points in accuracy.
At first glance, this claim might be challenged by the comparisons of the F-scores. However, in this context, accuracy is the most important metric, as the objective is not to classify all records, but only those where the model has the highest confidence. As mentioned in Section 6, we propose a filtering method based on the certainty score, which offers an interesting advantage as it reduces the impact of imbalanced data. Our data is, of course, imbalanced, which tends to bias the system towards more frequent classes. This also means that, in detriment of the less frequent classes, the system will have a better outcome and also a higher confidence score for the most frequent classes. Those will be automatically labeled, while the less frequent classes—more impacted by the imbalance—will continue to be labeled manually. This results in accuracy being the most relevant metric.
Conversely, another observation from the tables is that the differences in evaluation metrics when considering or excluding additional metadata are relatively minor, aligning with the literature that emphasizes the importance of textual descriptions in achieving effective classification models.7,10
For the analysis and evaluation of the results, it is advisable to focus on two key aspects2,8:
The proportion of responses that can be automatically coded (saving percentage). The proportion of responses that match between the algorithm and the evaluation data (matching percentage; since the true value is difficult to establish due to labeling processes, the term “accuracy” is not used).
The experiments conducted with the two threshold methodologies did not produce the anticipated results; the levels of coincidence remained unchanged for the same savings percentages, as illustrated in Figure 4.
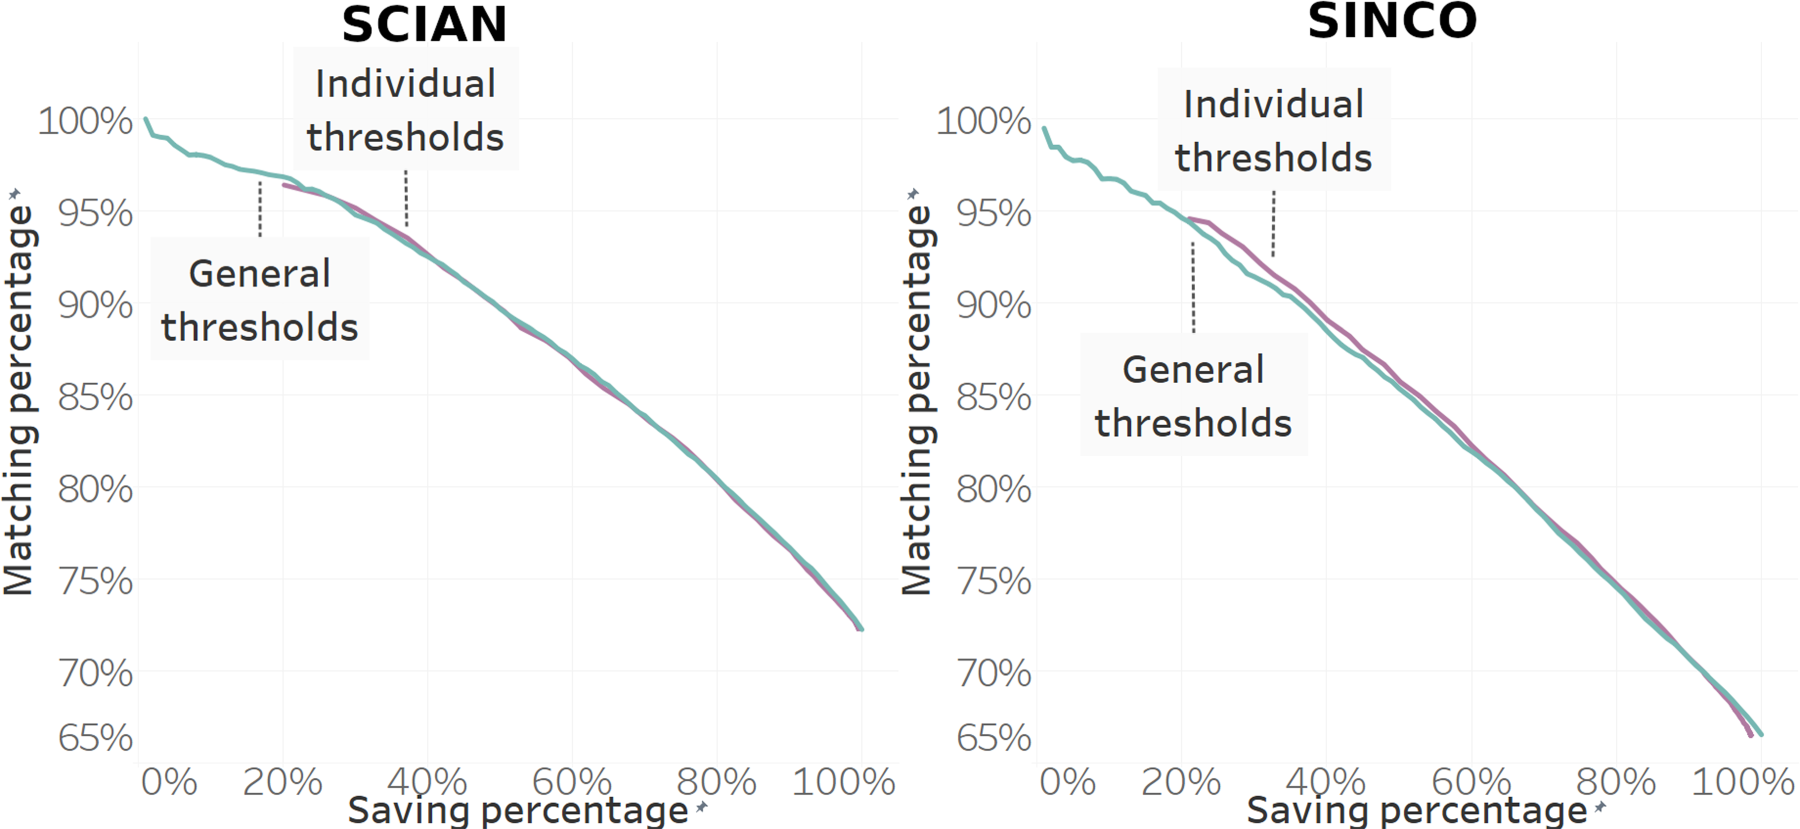
Levels of coincidence for individual and general thresholds. On the left side we present the levels of coincidence in economic activity (SCIAN), while on the right side, we present the levels of coincidence of occupation (SINCO). Both sides reveal no significant difference between the general threshold and the individual threshold.
Nevertheless, we discovered that the algorithm finds the correct answer more easily for certain classes compared to others; however, this phenomenon occurs predominantly among the most frequent categories, which are the only ones capable of sustaining the use of a higher threshold.
Figure 5 demonstrates the scenario where the level of coincidence remains constant across all classes. Here, we observe that in the higher ranges, the threshold for less frequent classes disproportionately increases, leading to the loss of classification elements and consequently a lower overall savings level.
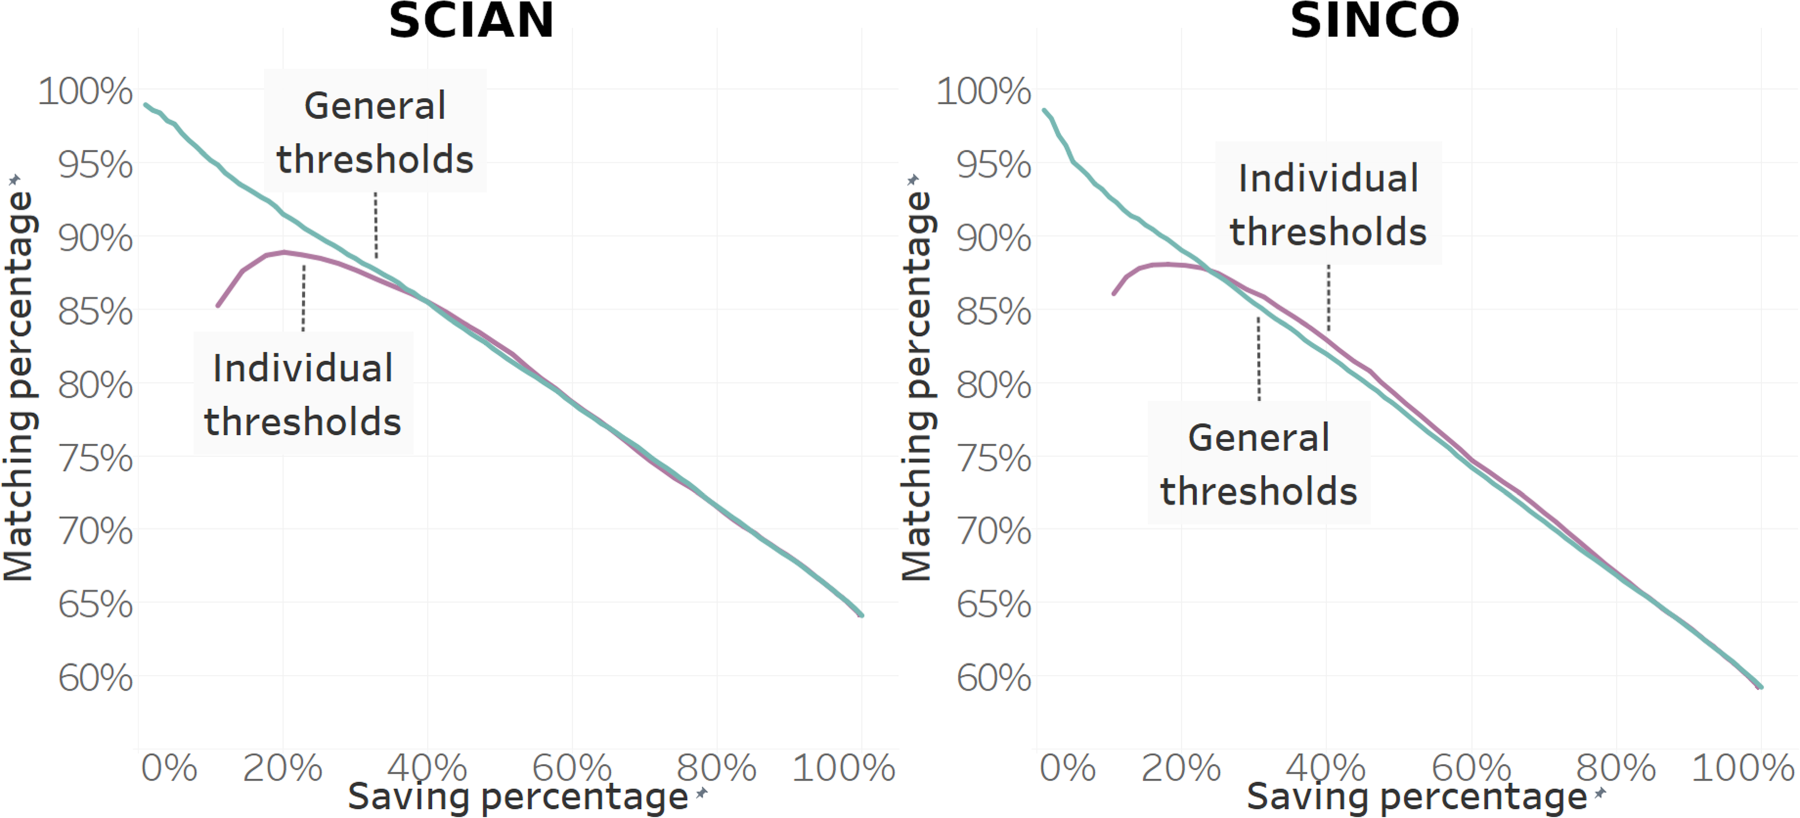
Levels of coincidence for paired classes on individual and general thresholds. On the left side we present the levels of coincidence in economic activity (SCIAN), while on the right side we present the level of coincidence of occupation (SINCO). On both sides we can observe no relevant difference in general threshold against individual threshold but only the most frequent categories can withstand the use of a higher threshold.
Consequently, we opted to adhere to the strategy of employing a general threshold.
The threshold method enables adjusting the threshold to achieve the desired outcome, at the expense of the number of records automatically coded through the DL system. To genuinely evaluate the quality of the results, a code that accurately describes a record is required. Such a code can only be assigned or verified by an expert. All records from the first half of the 2022 seasonal survey that were manually coded (approximately 16 to 22% of the total; 7,011 occupation records and 5,426 economic activity records) were reviewed by our experts.
This allowed us to conduct a similar comparison between the threshold and the outcome, but this time to achieve genuine quality, as illustrated in Figure 6.
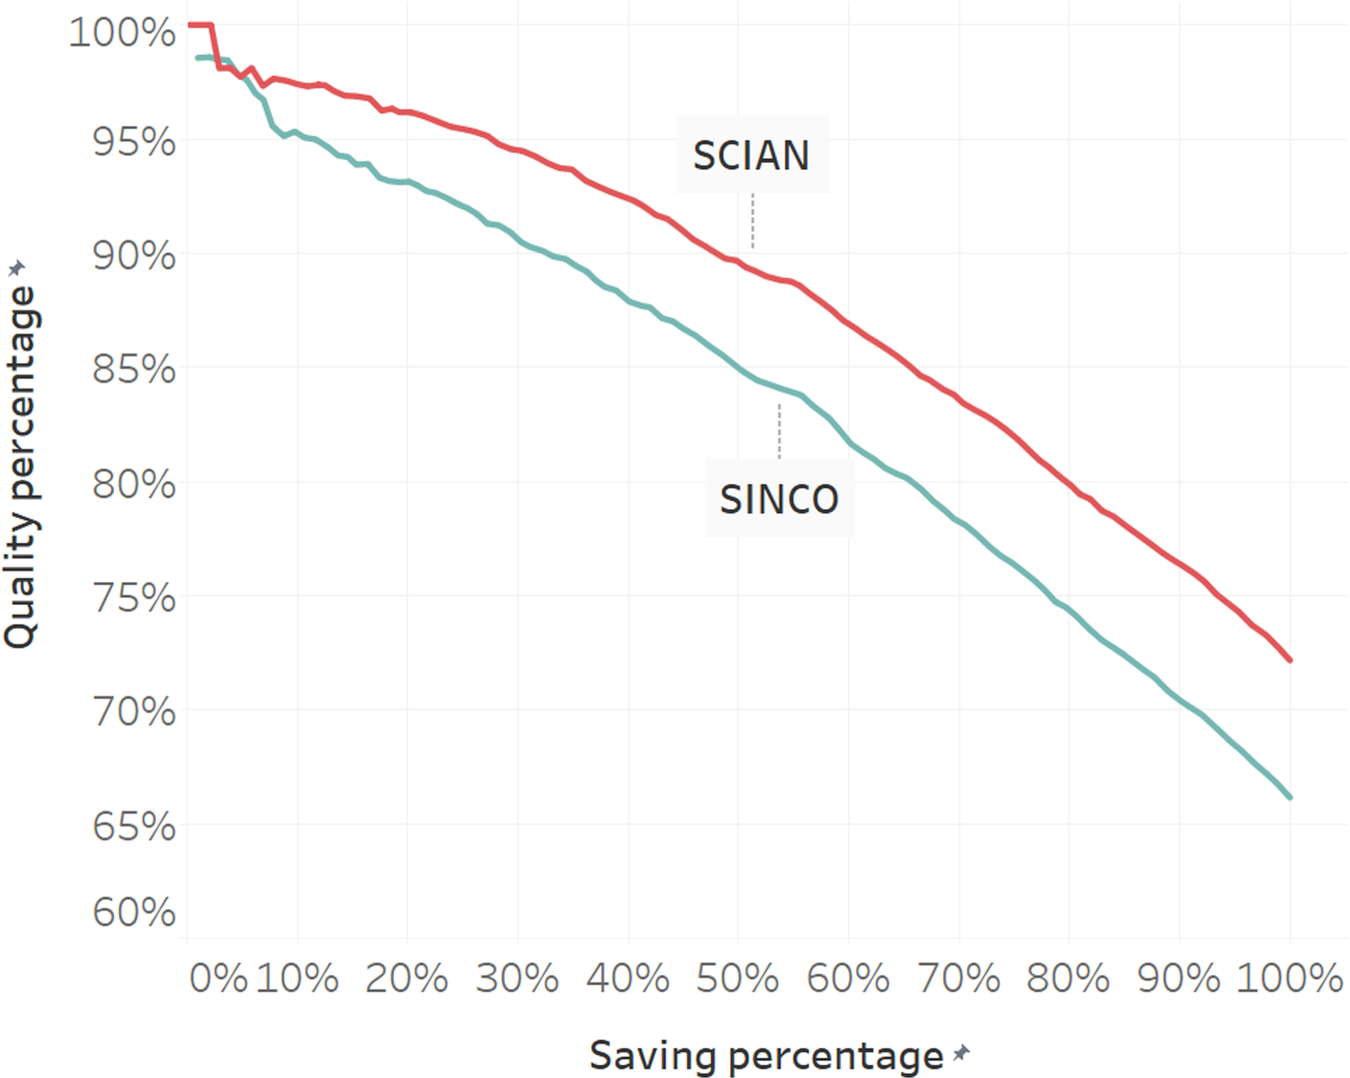
Trade-off between quality and threshold. We present both cases: activity (SCIAN) and occupation (SINCO). The lower the threshold, the greater the potential for saving work through system coding; however, this also leads to a decline in quality.
To determine the threshold, we used the quality of manual coding as a reference. By 2022, the quality of the personnel was estimated at 83.19% for the Occupation variable and 88.94% for the Economic Activity variable. These percentages served as benchmarks for achieving the same level of quality in DL coding.
Once we adjusted the threshold value, we utilized the 2022 Seasonal ENIGH survey for the final evaluation of matches, quality, and savings.
Table 3 displays the thresholds adjusted for every 10% variation in expected savings within the validation set, along with their corresponding results in the evaluation set for the Occupation classification. As the threshold increases, higher matching and better quality are anticipated; however, this also leads to fewer elements being classified by the model, resulting in lower savings as the threshold rises.
Matches, quality, and savings expected and obtained for occupation results. The table shows the variations for every 10% change in threshold, “Val Matching” and “Val Savings” represent the expected results, whereas “Matching”, “Saving” and “Quality” represent the actual results after applying the threshold. Additionally, we present the result and p-value from the McNemar test applied to assess the accuracy of the DL system compared manual coding at a 5% significance level. The null hypothesis (0) of the McNemar test posits that the DL system is not more accurate than the manual coding.

Matches, quality, and savings expected and obtained for occupation results. The table shows the variations for every 10% change in threshold, “Val Matching” and “Val Savings” represent the expected results, whereas “Matching”, “Saving” and “Quality” represent the actual results after applying the threshold. Additionally, we present the result and p-value from the McNemar test applied to assess the accuracy of the DL system compared manual coding at a 5% significance level. The null hypothesis (0) of the McNemar test posits that the DL system is not more accurate than the manual coding.
The estimated quality of manual coding is 83.19%, which can be observed highlighted in the table. It is noteworthy that the achieved quality is either similar or superior to what is currently obtained manually, and the savings percentages align closely with the expected values.
Additionally, Table 3 presents the results and p-values from applying the McNemar test at the 5% significance level, comparing the predictive accuracies of the manual and DL classification models. In the table, the null hypothesis (0) indicates that the DL system is not more accurate than the manual coding. Conversely, the alternative hypothesis (1) evaluates whether the DL system is more accurate than the manual coding. An intriguing phenomenon is observed: the DL system exhibits a clear advantage only in the middle deciles of the thresholds. This aligns with our expectation of increasing accuracy as the threshold increases; however, it also suggests that fewer elements are confidently classified by the system, which may be easier for human labelers to handle.
As shown in Table 4, the thresholds adjusted for every 10% variation in expected savings are presented for the validation set, alongside their corresponding results in the evaluation set for the Economic Activity classification. Like previous observations, increasing the threshold leads to higher expectations for both matching and quality; however, it also results in fewer elements being classified by the model. The achieved quality remains comparable or superior to what is currently obtained manually, and the savings percentages align closely with the expected values. Regarding the McNemar test, we observe a similar phenomenon where there is a “sweet spot” in which the DL model outperforms manual labeling.
Matches, quality, and savings expected and obtained for activity results. The table shows the variations for every 10% in threshold, “Val Matching” and “Val Savings” represent the expected results, while “Matching”, “Saving” and “Quality” represent the actual results after applying the threshold. Additionally, we present the result and p-values from the McNemar test applied to assess the accuracy of the DL system compared to manual coding at a 5% significance level. The null hypothesis (0) of the McNemar test posits that the DL system is not more accurate than the manual coding.

Matches, quality, and savings expected and obtained for activity results. The table shows the variations for every 10% in threshold, “Val Matching” and “Val Savings” represent the expected results, while “Matching”, “Saving” and “Quality” represent the actual results after applying the threshold. Additionally, we present the result and p-values from the McNemar test applied to assess the accuracy of the DL system compared to manual coding at a 5% significance level. The null hypothesis (0) of the McNemar test posits that the DL system is not more accurate than the manual coding.
The estimated quality of manual coding is 88.94%, as highlighted in the table. Overall, the performance for economic activity is approximately five percentage points better in terms of quality compared to occupational classifications.
Based on the tests and evidence to date, the new DL algorithms will complement the automatic coding process, thereby reducing the effort required for manual coding. An important aspect is to determine how much time, or human resources, can be saved through the implementation of these new coding techniques. To achieve this, and using the coding parameters from the ENIGH 2020, a calculation was made of the total time that a group of 8 coders plus 3 coders’ verifiers would take to complete the coding without considering the DL algorithms. The baseline codification time without the new DL module is illustrated in Table 5.
Working time without DL assistance. Summing the four sections of the survey, approximately half a year is needed for 8 labelers to complete the task of tagging the entire survey.

Working time without DL assistance. Summing the four sections of the survey, approximately half a year is needed for 8 labelers to complete the task of tagging the entire survey.
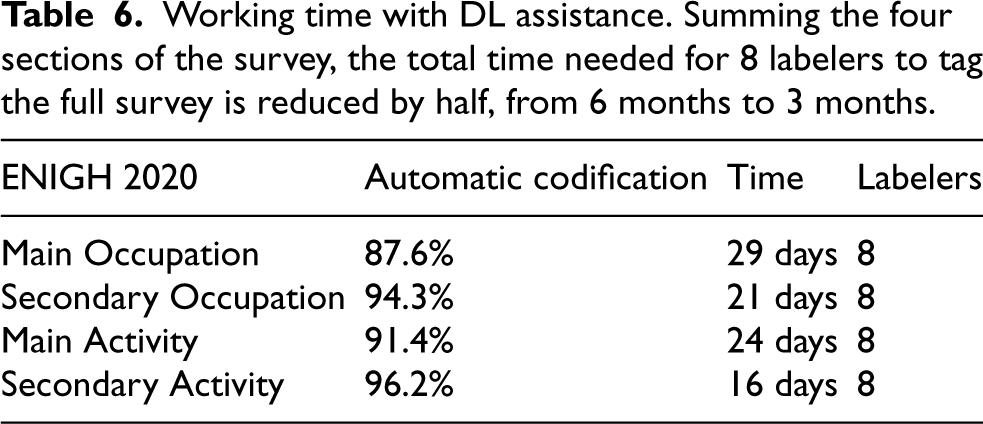
Initial results (see Section 7.1) indicate that the new DL techniques will add about 8 percentage points more coding to the automatic process, and consequently, if the number of participants involved in the process remains constant, the total cycle time will be reduced by nearly half. The reduction results are shown in Table 6.
Working time with DL assistance. Summing the four sections of the survey, the total time needed for 8 labelers to tag the full survey is reduced by half, from 6 months to 3 months.
For several years, INEGI has been designing and developing the current project aimed at evaluating the integration of Artificial Intelligence algorithms into the encoding processes of the National Survey of Household Income and Expenditures.
Currently, the encoding process comprises two stages; deterministic algorithms are initially applied, encoding approximately 80% of the total records. For the remaining 20%, manual encoding is conducted by INEGI personnel who have been trained for this purpose.
To reduce the reliance on manual encoding, we propose incorporating a new intermediate stage utilizing Deep Learning algorithms. These techniques enable the extraction of a certainty value for each encoded record, which can be leveraged to filter out records deemed challenging for the model.
Our estimates suggest that DL could potentially encode 50% of the currently manually encoded records, achieving a coding quality comparable to that of INEGI personnel.
However, our experimental findings also highlight certain limitations of the proposed AI solution. Primarily, the quality of classification performed by the system is significantly inferior to that achieved by trained human labelers. By employing the certainty metric generated by the DL algorithm, we can identify records where the algorithm’s code can be trusted, allowing the remaining records to be manually encoded. If the selection criteria are stringent, there will be fewer records labeled by the algorithm, but a higher degree of alignment with manual encoding practices. The system is highly sensitive to this threshold, necessitating frequent evaluation to ensure the accuracy of classifications.
Additionally, integrating new codes into the classification framework poses challenges. The entire process described in this paper is based on the latest version of the codification framework. However, the framework undergoes periodic updates, requiring the system to be retrained to accommodate new codes or cease generating codes that have been removed. This necessitates careful management to avoid introducing biases introduced by data imbalances, particularly when the framework is updated.
Moreover, the presence of imbalances in the dataset leads to biases in automated decision-making, favoring more frequent classes. When the framework is updated, these biases may affect new classes as well. Therefore, it is crucial to establish protocols for the inclusion and exclusion of codes during framework updates, as well as specialized protocols for handling infrequent labels to mitigate the impact of such biases.
In conclusion, future methodological advancements in both the classification algorithm and the utilization of its outputs should aim to broaden the scope of possibilities while minimizing the trade-off between the algorithm’s extensibility and its accuracy.
Footnotes
ORCID iDs
Funding
The author(s) received no financial support for the research, authorship, and/or publication of this article.
Conflicting interests
The author(s) declared no potential conflicts of interest with respect to the research, authorship and/or publication of this article.