
Abstract
Time-use surveys (TUS) are a cornerstone of gender statistics, capturing how people allocate time across paid work, unpaid care, and leisure. By making visible the value of unpaid care and domestic work—often excluded from economic measures—TUS provide essential evidence for labor, social protection, work–life balance, and gender-responsive budgeting. This paper offers a global overview of TUS, tracing their evolution from measurement tools to drivers of policy change, while assessing persistent limitations and emerging opportunities. Drawing on UN Women and Data2X case studies, and recent UNSD and ILO developments, it examines methodological advances—from diary-based vs. stylised approaches and measurement of simultaneous activities to harmonised classifications (ICATUS 2016, HETUS, CAUTAL) and technology-enabled data collection. Challenges remain: funding and capacity gaps, uneven institutionalisation of gender perspectives, inconsistent age thresholds and household classifications, and weak policy uptake. Yet, enabling factors are clear: policy uses in assessing the care economy, informing national care policies (e.g., Uruguay, Kenya), and compiling extended household production accounts. Positioning TUS as both statistical and policy instruments, the paper calls for sustained investment, harmonisation, and innovation to realise their full potential in advancing gender equality and sustainable development.
Introduction: The role of time-use surveys data in policy and development
Time-use surveys (TUS) have become a key tool within the system of household surveys in national statistical systems, offering a robust evidence base to inform public policy and development planning. By systematically capturing how individuals allocate their time across a range of activities within a 24-h period, TUS provide detailed data on labor dynamics, unpaid work, and social engagement, which often goes misrecognised in traditional economic statistics. For official statisticians and researchers, TUS offer a unique opportunity to quantify the economic and social value of daily life, particularly unpaid and care work, which is essential for designing gender-responsive policies and advancing inclusive development for all.
Defined as household-based surveys that record all activities undertaken by individuals over a reference day (or days), TUS typically utilise either diary-based or stylised questionnaire methods, providing the most valid and reliable source of information and allowing for the collection of complex data in a highly flexible manner.1–4 The diary approach, considered the most accurate,\vadjust{\newpage} typically segments the day into intervals (e.g., 10 or 15 min, and sometimes even longer intervals such as 30 min, to avoid respondents’ burden)5,6 and captures main and secondary activities, contextual variables such as location, and the company and purpose of each activity. This structure enables multidimensional analyses and supports data comparability across time and populations. The resulting data yield critical insights into how men and women distribute their time, the volume of unpaid work and its overlap with paid work, and the implications of time allocation on well-being and productivity.
The analytical value of TUS lies in their ability to expose and quantify the unpaid work and the gendered division of this labor. These data help fill long-standing gaps in labor statistics, contributing to a more accurate measurement of total work performed in the economy. In this regard, TUS are central to addressing the underestimation of women's contributions and informing the 5Rs framework: Recognizing, Reducing, and Redistributing unpaid work, and Rewarding and Representing those who perform it. 7 While Rewarding and Representing are often associated with paid care workers, they are equally relevant for unpaid care providers, who deserve greater visibility, voice, and value in both policy and public discourse.
In response to these disparities, ‘time policies’ are emerging as a critical tool to address the unequal distribution of time in society. These policies aim to reorganize and restructure the social framework of time to improve public well-being, alleviate time poverty, and safeguard individuals’ right to time. Proper time allocation, where individuals feel satisfied with how their time is spent, can lead to enhanced overall health, reduced inequalities, higher productivity, and contribute to a more sustainable society from both a social and environmental standpoint. 8
TUS have gained increasing global traction, with over 100 countries (Table 1) 9 implementing such surveys to date. However, despite progress, the full potential of time-use data remains underutilised. In many instances, data collected are insufficiently disseminated, not routinely integrated into official statistics, or not tailored for policymakers. For TUS to be truly effective, the data must be accessible, understandable, and actionable, requiring targeted investments in data analysis, communication, and capacity development.
List of time-use surveys by year and region: 104 countries, 277 surveys (63 countries repeated their
surveys at least once).
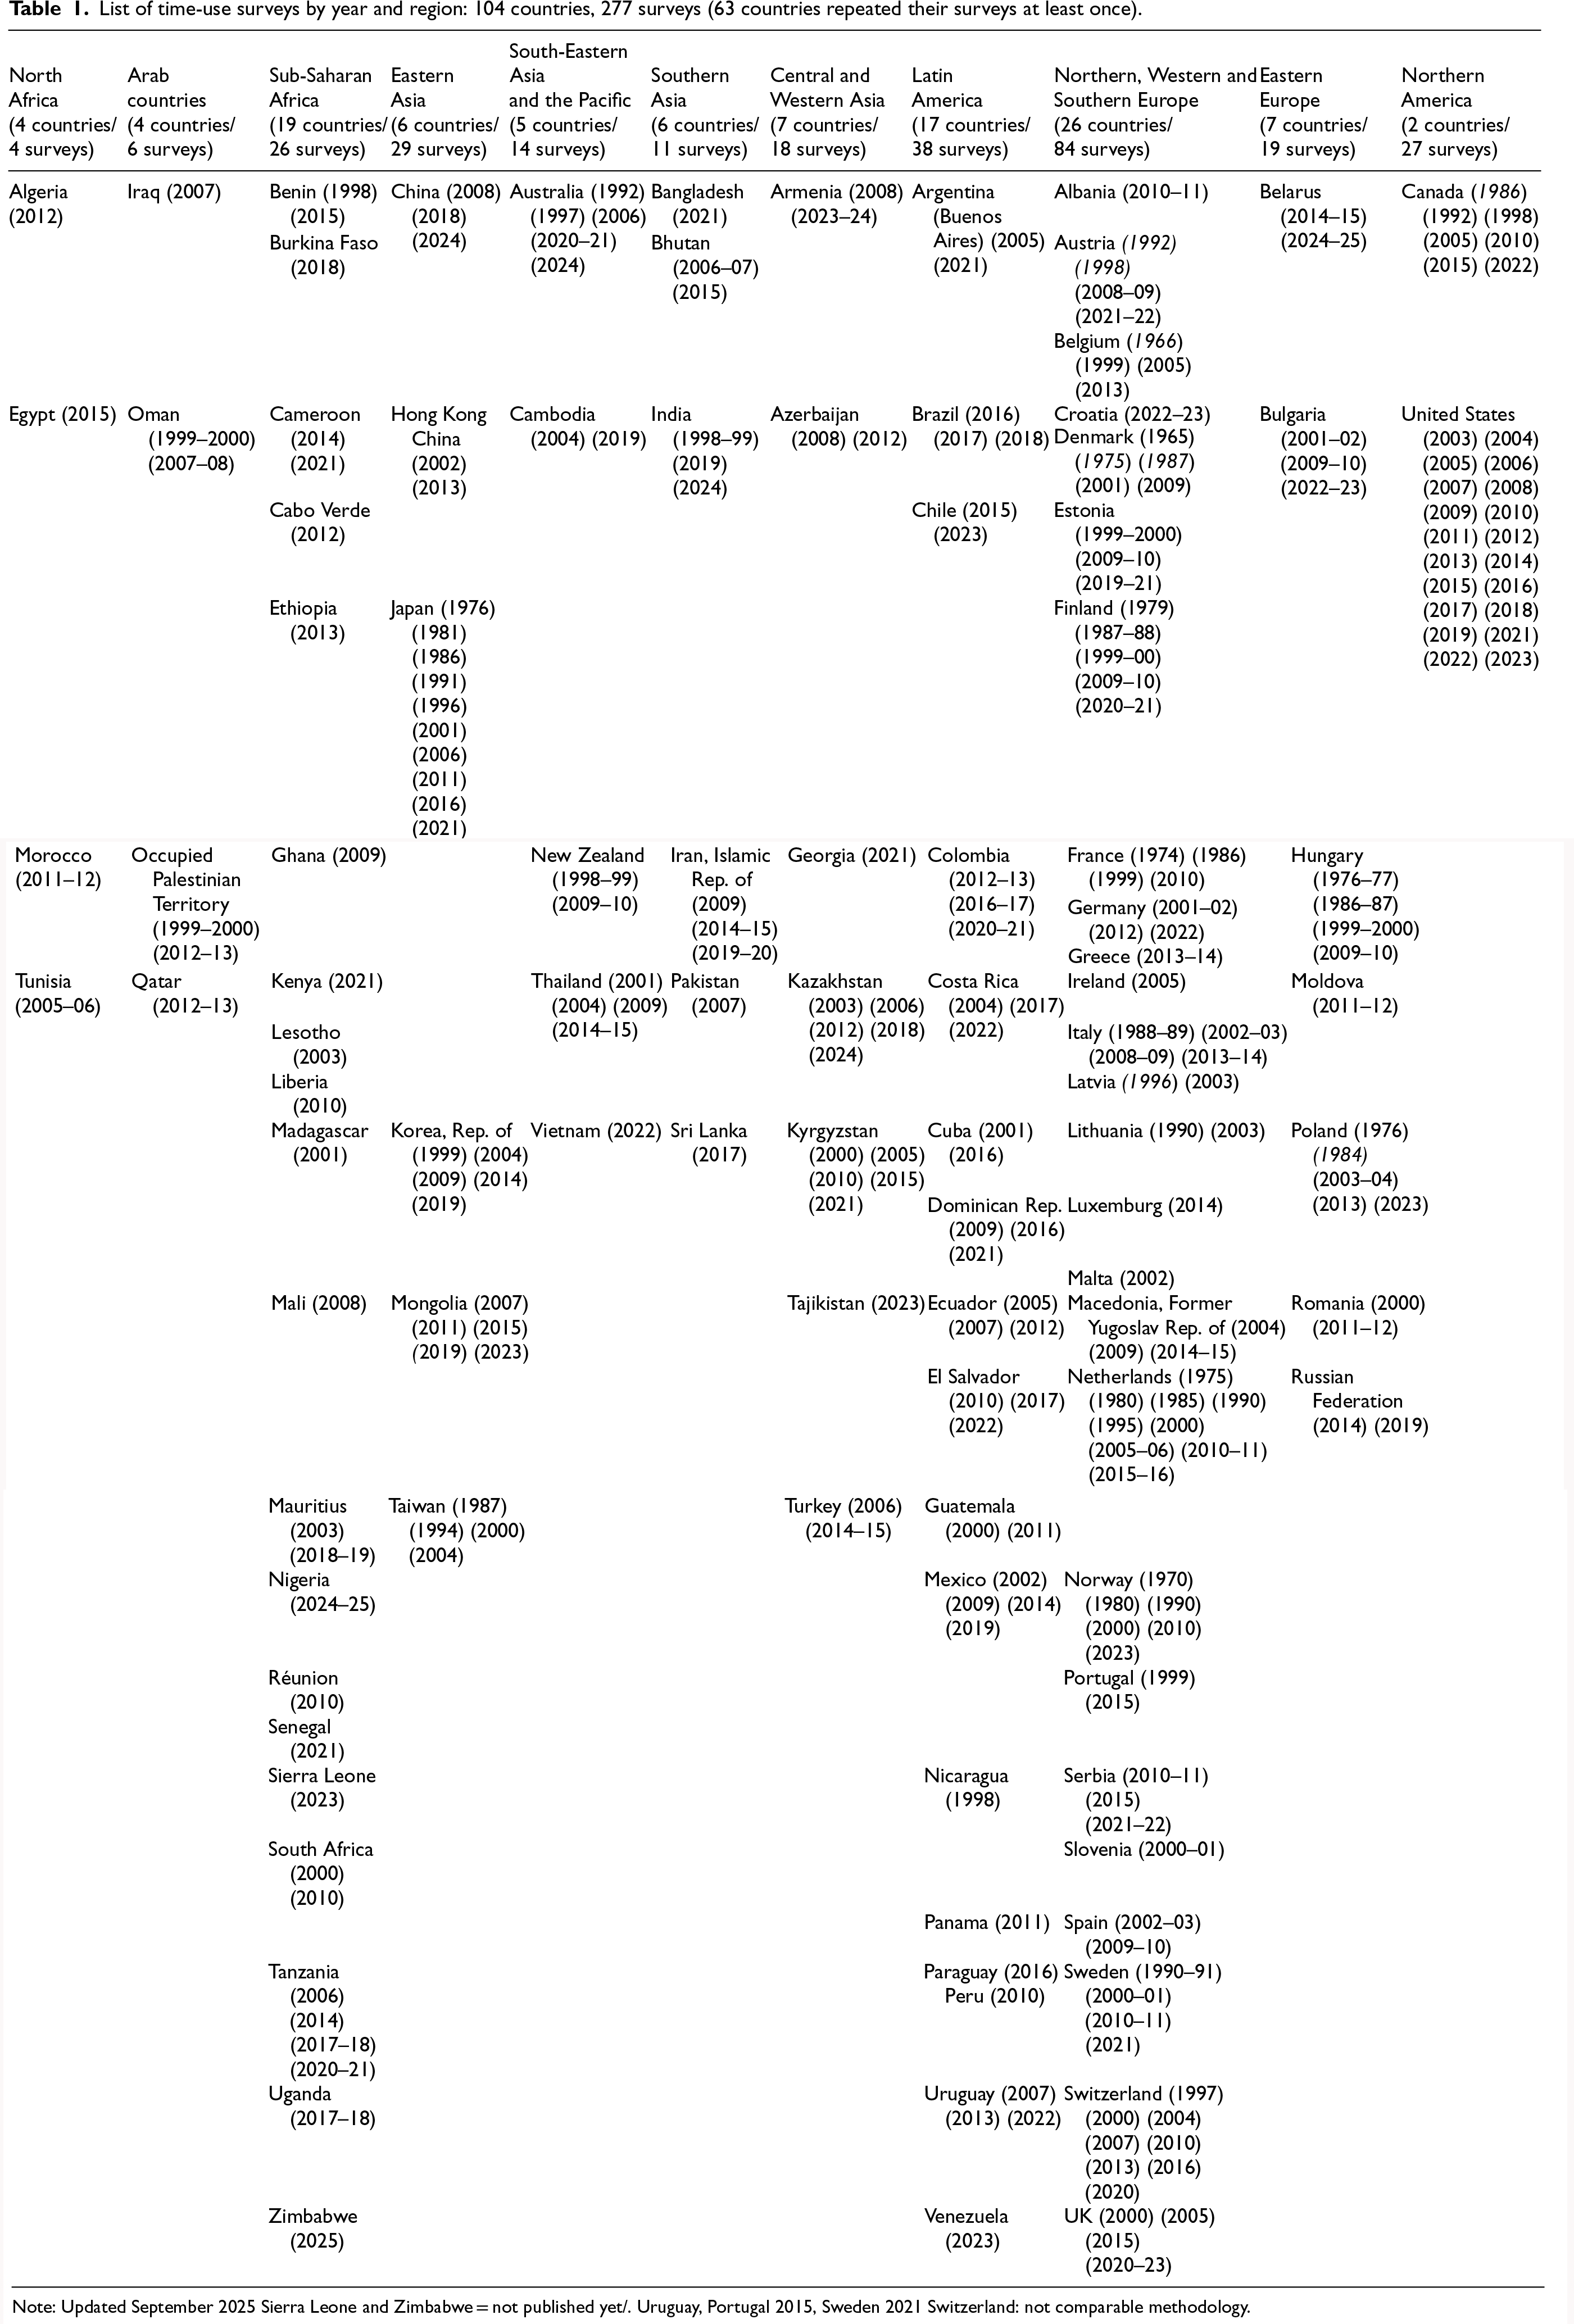
List of time-use surveys by year and region: 104 countries, 277 surveys (63 countries repeated their surveys at least once).
Note: Updated September 2025 Sierra Leone and Zimbabwe = not published yet/. Uruguay, Portugal 2015, Sweden 2021 Switzerland: not comparable methodology.
The significance of TUS has been demonstrated in several countries, including those supported by UN Women's Women Count programe since 2018 9 and countries studied by Data2X.10,11 For example, in Kenya, TUS data informed care economy assessments and has been used to quantify women's unpaid work in GDP-equivalent terms. In Georgia, where the transition to CATI (Computer-Assisted Telephone Interviewing) in TUS during the COVID-19 pandemic showcased methodological flexibility, an almost full satellite account of household production has been compiled (UN Women 2025). 12 In Kenya and Tanzania, TUS were integrated into larger household survey programes, linking time use with income and living standards to inform social protection design. These cases highlight how time-use data can inform budgetary decisions, infrastructure planning, and sector-specific interventions such as investments in child and elder care services, public transport, and rural electrification, that reduce time burdens on women and girls.
From an economic development perspective, time-use data enable the creation of extended accounts for unpaid household production.13,14 These accounts provide monetary estimates of non-market labor, facilitating its inclusion in national accounts. Such accounts have been produced in Mexico, Colombia, and Switzerland, among other countries (refer to section 3.2 for more countries), influencing national debates on care economy investments and the valuation of women's unpaid labor. Additionally, time-use data are increasingly recognised as a critical source for tracking progress toward the Sustainable Development Goals (SDGs), especially SDG 5.4 on unpaid care work, as well as SDG 8.5 (Full employment and decent work with equal pay), and SDG 10.2 (Social, economic and political inclusion).
Importantly, TUS are increasingly being combined with other data sources, such as administrative records, geospatial data, and qualitative studies, to enrich analysis and triangulate findings. They are also often integrated – as add-on modules - into labor force surveys, income-expenditures surveys and other multi-purpose household surveys as a way of filling the gap between two independent TUS. Integration with national statistical systems requires clear protocols, standardised classifications (e.g., the International Classification of Activities for Time Use Surveys (ICATUS) 2016, the activity coding list of the Harmonized European Time Use Survey (HETUS 2018), and Clasificación de Actividades de Uso del Tiempo para América Latina y el Caribe (CAUTAL 2016)), and investment in interviewer training, coding, and data processing capacities. Dissemination also requires tailored outputs: user-friendly dashboards, policy briefs, and visualisations that make time-use data understandable and relevant for non-technical stakeholders.
The role of researchers and producers of time-use statistics, is not limited to data collection. They must ensure that these data contribute to public discourse, policy design, and accountability. Although, as reflected in the GSBPM, 15 data producers’ primary responsibility typically extends up to dissemination and communication of data, activities such as policy design and accountability, while important, generally fall within the mandate of policymakers and other data users. A clearer distinction could help reinforce the respective roles across the statistical and policy value chains. Documenting data use through validated use cases, citations in policy documents, or adoption in national strategies, is critical for demonstrating the return on investment in TUS. Time-use data represent more than a statistical product, they are an instrument for social justice and inclusive development. By making visible the unseen labor of care and domestic work, TUS allow policymakers to better address gender inequalities, plan for infrastructure and services, and measure human well-being. For national statistical offices, practitioners and researchers, strengthening the regular production, use, and communication of time-use data will be key to advancing gender-responsive policies and achieving the SDGs.
This paper is structured in four parts. Section 1 introduces the role of time-use survey (TUS) data in informing policy and development, and outlines their evolution and current status. Section 2 explores the progression of TUS from a measurement tool to a driver of policy impact, offering both global and regional perspectives. Section 3 examines the diverse uses of TUS data, including its role in measuring and valuing unpaid care work, informing extended household production accounts, assessing time poverty, developing gender-responsive indicators, supporting the SDGs beyond gender equality, and contributing to well-being measures and broader policy applications. Section 4 concludes with key insights and implications for future investment and policy engagement in time-use data systems.
The evolution of time-use surveys: From measurement to policy impact
TUS have blossomed in recent years, and their repetition has become more common, not only in high-income countries, but also in emerging as well as in low-income countries. To-date, more than 100 countries (The number of countries would be higher with more flexible criteria of definition: many African and Asian countries have carried out household living conditions surveys with a section on time-use (but limited to incomplete lists of activities): these surveys are not considered here.) across the world have conducted such surveys at national level, with more than half (63) repeating the survey on a more or less regular basis (every 5-year or 10-year). Since 2015, 50 countries have conducted a time use survey, with 34 as (or with) a repetition, of which 25 with repetition on a regular basis. Thus, although it is true that we have come a long way, the trend data suggests that there are still too few prioritizing TUS.
The collection and practical use of TUS data go back a long way. In the late nineteenth century, researchers in Russia first used time diaries to understand the daily life of peasant families and, in the 1920s and 1930s, these diaries were used by US agricultural extension agencies and UK broadcasting companies to time the delivery of, respectively, extension services and radio programs to rural families (Gershuny 2011 16 ). After a lull, in the mid to late 1960s seminal work in European countries, under the supervision of Alexander Szalai (1972 17 ) refocused attention to time use surveys. This paper includes a compilation of TUS from the end of the 1960s, immediately after the above multinational time use survey, which was often limited to one or several major cities or urban areas. Considering that this survey marks the start of modern time-use data collection on relatively comparable methods, we identified 104 countries that conducted at least one time-use survey defined as using the diary as the main tool of data collection (or in default, a complete list of stylized questions covering all the spectrum of time-use activities), and with national coverage (The database comprises 15 countries using stylized questionnaires (13 in Latin America: Brazil, Chile, Colombia, Costa Rica, Cuba, Dominican Rep., El Salvador, Mexico, Nicaragua, Panama, Paraguay, Peru and Uruguay; 1 in Africa: Cabo Verde, and 1 in Europe: Switzerland), 2 countries limited to urban areas (Iran and Panama), 3 countries limited to several states (but with strong samples): India 1998–99, China 2008, Nigeria 2024–25, and 3 countries covering only unpaid work activities: Cabo Verde, Switzerland, Uruguay.).
Table 1 provides the list of countries and years of the surveys, by regions. Figure 1 locates the countries on a world map and Figure 2 displays the countries and surveys over 6 decades by 5-year period from 1965 to 2025.
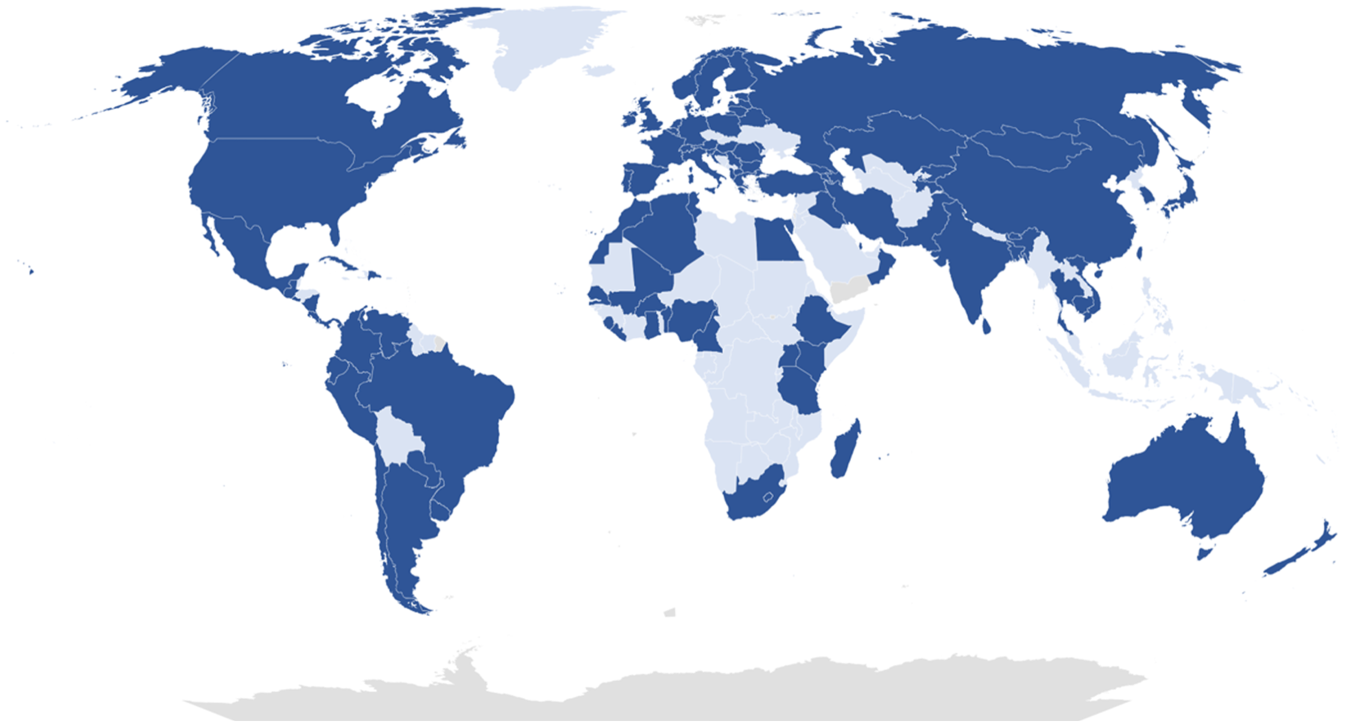
Countries with at least one time-use survey since 1965.
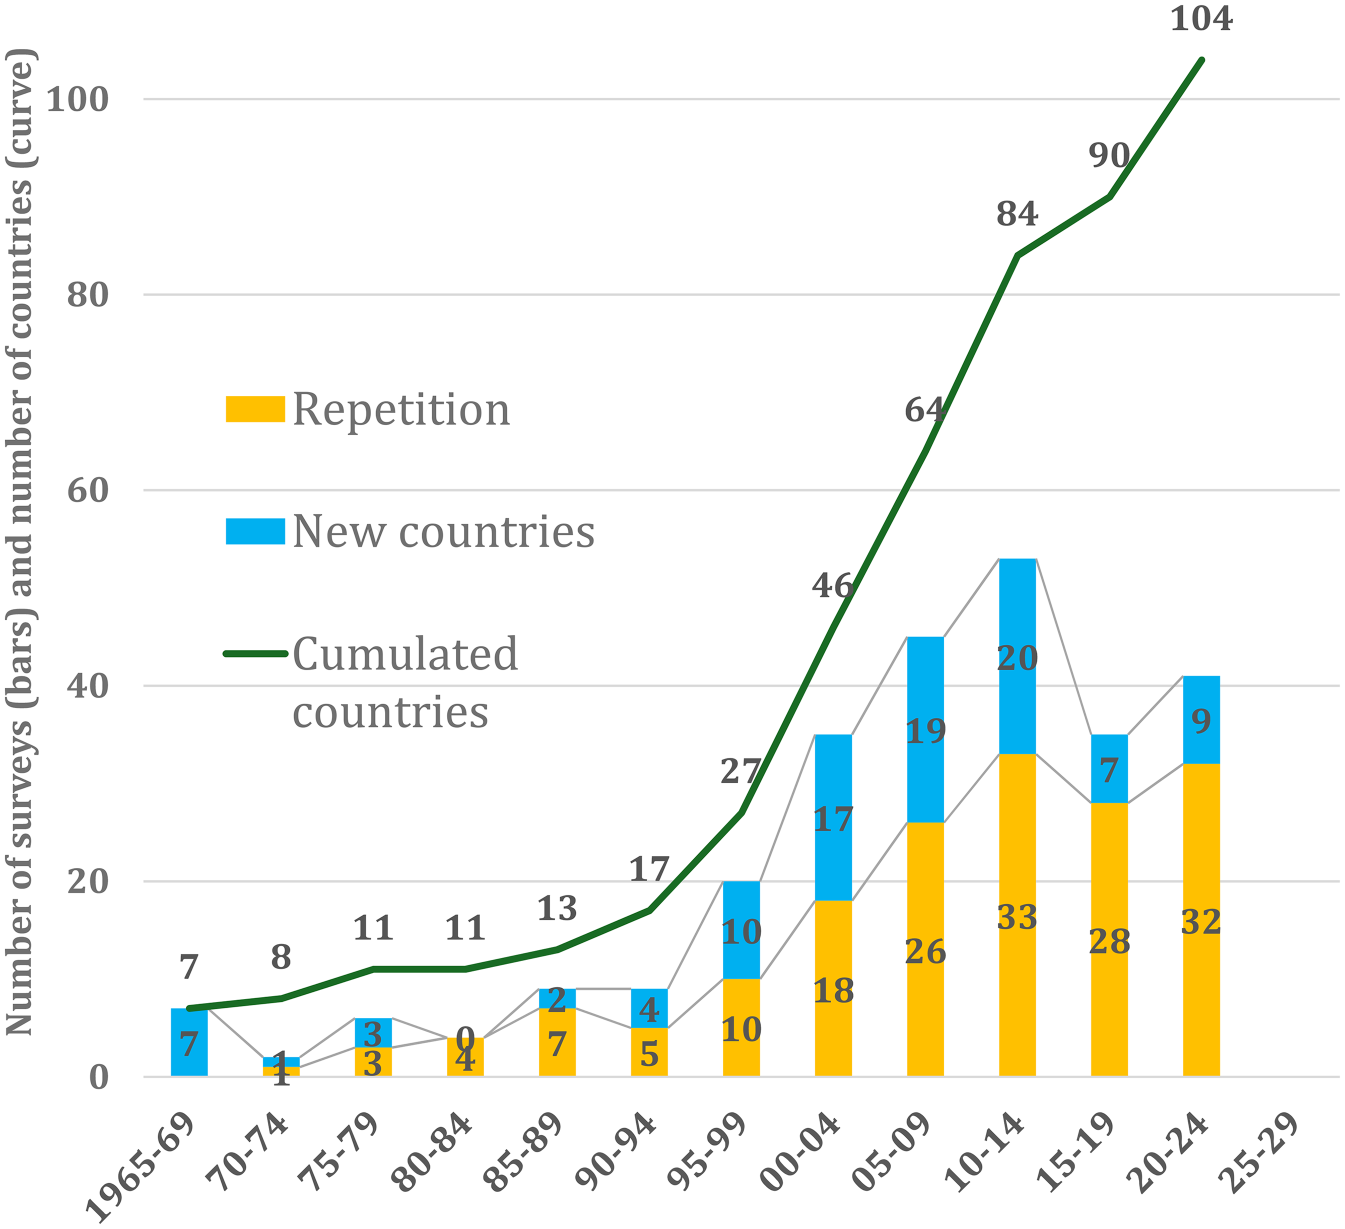
New surveys and repetition surveys by 5-year period over six decades.
Figure 2 shows the take-off that occurs in the aftermath of the Beijing conference in 1995 and continues until 2010–14. Surprisingly, the adoption of the SDGs in 2015 with the inclusion of target 5.4 on the recognition and value of unpaid care and domestic work does not translate into the continuation of the exponential growth in the number of countries, but rather marks a slowdown inflection as if the progress were made more difficult because it involved countries with less human and financial resources. Still, it probably contributed to a more systematic compilation of extended accounts and to maintaining the high priority given to TUS, particularly in a time when the COVID-19 pandemic resulted in postponement of surveys. Another reason could be due to the timings of HETUS programming. It should also be noted that the period 2020–24 though maybe not complete yet, marks a return to the prior exponential growth rate.
In the wake of the rise of the consumer society, the first TUS carried out in the early 1970s mainly focused on leisure, free time and well-being (Gershuny 2000 6 ) and not particularly on gender differences. Many NSOs continue to display TUS results for both sexes and refer to a chapter on gender for presenting tables and figures disaggregated by sex. It was not until the Beijing Conference in 1995 that the measurement of unpaid care work and the related gender gap took the lead as one of the main uses of TUS, though not the only one. The Platform for Action underscores the need to quantify and value unpaid domestic work and mandated to the United Nations Statistics Division (UNSD) to advance the development of time-use statistics. Highlighting the gender gap in unpaid care work became a means towards achieving its recognition and helping design strategies and policies for reducing and redistributing a burden considered as the main barrier preventing women from entering or remaining in the labor market.
Yet the use of TUS by policy-makers - and also, regrettably, by researchers - is far from being satisfactory, even in ministries dedicated to gender mainstreaming and women's empowerment, and remains far below the expectations placed in them and their potentialities towards the implementation of the 5 Rs strategy (In the wake of the Beijing Conference on Women in 1995, a 3 Rs strategy emerged as a product of the 2016 UN Secretary General's High-Level Panel on Women's Economic Empowerment and was developed by Diane Elson 18 for UN Women. It summarized the objectives of the Beijing Platform of Action regarding unpaid work through 3 Rs: Recognizing-Reducing-Redistributing. Later on, with the deepening of reflections on the care economy and especially with the release of the ILO report on “Carework and care jobs for the future of decent work” in 2019, 19 two more Rs were added: Rewarding and Representing in relation with the working conditions of paid care workers in an ILO 5Rs framework (UN Women 2022 7 ). And even more recently a sixth R was added (Resourcing) dealing with costing and tracking care investments, care and gender-responsive budgeting, and expanding the fiscal space (UN 2024 20 ).). Whereas this strategy is at the confluence of 5 main policy areas (care policies, macro-economic policies, social protection policies, labor policies, migration policies), the conduct of a time-use survey has most often led to the production of a report on statistical findings, more rarely to the compilation of satellite accounts of household production (in about 40 countries among which are Mexico, Colombia, Ecuador and Peru, Morocco and Senegal, Georgia and Moldova, not to mention European and Northern American countries), more rarely to care needs assessments leading to the adoption of national gender strategies (Albania, Kenya) towards better work-life balance or improved quality of life.
TUS are essential for advancing gender equality by highlighting the disproportionate burden of unpaid care work on women and girls. It is little to say how important they are for enhancing the recognition, reduction and redistribution of unpaid care work, as well as the reward and representation of unpaid and paid care workers. With the Beijing Platform of Action and the SDGs, TUS data collection has been brought to the fore towards measuring policy impacts. There are several reasons for the underuse of TUS: Limited accessibility and understanding: Firstly, the findings of time-use surveys remain difficult to apprehend and sometimes to understand for common or even informed users. Even published reports are not exempt from mistakes. Partly, this is because TU surveys are complex data collection instruments. They measure complex activities with unclear boundaries and require significant effort from both respondents and interviewers. It is not easy to analyze the large amount of information they produce, and many countries still lack the statistical capacity to analyze this information for policy purposes. Capacity gaps in analysis: Secondly, the persons in charge of the data processing and data analysis are often insufficiently aware and trained to identify the results to be highlighted. This definitely delays many which reduces the timeliness of publications and can impact their use. Misunderstandings and misinterpretation abound, not to mention the existence in time-use reports of chapters or sections without any engendered statistics. Insufficient emphasis on the 5Rs: Thirdly, many survey reports do not explicitly frame their findings in relation to the 5R framework, limiting their policy relevance. Weak dissemination efforts: Fourthly, once the validation workshop, with stakeholders and the media, has taken place and the official report on main findings has been released, the actions of dissemination abruptly stop, and the interest aroused is diluted and fades away. It is worth noting that sustaining interest and action following the release of findings often requires continued engagement from public policy actors. The responsibility for leveraging the data beyond the initial dissemination phase typically lies with those involved in policy design and implementation—roles that may go beyond the mandate of the NSO. Moreover, if the time span between surveys is every five years, the NSOs would need to restart the cycle for producing the next TUS. Disconnection between data producers and data users: While data production requires independence and lack of interference and data manipulation, better communication between producers and users of statistical information on, among other things, which subjects and questions are policy relevant and how the data can be presented in more useful ways should go a long way toward helping address TUS data's underutilization.
TUS data are especially underutilized to influence policies in specific economic sectors to increase women's economic participation and empowerment. For instance, while the findings can inspire global policies to enhance women's participation, it is more unlikely that they be used for designing sectoral policies (manufacturing, banking and finance for example, and even the care sectors).
Recent efforts have been made towards improving use of TUS: The lack of harmonization has long been recognized as a key barrier to improving time-use statistics. In response, the statistical community developed the International Classification of Activities for Time-Use Statistics (ICATUS 2016) and corresponding tables linking it to regional classifications to enable international comparability. More recently, the Statistical Commission endorsed the Minimum Harmonized Instrument for the Production of Time-Use Statistics, which includes a Minimum List of Activities—an abridged classification of 25 activities based on ICATUS 2016—agreed upon by countries to enhance cross-national comparability. The neglect of supervisory care has also been highlighted in connection with the difficulties in measuring simultaneous activities and as a major factor of underestimation of care activities. The update of the UNSD Guide for Producing Time Use Statistics
4
addresses the issue.
Overview of TUS implementation across different regions (Global North vs. Global South)
The modern history of TUS starts with the Multinational Time Use Study (MTUS) conducted under the supervision of Szalaï in the mid of the 1960s: a minimum set of standardized rules were used regarding data collection of main and simultaneous activities through diaries, a detailed classification of activities, contextual characteristics (where, with whom), and with the objectives of improvements in the knowledge of leisure and free time, commuting to and from place of work, women's ‘domestic slavery’ (It is in these terms that Goguel (1982) 21 identifies unpaid domestic and care tasks among the multiple reasons that explain the development of TUS after World War II, in the overall presentation of the MTUS.), and exposure to mass media use.
In the wake of this study, several European countries started to implement such surveys on a regular basis and using the diary method, a classification of activities and contextual characteristics: every ten years in Norway since 1970, in Finland since 1979, in Sweden since 1990, in UK, Germany and Estonia since 2000, every 5 years in the Netherlands since 1975. Most other European countries implemented TUS but on a more irregular basis, which means that these surveys were not included in their multi-year programmes. Therefore, the landscape was mapped out for further harmonization under the guidance of EUROSTAT: the guidelines for Harmonized European Time Use Survey (HETUS) including an activity coding list were made available since 2000 (Eurostat 2004), with last update in 2018. 22 Today, all countries of the European Union (27 countries + Norway), as well as associated countries from Western Balkans and Turkiyë (7 countries) and from the Eastern Partnership (6 countries) benefit or have benefitted from the support of EU and follow the HETUS guidelines throughout three waves of surveys (2000s, 2010s and 2020s) that ensure their repetition every ten years at least. Eurostat has supported several countries via grants to further develop their methodology, and new tools for the data collections of the time use survey and household budget survey (HBS). For all these countries, TUS are stand-alone surveys based on diaries and following the HETUS classification and recommendations.
In the region, only Switzerland followed a different path: since 1997, the Swiss Federal Office of Statistics carries out a survey on unpaid work every three-to-four year, as a module of the annual Swiss Labor force Survey (SLFS), with stylized questions on domestic, care and voluntary activities.
In Northern America, the US shifted in 2003 from unofficial surveys with a periodicity of 5-year to official surveys conducted by the Bureau of Labor with 1-year periodicity. And Canada applied a diary method since 1986 and shifted from 6- to 5-year periodicity in 2005.
In other high-income countries, the periodicity has been irregular (Australia, New Zealand), except in Korea (5-year periodicity since 1999) and in Japan where a light diary method has been applied since 1976, doubled with a full diary since 2001.
In the Global South, the preliminary attempts to measure time use focused on water and wood/fuel fetching, generally added as stylized questions to the module on labor force and employment in multipurpose household surveys, in complement to questions on the measurement of production of goods for own final use. This was the case, in particular, in the World Bank Living Standard Measurement Survey (LSMS) program or similar surveys on household living conditions (ENCOVI programs in Latin America, Integrated household living conditions surveys in Africa or Asia), soon completed with questions on other unpaid activities such as domestic work, care work, but never covering the whole range of daily activities.
Since the years 2000s in Latin America these surveys have turned to the inclusion of whole modules of stylized questions on a more or less long list of unpaid activities (from 10 to 20) and/or to the implementation of stand-alone TUS covering a number of unpaid activities (from 45 in Paraguay and 65 in Colombia, up to 89 in Mexico, 99 in Chile and Costa Rica, 111 in Ecuador and 128 in Peru or even more) (Charmes 2021, 23 ECLAC 2022 24 ). To-date, only six countries in Latin America have carried out diary-based TUS (Argentina 2021, Brazil pilot 2009–10, Cuba 2001, Dominican Rep 1995, Mexico 1998, Venezuela 2023), with Brazil, Cuba, Dominican Rep and Mexico coming later back to stylized questions in a modular approach.
In Asia, the diary-based approach is used and only half of countries have collected data yet (in Central Asia and in South-Eastern Asia). Indonesia – last of the most populous countries not having yet collected such data except an earlier pilot survey - is currently engaged in a new pilot survey with the ILO light time use survey module.
In Africa, the first diary-based time-use survey dates from 1998 (Benin) and 15 countries (19 with Northern Africa) have so far conducted such surveys, with a dozen more collecting partial data through multipurpose household surveys modules of incomplete list of stylized questions. It is the continent where efforts need to be made for an extended coverage of TUS. Given that it is also the continent that lacks resources the most, the modular approach with light diaries (such as the ILO add-on module) seems to be the most relevant.
In summary, TUS are institutionalized in high-income countries on a more or less regular periodicity, but with a minimum 10-year periodicity. The most populous countries of the world and Global South (India, China) also seem to have institutionalized their TUS, with Indonesia, Bangladesh and Nigeria on track.
Several international actors contributed and still contribute to mitigate funding constraints and lack of technical expertise: We have already mentioned the EU with HETUS programe extended to neighbor countries. UN Women, via the Women Count Programe, supports NSOs in raising funds, coordinating, providing technical expertise and supporting publication of findings in 7 countries during phase 1 of the programme (Bangladesh, Colombia, Georgia, Kenya, Senegal, Tanzania/Zanzibar, Uganda), and 6 more countries during phase 2 (Armenia, Belarus, Kazakhstan, Moldova, Morocco, Nigeria), with Cameroon to be added through a support for publication. The Pacific islands are also scheduled, with a focus on supervisory care. Other African countries (Zimbabwe, Mozambique, Côte d’Ivoire) rather move towards the ILO light add-on diary module, attached to their regular household survey (LFS or HBS). Similarly, in Asia the ILO light module is tested through a small-scale trial with the university of Indonesia in a research programe requested by the Bureau of Statistics Indonesia and is meant to be applied in other countries. The World Bank also continues to support light diary modules or full diary surveys (Vietnam, Sierra Leone).
Harmonisation, institutionalisation, and international comparisons
Harmonisation
The variety of approaches, as well as the variety of actors makes it more difficult to achieve the harmonisation required for chronological and international comparisons.
Following the call from the Beijing Platform for Action to develop a classification of time-use activities, UNSD has worked with experts worldwide to advance the harmonization of time-use statistics. In 2016, the International Classification of Activities for Time-Use Statistics (ICATUS 2016) was endorsed by the UN Statistical Commission as the international statistical standard to support comparability across countries. More recently, in 2024, the Statistical Commission approved a revised set of Guidelines, introducing updated concepts, definitions, and methodologies to assist national statistical offices in implementing TUS and integrating time-use modules into household surveys. 4
In addition to ICATUS, two regional classifications are widely in use in different geographical contexts: HETUS for Europe and neighboring countries, CAUTAL for Latin America – stylised approach). Tables of correspondence have for long been established between the three and make comparisons easier. The classifications of time-use activities are converging, and even countries using national classifications (US, Japan, Mexico for instance), are able to report indicators using ICATUS.
More problematic is the minimum (and maximum age) and the age groups in general, which widely vary from one country to another. While the UNSD guide 4 recommends 15 years old as the minimum age for data collection (and no maximum age), many countries use lower ages (6 to 12) and some HETUS countries add a maximum age limit of 74. This should not be an issue as long as the publications strive to display age groups allowing cross comparisons, which is rarely the case (for instance Latin American countries often use the 12–17 age group, which makes it difficult to compare with the 15–19 years old, common in other countries. Certainly, the availability of micro data can easily solve the question, but the common user will not be able to have access to this information. While the 5-year age groups (15–19, 20–24, 25–29, etc.) are of frequent use, rare are the publications that provide all 5-year age groups, and the variations are many for sub-groups: 15–19, 15–24, 15–29, 15–34, 15–59, 15–64, 15–74, 20–59, 20–64, 20–74. Flexible age groups for working age population (15–59 or 15–64; 20–59 or 20–64) or for reproductive age population (15–49) are not systematically released.
Another problematic area, at publication stage, is the categorization of the households in terms of composition: couples with children under 1, 5, 6, 7 years old; couples (or single persons) with children under 16, 17 years old; couples (or single persons) with children under 6 and children 7 to 17; couples without children. The volume of hours spent on caring heavily depends on such criteria.
Institutionalizing TUS within national statistical systems, ensuring gender statistics are fully integrated
We have already addressed the institutionalization of TUS when presenting the overall state of play: when the periodicity is determined and regular, one can say that the TUS is institutionalized and that resources are planned for dedication to TUS in due time.
Another perspective for institutionalizing TUS emerges from the choice between full and light diary approaches. Such choice does not entail a consecutive choice between a stand-alone and a modular survey. A full diary can be applied as a module of a multipurpose household survey (for instance in Benin or Tanzania) while a light diary can be applied in a stand-alone survey (for instance Japan applies a light diary since 1976, doubled with a full diary on a sub-sample since 2001). Consequently, the arguments in favor of a modular approach can be the interest in coupling time use data collection with income or wealth data collection (in an income and expenditure survey) or with labor and employment data collection (labor force surveys: this approach is privileged by ILO with its add-on light diary module), or with any other multipurpose household surveys (such as the living conditions surveys). While the stand-alone approach allows the collection of the variables selected for analysis, it is improbable that it succeeds in applying the more in-depth approaches of income and labor components by the specialised surveys. Especially in reference to the valuation of unpaid service work for extended accounts of household production or to the assessment of time poverty, it may be of high value to have the detailed income (or the detailed employment status) of the persons (and their households) and the use they make of their time in various activities, rather than relying on other independent (and often earlier or subsequent) surveys. It would make it easier to assign a market value to unpaid work and ensuring a more robust substitutability between money and time. Therefore, the modular approach can be a more effective way for fully integrating gender statistics.
Another proof of institutionalization is the place and room given to TUS on NSOs’ websites. Examples of well-buried TUS are many, especially when conducted on an irregular basis. TUS are household surveys and therefore should have an entry under this item where this entry exists. If they are modular, they should have their own entry, independently of the parent survey. Other and concomitant entries should be ‘living conditions’, ‘social statistics’, ‘gender’ ‘SDGs’. The entry (entries) should give access to press releases, main report, additional thematic reports, additional statistical tables, metadata and link to microdata. Moreover, the window displaying the table of main findings should absolutely be disaggregated by sex. Otherwise, which is not unusual in practice, it means that NSO has missed the point.
Last, but not least a proof of full integration of gender statistics is demonstrated by the way TUS findings are presented in reports and websites: TUS findings should not only dedicate a chapter or a section of the report to gender. All chapters should address gender and display sex-disaggregated tables. A TUS table presented in isolation for both sexes and not disaggregated by sex is of limited value.
Strengthening international cooperation and funding mechanisms for sustained data collection
Coordinated action is essential to strengthen national capacity for the regular collection and production of time-use statistics. This includes promoting the exchange of the latest standards and practices and fostering both North-South and South-South cooperation. In 2024, the United Nations Statistical Commission endorsed the revised Guide to Producing Statistics on Time Use 4 and requested the Statistics Division, together with partners, to support countries in its implementation. The Commission also emphasized the importance of working in collaboration with regional actors to ensure that the Guide remains nationally relevant and is effectively applied in diverse contexts.
Table 2 displays the funding partners of some recent TUS. It shows that international and bilateral institutions can cooperate on such matters, with a division of labor between coordination, technical, training, financial and dissemination support.
Stakeholders and sources of funding for recent TUS in various countries.
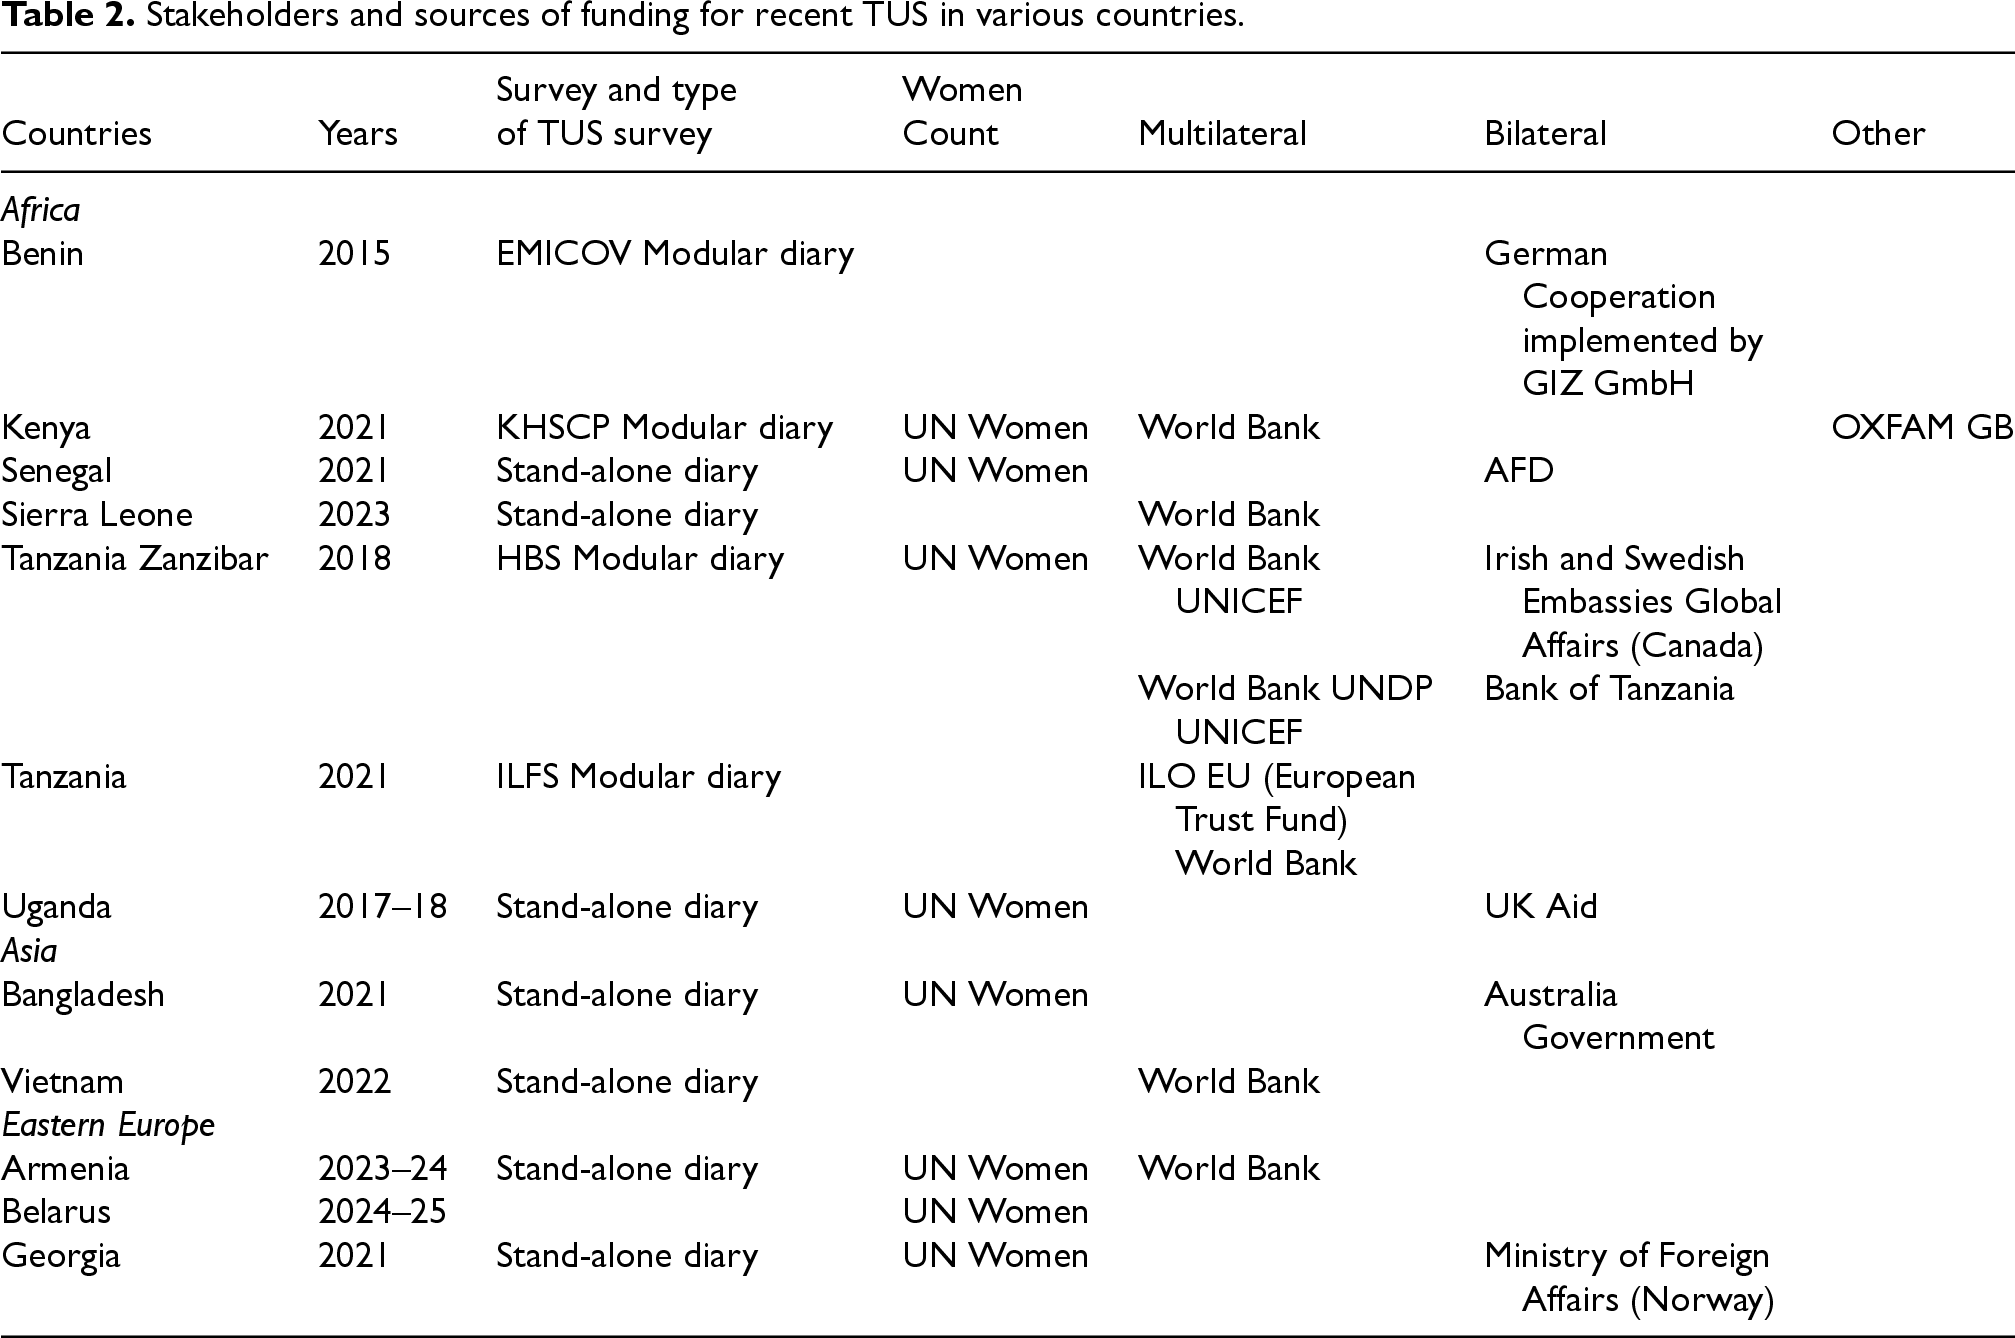
Stakeholders and sources of funding for recent TUS in various countries.
It is not rare to have cases where it is visible that TUS data have been analysed and published by non-gender sensitive experts and where the minimum set of indicators and basic tables are not made available.
Funding resources are necessary to ensure sustainability, but the training and involvement of local academics and scholars, the opportunities and incentives given to them to contribute to the analysis of data collected, and even to the conception of the survey at an early stage are guarantees for future sustainability. The ongoing availability of resources to international organisations to provide technical assistance at the scale required is crucial. Yet the resources dedicated to this within the International organisations system are incredibly limited and mostly donor driven.
We have seen that most TUS across the world and over time are based on diaries. Only a few countries in Latin America are using stylized questionnaires, with a large number of questions/activities that does not make this approach lighter than the diary approach. Diaries themselves can be full diaries or light diaries with a pre-coded list of 9 (the number of 1-digit activities in ICATUS) to 41 activities (ILO add-on diary) (ILO 2023
25
). Additionally, the
Short time slots from 10 to 30 min are operative, that allow the record of several activities (from 2 to 3), as well as simultaneous activities and the conventional contextual variables (with whom, for whom, where). A better account of supervisory care should deserve follow-up probing questions (International recommendations advise that information on supervisory care be collected through follow-up probing questions administered after the main diary is completed. This approach has been validated in pilot exercises. For further details, see Guide to Producing Statistics on Time Use ( 4 pp. 15–17).).
Diaries and stylized questionnaires can be administered in stand-alone surveys or as modules of on-going regular multi-purpose of specialised household surveys. A full diary perfectly fits with the modular approach as well as a light diary.
At the present stage of TUS progress, it seems that the light diary modular approach could allow pursuing the coverage of the countries that are still missing. The challenge is both to maintain the implementation of full-fledge diary TUS in the countries where they are regular and to support their repetition in newly involved countries for a periodicity of 5 or 10 years. The light diary module could then be used, not only to extend coverage to missing countries, but also to ensure the collection of TUS data between two full-fledged TUS.
Data collection approaches are evolving: the diary approach took the form of the left-behind paper diary left by the interviewer to be filled by the respondent in countries with high literacy rates. In other countries, the diary is filled by the interviewer and in most countries, the paper diary has been replaced by the computer assisted personal interview (CAPI). The implementation of some surveys during the COVID-19 pandemic led to move towards computer assisted telephone interview (CATI), in Georgia for instance.
Facing higher and higher non-response rates, TUS in high-income countries have adopted mixed modes of data collection: either the respondent has the choice between traditional paper questionnaires (PAPI), telephone interview (CATI) and on-line questionnaires CAWI (Computer assisted web interview), or the respondent may not have the choice and it can be a waterfall approach of web first, then telephone, then face-to-face. CAPI is now widely used in African contexts, and it can improve data quality via validity checks, save time on data entry and checking and shorten the time gap between data collection and reporting phase. But web-based and App-based surveys – which are interesting for prompting the respondents or directly measuring the time spent on ICT tools or social media - are still far from reach for these countries. Canada, Japan, Finland, UK, Australia have used this mode of data collection for their most recent TUS.
The use of technology is increasingly recognized as a critical element in the modernization of time-use statistics. Digital tools not only improve the efficiency and timeliness of data collection but also enhance data quality through built-in validation, automated processing, and the flexibility to adapt instruments to national contexts. Technology reduces reliance on paper-based, manual methods and facilitates broader reach, especially when integrated with multi-modal data collection strategies. For instance, smartphone and web-based diaries can streamline implementation while minimizing interviewer burden and associated costs.
The Minimum Harmonized Instrument for the Production of Time-Use Statistics encourages countries to leverage technology in their data collection. It is designed to allow the enabling or disabling of contextual variables depending on the activity being reported and includes integrated quality controls. The ILO light time module for its part is programed in CSPro. These features help reduce respondent burden and improve data accuracy. A pilot conducted in Italy using this approach showed that digital implementation achieved comparable data quality to traditional methods, with faster turnaround and lower costs. Countries are therefore encouraged to adopt modern, technology-enabled approaches to strengthen their time-use data systems.
Use of time use surveys and data
The care economy: Measuring and valuing unpaid work
Globally, time-use data consistently highlight the significant gender disparities in unpaid domestic and care work. Women and girls shoulder a disproportionate share of responsibilities such as childcare, elder care, household management, cooking, and cleaning—spending, on average, two and a half times more hours per day on these tasks than men (See SDG Global Database).
The recognition and valuation of unpaid care and domestic work are critical for advancing gender equality and sustainable development. Time-use data plays a central role in this process, providing essential evidence for monitoring progress toward Sustainable Development Goal (SDG) 5, particularly Target 5.4. This target calls on States to recognize and value unpaid care work through public services, infrastructure, and social protection policies, as well as through the promotion of shared responsibility within households. At the global level, SDG Indicator 5.4.1—the proportion of time spent on unpaid domestic and care work by sex, age, and location—serves as a key measure of gender disparities in unpaid work and supports policy interventions aimed at redistributing care responsibilities. Time-use data is indispensable for accurately measuring unpaid care work and tracking progress toward SDG Indicator 5.4.1. Beyond monitoring, it reveals opportunities for investment in the care economy, including public infrastructure and services that reduce or redistribute unpaid care work. By providing a detailed understanding of how time is allocated between paid and unpaid activities, TUS help policymakers identify gaps and design targeted interventions to ease the burden on women and girls.
Recognizing these disparities, several countries have leveraged time-use data to design and implement policies that promote a fairer distribution of care work. In Uruguay, for instance, time-use statistics informed the development of the Integrated National Care System (SNIC), which provides comprehensive care services and promotes co-responsibility in caregiving. Similar initiatives in Cambodia, Chile, Colombia, Costa Rica, Mexico, and Paraguay have used time-use data for promoting co-responsibility and a fairer distribution of care tasks within households as well as for informing care programs and policies.27,28 In some cases, time-use data has also influenced parental leave policies—leading to reforms such as the extension of paternity leave in Finland, Albania, and the Republic of Moldova. 28 In Korea, researchers have used time-use data to examine the links between care services29–31 and explain the determinants of female labor force participation, 32 human capital accumulation, and economic growth28,33,34
Additionally, time-use data support the development of alternative economic models that assess the social implications of economic policies. National time transfer accounts 35 and social matrices 34 for example, provide insights into how unpaid care work influences broader economic trends. Increasingly, time-use data is being incorporated into macroeconomic models to analyze the effects of public policies on employment, 36 poverty, 36 time allocation, 37 care redistribution38,39 and economic growth. 40 By integrating unpaid work into economic analyses, policymakers can better anticipate the trade-offs and long-term impacts of policy decisions.
Extended accounts of household production: Integrating unpaid work into economic indicators
Beyond informing policy, time-use data is essential for assessing the economic value of unpaid household services. Although unpaid domestic and care work is crucial for economic well-being, it remains excluded from conventional economic indicators such as Gross Domestic Product (GDP). Recognizing these contributions shifts the focus from purely market-driven valuations to a more holistic perspective that captures the full scope of human activity. By complementing standard economic measures, time-use statistics provide a more comprehensive understanding of social and economic dynamics, allowing for better-informed policy decisions and investment strategies.
Time-use data plays a critical role as an input for compiling accounts for unpaid household service work. 41 The recently endorsed System of National Accounts (SNA) 2025 further underscores the importance of time-use data. Successive updates to the SNA have aimed to better account for unpaid household service work, recognizing its significant contribution to economic well-being. 14 The 2025 revision builds on these efforts by refining the measurement of such activities within economic frameworks, ensuring a more comprehensive understanding of production within households. Acknowledging this volume of unpaid work is essential for more accurate economic assessments and policy development.
Going beyond GDP is not a new concern. Since their origins, the national accounts have removed – for excessive recourse to imputed values - the provision of unpaid services by the households for their own use whereas previous conceptions of work by the economists included it. Only the production of goods for own final use (including the collection of water and wood/fuel, as extractive goods) was maintained in the SNA production boundary. The 4th revision of the SNA in 1993 introduced the notion of satellite account but without mentioning household production and focusing on environmental accounts. 42 However, it encouraged experimental attempts in measuring unpaid household production, among other areas (such as health, education, tourism, social protection, etc.). Satellite accounts were meant to adopt a more extensive notion of production, but the results of these new measures were excluded from the central framework of the accounts. The 5th revision in 2008 was more explicit and qualified unpaid household production as a potential area for such an exercise. 13 It must be said that since the 1970s, the development of time use surveys in high income countries had provided data that made it possible to impute monetary values to the number of hours spent on unpaid work, giving rise to the first tentative estimates of unpaid labor inputs. The report by the Commission on the Measurement of Economic Performance and Social Progress (Stiglitz, Sen and Fitoussi 2009 43 ) recognized the importance of time-use measurement and recommended broadening income measure to non-market activities while showing methods and examples of such valuations. The 6th revision of SNA (2025 14 ) enshrines the said recommendation under the broader umbrella of well-being and enters in more details into the preparation of extended accounts of household unpaid service work (chapters 34 on ‘Measuring well-being’ and 35 on ‘Measuring the sustainability of well-being’, drafted by the Inter-Secretariat Working Group on National Accounts and endorsed by the Statistical Commission).
National experiences in compiling accounts of unpaid household work have been numerous, especially in Europe and led to the methodological guide prepared by UNECE (2017 44 ) based on previous works by EUROSTAT (Eurostat 2003, 45 Varjonen and Hamunen 1999 46 ; Varjonen et al. 2013 47 ). Encouraged by the Beijing Platform of Action, developing and emerging countries not only started conducting TUS but also used their findings for measuring the unpaid labor input in monetary terms and compare it with GDP measures. These efforts are often described as satellite accounts, though incomplete. To date, some 40 countries have made such estimates, but the number of countries that completed full extended accounts is lower. Imputing the occupational wage rate of a generalist (or specialist) worker as replacement cost for the hours spent on the various corresponding unpaid domestic and care services is the most common method requiring time-use and wage data. To go beyond the unpaid labor input estimates and complete the full extended account (through the production, the generation of earned income account and the extended supply and use table), data are required on detailed household expenditures including durables (for which related price indices for at least ten years are also necessary), from which can be derived the intermediate consumption entering into the household unpaid service work as well as the stock of capital, depreciation and return to capital.
The sponsorship of UN Women for conducting TUS in developing and emerging countries under the programe ‘Making Every Women and Girl count’ has further encouraged the compilation of extended accounts in countries such as Georgia, Bangladesh, Senegal, Morocco and Kenya. In Latin America, Mexico, Colombia, Ecuador, Peru and Argentina have established satellite accounts on several successive years.
Figure 3 displays the shares of unpaid service production as a share of GDP and extended GDP for 34 countries.
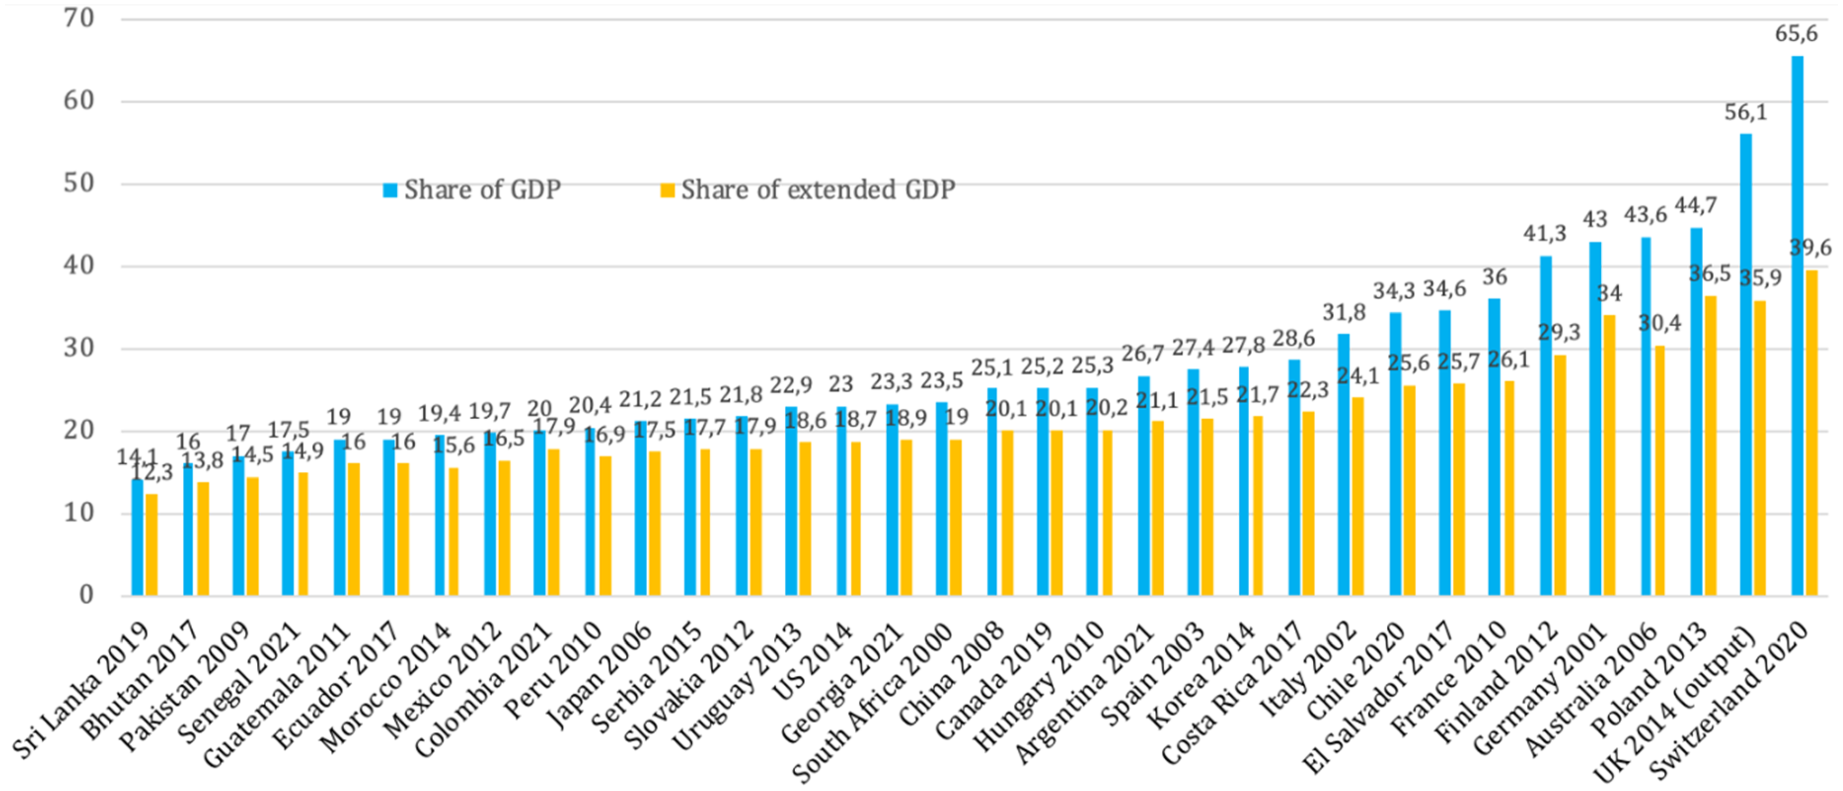
Share of unpaid service production in GDP and extended GDP (most recent year). Note: Except for UK, all estimates are based on the replacement cost method, and particularly the specialist wage rate (or the hybrid method specialist/generalist).
However, it should be stressed that many of the satellite account measures referred to in Figure 3 apply a very simple replacement cost approach that assumes that each hour of household work has the same value (a linear estimate). This is not entirely plausible. As estimates of monetary poverty lines suggest, there are limits to the extent to which time in household production can compensate for lower market income, and there are also limits to the extent to which money income can compensate for lack of time in family care and other forms of household consumption. The simple replacement cost approach, even when differentiating between the household various tasks by assigning various occupational wage rates, ignores the limits to substitutability that are implied by the discussion on time poverty in the next section.
The multiplication of national experiences should strengthen and harmonise the methodologies and pave the way towards full integration in the SNA central framework.
Traditional measures of poverty fail to identify the so-called “feminization of poverty” because they rely on household data that are difficult to individualize: income and expenditures are rarely individualized, whereas time is by definition a personal characteristic.
The first author who tentatively defined and measured time poverty is Vickery (1977 48 ) who compiled time thresholds in hours per week for various activities (food activities, house care, care of clothing, family care, marketing/management) and various types of households (two adults or one adult with 0, 1, 2–3, 4–5, 6 + children): thresholds range 31 h for one adult with 0 children to 74 h for two adults with 6 and more children. Then these thresholds are estimated in monetary terms and compared with the minima required to reach the poverty line. But the approach still remains at household level.
Bardasi and Wodon (2006 49 ) also define time poverty as the lack of time left for rest and leisure due to an excess of time spent at work (paid and unpaid) or to put it in another way: “individuals who are extremely pressed for time are not able to allocate sufficient time for important activities, and are therefore forced to make difficult trade-offs”. They calculate the time poverty gap on the model of the income poverty gap: “it represents the mean distance separating the population from the time poverty line, with the non-time poor being given a distance of zero. This measures the time deficit of the entire population, i.e., the amount of time that would be needed to shift all individuals who are time poor below a given time poverty line through perfectly targeted ‘time transfers’”.
The basic assumption lying behind the concept of time poverty is that women's higher burden (compared to men) in unpaid care work (in terms of number of hours in a day) prevents them to devote more hours (if any) to paid work and therefore maintains them in poverty as measured in monetary terms or in multidimensional terms. It also implies an impact of overwork (both paid and unpaid) on leisure and personal care, especially sleep and rest. A broader conception defines time poverty as the lack of time left for rest and leisure due to an excess of time spent at work (paid and unpaid).
Several main issues are to be solved: Define a threshold or time-poverty line: generally, it is a relative measure (fraction or multiple) of the median value of total individual working hours. How to measure poverty at individual level as well as at household level? A crucial issue is that it should not be allowed that the time deficit of an individual in the household be compensated by the time surplus of another individual of the same household. How to measure the levels (time poverty thresholds) at which the number of hours spent on unpaid work impacts the number of hours spent on paid work and the number of hours spent on personal care and/or leisure? How to take into account that paid work is not positive (or preferable to unpaid work) per se if it is performed under harsh conditions and for low pay, or at the detriment of well-being and health of other household members.
An interesting example of such research is the Levy Institute Measure of Time-Income Poverty (LIMTIP) that was applied to Argentina, Chile and Mexico (Zacharias 2011 50 ; Zacharias et al. 2012 51 ), and later, Türkiye. The model was further applied to Ethiopia, Ghana, South Africa and Tanzania (Table 3) (Zacharias et al. 2021 52 ).
Number of time-poor (millions) and share of time-poor with reduced time deficits (%), by sex, country and principle of distribution.

Number of time-poor (millions) and share of time-poor with reduced time deficits (%), by sex, country and principle of distribution.
Source: Table 5–4 in Zacharias et al. 2021.
Notes: The values reported in the table are for persons that were time-poor in the baseline. “Equal” refers to the scenario in which the total time required for household production (net of the contributions made by non-working age members of the household) is divided equally among the working-age members of the household; “Time Available” is the scenario of division according to the time available to the individual after setting aside, from the total time in a week (168 h), the time requirements of personal maintenance and actual time spent on employment; and “OC” represents division according to the actual or imputed hourly wage of the working-age person (all employed and non-employed persons).
Leveraging time-use surveys for gender-sensitive Indicators 53
To advance SDG 5.4 on unpaid domestic and care work, the United Nations recommends tracking the “Proportion of time spent on unpaid domestic and care work, by sex, age, and location.” Building on this, a range of gender-focused indicators have been proposed using time-use data. These aim to quantify disparities in daily life between women and men across activities such as unpaid work, paid employment, childcare, and leisure.
General indicator on gender differences in time use
This index evaluates overall differences in time allocation between women and men across all activities in a 24-h period. By comparing the proportion of time each sex devotes to different tasks, this measure provides a dissimilarity score ranging from 0 (perfect equality) to 1 (complete inequality). It serves as a useful metric for summarising gender disparities across the entire time-use spectrum.
Activity-specific inequality index
Some surveys may not account for the full 1440 min in a day. To address this, a modified index calculates disparities in time spent on specific activities. This gender inequality index ranges from −1 (activity done exclusively by men) to +1 (done exclusively by women), with 0 indicating parity. It is particularly helpful for analysing domestic and care work, disaggregated by specific tasks such as cooking, cleaning, and repairs.
Segregation index
Built on the task-level inequality indices, this index evaluates how activities under broader categories such as housework or childcare, are divided by gender. By weighting each task's inequality score according to its share of total activity time, the segregation index reflects whether tasks are shared equally or are stereotypically divided. A value close to 1 implies strong gender segregation within the activity.
Women-to-men ratio
This straightforward ratio compares the average time women spend on an activity to that of men. A value close to 1 signals parity, while higher values indicate that women bear a disproportionate load—especially relevant for unpaid domestic and care work. This ratio can be applied across various activities and disaggregated by subgroups, including age, parental status, and education level.
Figure 4 shows how the ratio for unpaid work changed over time in various regions.
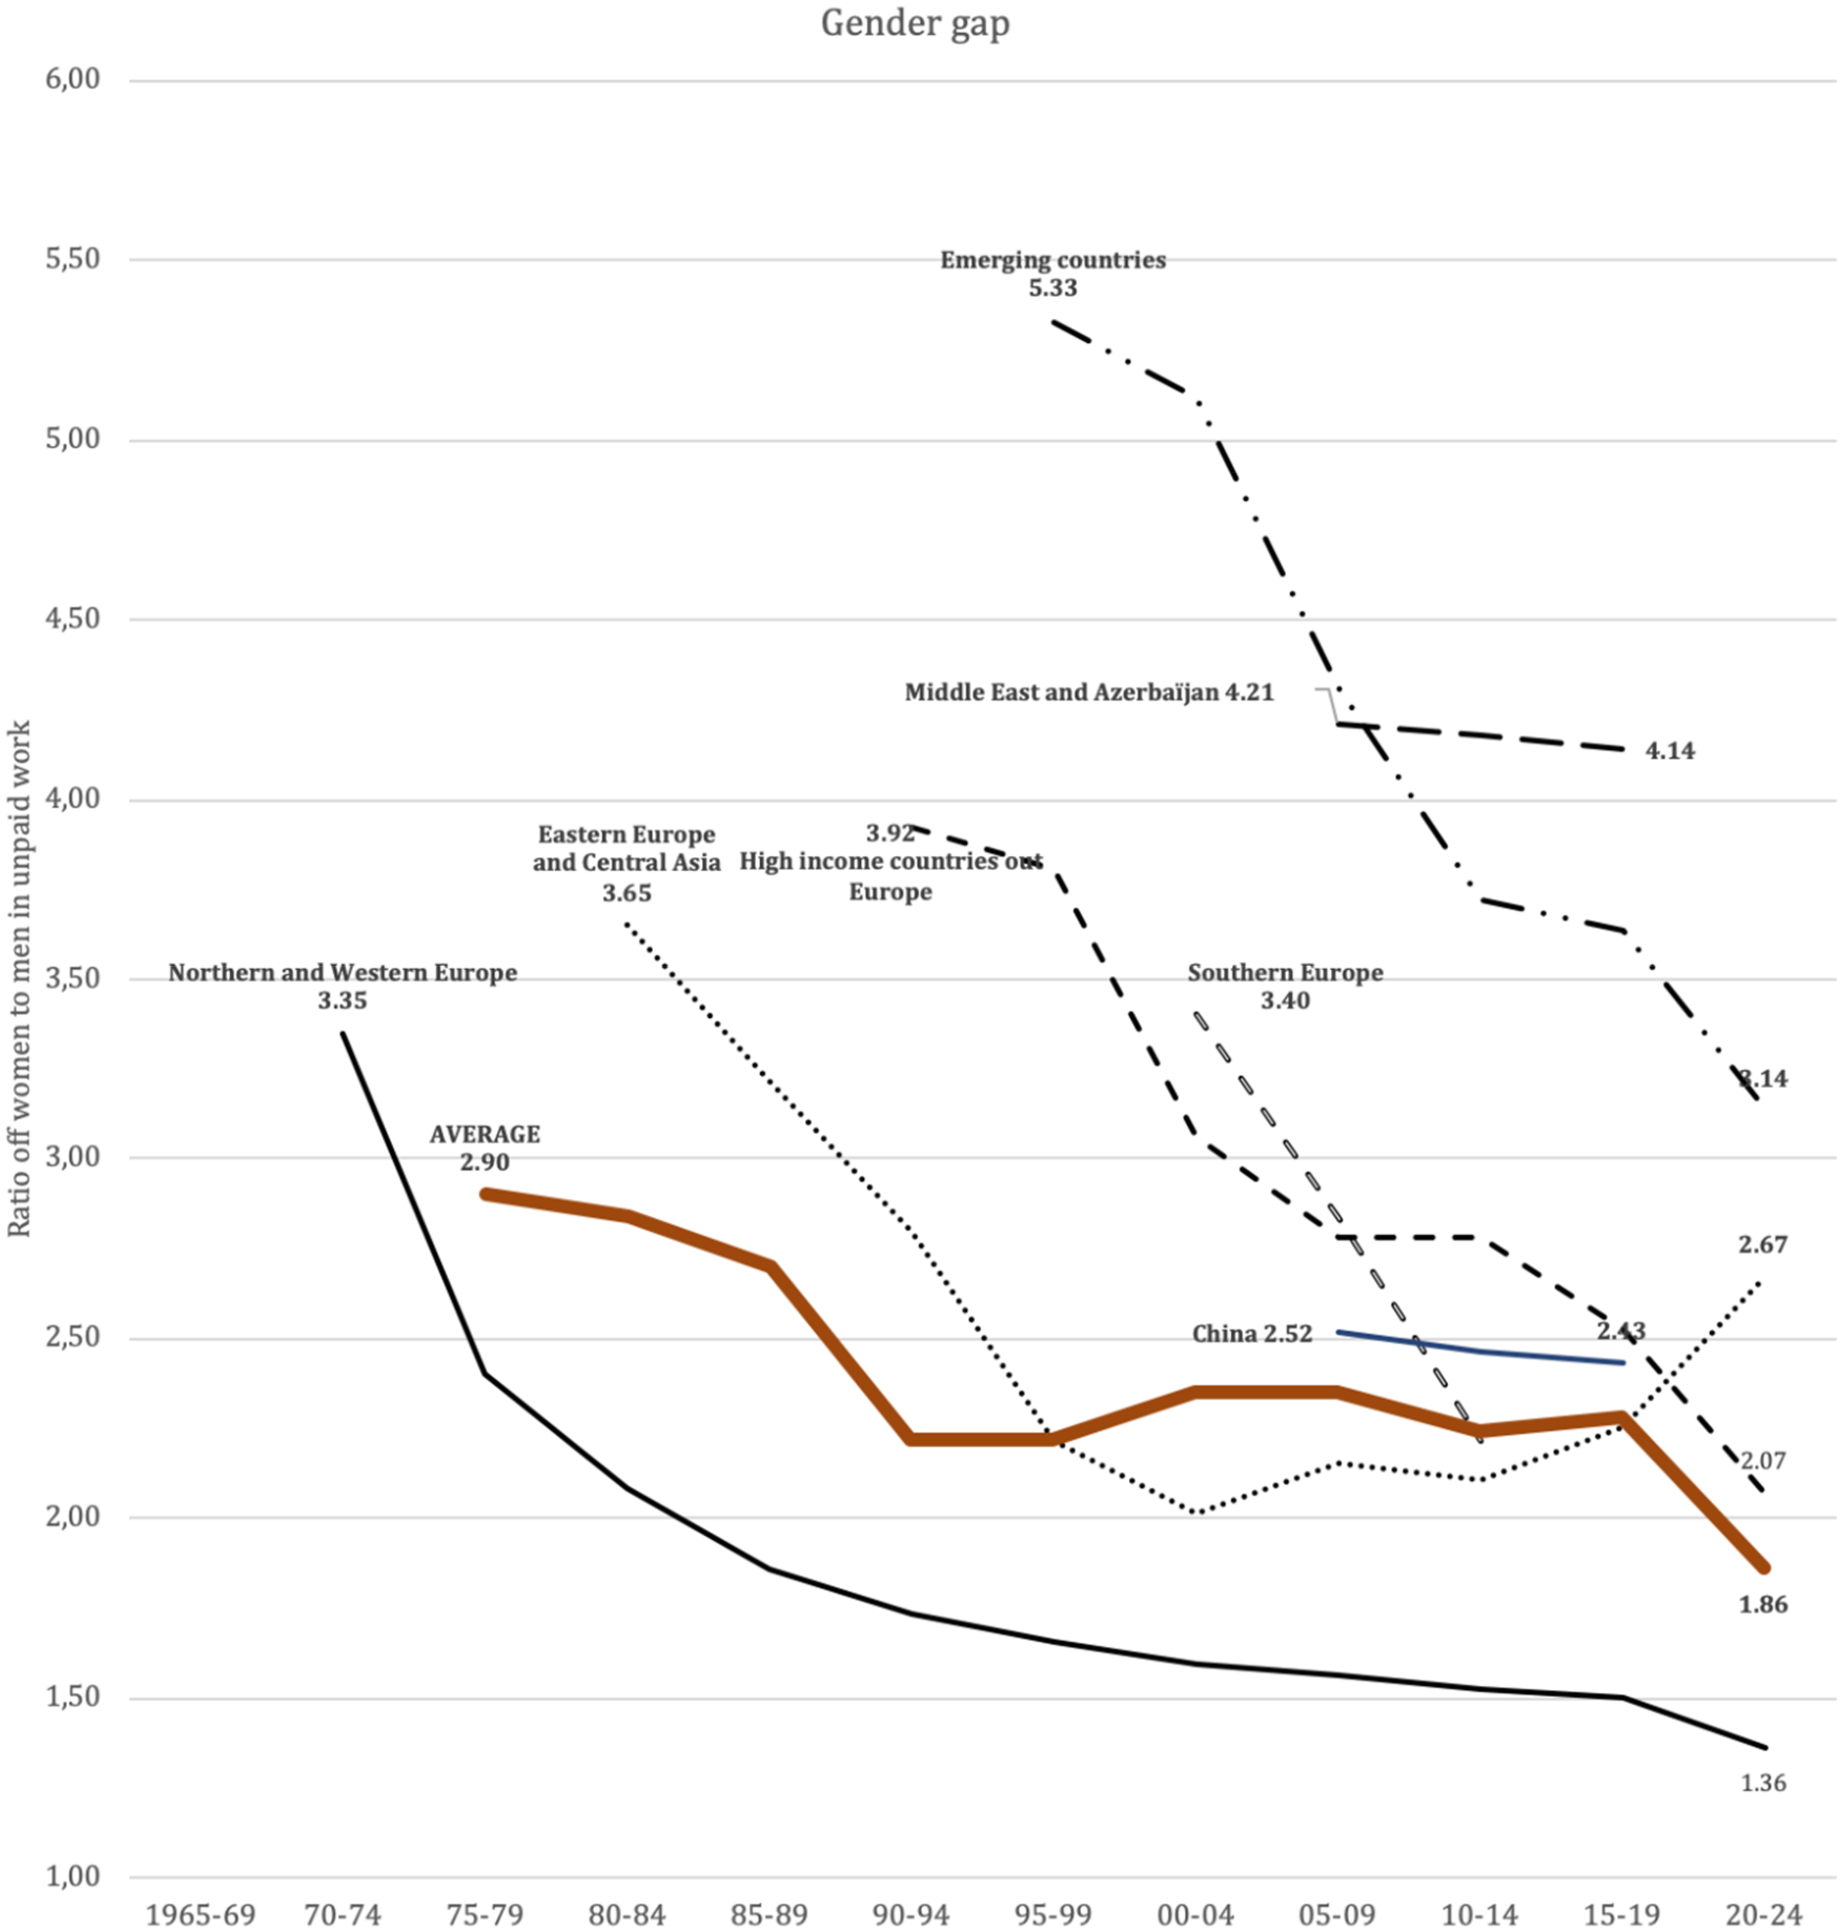
Trends of women to men ratio in unpaid work by region. Source: Charmes (2025 forthcoming). 54 Note: Unweighted averages.
This innovative measure captures the likelihood that a randomly chosen man will spend more time on a given activity than a randomly chosen woman. It factors in the entire distribution of time spent, not just averages, providing a more nuanced understanding of inequality. For example, even if averages appear similar, men may still “outperform” women due to skewed distributions.
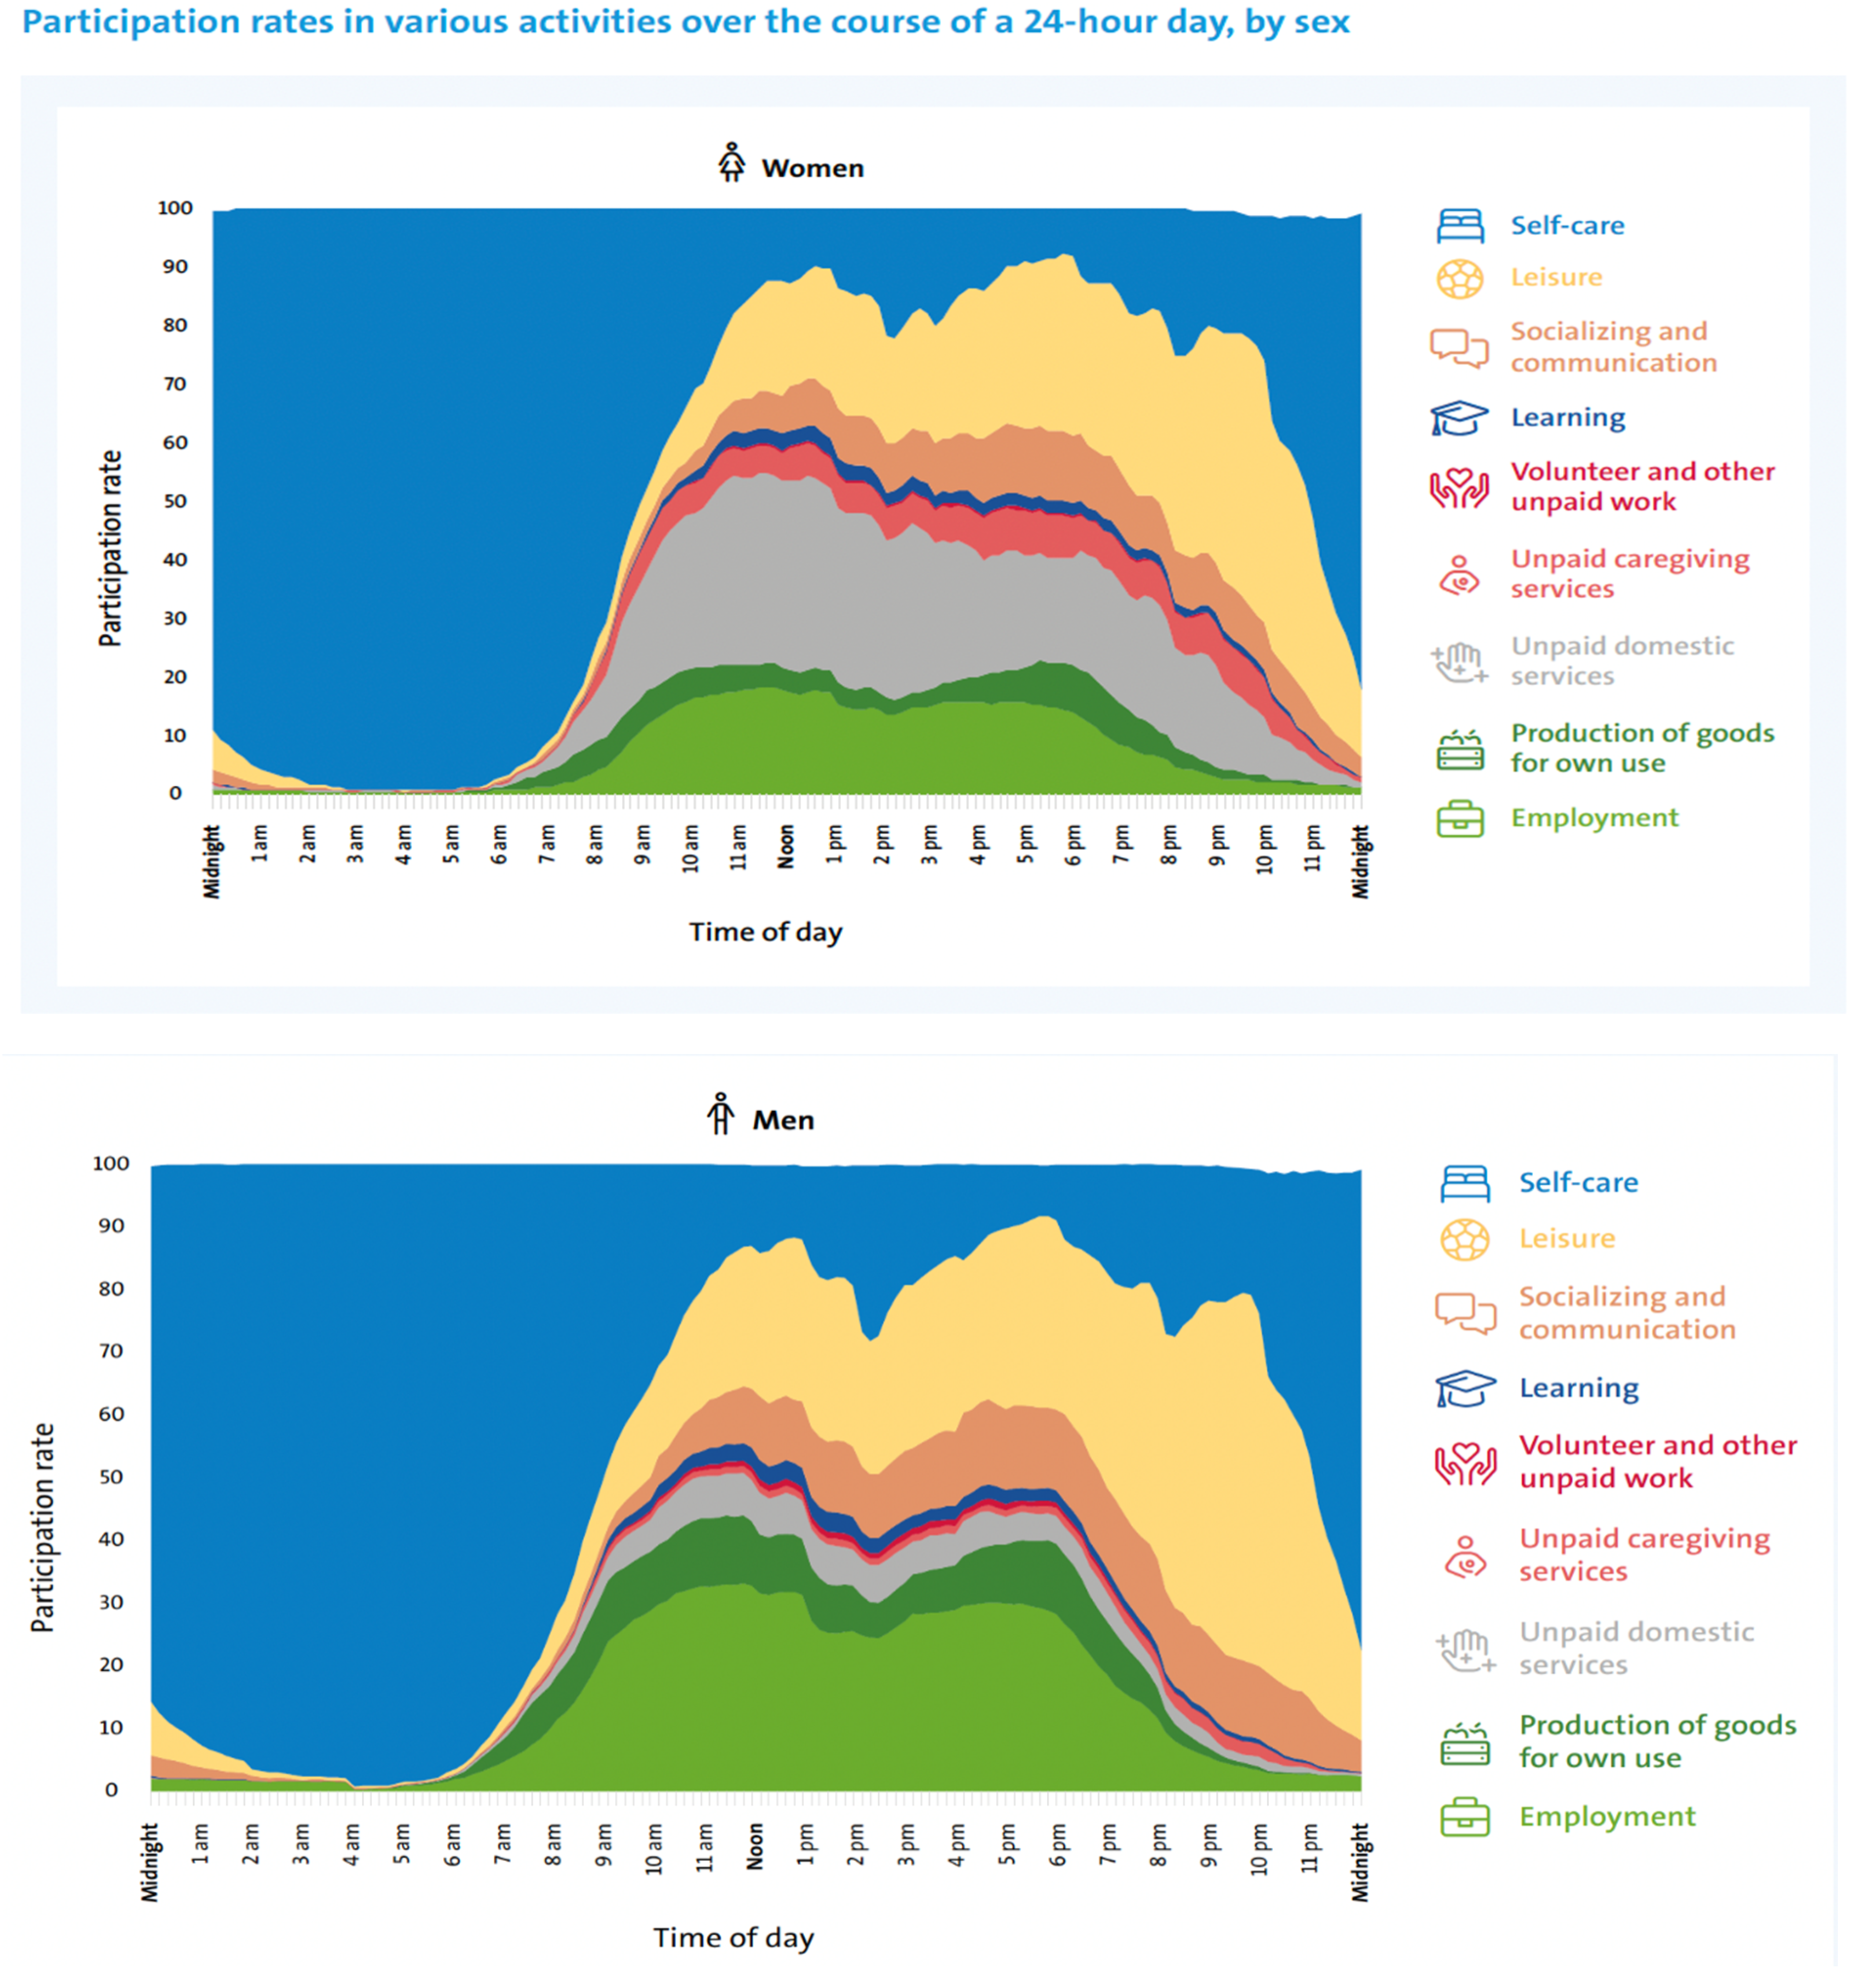
Tempo-graphs
Tempo-graphs visually depict the share of men and women engaged in different activities throughout the day. By highlighting distinct daily rhythms, they expose temporal inequalities such as how women's time is often fragmented due to multitasking in unpaid work and caregiving responsibilities (Figure 5).
Time poverty rate
Time poverty occurs when individuals have insufficient discretionary time after accounting for necessary tasks (personal care, paid/unpaid work, studies). A gender lens shows women are disproportionately time-poor due to the dual burden of work and caregiving. Calculated using a threshold (typically 60% of median available time), this indicator can be disaggregated by gender, occupation, or education level.
Home-based work and late work indicators
These indicators quantify the prevalence of working from home and working late hours. They reflect not only evolving labor trends but also gendered patterns in reconciling work with family responsibilities. Women may engage more in home-based work, while late work may signal job insecurity or inflexible roles. Data on copresence of children can also be particularly useful to demonstrate impact of family responsibilities.
Mode of transportation and simultaneity of activities
By analysing transport modes and the simultaneity of unpaid tasks (e.g., cooking while supervising children), researchers can capture time-use patterns that disproportionately affect women. These indicators also highlight the hidden burden of multitasking.
The importance of time-use data for the SDGs beyond gender equality
Time-use data are a critical yet often underutilized resource for monitoring progress across the SDGs. While widely recognized for tracking gender equality (SDG 5), they also provide insights into poverty reduction, health care, decent work, infrastructure, and environmental sustainability. 55 Integrating time-use data into national statistical systems strengthens evidence-based policymaking, ensuring development efforts address inequalities in time allocation and its impact on economic and social well-being.
Time-use data are essential for understanding and addressing
Time-use data also support policies to ensure
For measuring
Time-use data also illuminate how gendered roles affect
To improve access to
Investments in
In urban planning time-use data help assess how city transformations impact women and men differently. The lack of time-use data at subnational levels hinders gender mainstreaming in planning. Traditional urban planning often overlooks unpaid work that sustains daily life, fostering spatial segregation and an unsustainable urban model. By incorporating time-use analysis, cities can be designed to meet the needs of all inhabitants, promoting greater equality and equitable access to rights (
Time-use data also link social and environmental issues (SDG 13). They provide insights into individuals’ roles in climate change mitigation as caregivers, workers, and consumers. Studies show women, often primary caregivers, bear significant responsibilities in food production, natural resource management, and education, affecting sustainability efforts. 63 Additionally, time-use data have been used to analyze energy consumption and emissions in China, demonstrating their potential for informing environmental policies.
By integrating time-use data across the SDGs, policymakers can design more inclusive, effective strategies that address inequalities in time allocation, ensuring sustainable development benefits all.
The relevance of time-use data for measuring well-being
Well-being extends beyond economic prosperity, encompassing various dimensions of life that contribute to individual and societal quality of life. The recognition of well-being as a multidimensional concept has been reflected in policy frameworks such as Bhutan's Gross National Happiness (GNH) index, which prioritizes well-being over economic output and incorporates time-use as a key domain. 55 Similarly, the Stiglitz-Sen-Fitoussi Commission report has emphasized the need to shift the focus of measurement from economic production to well-being, identifying key dimensions such as material living standards, health, education, personal activities, governance, social connections, and environmental conditions. 43 Time-use data serves as a vital source of information for assessing many of these dimensions, offering insights into how individuals allocate their time and the impact of these choices on their overall well-being.
One of the strengths of time-use data is its universality. Unlike monetary measures, which vary in purchasing power across countries and demographic groups, time is an equal resource for all individuals—each person has 24 h in a day. This makes time-use data an objective and comparable measure for evaluating well-being across populations. By capturing how individuals distribute their time across different activities, TUS provide a nuanced understanding of quality of life beyond income or consumption levels.2,43,64
For example, individuals who spend most of their time engaged in employment or other productive activities may have limited opportunities for personal development, relaxation, or participation in leisure and cultural activities. Time-use data can highlight such imbalances and help policymakers identify areas where interventions are needed to improve well-being, whether through labor policies that promote work-life balance, investments in public infrastructure, or social programs that encourage participation in cultural and recreational activities. Additionally, TUS can collect information on the emotional experience associated with specific activities, providing further insight into well-being beyond mere time allocation.
Well-being is not only determined by how individuals allocate their time but also by their social connections and emotional support networks. TUS capture contextual information, 4 such as who individuals spend their time with, allowing for an analysis of social interactions. Research based on the American Time-Use Survey, for instance, has shown that older adults in the U.S. tend to spend significant amounts of time alone, 65 raising concerns about social isolation and its impact on mental and physical health.
By examining time spent on caregiving, socializing, and community participation, time-use data provides valuable insights into the role of social relationships in well-being. Understanding these patterns can inform policies aimed at fostering social cohesion, supporting caregivers, and addressing loneliness, particularly among vulnerable populations.
Time-use data is also a critical tool for public health research, offering insights into daily routines and behaviors that impact health outcomes. It provides information on physical activity levels, sedentary behavior, sleep patterns, and nutritional habits—factors that influence overall health and well-being.55,58,66 Studies using time-use data have helped identify risk factors for obesity,67–69 patterns of exposure to environmental hazards, and the trade-offs individuals make between different activities, such as prioritizing work over sufficient sleep or exercise.
Additionally, TUS capture the unpaid health-related work performed within households, such as caring for sick family members, managing medical appointments, and administering treatments. These activities, often invisible in economic statistics, place significant demands on individuals—especially women—and have implications for healthcare policies and system planning. The COVID-19 pandemic further highlighted the importance of recognizing and measuring these forms of unpaid care, as households became primary caregivers in the face of overwhelmed health systems.
Policy uses of time use data
This section uses information from 22 case studies undertaken by Data2X to track how well countries in recent decades have used TUS data to inform gender equality policies, which specific policies have been influenced, and which factors have facilitated the data-to-policy link. The studies cover 20 countries from different regions, levels of development and history of exposure to TUS data and distinguish direct and indirect effects on policy (The first set of 18 country case studies was published in 2018 (Floro ed. 2018 70 ). Four additional country case studies, including studies in Mongolia and South Korea that had been part of the first set, were published in 2024 (Buvinic, Floro and Ross 2024 11 ).). Data has direct effects when it has an instrumental role in defining, monitoring or evaluating public policies; it has an indirect effect when it shapes the understanding or conceptualization of policy issues or broadens “policy horizons” of policymakers and other relevant stakeholders but does not directly change policies (Lindquist 2001 71 ). These indirect changes, though more difficult to document, may have a longer-term impact on society when contrasted with a direct data impact on specific policies (Weiss 1999 72 ). Overall, there was some direct or indirect policy influence in 12 of the countries studied. The direct influence was sector-specific rather than cross-cutting and mostly circumscribed to influencing social policies; the indirect influence challenged traditional views on gender roles that undervalued women's economic contributions and the value of unpaid work, but in the short term it did not affect economic policies. Below is a more detailed description of the types of policy influence by country.
Direct policy influence
TUS data directly informed gender equality policies and national care and care-related policies. Albania, Mexico and South Korea were among the countries using TUS data to define, monitor or evaluate gender equality policies. Albania used the percentage of time women and men spend on unpaid work to monitor the 2016–2020 National Strategy and Action Plan for Gender Equality (Gardner 2018 73 ). Mexico used TUS data on the unequal gender distribution of unpaid care work to develop a 2013–2018 national Program for Gender Equality which called for increasing shared responsibilities within families and reducing families’ unpaid care burdens (Marquez 2018 74 ). South Korea used TUS data to inform the government's 2023–2027 3rd Gender Equality Basic Plan (Eun and Jun 2024 75 ).
Most countries with evidence of direct policy influence used TUS data to inform care policies and policies directed to children. Uruguay stands out as one of the first countries that used information from different time use studies, starting with a 2003 time use survey of metropolitan Montevideo conducted by academia, to provide the basic rationale for a comprehensive National Care Policy (2015) that codified the function of care under the law and underwrote facilities for childcare and eldercare (Bautista and Marquez 2018 76 ). Kenya, Mexico, Mongolia, and South Korea all followed approving national care policies using TUS data. Kenya is notable in showing a quick turnaround time on the data-to-policy link: results of the first time use survey available in 2023 informed a national care policy announced in 2024 (Muriithi and Mutegi 2024 77 ). Mongolia, where a domestic resource allocation to time use surveys is mandated by law (Mongolia's Law of Statistics), used this data to include care in a newly formed government coalition's policy agenda for the 2024–28 period. The prior direct influence of TUS data was very specific and narrow: an amendment to Mongolia's Labor Law in 2021 to include 10 days of paternity leave (Banzragch 2024 78 ). South Korea's 3rd and 4th Basic Plans for Low Fertility and Aging Society used TUS data to provide a strong rationale to set these plans’ policy directions towards enhanced family care and parental leave policies, expansion of public daycare centers and workplace childcare facilities, and reduced weekly paid hours for better work-life balance. Grandparents’ allowance policies adopted by local governments relied on TUS data to determine the size of allowances (Eun and Jun op. cit. 75 ).
Cambodia and Colombia used TUS data to define care-related policies for children. Data on time spent caring for children and the elderly influenced Cambodia's Policy on Alternative Care for Children (2006), which adopted minimum care standards, providing a baseline for residential and community-based childcare facilities (King 2018 79 ). Data from Colombia's 2013 TUS indicated that 9.7 percent of homes experienced barriers to accessing childcare for infants. This data point influenced the government's expansion of an early childhood development program (De Cero a Siempre) providing services to more than 1.5 million children (Marquez 2018 80 ).
Fewer countries used TUS data to inform labor market policies. Moldova used TUS data to justify, under the gender equality and the national employment strategies (for 2017–2021), innovative and flexible forms of employment for all and called for specific actions to increase women's labor force participation, including the provision of childcare centers in the workplace and the promotion of entrepreneurship (Gardner 2018 81 ). In Senegal, data from the first national TU survey that was published in 2022 was used by the women's ministry to shape three national programs: a childcare strategy, a family subsidy initiative, and a fund for women's entrepreneurship, all seeking to reduce women's domestic workload so that they could engage in paid work (Dramani 2024 82 ).
Finally, Finland exemplifies a country – the only one in the sample of 20 countries– where successive time use surveys were used to inform a range of different policies, including employment projects for rural women, early retirement policies, child and family policies, evaluation of cultural policies, planning of TV programming schedules, and evaluation of a tax reduction policy for families who hire domestic services. This cross-cutting use of TUS data across different sectors of the economy and society could partly be because different ministries and agencies across the government contributed funding TU survey data collection, increasing domestic ownership of TUS data (Gardner 2018 83 ).
Indirect policy influence
Some countries conduct and use time use surveys to increase information or knowledge about the economy or society rather than affect direct policies, at least in the short term. This information can change policymakers’ and the general public's views and beliefs (‘policy horizons’) and ultimately result in systemic policy changes. India, for instance, conducted the first time use survey of six states in 1998–99 to estimate and value unpaid work and better capture different forms of employment, given well-known limitations of labor force surveys in accurately recording the large proportion of informal workers in India's rural and urban economy. Although this information was in principle policy relevant, at the time the data exercise was meant to get a better understanding of labor markets rather than inform specific policies (Koolwal 2018 84 ).
Indirect policy influence can also be unplanned or unintended. The results of the Tanzania 2014 national time use survey were disseminated by the National Bureau of Statistics in collaboration with the Labor Ministry. Their release, showing that people (men) spent only 4 h daily engaged in economic activities, triggered a national conversation on work and idleness that was picked up by politicians who suggested placing restrictions on card games and alcohol sales during the daytime, and push back from brewery companies. No specific policies were enacted as a result, however (Ahmed 2018 85 ).
Example of a tempo graph: Georgia 2020–21. Source: GEOSTAT 2022. 86
TUS data has been used in a growing number of countries to calculate household production extended accounts and their contribution to GDP (section 3.3 above). In addition to providing novel information on the structure of the economy and the drivers of growth, household extended accounts can promote policy changes over time. For instance, Colombia evolved from using TUS data to create satellite accounts and influence mindsets to using the data to inform a national care policy. Colombian Law 1413 on the care economy issued in 2010 mandated conducting a standalone time-use survey (carried out in 2013) to build satellite accounts to value of unpaid work; these accounts served as the starting point for development of a care policy (Marquez op. cit. 80 ). In South Korea, the 2019 reported valuation of household labor at 490.9 trillion KRW became a significant topic during the 2022 local elections, justifying the establishment of a household labor allowance at the level of local governments (Eun and Jun op. cit. 75 ).
Whether the TUS data is demand- or supply-driven indicates the extent to which the data is likely to be used in public policies or programs. If TUS data is collected to fill gaps in official statistics, as it was in the case of Albania, for instance, their likelihood to influence public policy is reduced (Gardner op cit. 73 ). TUS data has become a key component of the statistical tool set of NSOs, alongside household surveys, labor force surveys, and budget and expenditure surveys. Completing the official set, rather than an immediate policy need, has sometimes driven the decision to implement a time use survey. Albania, however, used TUS data to inform its employment policy and monitor the National Strategy and Action Plan for Gender Equality (2016–2020), showing that motivations for data use can evolve over time.
Good dissemination of quality TUS data improves policy uptake. This entails disseminating easy to understand and easy to explain TUS data. In Moldova, the initial demand for a time use survey (conducted in 2011–2012) came from the Ministry of Labor, Social Protection and Family. The government made dissemination a high priority, producing a series of analytical briefs, with figures and clear explanations, as well as infographics that showed a clear link to policy. As a result, findings from the survey had a traceable impact on labor policy (Gardner op. cit. 73 ).
The UN Beijing Women's Conference and Platform for Action (1995) called for and validated the implementation of time use surveys for gender equality objectives across countries and regions, including Colombia, Kenya, Finland, Mexico, Mongolia, Senegal and South Korea. This external influence increased and legitimized demand for TUS data but for a direct link to policy, country governments need to appropriate or “own” this data and use it to shape national agendas or strategies.
Government ownership or buy-in matters. Demand and use by other actors (i.e., academia, civil society, external actors) is important, but more likely to have an indirect impact instead of directly influencing policy changes. Funding the time use survey or module indicates most directly government buy-in for the data, as it has been in the case of Finland, Mongolia and South Korea (Gardner op. cit. 83 ; Banzragch op. cit. 78 ; Eun and Jun op. cit. 75 ). Kenya stands out as the country where the government buy-in was at a highest government level (the Office of the President), but the scope of this buy-in must be expanded to other relevant government agencies and to external stakeholders, including academics (Muriithi and Mutegi op. cit. 77 ). Mongolia is a good example of how a more conducive political environment resulting from parliamentary elections opened possibilities for considering care policies and using TUS data to back up these policy proposals (Banzragch op. cit. 78 ).
This highlights the importance of engaging political and policy actors during the ‘specifying needs’ phase to ensure data relevance and ownership. However, according to the GSBPM framework, involvement of line ministries in the ‘designing’ and ‘analysis’ phases of producing official statistics is not always necessary and, in some cases, could potentially impact data quality or timeliness, while further analysis and collaborative dissemination efforts can effectively take place afterwards, fostering joint ownership without compromising the production process. However, TUS deserve some exceptionality in this regard, because of the relative lack of awareness about their contents and potential outcomes, not only on the part of users, but also on the part of producers.
The inclusion of line ministries in the design and analysis of time use surveys through formal working groups or other coordinating bodies helps build ownership of data and creates a seamless link between production and analysis of data and resulting policy (examples include Colombia, Moldova and Uruguay). The participation of local government bodies is also conducive to fostering the data-to-policy link, as the case of South Korea showed, especially when TUS data is disaggregated at the subnational level. Engaging lawmakers can serve as a medium to institutionalize and prioritize time use surveys. In Colombia and Mongolia, the codification of TUS data within the law (Colombia's Law 1413; Mongolia's Law of Statistics) helped ensure that resources are available on a regular basis to implement time use surveys (Marquez op. cit. 80 ; Banzragch op. cit. 78 ).
Alliances between NSOs and advocates in the government, academia and civil society have helped institutionalize TUS data production. For instance, the implementation of the TU survey in Kenya was the result of a collaboration between Kenya National Bureau of Statistics (KNBS), UN Women, CSOs and academic institutions in Kenya (Muriithi and Mutegi op. cit. 77 ).
Context-specific, locally relevant policy issues influence which among the many subjects TUS data covers are analyzed, disseminated, and picked up by policymakers and the public. For instance, in Cambodia, data from the first TUS module (included in the 2003 Socio-Economic Survey) provided information on child labor, a significant problem in Cambodia's post-war economy (King op. cit. 79 ). South Korea's huge demographic challenges—a rapidly ageing population and declining fertility rates— created an urgent need for policies to support work-life balance and data to inform these policies. The shift in public attitude on care provision from being primarily a family responsibility to being a shared responsibility between society (government) and family also mattered in South Korea (Eun and Jun op. cit. 75 ).
Lastly, an evidence-based culture nurtures the use of TUS data for policy. While research using TUS data may yield no immediate effects on policy, dialogue and consultation with CSOs and researchers and giving them access to time use data can set the stage for future TUS data use for policy analysis. The richness of TUS data-based research findings in countries like Finland, Mexico, Mongolia and South Korea that have a series of time use surveys repeated at regular intervals has contributed to the growth of an evidence-based culture in these countries (Gardner op. cit. 83 ; Marquez op. cit. 74 ; Banzragch op. cit. 78 ; Eun and Jun op. cit. 75 ).
Conclusion
TUS hold transformative potential in shaping gender-responsive and inclusive policies by illuminating how individuals, particularly women and marginalised groups, allocate their time across paid, unpaid, and care-related activities. By capturing this nuanced picture of daily life, TUS provide critical evidence to identify time poverty, gender gaps in unpaid care, and labor dynamics that are often invisible in traditional economic data. Time use data expands the range of activities that have economic value and offers a more comprehensive alternative to traditional measures of aggregate economic output. This information is essential for designing and monitoring equitable policies in areas such as overall wellbeing, social protection, labor rights, and public service provision as well as in areas linked to economic sectors and macroeconomic policy.
Time use surveys have had significant policy impact. Though, cost-benefit analysis of public policies cannot rely on TUS data: without knowing whether a household has access to water or electricity it is difficult to determine how such access affects unpaid workloads. Similarly, without access to information regarding utilization of public services such as child care and elder care, we can't determine their impact on the household level.
Despite their growing relevance, the regular implementation of TUS continues to face challenges. In many countries, particularly those with limited statistical capacity, TUS remain under-prioritised in national data systems due to competing demands, high costs, and reliance on external funding. Innovative approaches such as modular integration into ongoing household surveys and methodological simplification can help lower costs while maintaining data quality. Additionally, digital tools and community-based methods offer new opportunities for more frequent and inclusive data collection.
To fully realize the potential of TUS in informing evidence-based policymaking, continued investment, methodological innovation, and sustained policy engagement are essential. A particularly important dimension is the ability to cross-reference TUS data with other household survey data to be able to measure the impact of public policies and undertake cost-benefit analyses; for instance, information on whether a household has access to water or electricity is needed to determine how such access affects unpaid workloads. Similarly, access to information regarding utilization of public services such as childcare and eldercareis needed to determine their impact on the household level
While certain regions have made progress, such as through the decennial implementation of TUS under the Harmonised European Time Use Survey (HETUS), and regular integration in national budgets in countries like the United States, India, and Mexico, this progress is not universal. Shrinking international funding sources pose a risk to sustained data collection efforts. To address funding constraints while preserving the value of stand-alone TUS, integrating TUS modules into existing household surveys is increasingly considered a viable solution. But this approach does not guarantee the quality, frequency, or visibility required to influence policy. This modular approach is not limited to the ILO's light diary method; several countries have adapted both light and full diary formats within different survey frameworks to enhance flexibility and cost-effectiveness. In Japan, time-use data collection began in 1976 with a light diary module conducted every five years. Since 2001, a full diary has been added on a sub-sample, reflecting an effort to enrich the data rather than a shift toward the light approach. In Armenia, a full stand-alone TUS with a diary was conducted in 2024, while stylised questions on other forms of work such as production of goods for own use, provision of services for own use, and voluntary work were integrated into the quarterly labor force survey, in alignment with ICLS 2013 standards. These examples demonstrate how countries can tailor time-use data collection to their statistical priorities and capacities.
However, it is critical to secure stable financial commitments. This may involve fostering stronger partnerships with the World Bank and regional development banks, such as the African Development Bank, Asian Development Bank, and Inter-American Development Bank, which can offer support through lending programes. Bilateral agencies and international civil society organisations can also play a role, although their contributions have been less consistent. Moreover, policy engagement must be strengthened to ensure that the data produced is not only collected but also translated into meaningful action. By embedding time-use data into national planning, budgetary decisions, and gender equality strategies, governments can ensure that the lived realities of all individuals, particularly women and marginalised groups, are reflected in policy responses.
In addition to financial investment, innovation in methodology and survey design is key. Advancements such as the use of computer-assisted interviewing tools and modular survey designs can enhance efficiency and reduce costs. Sustained investments are needed not only to implement surveys but also to enhance the design, analysis, and dissemination of TUS data. National statistical offices require technical and financial support to build institutional capacity, develop harmonised methodologies, and strengthen the use of time-use data in national development planning. To maximise the impact of TUS, stronger collaboration between governments, international organisations, and civil society is essential. Technical support from UNSD and UN agencies such as UN Women and the ILO remains vital, particularly in the design, analysis, and dissemination stages. Their programes, offer essential guidance to national statistical offices, provided that sufficient funding is available to cover core data collection costs. In this regard the need for securing sustainable resources to this aim is particularly important. Such partnerships ensure that time-use data are effectively translated into actionable policies that address structural inequalities and promote inclusive development. By working together, stakeholders can harness the full potential of time-use data to drive evidence-based policies that advance gender equality and social justice.
Footnotes
Acknowledgements
The authors gratefully acknowledge the contributions of colleagues and institutions who supported the development of this paper. We extend our thanks to the national statistical offices and government agencies that provided access to time-use survey data, as well as to the international partners whose collaborative efforts have advanced the global time-use data agenda. We are especially grateful to the members of the UN Women Women Count programe, whose technical expertise and commitment to gender statistics have been instrumental in shaping the analysis. We wish to thank the Statistical Journal of the IAOS Editorial Team, led by Editor-in-Chief Pietro Gennari, the Guest Editors Papa Seck and Ginette Azcona, and the coordination of Asha Meager, for their guidance and support throughout the review process. We also thank the reviewers for their constructive feedback, which strengthened the quality and clarity of the final manuscript. Finally, we acknowledge the broader community of researchers, advocates, and policymakers working to expand and improve the use of time-use data for gender equality worldwide.
Funding
The authors received no financial support for the research, authorship, and/or publication of this article.
Declaration of conflicting interests
The authors declared no potential conflicts of interest with respect to the research, authorship, and/or publication of this article.