
Abstract
Indonesia's vast maritime sector plays a pivotal role in trade and economic growth but also contributes substantially to greenhouse gas (GHG) emissions from shipping activities. This study applies Automatic Identification System (AIS) data as a form of high-resolution, near-real-time transformative informatics to enable precise, vessel-level, and spatially explicit emission accounting that is fundamental to effective maritime governance. Using a bottom-up approach recommended by the International Maritime Organization, AIS data from 2022 were preprocessed from 369 million to 181 million valid records (49.17%) and used to estimate emissions of CO2, CH4, and N2O, resulting in a total of 38.86 million tons of CO2-equivalent (CO2e) emissions in Indonesian waters. Bulk carriers are identified as the largest contributors to CO2 and N2O emissions, while liquefied gas tankers dominate CH4 emissions; Heavy Fuel Oil (HFO) generates the highest CO2 and N2O emissions, whereas Liquefied Natural Gas (LNG) contributes most to CH4. Spatial benchmarking and comparisons with alternative approaches reveal both consistencies and uncertainties, highlighting the sensitivity of emission estimates to methodological assumptions, AIS coverage, and emission factors. Despite these limitations, the results demonstrate that AIS-based emission inventories provide critical spatial and temporal insights to support Indonesia's Blue Economy Roadmap, inform decarbonization strategies, and align maritime economic growth with climate commitments under SDG 13 and the Paris Agreement.
Introduction
As an archipelagic nation, Indonesia has significant maritime potential across various sectors, including the shipping industry. Shipping is vital in facilitating trade, economic activities, and human mobility. It connects the islands within Indonesia and links the country to other nations, enabling imports and exports that sustain the economy. 1 In 2022, more than 90 percent of Indonesia's trade was conducted via sea transportation.2,3 The value of imports entering Indonesia by sea increased by 24.93 percent, reaching US$215.795 billion from 2021 to 2022. 2 Meanwhile, export trade via sea transportation increased by 27.20 percent, reaching US$9.908 billion from 2021 to 2022. 3 These figures underscore the essential role of sea transportation in the Indonesian economy.
Beyond its national importance, Indonesian waters hold strategic international significance. Geographically, Indonesia lies along the equator between the continents of Asia and Australia and between the Pacific and Indian Oceans. Surrounded by neighboring countries such as Malaysia, Singapore, Brunei, the Philippines, Timor-Leste, and Papua New Guinea, 1 Indonesia occupies a central position in global maritime trade. This location makes its territorial waters an essential transportation corridor for both regional and global commerce. 4 One of the world's busiest trade routes—the Strait of Malacca—passes through Indonesian waters, serving as a major conduit for international trade between Asia and Europe.4,5
However, maritime activities also have considerable environmental implications. Ships, which primarily rely on fossil fuels, contribute significantly to greenhouse gas (GHG) emissions. 6 The amount of GHGs emitted depends on various factors, including fuel type, ship size, and voyage routes. Indonesia's dense maritime traffic exacerbates the volume of emissions produced by shipping activities. Globally, shipping accounted for approximately 2.6 percent of total GHG emissions in 2012, a share projected to increase to between 3.9 and 6.5 percent by 2050. 5 The International Maritime Organization (IMO) reported a 9.6 percent increase in GHG emissions from shipping between 2012 and 2018, indicating a continuous upward trend. 7
The Intergovernmental Panel on Climate Change (IPCC) emphasizes that GHG emissions from human activities have driven climate change, with global surface temperatures reaching 1.1°C above pre-industrial levels in 2011–2020. 8 International shipping and aviation are among the key contributors to this phenomenon. In response, global efforts to mitigate climate change have been formalized through the 2015 Paris Agreement, which aims to limit the increase in global temperature to well below 2°C, preferably to 1.5°C. 9 Indonesia ratified this commitment through Law No. 16 of 2016 concerning the Paris Agreement under the United Nations Framework Convention on Climate Change. Furthermore, the Sustainable Development Goals (SDG 13) emphasize the urgent need to combat climate change and its impacts. 10 Achieving SDG 13 targets requires significant contributions from the maritime sector, particularly through decarbonization and the development of green shipping. These efforts align with Indonesia's Blue Economy Roadmap, which includes action plans for promoting sustainable maritime transport, green ports, and low-carbon logistics to support the achievement of Net Zero Emissions. 5
Despite these commitments, Indonesia still faces challenges in establishing a comprehensive, real-time inventory of GHG emissions from shipping. National-level inventories currently rely on estimates derived from fuel consumption data, based on total fuel supply and remaining stocks. 11 This approach limits the ability to accurately attribute emissions to specific vessel activities or locations. To effectively support the monitoring of SDG 13, the Paris Agreement, and the Blue Economy roadmap, it is crucial to develop more detailed and dynamic GHG emission inventories.
From this perspective, accurate maritime emission accounting is not an end in itself but a necessary enabler for evidence-based policymaking, 12 including the implementation of Indonesia's Blue Economy Roadmap, the support of decarbonization strategies, and the decoupling of maritime economic growth from environmental degradation. Integrating real-time, spatially explicit data into emission assessments enhances policymakers’ capacity to align shipping activities with climate commitments under SDG 13 and the Paris Agreement, while maintaining Indonesia's role as a strategic global maritime hub.
Recent studies in information systems and big data analytics emphasize that accurate, high-resolution environmental data are fundamental to effective resource governance and sustainable transitions.13,14 Rather than serving merely as descriptive statistics, emission inventories function as critical informational infrastructures that enable fair allocation of responsibilities, evaluation of technological pathways, and evidence-based policy design. In complex sectors such as maritime transport—where economic growth, energy use, and environmental impacts are tightly interlinked—data-driven approaches are increasingly recognized as essential for managing trade-offs and guiding green investment decisions.
A critical step toward achieving this goal is to integrate real-time and spatially detailed data sources into emission assessments. The use of big data analytics offers an innovative approach to address these data limitations. 15 One promising data source in this context is the Automatic Identification System (AIS), a ship-tracking system originally designed to prevent maritime collisions. AIS transmits information on vessel identity, position, speed, and direction via terrestrial and satellite-based receivers. 16 The global availability of AIS data enables continuous, near-real-time monitoring of vessel movements across maritime regions.
While AIS was initially developed for navigational safety, its applications have expanded to numerous fields, including economic indicator development,17,18 fisheries monitoring,19,20 trade flow analysis,21,22 and calculating ship exhaust emissions,21,22 and calculating ship exhaust emissions.23–26 In this context, AIS-based big data analytics represent a form of transformative informatics by converting raw vessel movement signals into actionable environmental intelligence for governance purposes.
Given the above background, this study utilizes the potential of big data analytics to produce greenhouse gas (GHG) emission statistics generated from shipping activities. Specifically, it focuses on near-real-time shipping data derived from the Automatic Identification System (AIS), which enables the rapid compilation of maritime indicators. The study aims to develop an emission inventory from ship activities and evaluate the resulting estimates based on vessel type and fuel use distribution. These aspects are difficult to quantify using conventional inventory methods, but by leveraging AIS data, more comprehensive and spatially detailed emission statistics can be produced.
Furthermore, AIS represents a form of big data that provides both temporal and spatial information. Its utilization allows for a detailed examination of the distribution of GHG emissions across Indonesian waters. To date, no official or academic statistics have explored this potential in Indonesia, despite the crucial importance of estimating emissions from ships—one of the key contributors to climate change—to support sustainable maritime development.
However, it is important to recognize that the quality of real-time AIS data and its analysis is fundamental to ensuring the reliability of maritime emission assessments. Low-quality AIS data can undermine the accuracy of results and affect maritime management and decision-making processes. Common data issues include incomplete or inaccurate ship information, incorrect navigation status, missing Maritime Mobile Service Identity (MMSI) numbers, weak signal transmission, and limitations of coastal or onboard AIS equipment.27–29 Therefore, rigorous data preprocessing is essential to enhance data reliability and optimize the use of AIS for emission estimation.
This study applies a big data approach to estimate GHG emissions—specifically CO2, CH4, and N2O—resulting from shipping activities in 2022. By integrating AIS data preprocessing with established knowledge on emission estimation, the research analyzes shipping routes and examines the relationship between maritime traffic patterns and corresponding GHG outputs in Indonesian waters. Additionally, it investigates how different fuel types contribute to variations in CO2, CH4, and N2O emissions. Overall, the use of AIS data demonstrates strong potential for enhancing the accuracy and timeliness of ship emission assessments in Indonesia.
Types of greenhouse gas emissions from maritime activities in Indonesian waters
Greenhouse gases are atmospheric gases that can absorb and emit heat, leading to a warmer Earth's atmosphere.
30
Human activities produce four types of greenhouse gas emissions
31
: Carbon dioxide (CO2): This gas is produced by burning fossil fuels such as coal, natural gas, and oil. While carbon dioxide is released into the atmosphere, it can be absorbed by plants as part of the carbon cycle. Methane (CH4): Methane is released during the production and transport of coal, natural gas, and oil. In maritime activities, methane leakage can occur from ships using liquefied natural gas (LNG) as fuel. Nitrous oxide (N2O): These are synthetic substances produced by various industrial processes, including those used in refrigeration systems onboard ships. Fluorinated gases: These are synthetic substances produced by various industrial processes.
Typically, these greenhouse gas emissions are converted into a sum of CO2e (carbon dioxide equivalent) emissions, which are weighted based on their global warming potential. 32 This standardization allows for a consistent way to measure and compare the warming effects of different gases, such as methane and nitrous oxide, which have varying heat-trapping abilities and atmospheric lifespans. For example, one metric ton of methane can contribute to global warming as much as 21 metric tons of CO2 over 100 years. 32 The weighting factors used to convert these substances to CO2e are shown in Table 1.
CO2e weighting factors according to.
32
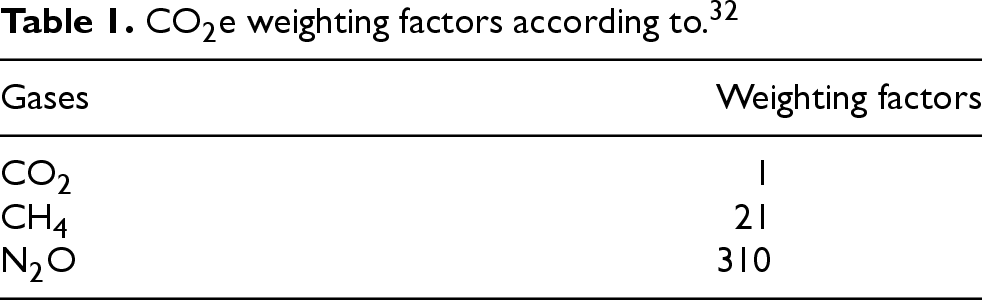
CO2e weighting factors according to. 32
Since 2000, global greenhouse gas emissions have steadily increased compared to previous years. However, due to the COVID-19 pandemic, economic activities slowed in 2020, leading to a temporary halt in the growth of greenhouse gas emissions, which then rose again in 2021.33,34
A similar trend was observed in Indonesia, where greenhouse gas emissions increased by 10% compared to 2021
34
The decrease in emissions in 2020 was also attributed to the pandemic. In 2022, greenhouse gas emissions in Indonesia were composed of 55.8% CO2, 36.5% CH4, 6.4% N2O, and 1.3% other gases.
34
The increase in maritime traffic and the use of fossil fuels in shipping routes contributed significantly to this rise in emissions
Different types of marine fuels have distinct chemical compositions and energy densities, leading to varying levels of greenhouse gas (GHG) emissions when combusted. The primary fuels used in the maritime industry include heavy fuel oil (HFO), marine diesel oil (MDO), and liquefied natural gas (LNG).
Heavy Fuel Oil (HFO) is the most commonly used fuel in large vessels due to its low cost. 35 However, HFO is also the most carbon-intensive, producing higher levels of CO2. 36 The high carbon content of HFO results in significant contributions to GHG emissions, making it a critical focus in efforts to reduce the maritime sector's environmental impact. In contrast, Marine Diesel Oil (MDO) are lighter, more refined fuels often used in smaller vessels or as a cleaner alternative in emission control areas (ECAs). 37
Liquefied Natural Gas (LNG) is increasingly being adopted as a marine fuel due to its lower carbon content. A 2016 study found that LNG is a viable fuel for shipping, with the lowest emissions.38,39 LNG combustion results in substantially lower CO2 emissions and virtually eliminates SOx and particulate matter emissions. However, LNG can still contribute to GHG emissions through methane slip—a phenomenon where unburned methane, a potent greenhouse gas, is released into the atmosphere.40,41 LNG is often used in newer, more environmentally conscious vessels, including some container ships and cruise ships.
Materials and methods
Data collection
Estimating greenhouse gas (GHG) emissions from shipping activities requires detailed information on ship movements from AIS data. However, the AIS data do not have information about the ship's carrying capacity (i.e., deadweight tonnage) and maximum draft which is crucial in this research. To fill this gap, we use ship registry databases from FleetMon and IHS Markit (the latter is available from the UNGP), with information for around 38,000 vessels. This study combines three key data sources: AIS data to track ship movements, ship register data for technical specifications, and multipliers from the Fourth IMO Greenhouse Gas Study to estimate emissions.
AIS data, accessed through the United Nations Global Platform (UNGP) via id.officialstatistics.org, is provided by ExactEarth and covers ships crossing Indonesian waters from January 1, 2022, to December 31, 2022. The boundaries of Indonesian waters are defined by the Exclusive Economic Zone (EEZ), obtained from marineregions.org. The Indonesian EEZ is depicted as a polygon between latitudes −13.9421° to 7.7833° and longitudes 92.0506° to 141.4°. To capture AIS messages for ships entering or exiting Indonesian waters, the EEZ boundary was extended by 1° degrees in both latitude and longitude as shown in Figure 1. The buffer zone allows us to monitor vessels that are exiting the Indonesian zone, filter out these instances, and identify genuine anomalies in message transmission. Additionally, ship register data provided by IHS (Information Handling Services) Markit through the UNGP platform offers detailed ship specifications necessary for the analysis. The Fourth IMO Greenhouse Gas Study (IMO GHG 4) report supplies emission factors and other essential parameters for estimating greenhouse gas emissions from shipping activities.
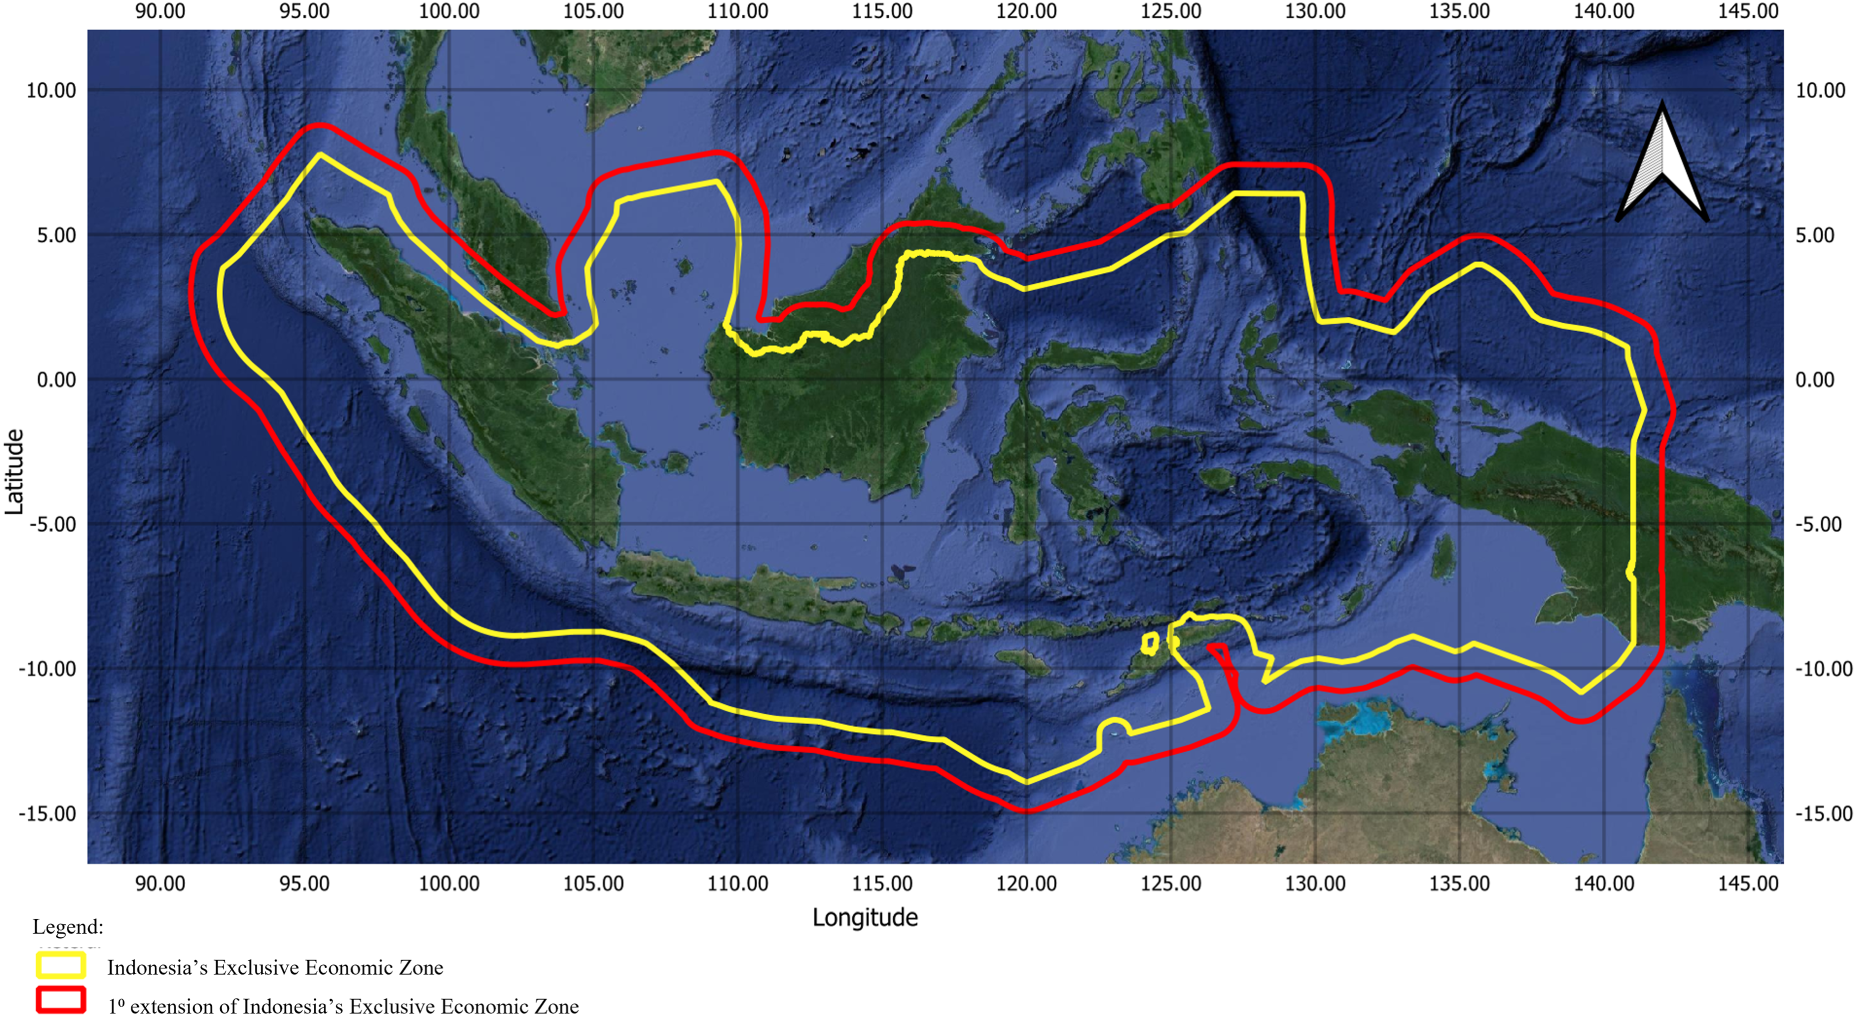
Study area of Indonesia's exclusive economic zone. The yellow line represents Indonesia's Exclusive Economic Zone, while the red line indicates the 1° extension of the zone.
AIS and IHS data are extracted using the ais-tt kernel developed by the AIS Task Team. To accurately identify the entry and exit routes of ships from Indonesian waters, the boundaries of the Indonesian Exclusive Economic Zone (EEZ) are expanded by 1° in both longitude and latitude to capture incoming or outgoing AIS messages. The UNGP platform also grants access to ship register data from IHS Markit, which provides detailed ship information critical to this study. Additionally, the IMO GHG 4 report offers valuable emission factors and parameters essential for estimating greenhouse gas emissions from shipping activities. The data sources and preprocessing methods used in this study are detailed in Figure 2.

Data input, tools, and preprocessing method.
AIS data preprocessing
AIS data is one of the big data sources whose quality needs to be ensured. Several previous studies have discussed the quality and vulnerability of AIS data to various errors.27,29,42 To understand the preprocessing techniques required, it is essential to first understand the behavior of both AIS devices and their users. Therefore, a discussion was conducted with PT. ASDP Pelabuhan Merak as one of the AIS device users in its shipping operations. In addition, discussions were also held with researchers and other AIS data users, including the AIS Task Team of the United Nations and the Asian Development Bank. Based on the literature and in-depth discussions with various stakeholders, the preprocessing stage can be described as follows: Duplicate Messages Removal: AIS data often contains duplicate messages, which are removed to retain only unique AIS messages for analysis.
29
Merging AIS and IHS Data: The AIS data includes static fields like IMO and MMSI, which may have inaccuracies.
27
The IMO number is a unique ship identifier, but it is often missing in AIS data. To address this, MMSI, in conjunction with the ship name, is used to match AIS data with IHS data using cosine similarity. This merging process also integrates critical vessel attributes available in the IHS database but absent from AIS data, including fuel type and engine characteristics, which are essential inputs for emission calculations. Voyage Duration Calculation: Voyage duration is calculated by subtracting the timestamp of the previous AIS message from the current one. Removal of Non-Relevant AIS Messages: AIS messages where ships are detected sailing outside the Indonesian EEZ are excluded from the analysis. Vessel activity is considered to resume only once the ship re-enters the Indonesian EEZ. Handling Noise and Default Entries: Default values and outliers in variables like draught and SOG are corrected using design values from IHS data or filled using nearest neighbors’ data. Inactive Ship Messages Removal: Ships with less than 10 recorded messages in a year or fewer than 20 messages with SOG > 3 knots are considered inactive, and their AIS messages are needed to be removed from the analysis.
7
Removal of > 4 h voyage duration: Discussions with PT. ASDP Pelabuhan Merak revealed that AIS devices are often intentionally turned off by ship crews for certain reasons. However, under normal conditions, the AIS transceiver is usually reactivated within approximately two hours due to periodic AIS signal checks. We analyzed the AIS signal data received at Merak Port and identified an average message gap of 3.24 h. Nevertheless, this voyage was still considered reasonable based on the discussion with PT. ASDP, with the signal gap likely caused by transmission errors or data collection issues. Therefore, considering the tolerable duration identified through prior discussions and supported by similar studies, AIS messages with transmission gaps exceeding four hours from the previous message were excluded from the analysis, consistent with the approach adopted by Chen et al.
28
Ship technical specification data preprocessing
Classification of ships into 19 ship classes and their capacity bins according to IMO GHG 4. There are 19 types of ships defined in IMO GHG 4 along with their size categories. The level of presentation of ship types by AIS, IHS, and IMO GHG 4 data is different. For comparability with AIS data, the 19 ship types are categorized into ship types with a higher level.
42
The types of ships include: Cargo: bulk carrier, container, general cargo, refrigerated bulk, Ro-Ro, dan vehicle Fishing: miscellaneous-fishing Non-merchant ships: yacht Others: miscellaneous-other Passenger: ferry-pax only, cruise, ferry-ropax Tanker: Chemical tanker, liquified gas tanker, Oil tanker, other liquids tanker Work Vessel (Non-fishing): service-tug, offshore, service-other
Several variables included in the IHS data contain missing values. The variables that need to be considered are ME power (main engine power), ME rpm (main engine rotation speed), ship speed, maximum ship speed, design draught, and maximum power. This missing value includes a null or 0 value. The missing value contained in each variable is filled with the average value according to the type of ship and its capacity-bin.
Greenhouse gas emission estimation with AIS data
This study employs a bottom-up method for calculating emissions, adhering to the guidelines set by the fourth IMO greenhouse gas study (IMO GHG 4) published in 2020. According to the IMO GHG 4 report, greenhouse gas emissions can be estimated based on the type of pollutant emitted. Generally, emissions from ships are the cumulative result of the main engine (ME), auxiliary engine (AE), and auxiliary boiler (AB). The estimation of these emissions follows two primary approaches: the energy-based approach for methane (CH4) and nitrous oxide (N2O), and the fuel-based approach for carbon dioxide (CO2). The process of estimating ship emissions involves the following stages: Energy-based Approach (CH4 dan N2O)
Based on the IMO GHG 4 publication, the formula for calculating energy-based emissions is as follows
7
:
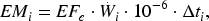
The energy consumption of AE and AB (
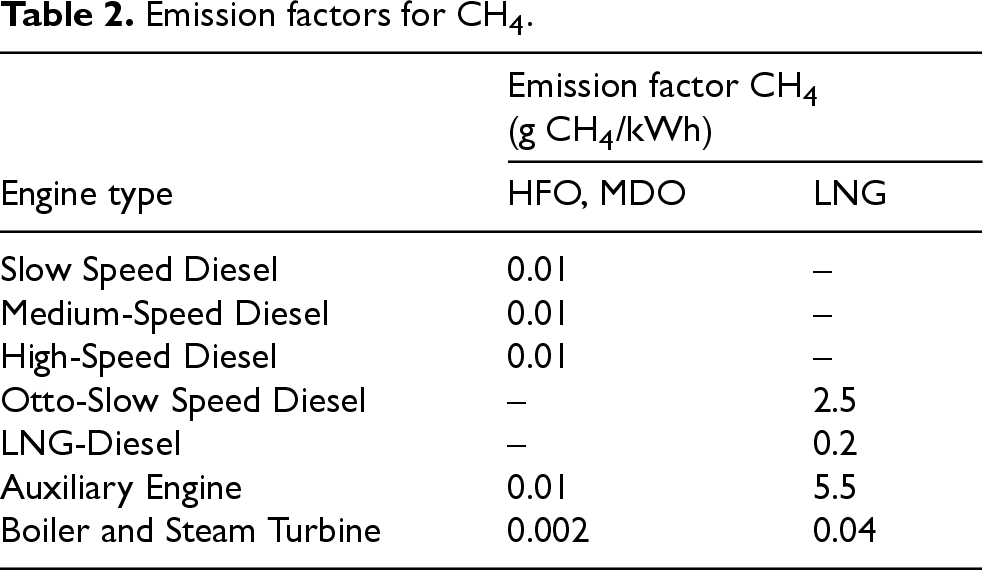
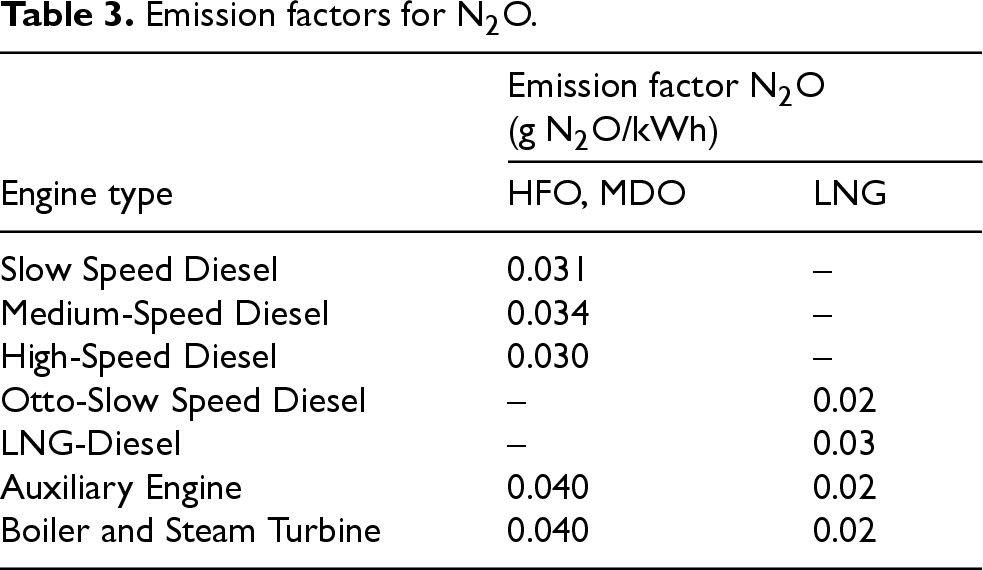
Emission factors for CH4 and N2O are assumed to vary by engine type and fuel type, following the guidelines provided in the IMO Fourth GHG Study (IMO GHG 4). Table 2 and Table 3 show emission factors per engine type and fuel on CH4 and N2O emission.
Fuel-based Approach (CO2)
Emission factors for CH4.
Emission factors for N2O.
Based on the IMO GHG 4 publication, the formula for calculating fuel-based emissions is as follows
7
:

where
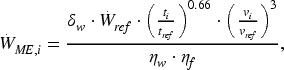
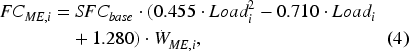
Fuel consumption for ME engines is calculated using the following formula
7
:
Fuel consumption for auxiliary engines (AE) and the boiler (AB) does not depend on the load. Therefore, their fuel consumption is determined solely by the power requirements and

CO2 emission factors are primarily fuel-specific and were therefore applied based on the fuel type associated with each vessel, following the guidelines of the IMO Fourth GHG Study, as shown in Table 4.
Emission factors for CO2.

AIS data preprocessing result and ship specification's overview
AIS data was extracted from the UNGP-AIS platform for the period from January 1, 2022, to December 31, 2022, with a focus on vessels operating within the Indonesian Exclusive Economic Zone. After preprocessing, 181,581,085 AIS messages remained for analysis. A summary of these preprocessing results is provided in Table 5.
Preprocessing results.

Preprocessing results.
AIS data offers advantages over official statistics as it can be refined based on specific criteria, such as ship types, fuel types, and shipping activities. Figure 3. illustrates the number of ships categorized by their type operating in Indonesian waters. The count of AIS ships is derived from the number of AIS messages associated with a unique IMO number, as the IMO number is a distinctive identifier for each ship. According to Figure 3, there are 771 fishing ships identified by a unique IMO number operating in Indonesian waters in 2022. This figure aligns with Regulation of the Minister of Transportation of the Republic of Indonesia Number PM 18 of 2022, which mandates that fishing vessels over 60 GT must have an active AIS. In contrast, the Ministry of Marine Affairs and Fisheries reports 5,342 fishing vessels over 50 GT. 43
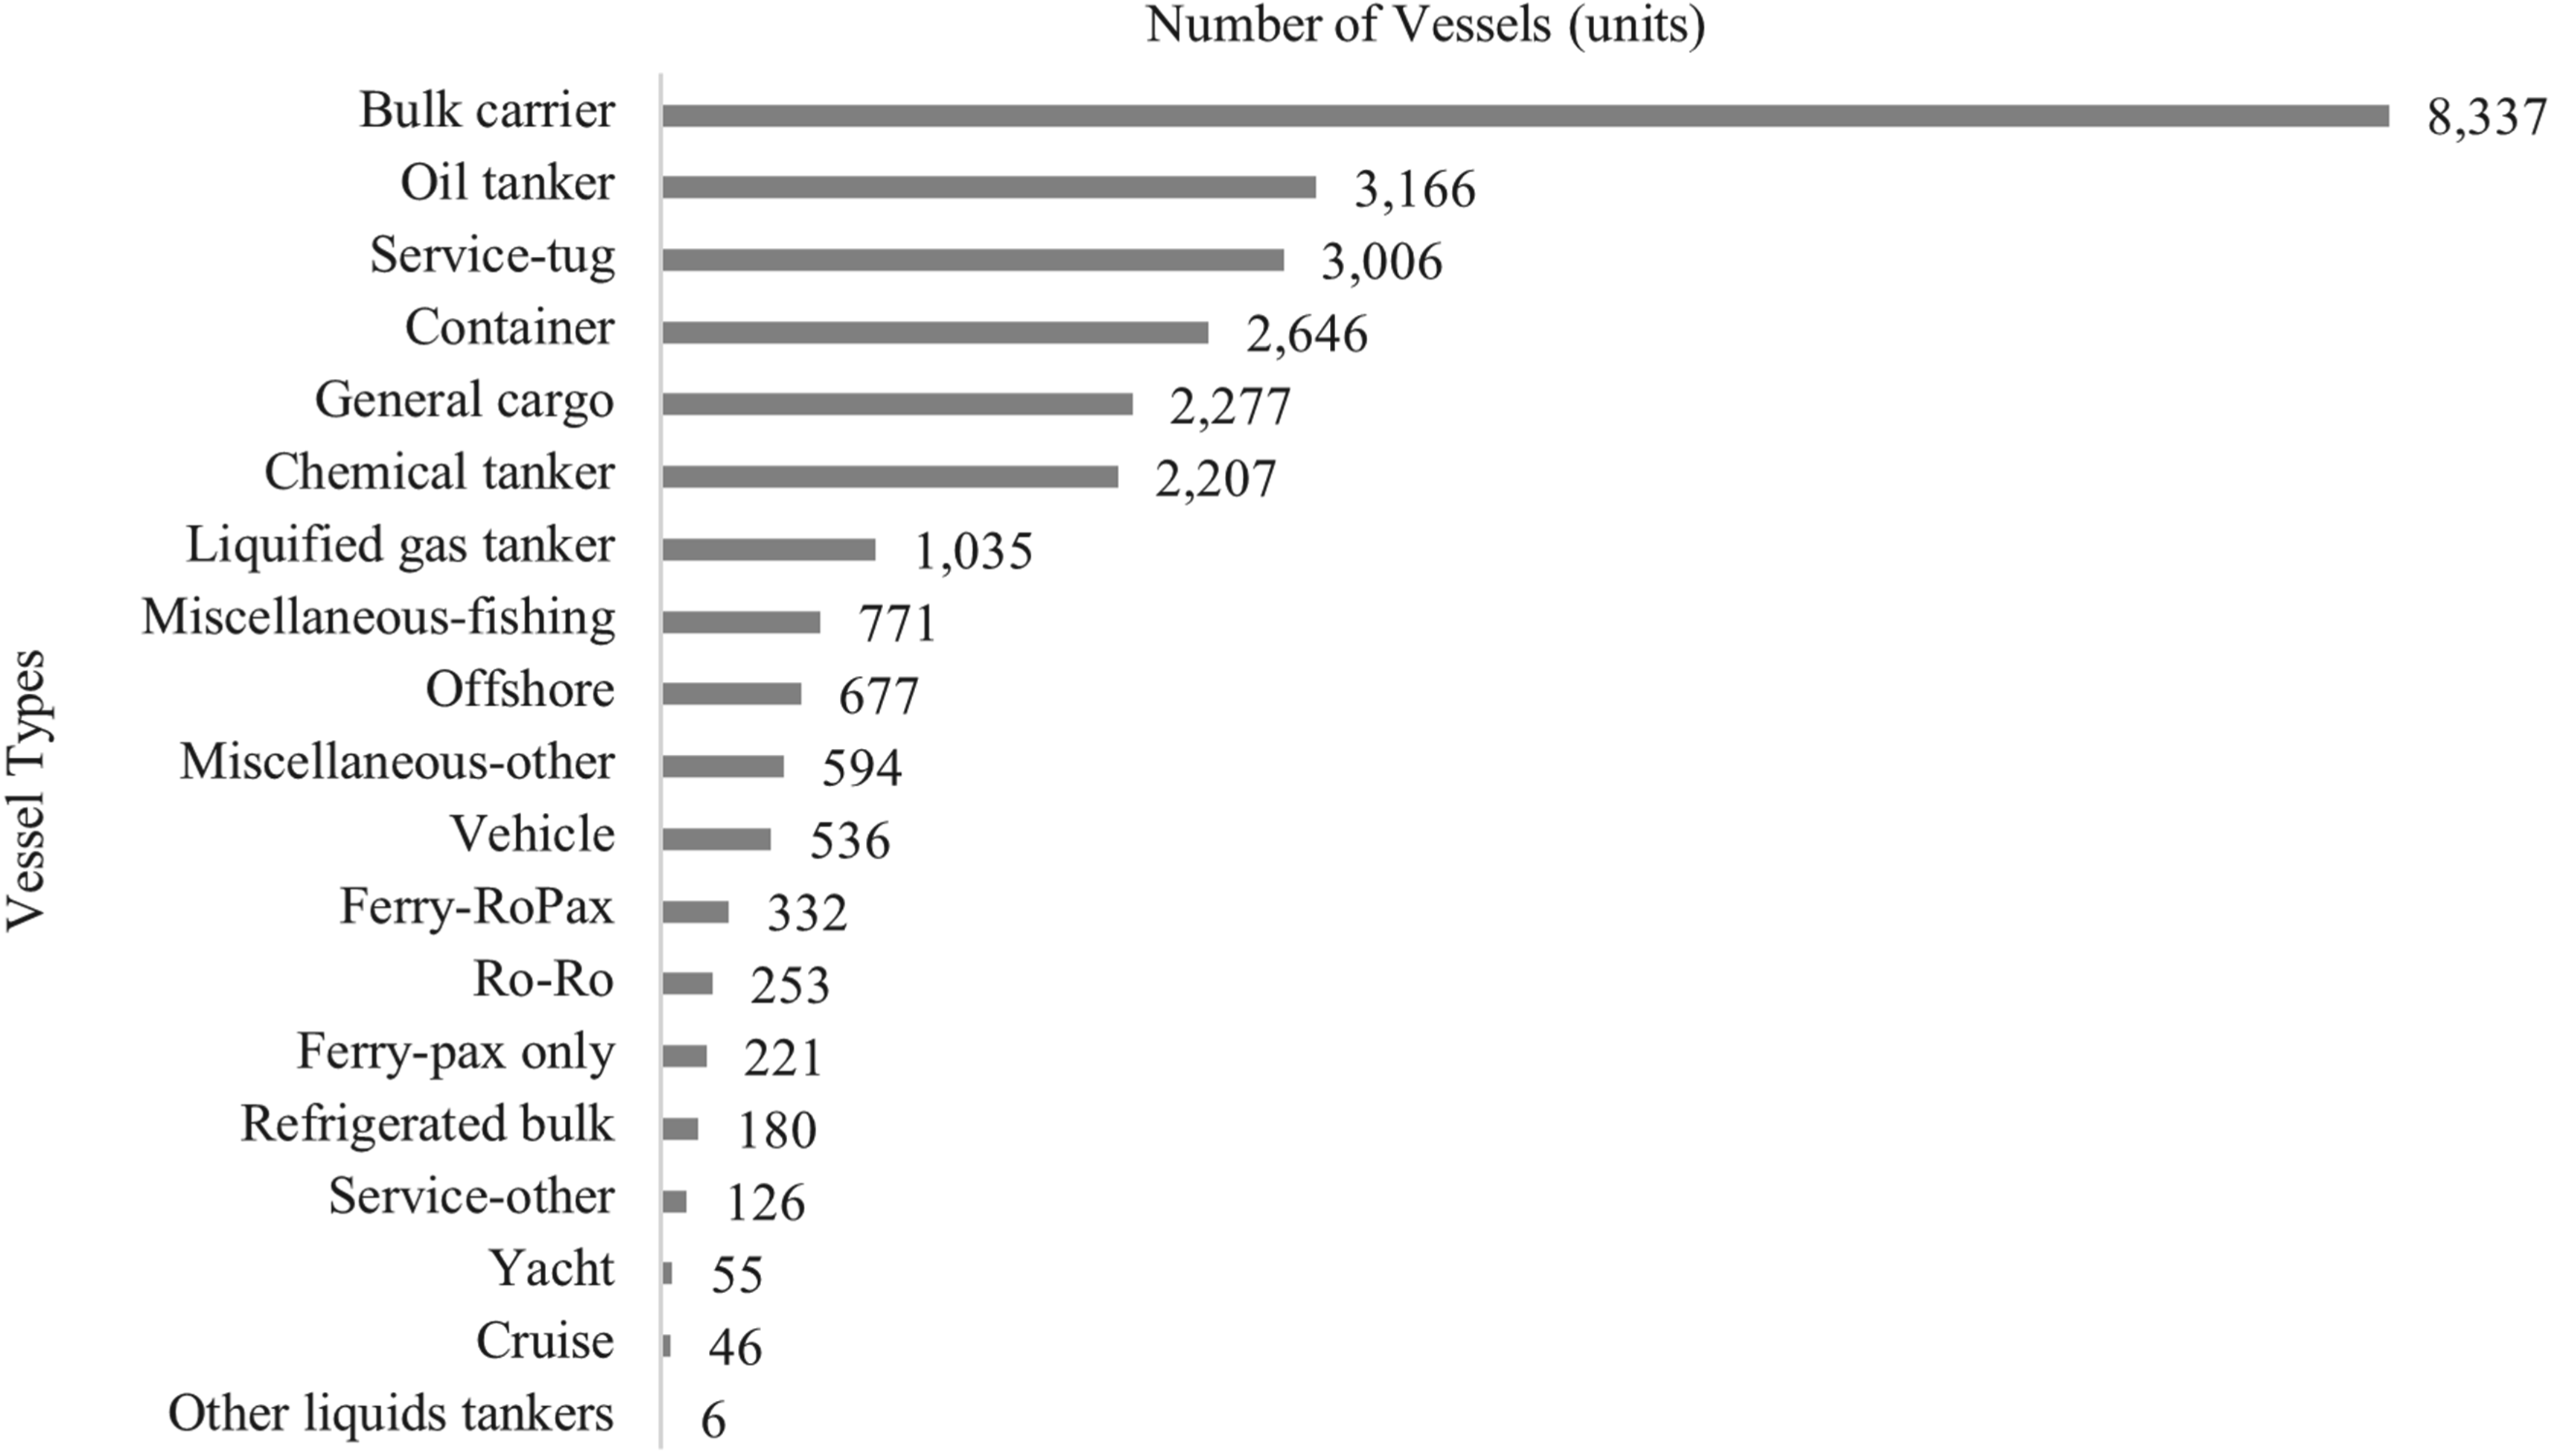
Number of ships (units) per ship type. The number of ships is represented by the count of unique IMO numbers in the AIS message dataset for each ship type.
The discrepancy between the AIS data and the Ministry's statistics could be due to several factors. Ships might not always transmit data accurately or comprehensively, or there may be delays in data reporting. The operational regions may also vary, with some fishing vessels operating outside the research area. Furthermore, some vessels may not comply with the AIS installation and activation requirements as mandated by regulations
In Indonesian waters, a wide variety of vessel types contribute to maritime traffic, each playing a vital role in the nation's economy and global trade. Among these, bulk carriers are the most common, serving as the primary means of transporting large volumes of raw materials such as coal, grain, and iron ore—underscoring Indonesia's prominent position in the global commodities market. Oil tankers, another major category, are critical for the transport of crude oil and refined petroleum products, further emphasizing Indonesia's strategic importance in the global energy sector.
The type of fuel used by each vessel category has a significant impact on overall greenhouse gas (GHG) emissions from shipping activities, as shown in Figure 4. For instance, bulk carriers and oil tankers, which predominantly use Heavy Fuel Oil (HFO), contribute substantially more to carbon emissions compared to smaller vessels operating on Marine Diesel Oil (MDO). Understanding these variations is essential for accurately estimating total emissions from shipping activities in Indonesian waters and for identifying opportunities to mitigate the maritime sector's environmental impact.
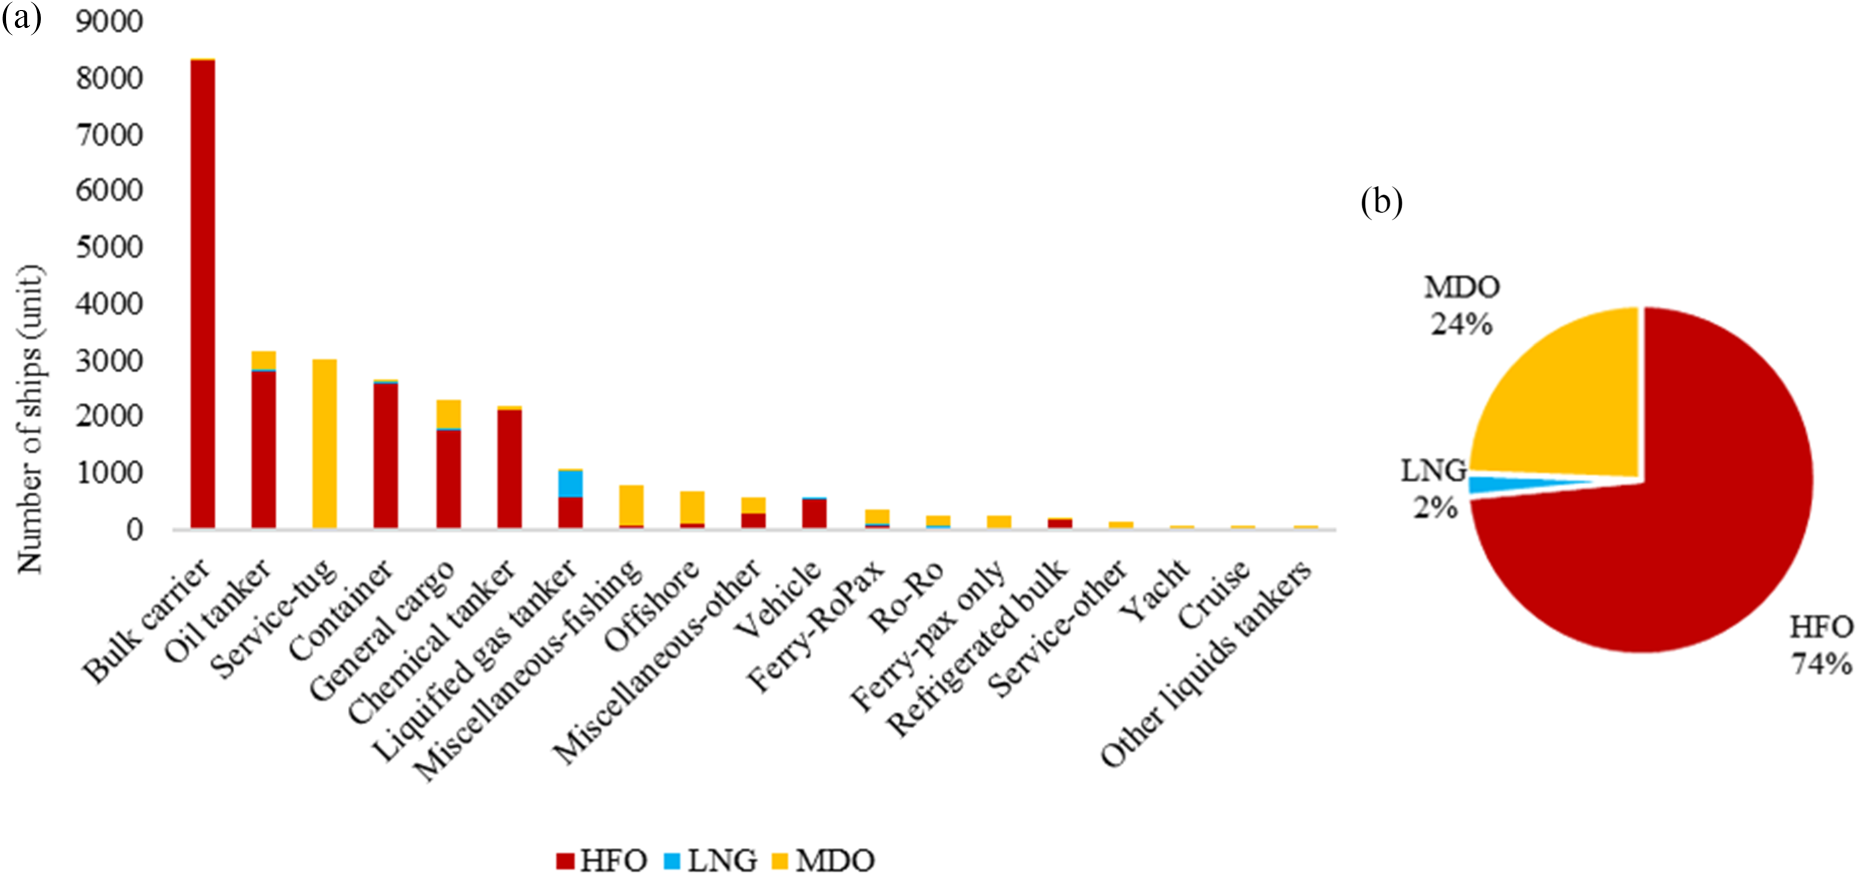
Distribution of fuel types (HFO, LNG, and MDO) from the perspective of AIS data. (a) Shows the distribution of fuel types used by different ship types. (b) Displays the percentage of each fuel type used by ships operating in Indonesian waters.
In Indonesian waters, most ships continue to rely heavily on conventional fuels, with HFO remaining the dominant choice for approximately 74% of vessels. This preference is especially common among larger vessel types—such as bulk carriers, oil tankers, and general cargo ships—which often prioritize operational cost savings over environmental considerations. Marine Diesel Oil (MDO) accounts for around 24% of the fuel consumed by ships in Indonesia. Being a more refined and cleaner-burning fuel than HFO, MDO is typically used by smaller vessels or those operating in regions subject to stricter emission regulations. Although MDO produces less CO2 and fewer air pollutants than HFO, it still represents a considerable source of GHG emissions within the maritime sector.
In contrast, Liquefied Natural Gas (LNG) is regarded as a more environmentally friendly alternative due to its lower carbon content and reduced emissions of sulfur oxides (SOx) and particulate matter. However, only about 2% of vessels in Indonesia currently use LNG. The limited adoption of LNG is primarily attributed to its high initial investment costs and the limited number of initiatives promoting its use for GHG reduction. 36 Although some small vessels and LNG carriers already utilize gas-based fuels, broader adoption will require substantial efforts.
The fuel-type analysis highlights a critical trade-off in the maritime energy transition. While liquefied natural gas (LNG) significantly reduces CO2 and N2O emissions compared to conventional fuels, LNG-fueled vessels dominate methane (CH4) emissions, largely due to methane slip during combustion and handling. This finding challenges the perception of LNG as a universally clean transitional fuel.
Furthermore, LNG is widely considered a viable and cost-effective low-carbon energy source. However, its potential for methane (CH4) leakage—whose warming potential is 20 to 30 times greater than that of CO2—should not be overlooked. 44 The contrasting emission profiles associated with different fuels indicate the importance of carefully assessing transition pathways, including LNG and other emerging low- or zero-carbon fuels, in relation to their full greenhouse gas impacts. While LNG is often discussed as a lower-carbon alternative fuel, its broader implications—particularly related to methane emissions—suggest that any expansion should be evaluated alongside alternative decarbonization pathways. The slow uptake of LNG reflects broader structural challenges within the maritime industry, including economic limitations, insufficient infrastructure, and weak regulatory enforcement.
This continued reliance on conventional, carbon-intensive fuels highlights the relevance of targeted policy discussions, including potential investment in alternative fuel infrastructure and incentive-based approaches to encourage emission reductions in the shipping sector.
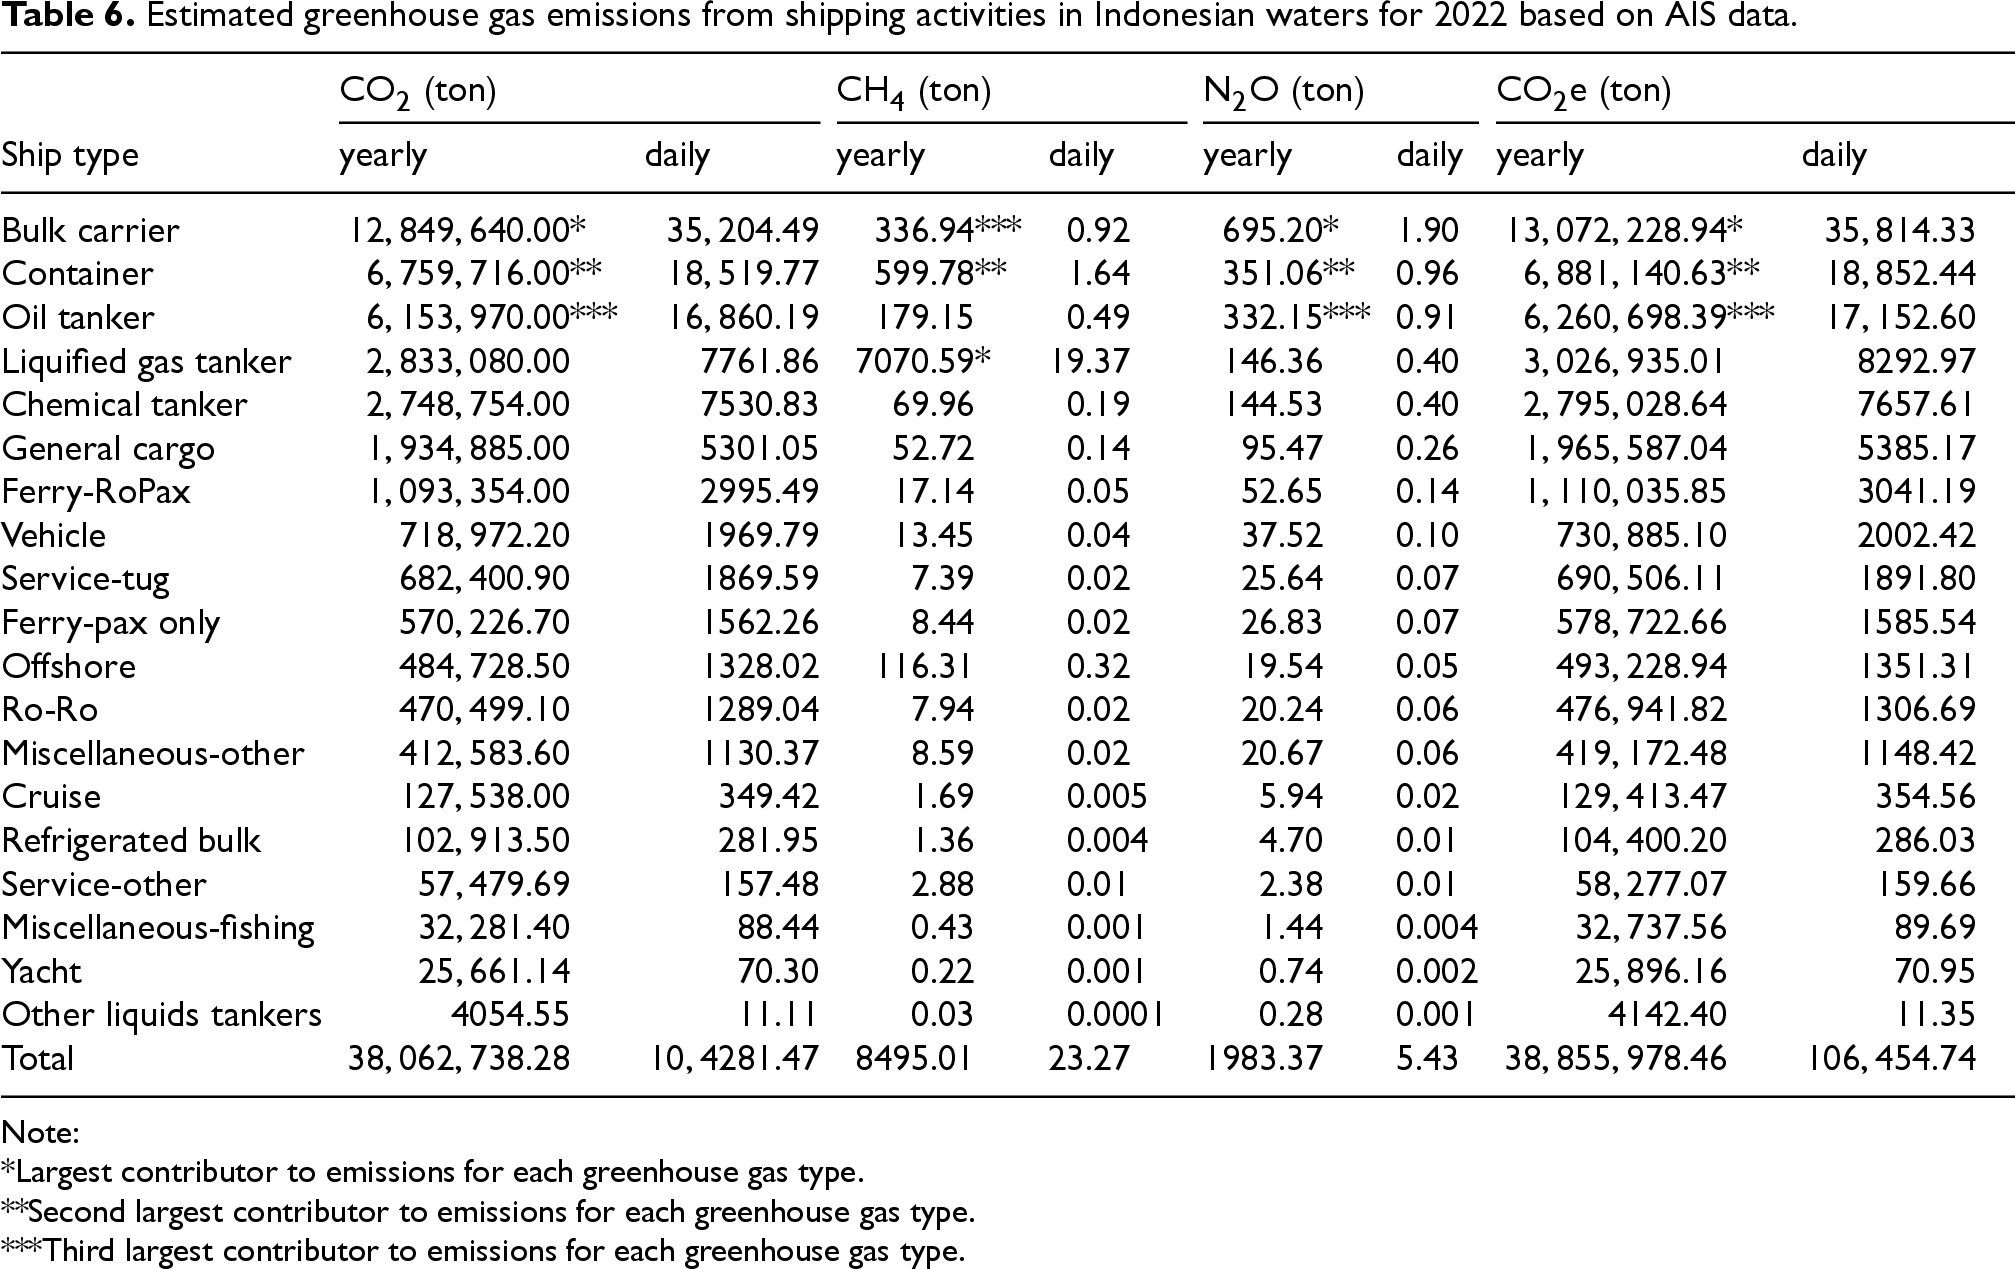
Table 6 illustrates the estimated greenhouse gas (GHG) emissions from various ship types operating in Indonesian waters during 2022. The results indicate that bulk carriers, container ships, and oil tankers are the largest contributors to CO2 emissions, with bulk carriers alone accounting for over 12.8 million tons of CO2 annually. These emissions, combined with significant contributions from container ships and oil tankers, highlight the dominant role that large commercial vessels play in maritime emissions.
Estimated greenhouse gas emissions from shipping activities in Indonesian waters for 2022 based on AIS data.
Estimated greenhouse gas emissions from shipping activities in Indonesian waters for 2022 based on AIS data.
Note:
*Largest contributor to emissions for each greenhouse gas type.
**Second largest contributor to emissions for each greenhouse gas type.
***Third largest contributor to emissions for each greenhouse gas type.
The high levels of CO2e (CO2 equivalent) emissions underscore the urgency of addressing the environmental impact of shipping, particularly given the global push towards decarbonization. The reliance on traditional fuel types, such as heavy fuel oil (HFO) and marine diesel oil (MDO), prevalent in these vessel categories, significantly contributes to these high emission levels. Despite the increasing awareness of climate change and the pressing need to reduce emissions, the shipping industry in Indonesia continues to depend heavily on these carbon-intensive fuels.
Table 6 also reveals that liquefied gas tankers are the predominant contributors to CH4 emissions, accounting for 93.59% of the total CH4 emissions, even though their overall CO2 and N2O contributions are relatively lower. This highlights the complex nature of GHG emissions in the maritime sector, where different fuel types lead to varying levels of GHGs. While specialized vessels, such as chemical tankers and other liquid tankers, contribute relatively minor amounts of GHG emissions in terms of CO2 and N2O, their impact on CH4 emissions is notably higher.
The total estimated GHG emissions from all ship types in 2022 amount to approximately 38.86 million tons of CO2e, reflecting the substantial contribution of shipping activities to Indonesia's overall carbon footprint. This data underscores the need for more aggressive measures to transition towards cleaner fuels and technologies in the maritime sector, aligning with global efforts to mitigate climate change and reduce GHG emissions.
Figure 5 shows that the variations in greenhouse gas (GHG) emissions based on fuel type and engine type reflect their respective combustion characteristics and efficiencies. Heavy Fuel Oil (HFO), the most carbon-intensive, accounts for 86.12% of CO2 and 87.37% of N2O emissions, due to its high carbon content and inefficient combustion processes. CO2 emissions remain high due to the continued use of Heavy Fuel Oil (HFO). 36 Conversely, Marine Diesel Oil (MDO) contributes 12% of CO2 and N2O emissions, as it is slightly cleaner but still substantial in GHG output. Liquefied Natural Gas (LNG), being the cleanest fuel, results in only around 4% of CO2 and N2O emissions and a significant 93.59% in methane (CH4) emissions, highlighting its lower carbon and virtually non-existent particulate emissions.
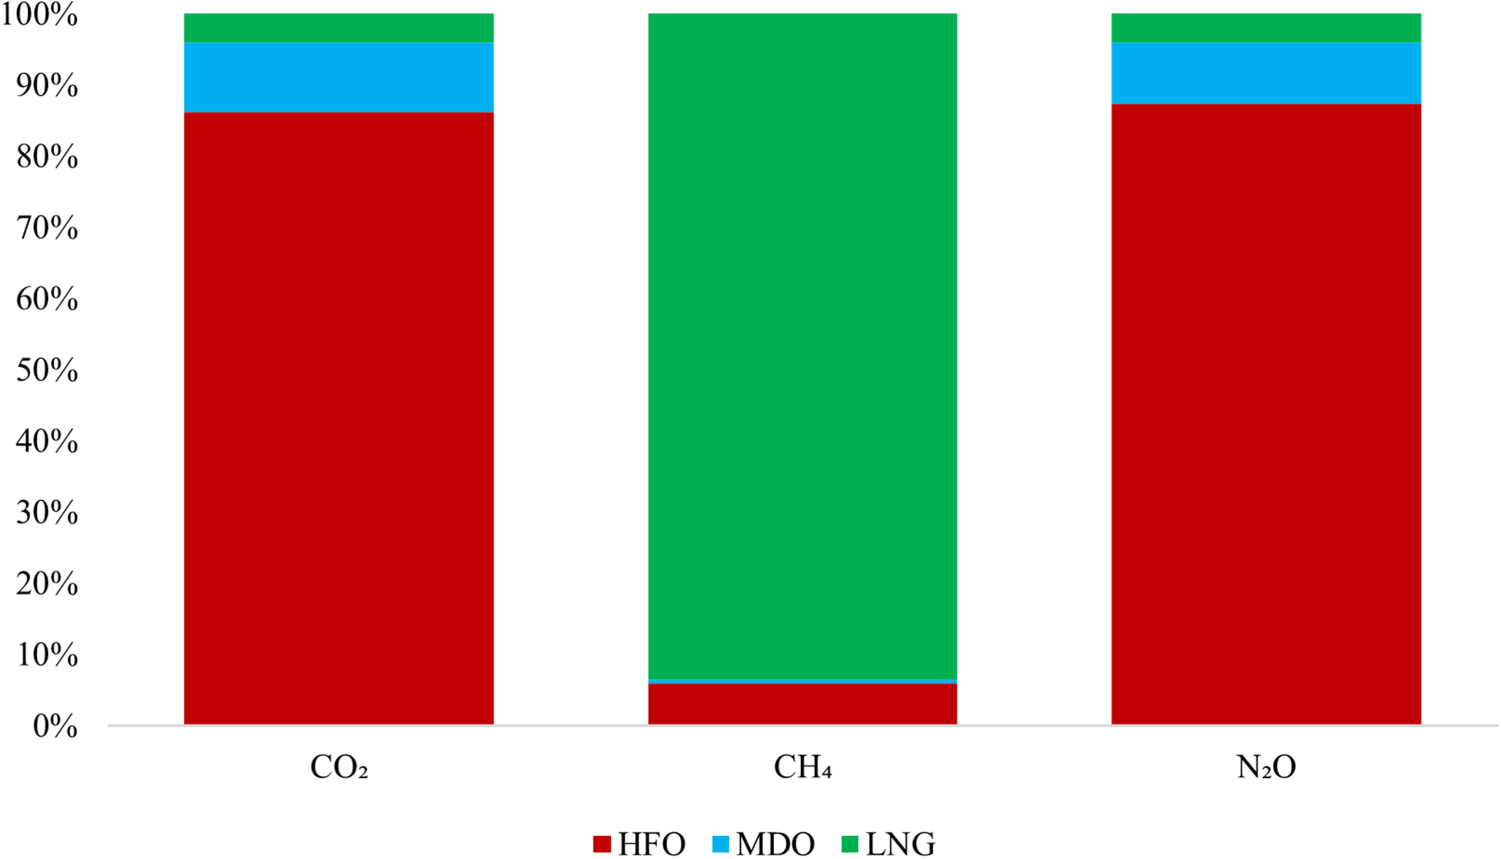
Contribution of different fuel types to greenhouse gas emissions resulting from shipping activities.
These emission patterns emphasize the impact of both fuel type and engine technology on the environmental footprint of maritime operations, with a clear trend towards lower emissions with the adoption of cleaner fuels and advanced engine technologies.
When integrated with detailed information on vessel engine specifications and fuel types, AIS data enables accurate attribution of emissions to either the ship's flag state or the national waters where the emissions occur. Figure 6 illustrates the concentration of greenhouse gas (GHG) emissions across Indonesian waters in 2022, with a clear color gradient from green to red indicating the range of emission levels, from low to high. The red regions, which represent the highest concentrations of GHG emissions, are predominantly aligned with the major shipping lanes. This pattern is consistent across all three types of emissions—CO2, CH4, and N2O—highlighting the significant role that maritime traffic plays in contributing to GHG emissions in these areas.
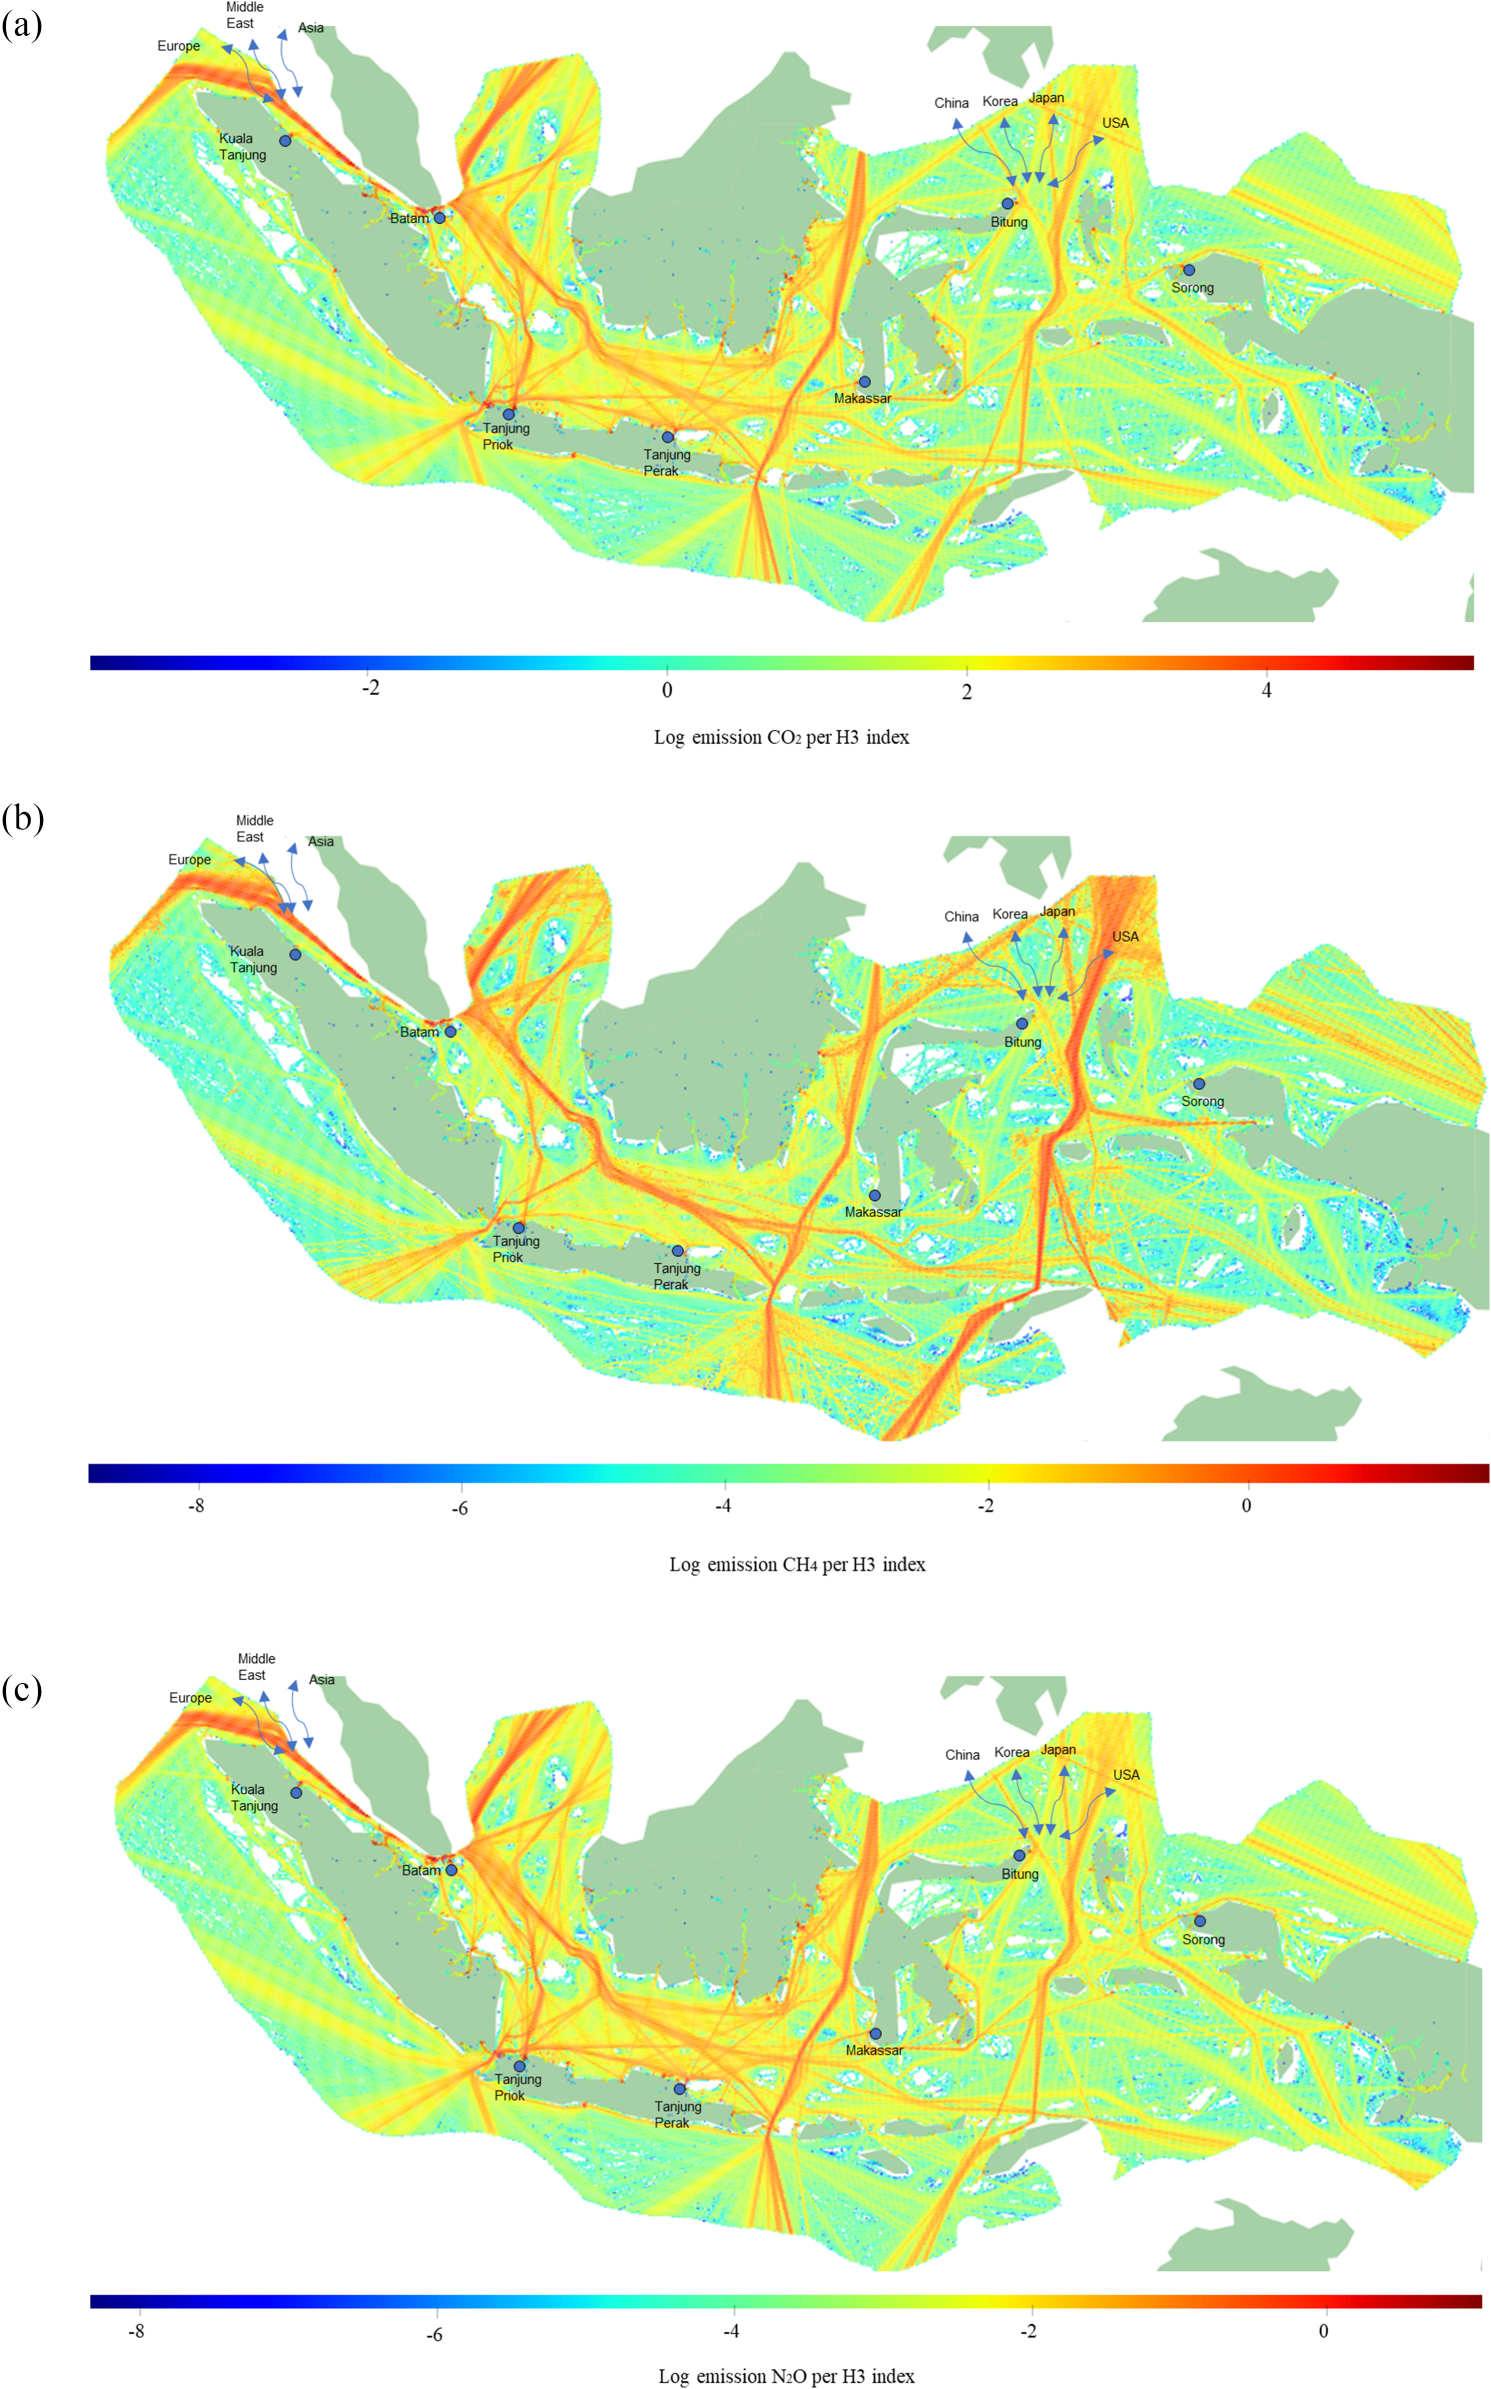
Map of greenhouse gas emission concentrations along shipping lanes in Indonesia. (a) CO2; (b) CH4; (c) N2O. The map is created using H3 index resolution 6, with emission data transformed logarithmically to represent concentrations.
The Strait of Malacca, particularly the route leading to and from Port Batam, is a notable area of high traffic density and concentrated GHG emissions. This strait is one of the busiest maritime chokepoints globally, serving as the primary passage for vessels traveling between Europe, the Middle East, and East Asia.4,5 Its strategic importance for global trade, coupled with the proximity to major industrial hubs in Southeast Asia, makes it a hotspot for maritime traffic and, consequently, GHG emissions. The high concentration of emissions in this area underscores the significant environmental impact of shipping activities that use this route.
Both CO2 and N2O emissions exhibit similar patterns in terms of contributing vessel types, fuel types, and shipping routes. These emissions are primarily driven by large cargo ships and container vessels, which commonly burn heavy fuel oil—a significant source of these pollutants. The routes taken by these vessels, which often involve long-haul international trade, contribute to the uniformity in the spatial distribution of CO2 and N2O emissions.
In contrast, CH4 emissions display a different pattern, predominantly associated with tanker traffic. These tankers, which often transport oil and liquefied natural gas (LNG), tend to use LNG as fuel, explaining the higher CH4 emissions. The data shows a considerable amount of this traffic is directed towards the northern routes, correlating with major oil and gas export destinations in East Asia, such as China, Japan, and South Korea.45,46 This suggests that while CO2 and N2O emissions are largely driven by general cargo and container shipping, CH4 emissions are more closely linked to the global energy trade, particularly oil and LNG exports.
The current trends indicate that the busiest maritime routes, which are critical for global trade, are also the most significant contributors to GHG emissions in Indonesian waters. This reflects the broader global challenge of balancing economic growth, particularly in maritime trade, with environmental sustainability. Notably, the use of cleaner fuels, such as Liquefied Natural Gas (LNG), remains minimal in Indonesia, as evidenced by AIS data. Instead, Heavy Fuel Oil (HFO) and Marine Diesel Oil (MDO) continue to dominate as the primary fuels for shipping. The reliance on these higher-emission fuels exacerbates the environmental impact of maritime traffic, contributing to elevated levels of CO2, N2O, and other pollutants. As global trade is expected to increase, especially with the ongoing expansion of maritime infrastructure in Indonesia, these emission hotspots may intensify if not properly managed. There is an urgent need to implement more sustainable shipping practices, such as adopting cleaner fuels, optimizing ship routes to minimize fuel consumption, and integrating more advanced technologies for emission control.
From a policy perspective, the findings demonstrate how AIS-based monitoring can support evidence-informed discussions on emission management, including the evaluation of regulatory and technological options within high-traffic maritime corridors. In the longer term, the spatially explicit emission patterns identified in this study may inform discussions on green port initiatives, low-emission shipping corridors, and international cooperation on maritime emission standards. The potential role of LNG in reducing certain emission components suggests that its adoption warrants careful consideration within broader maritime decarbonization strategies.
Several locations were selected for spatial benchmarking to evaluate the plausibility of AIS-based emission estimates. These locations correspond to maritime areas where greenhouse gas emissions approximated using AIS data exhibit relatively high concentrations compared to surrounding waters.
For methane (CH4) evaluation, the Strait of Malacca was selected as a primary benchmark area, given its role as one of the world's busiest shipping corridors and its identification as a major emission hotspot in the AIS-based analysis. As shown in Figure 7, satellite observations from Sentinel-5P (TROPOMI) indicate elevated atmospheric concentrations over the Strait of Malacca, which is consistent with the spatial concentration of CH4 emissions derived from AIS data. This spatial correspondence provides independent qualitative validation of the AIS-based hotspot identification.
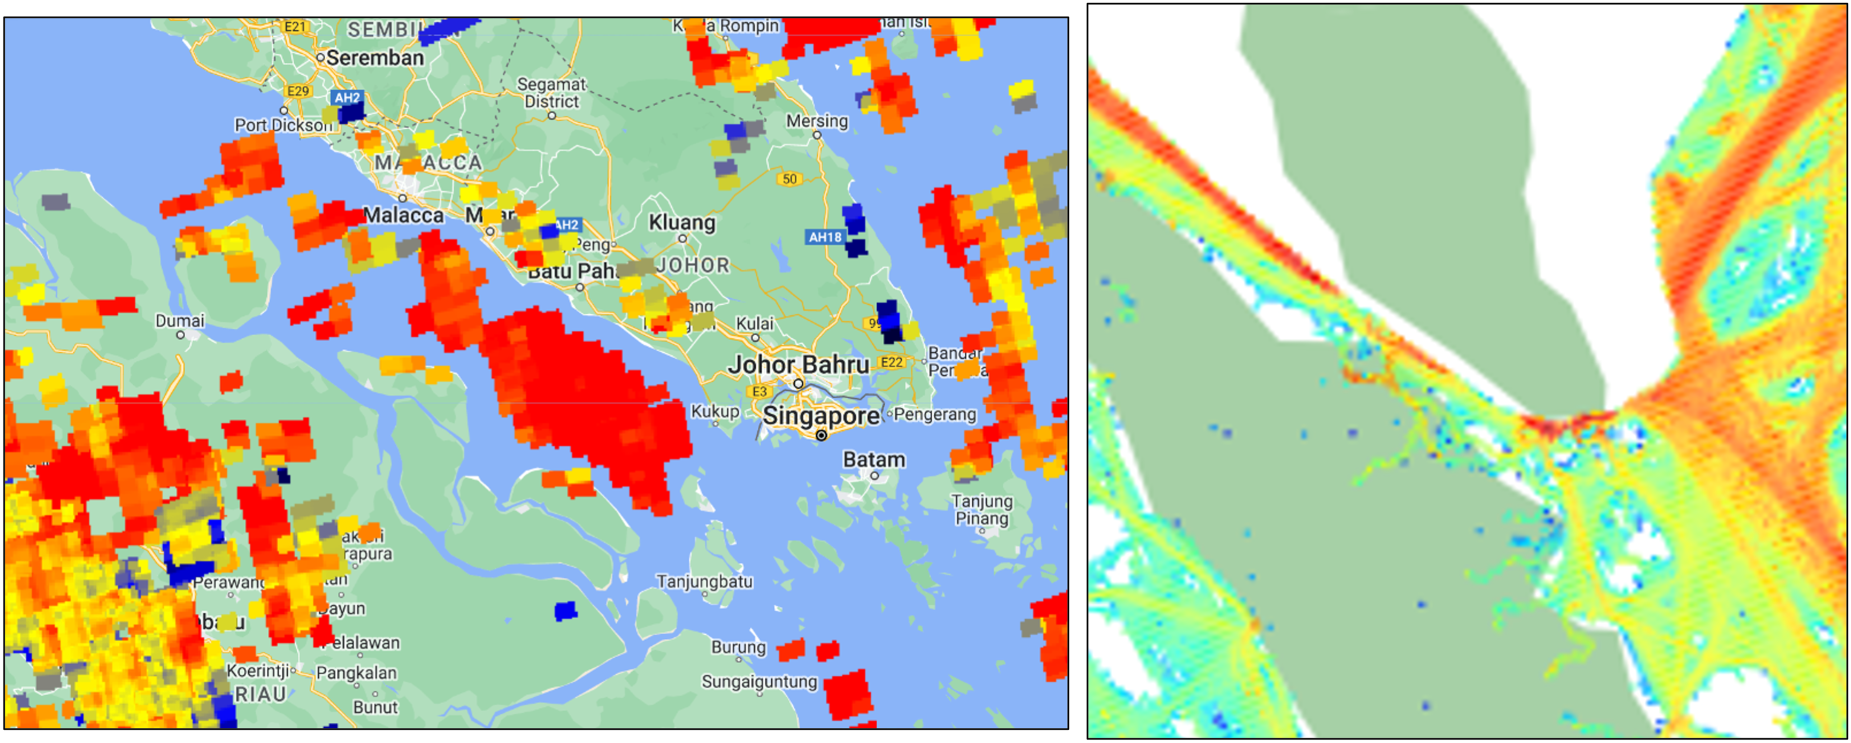
CH4 shipping emission around Malacca Strait using remote sensing (left), AIS (right).
A second evaluation was conducted in the Savu Sea, near the maritime boundary with Timor-Leste (Figure 8). Satellite-based annual average observations from Sentinel-5P do not indicate this region as a dominant atmospheric concentration hotspot. In contrast, AIS-based estimates identify the Savu Sea as a major shipping route with substantial contributions to CH4 emissions. This apparent discrepancy reflects fundamental differences between AIS-based emission estimation and satellite-based atmospheric observations.
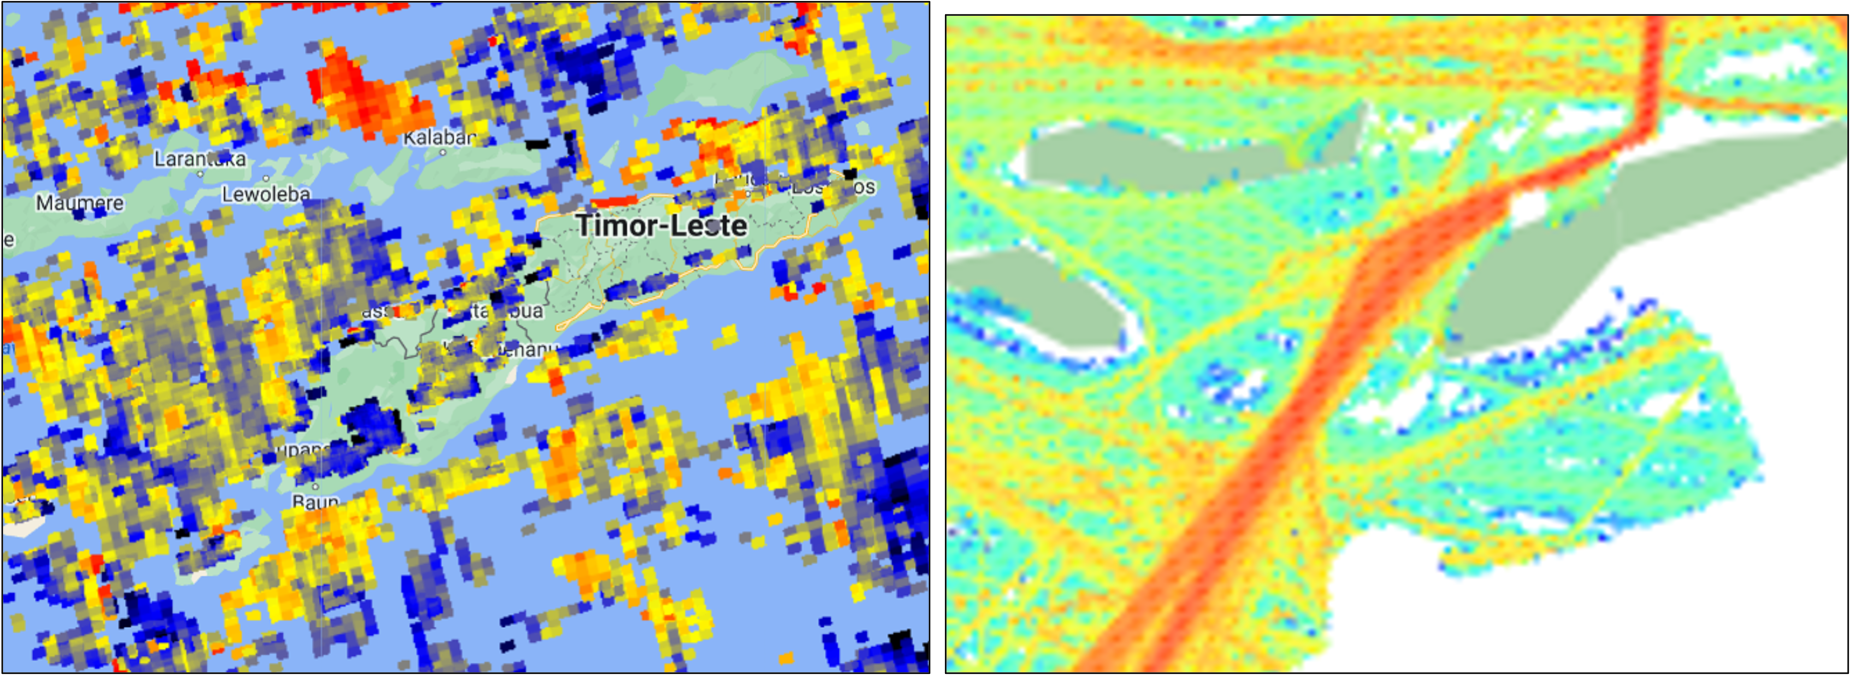
CH4 shipping emission around Savu Sea using remote sensing (left), AIS (right).
This study focuses on approximating greenhouse gas emissions originating specifically from shipping activities. Consequently, the AIS-derived visualizations (Figure 6) represent shipping corridors that contribute most significantly to maritime emissions, rather than resulting atmospheric concentration patterns. Satellite remote sensing, while valuable for large-scale atmospheric monitoring, cannot distinguish emission sources and integrates signals from multiple sectors and transport processes.
Differences between AIS-based emission hotspots and satellite-based atmospheric patterns are therefore expected and arise from variations in spatial resolution, detection sensitivity, and the ability to attribute emissions to specific sources. Moreover, satellite observations are influenced by atmospheric transport, meteorological conditions, and chemical transformation processes, which are not explicitly modeled in this study. Within these methodological constraints, the observed spatial consistency in high-traffic corridors—particularly in the Strait of Malacca—supports the credibility of AIS-based emission estimates as an independent, activity-based representation of maritime emissions.
The emission estimates presented in this study are subject to several sources of uncertainty inherent to AIS-based bottom-up methodologies. These uncertainties primarily arise from the use of assumed parameters, including global-average emission factors, simplified engine load approximations, baseline specific fuel consumption (
Discussion and conclusion
The findings of this study demonstrate that Automatic Identification System (AIS) data holds substantial potential as a source for developing greenhouse gas (GHG) emission statistics from shipping activities. The utilization of AIS data enables the construction of an emission inventory that specifically captures emissions generated by maritime transport. Through a comprehensive preprocessing stage—developed in consultation with various stakeholders—the initial dataset of 369,291,291 AIS records was refined to 181,581,085 valid records. This indicates that approximately 49.17% of the raw AIS data were deemed suitable for analysis, highlighting the importance of data quality control in big data applications.
Using the bottom-up approach recommended by the International Maritime Organization (IMO), the analysis estimated a total of 38.86 million tons of GHG emissions generated from shipping activities in Indonesian waters in 2022. These emissions were further examined based on ship type, fuel type, and their spatial distribution across Indonesia's maritime zones—an advantage made possible by big data analytics, which conventional inventory methods cannot provide.
The results reveal that bulk carriers were the dominant contributors to CO2 and N2O emissions, while liquefied gas tankers were the largest emitters of CH4. In terms of fuel use, information from IHS Markit indicates that Heavy Fuel Oil (HFO) accounted for the highest emissions of CO2 and N2O, whereas Liquefied Natural Gas (LNG) contributed most significantly to CH4 emissions. These patterns are consistent with global findings, given the high carbon intensity of HFO and the methane leakage potential associated with LNG use.
At present, there are no national or international datasets that can serve as direct benchmarks for validating these emission estimates. Nevertheless, the statistical patterns observed in this study are consistent and explainable. Preliminary discussions with the Asian Development Bank (ADB), which is conducting similar research, indicate that comparable spatial and numerical trends have been identified. This correspondence supports the plausibility of the emission patterns derived from AIS-based analysis.
A key strength of using AIS data lies in its spatial and temporal granularity, which allows for emission statistics to be linked directly to vessel trajectories and specific maritime routes. Such dynamic, space–time analyses are not available in any existing emission statistics in Indonesia. Although comparative datasets remain limited, the estimated emission concentrations from AIS data align with the distribution of major Indonesian shipping routes, reinforcing the internal consistency of the results.
Beyond research value, the use of AIS data provides actionable insights for policy formulation and enforcement. Real-time monitoring of vessel activity and emissions can support the implementation of environmental regulations and facilitate compliance with maritime emission standards. Policymakers can leverage this data-driven approach to design more responsive and adaptive maritime policies, thereby promoting sustainability and accountability within the shipping sector. This study thus establishes an empirical foundation for future research that utilizes AIS data as an estimator of maritime GHG emissions in Indonesia.
However, several limitations must be acknowledged. First, AIS coverage excludes smaller vessels that are not required to carry AIS transponders, which may lead to an underestimation of emissions, particularly from domestic and small-scale fishing operations. Second, this study relied on IHS Markit ship registry data to match vessel characteristics; any discrepancies or missing entries in this dataset could influence the accuracy of emission estimates. Third, the emission factors used follow global averages, which may not fully reflect Indonesia's specific maritime conditions, such as variations in fuel quality and engine performance.
Despite these limitations, AIS data have proven capable of providing a comprehensive overview of emissions generated by shipping activities. To fully maximize its potential, further methodological advancements are necessary, including improved data preprocessing techniques, the integration of complementary datasets, and the development of validation frameworks. Such efforts are essential to enhance the reliability and institutional acceptance of AIS-based emission statistics—ultimately supporting their use as official statistics for maritime environmental monitoring in Indonesia.
Footnotes
Acknowledgements
We gratefully acknowledge the financial support from Politeknik Statistika STIS and BPS Statistics Indonesia. We also thank to the UNSD AIS Task Team for their invaluable technical guidance, insightful suggestions, and intellectual support throughout the course of this research. Finally, the AIS data that underpins this study was provided by the United Nations Global Platform (UNGP) developed by the UN Committee of Experts on Big Data and Data Science for Official Statistics (UN-CEBD), and is greatly appreciated.
Author contributions: credit
Funding
The authors received no financial support for the research, authorship, and/or publication of this article.
Declaration of competing interest
The authors declared no potential conflicts of interest with respect to the research, authorship, and/or publication of this article.
Data availability
The datasets analyzed during this study are available from the United Nations Global Platform. Data used in this study are subject to restrictions and may require permissions or registration.